East Millstone, NJ Map & Demographics
East Millstone Map
East Millstone Overview
$152,756
PER CAPITA INCOME
$250,001
AVG FAMILY INCOME
0.50
INEQUALITY / GINI INDEX
541
TOTAL POPULATION
278
MALE POPULATION
263
FEMALE POPULATION
105.70
MALES / 100 FEMALES
94.60
FEMALES / 100 MALES
31.8
MEDIAN AGE
3.4
AVG FAMILY SIZE
2.8
AVG HOUSEHOLD SIZE
358
LABOR FORCE [ PEOPLE ]
91.6%
PERCENT IN LABOR FORCE
East Millstone Area Codes
Income in East Millstone
Income Overview in East Millstone
| Characteristic | Number | Measure |
| Per Capita Income | 541 | $152,756 |
| Median Family Income | 147 | $250,001 |
| Mean Family Income | 147 | $537,356 |
| Median Household Income | 193 | $0 |
| Mean Household Income | 193 | $423,452 |
| Income Deficit | 147 | $0 |
| Wage / Income Gap (%) | 541 | 0.00% |
| Wage / Income Gap ($) | 541 | 100.00¢ per $1 |
| Gini / Inequality Index | 541 | 0.50 |
Earnings by Sex in East Millstone
| Sex | Number | Average Earnings |
| Male | 210 (58.7%) | $0 |
| Female | 148 (41.3%) | $0 |
| Total | 358 (100.0%) | $0 |
Earnings by Sex by Income Bracket in East Millstone
The most common earnings brackets in East Millstone are $100,000+ for men (94 | 44.8%) and $100,000+ for women (55 | 37.2%).
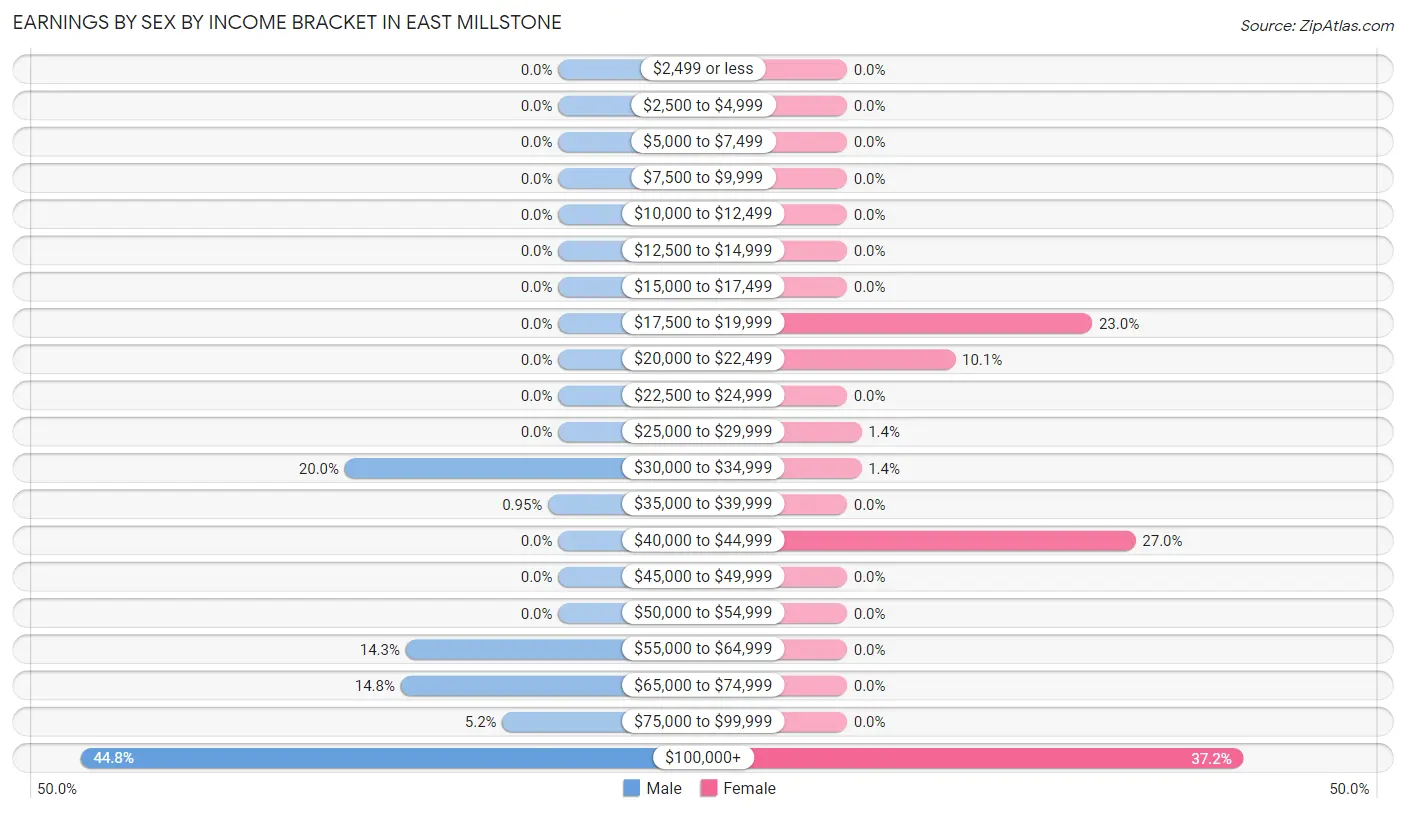
| Income | Male | Female |
| $2,499 or less | 0 (0.0%) | 0 (0.0%) |
| $2,500 to $4,999 | 0 (0.0%) | 0 (0.0%) |
| $5,000 to $7,499 | 0 (0.0%) | 0 (0.0%) |
| $7,500 to $9,999 | 0 (0.0%) | 0 (0.0%) |
| $10,000 to $12,499 | 0 (0.0%) | 0 (0.0%) |
| $12,500 to $14,999 | 0 (0.0%) | 0 (0.0%) |
| $15,000 to $17,499 | 0 (0.0%) | 0 (0.0%) |
| $17,500 to $19,999 | 0 (0.0%) | 34 (23.0%) |
| $20,000 to $22,499 | 0 (0.0%) | 15 (10.1%) |
| $22,500 to $24,999 | 0 (0.0%) | 0 (0.0%) |
| $25,000 to $29,999 | 0 (0.0%) | 2 (1.3%) |
| $30,000 to $34,999 | 42 (20.0%) | 2 (1.3%) |
| $35,000 to $39,999 | 2 (0.9%) | 0 (0.0%) |
| $40,000 to $44,999 | 0 (0.0%) | 40 (27.0%) |
| $45,000 to $49,999 | 0 (0.0%) | 0 (0.0%) |
| $50,000 to $54,999 | 0 (0.0%) | 0 (0.0%) |
| $55,000 to $64,999 | 30 (14.3%) | 0 (0.0%) |
| $65,000 to $74,999 | 31 (14.8%) | 0 (0.0%) |
| $75,000 to $99,999 | 11 (5.2%) | 0 (0.0%) |
| $100,000+ | 94 (44.8%) | 55 (37.2%) |
| Total | 210 (100.0%) | 148 (100.0%) |
Earnings by Sex by Educational Attainment in East Millstone
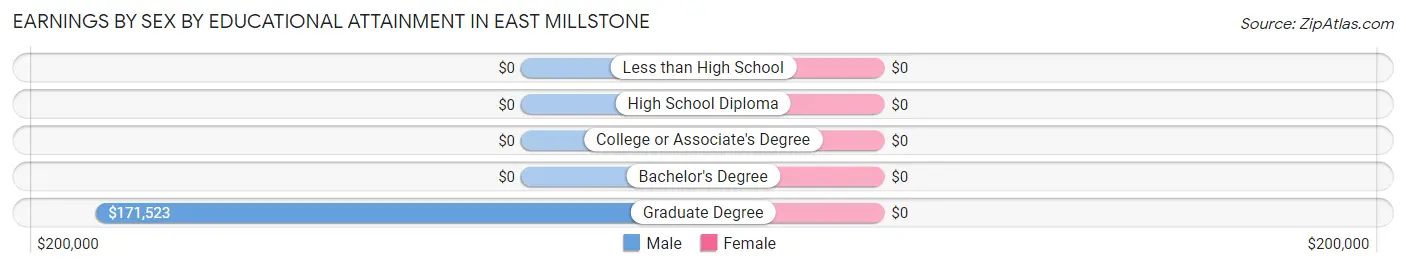
| Educational Attainment | Male Income | Female Income |
| Less than High School | - | - |
| High School Diploma | - | - |
| College or Associate's Degree | - | - |
| Bachelor's Degree | - | - |
| Graduate Degree | $171,523 | $0 |
| Total | - | - |
Family Income in East Millstone
Family Income Brackets in East Millstone
According to the East Millstone family income data, there are 94 families falling into the $200,000+ income range, which is the most common income bracket and makes up 63.9% of all families.
| Income Bracket | # Families | % Families |
| Less than $10,000 | 0 | 0.0% |
| $10,000 to $14,999 | 0 | 0.0% |
| $15,000 to $24,999 | 0 | 0.0% |
| $25,000 to $34,999 | 0 | 0.0% |
| $35,000 to $49,999 | 0 | 0.0% |
| $50,000 to $74,999 | 40 | 27.2% |
| $75,000 to $99,999 | 0 | 0.0% |
| $100,000 to $149,999 | 13 | 8.8% |
| $150,000 to $199,999 | 0 | 0.0% |
| $200,000+ | 94 | 63.9% |
Family Income by Famaliy Size in East Millstone
| Income Bracket | # Families | Median Income |
| 2-Person Families | 16 (10.9%) | $0 |
| 3-Person Families | 76 (51.7%) | $0 |
| 4-Person Families | 55 (37.4%) | $0 |
| 5-Person Families | 0 (0.0%) | $0 |
| 6-Person Families | 0 (0.0%) | $0 |
| 7+ Person Families | 0 (0.0%) | $0 |
| Total | 147 (100.0%) | $250,001 |
Family Income by Number of Earners in East Millstone
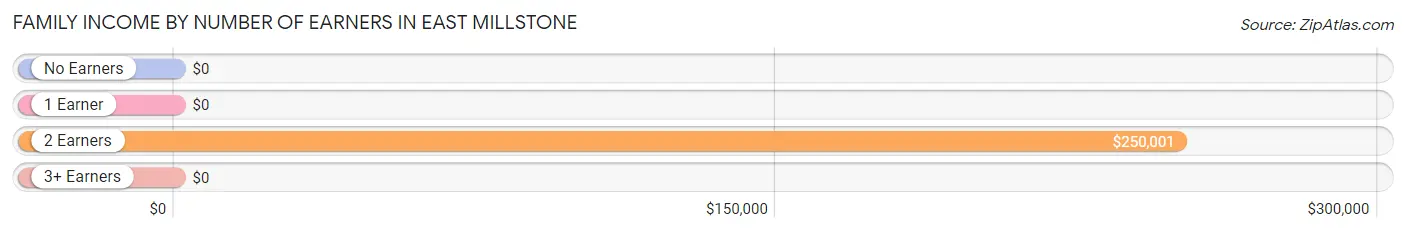
| Number of Earners | # Families | Median Income |
| No Earners | 0 (0.0%) | $0 |
| 1 Earner | 16 (10.9%) | $0 |
| 2 Earners | 108 (73.5%) | $250,001 |
| 3+ Earners | 23 (15.7%) | $0 |
| Total | 147 (100.0%) | $250,001 |
Household Income in East Millstone
Household Income Brackets in East Millstone
With 94 households falling in the category, the $200,000+ income range is the most frequent in East Millstone, accounting for 48.7% of all households.
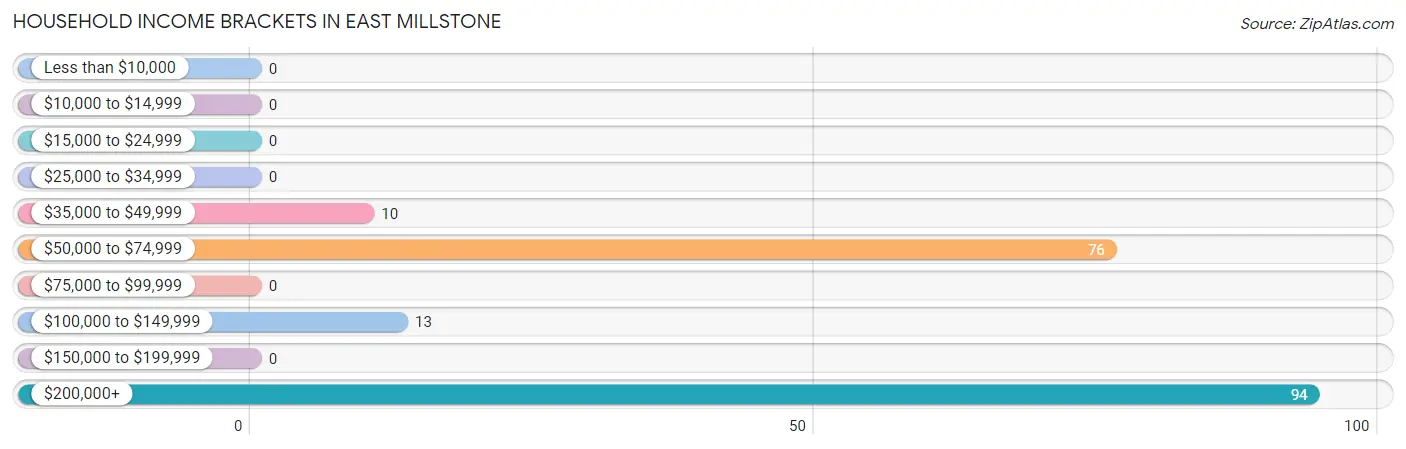
| Income Bracket | # Households | % Households |
| Less than $10,000 | 0 | 0.0% |
| $10,000 to $14,999 | 0 | 0.0% |
| $15,000 to $24,999 | 0 | 0.0% |
| $25,000 to $34,999 | 0 | 0.0% |
| $35,000 to $49,999 | 10 | 5.2% |
| $50,000 to $74,999 | 76 | 39.4% |
| $75,000 to $99,999 | 0 | 0.0% |
| $100,000 to $149,999 | 13 | 6.7% |
| $150,000 to $199,999 | 0 | 0.0% |
| $200,000+ | 94 | 48.7% |
Household Income by Householder Age in East Millstone
The median household income in East Millstone is $0, with the highest median household income of $250,001 found in the 45 to 64 years age bracket for the primary householder. A total of 127 households (65.8%) fall into this category.
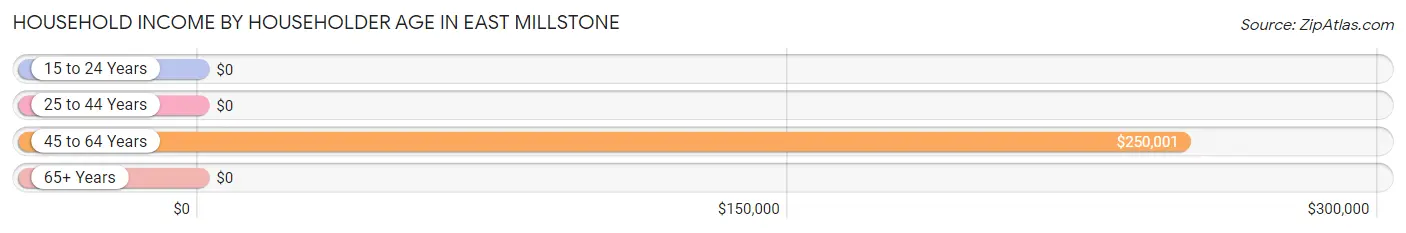
| Income Bracket | # Households | Median Income |
| 15 to 24 Years | 0 (0.0%) | $0 |
| 25 to 44 Years | 56 (29.0%) | $0 |
| 45 to 64 Years | 127 (65.8%) | $250,001 |
| 65+ Years | 10 (5.2%) | $0 |
| Total | 193 (100.0%) | $0 |
Poverty in East Millstone
Income Below Poverty by Sex and Age in East Millstone
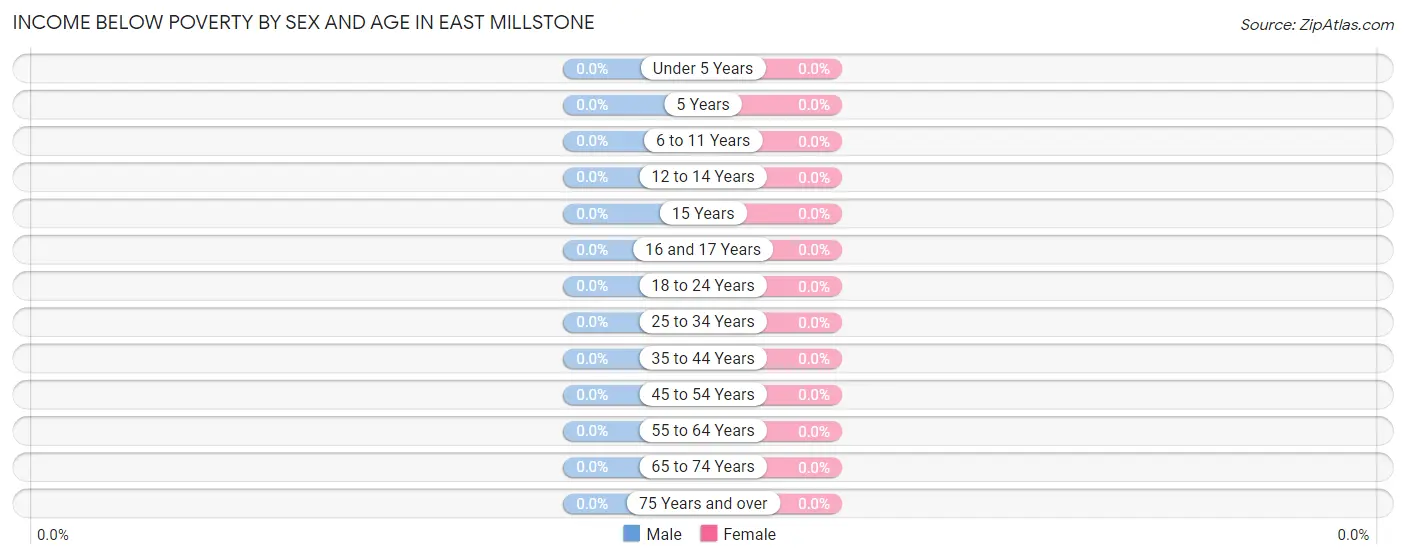
| Age Bracket | Male | Female |
| Under 5 Years | 0 (0.0%) | 0 (0.0%) |
| 5 Years | 0 (0.0%) | 0 (0.0%) |
| 6 to 11 Years | 0 (0.0%) | 0 (0.0%) |
| 12 to 14 Years | 0 (0.0%) | 0 (0.0%) |
| 15 Years | 0 (0.0%) | 0 (0.0%) |
| 16 and 17 Years | 0 (0.0%) | 0 (0.0%) |
| 18 to 24 Years | 0 (0.0%) | 0 (0.0%) |
| 25 to 34 Years | 0 (0.0%) | 0 (0.0%) |
| 35 to 44 Years | 0 (0.0%) | 0 (0.0%) |
| 45 to 54 Years | 0 (0.0%) | 0 (0.0%) |
| 55 to 64 Years | 0 (0.0%) | 0 (0.0%) |
| 65 to 74 Years | 0 (0.0%) | 0 (0.0%) |
| 75 Years and over | 0 (0.0%) | 0 (0.0%) |
| Total | 0 (0.0%) | 0 (0.0%) |
Income Above Poverty by Sex and Age in East Millstone
According to the poverty statistics in East Millstone, males aged 6 to 11 years and females aged under 5 years are the age groups that are most secure financially, with 100.0% of males and 100.0% of females in these age groups living above the poverty line.
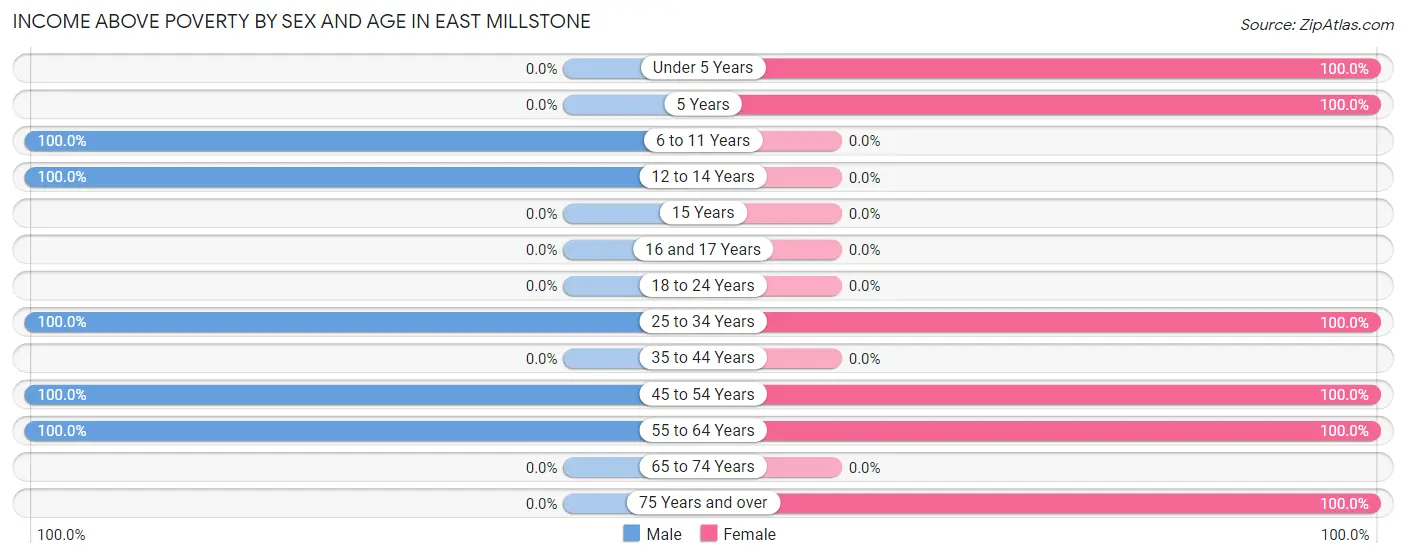
| Age Bracket | Male | Female |
| Under 5 Years | 0 (0.0%) | 34 (100.0%) |
| 5 Years | 0 (0.0%) | 54 (100.0%) |
| 6 to 11 Years | 51 (100.0%) | 0 (0.0%) |
| 12 to 14 Years | 11 (100.0%) | 0 (0.0%) |
| 15 Years | 0 (0.0%) | 0 (0.0%) |
| 16 and 17 Years | 0 (0.0%) | 0 (0.0%) |
| 18 to 24 Years | 0 (0.0%) | 0 (0.0%) |
| 25 to 34 Years | 89 (100.0%) | 55 (100.0%) |
| 35 to 44 Years | 0 (0.0%) | 0 (0.0%) |
| 45 to 54 Years | 96 (100.0%) | 91 (100.0%) |
| 55 to 64 Years | 31 (100.0%) | 19 (100.0%) |
| 65 to 74 Years | 0 (0.0%) | 0 (0.0%) |
| 75 Years and over | 0 (0.0%) | 10 (100.0%) |
| Total | 278 (100.0%) | 263 (100.0%) |
Income Below Poverty Among Married-Couple Families in East Millstone
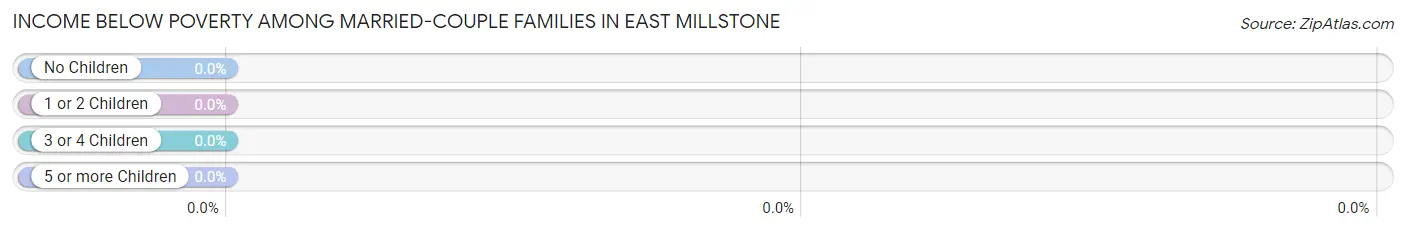
| Children | Above Poverty | Below Poverty |
| No Children | 39 (100.0%) | 0 (0.0%) |
| 1 or 2 Children | 106 (100.0%) | 0 (0.0%) |
| 3 or 4 Children | 0 (0.0%) | 0 (0.0%) |
| 5 or more Children | 0 (0.0%) | 0 (0.0%) |
| Total | 145 (100.0%) | 0 (0.0%) |
Income Below Poverty Among Single-Parent Households in East Millstone
| Children | Single Father | Single Mother |
| No Children | 0 (0.0%) | 0 (0.0%) |
| 1 or 2 Children | 0 (0.0%) | 0 (0.0%) |
| 3 or 4 Children | 0 (0.0%) | 0 (0.0%) |
| 5 or more Children | 0 (0.0%) | 0 (0.0%) |
| Total | 0 (0.0%) | 0 (0.0%) |
Income Below Poverty Among Married-Couple vs Single-Parent Households in East Millstone
| Children | Married-Couple Families | Single-Parent Households |
| No Children | 0 (0.0%) | 0 (0.0%) |
| 1 or 2 Children | 0 (0.0%) | 0 (0.0%) |
| 3 or 4 Children | 0 (0.0%) | 0 (0.0%) |
| 5 or more Children | 0 (0.0%) | 0 (0.0%) |
| Total | 0 (0.0%) | 0 (0.0%) |
Race in East Millstone
The most populous races in East Millstone are White / Caucasian (427 | 78.9%), Black / African American (69 | 12.8%), and Hispanic or Latino (45 | 8.3%).
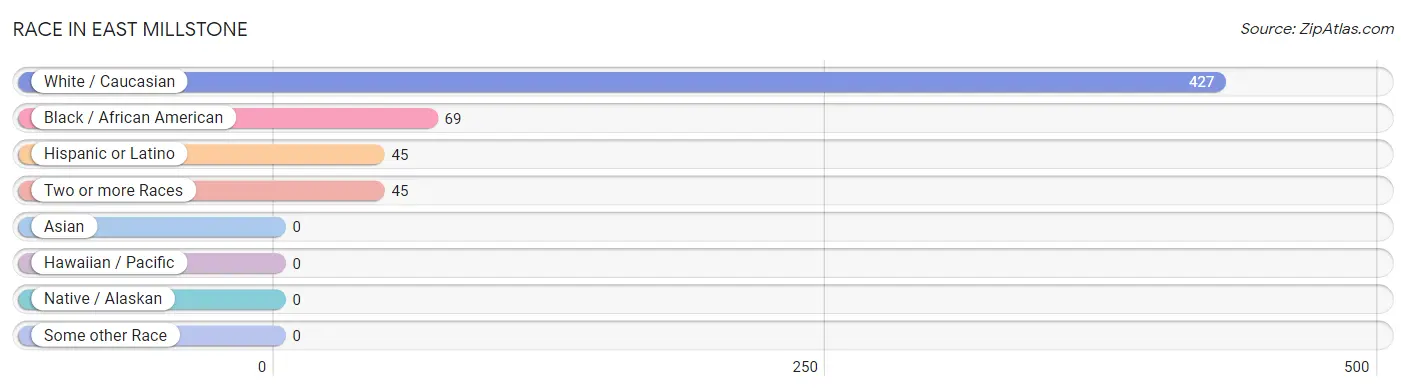
| Race | # Population | % Population |
| Asian | 0 | 0.0% |
| Black / African American | 69 | 12.8% |
| Hawaiian / Pacific | 0 | 0.0% |
| Hispanic or Latino | 45 | 8.3% |
| Native / Alaskan | 0 | 0.0% |
| White / Caucasian | 427 | 78.9% |
| Two or more Races | 45 | 8.3% |
| Some other Race | 0 | 0.0% |
| Total | 541 | 100.0% |
Ancestry in East Millstone
The most populous ancestries reported in East Millstone are German (257 | 47.5%), American (115 | 21.3%), Polish (96 | 17.7%), Irish (79 | 14.6%), and Colombian (45 | 8.3%), together accounting for 109.4% of all East Millstone residents.
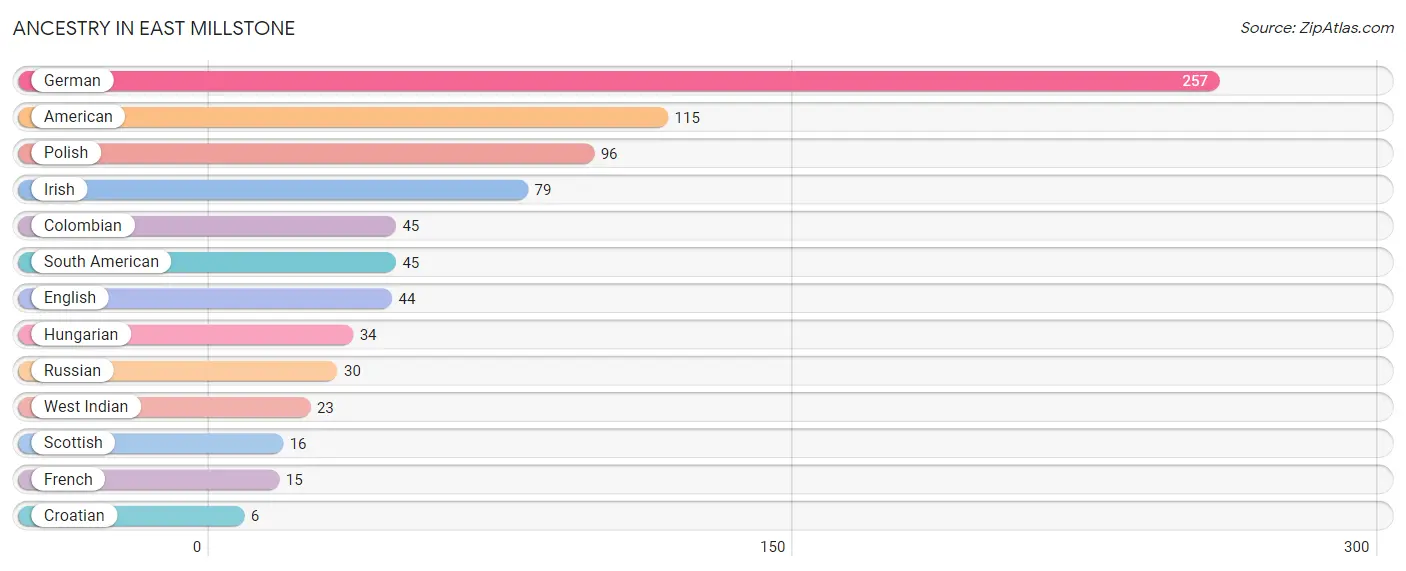
| Ancestry | # Population | % Population |
| American | 115 | 21.3% |
| Colombian | 45 | 8.3% |
| Croatian | 6 | 1.1% |
| English | 44 | 8.1% |
| French | 15 | 2.8% |
| German | 257 | 47.5% |
| Hungarian | 34 | 6.3% |
| Irish | 79 | 14.6% |
| Polish | 96 | 17.7% |
| Russian | 30 | 5.6% |
| Scottish | 16 | 3.0% |
| South American | 45 | 8.3% |
| West Indian | 23 | 4.3% | View All 13 Rows |
Immigrants in East Millstone
The most numerous immigrant groups reported in East Millstone came from Latin America (57 | 10.5%), Colombia (34 | 6.3%), South America (34 | 6.3%), Caribbean (23 | 4.3%), and Trinidad and Tobago (23 | 4.3%), together accounting for 31.6% of all East Millstone residents.
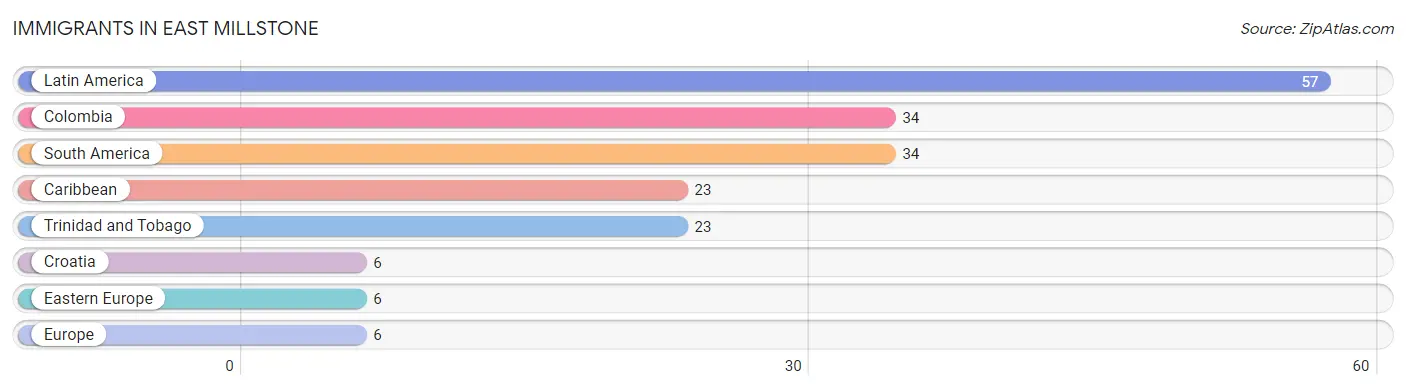
| Immigration Origin | # Population | % Population |
| Caribbean | 23 | 4.3% |
| Colombia | 34 | 6.3% |
| Croatia | 6 | 1.1% |
| Eastern Europe | 6 | 1.1% |
| Europe | 6 | 1.1% |
| Latin America | 57 | 10.5% |
| South America | 34 | 6.3% |
| Trinidad and Tobago | 23 | 4.3% | View All 8 Rows |
Sex and Age in East Millstone
Sex and Age in East Millstone
The most populous age groups in East Millstone are 30 to 34 Years (89 | 32.0%) for men and 45 to 49 Years (89 | 33.8%) for women.
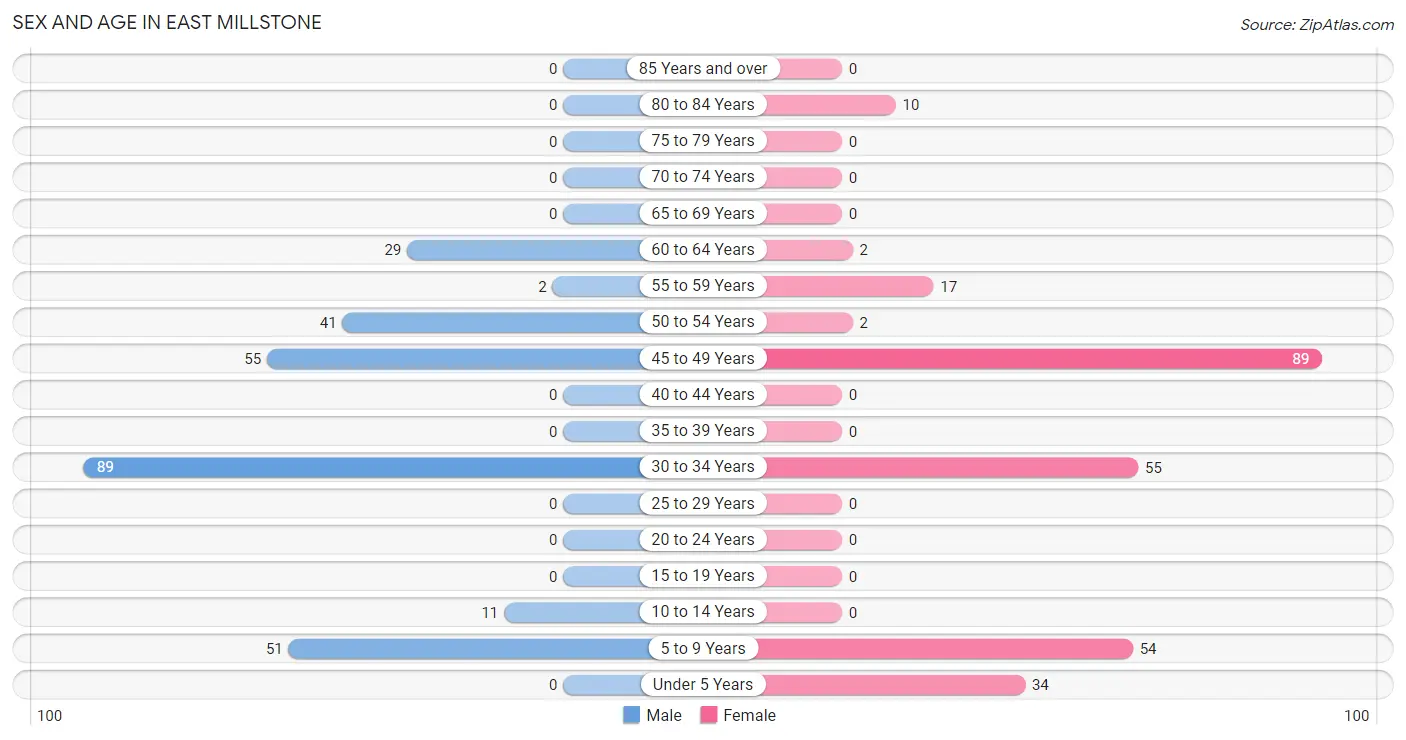
| Age Bracket | Male | Female |
| Under 5 Years | 0 (0.0%) | 34 (12.9%) |
| 5 to 9 Years | 51 (18.3%) | 54 (20.5%) |
| 10 to 14 Years | 11 (4.0%) | 0 (0.0%) |
| 15 to 19 Years | 0 (0.0%) | 0 (0.0%) |
| 20 to 24 Years | 0 (0.0%) | 0 (0.0%) |
| 25 to 29 Years | 0 (0.0%) | 0 (0.0%) |
| 30 to 34 Years | 89 (32.0%) | 55 (20.9%) |
| 35 to 39 Years | 0 (0.0%) | 0 (0.0%) |
| 40 to 44 Years | 0 (0.0%) | 0 (0.0%) |
| 45 to 49 Years | 55 (19.8%) | 89 (33.8%) |
| 50 to 54 Years | 41 (14.7%) | 2 (0.8%) |
| 55 to 59 Years | 2 (0.7%) | 17 (6.5%) |
| 60 to 64 Years | 29 (10.4%) | 2 (0.8%) |
| 65 to 69 Years | 0 (0.0%) | 0 (0.0%) |
| 70 to 74 Years | 0 (0.0%) | 0 (0.0%) |
| 75 to 79 Years | 0 (0.0%) | 0 (0.0%) |
| 80 to 84 Years | 0 (0.0%) | 10 (3.8%) |
| 85 Years and over | 0 (0.0%) | 0 (0.0%) |
| Total | 278 (100.0%) | 263 (100.0%) |
Families and Households in East Millstone
Median Family Size in East Millstone
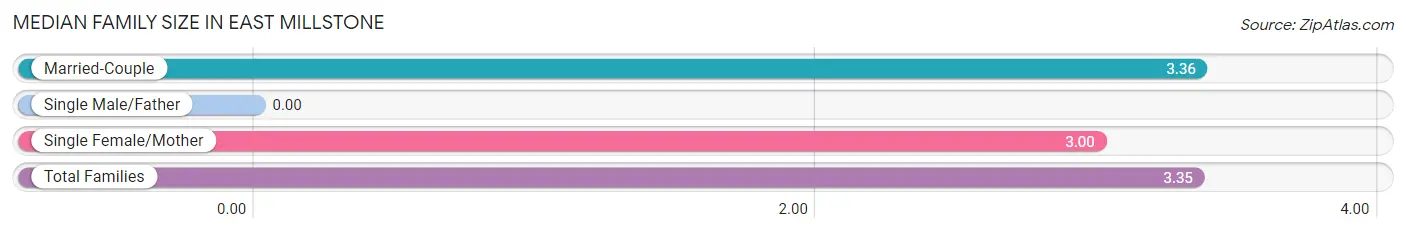
| Family Type | # Families | Family Size |
| Married-Couple | 145 (98.6%) | 3.36 |
| Single Male/Father | 0 (0.0%) | - |
| Single Female/Mother | 2 (1.4%) | 3.00 |
| Total Families | 147 (100.0%) | 3.35 |
Median Household Size in East Millstone
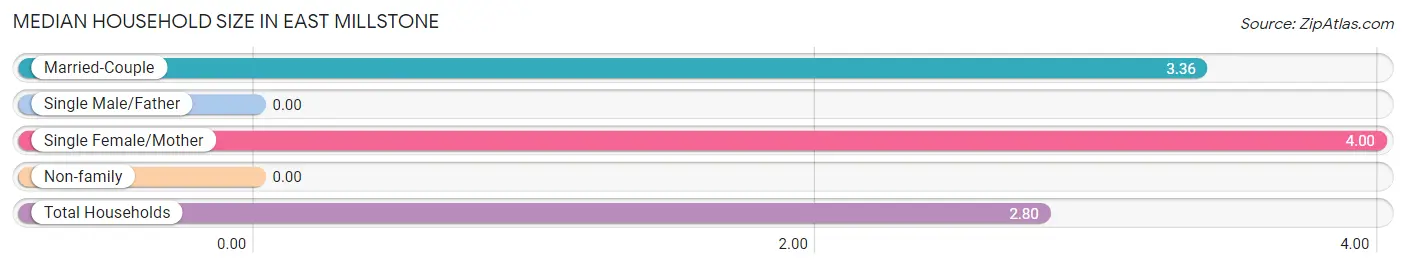
| Household Type | # Households | Household Size |
| Married-Couple | 145 (75.1%) | 3.36 |
| Single Male/Father | 0 (0.0%) | - |
| Single Female/Mother | 2 (1.0%) | 4.00 |
| Non-family | 46 (23.8%) | - |
| Total Households | 193 (100.0%) | 2.80 |
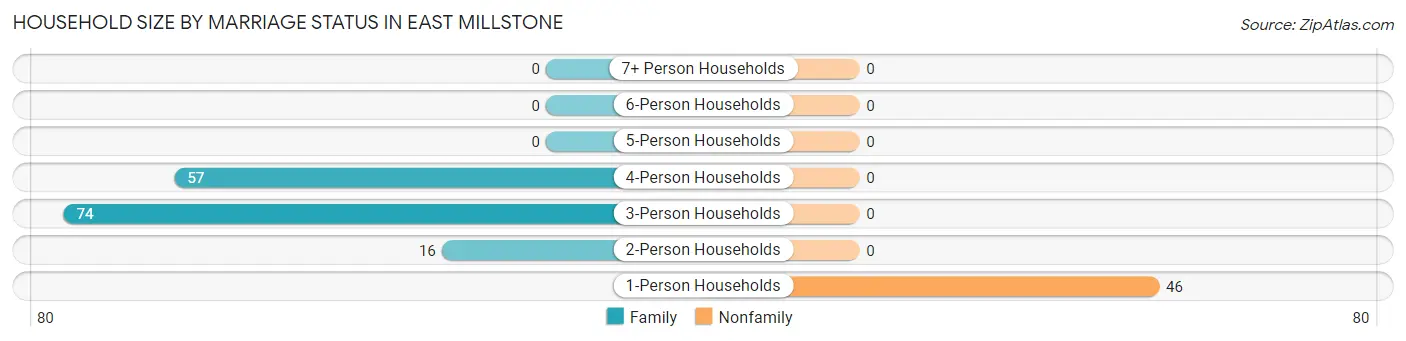
Household Size by Marriage Status in East Millstone
Out of a total of 193 households in East Millstone, 147 (76.2%) are family households, while 46 (23.8%) are nonfamily households. The most numerous type of family households are 3-person households, comprising 74, and the most common type of nonfamily households are 1-person households, comprising 46.
| Household Size | Family Households | Nonfamily Households |
| 1-Person Households | - | 46 (23.8%) |
| 2-Person Households | 16 (8.3%) | 0 (0.0%) |
| 3-Person Households | 74 (38.3%) | 0 (0.0%) |
| 4-Person Households | 57 (29.5%) | 0 (0.0%) |
| 5-Person Households | 0 (0.0%) | 0 (0.0%) |
| 6-Person Households | 0 (0.0%) | 0 (0.0%) |
| 7+ Person Households | 0 (0.0%) | 0 (0.0%) |
| Total | 147 (76.2%) | 46 (23.8%) |
Female Fertility in East Millstone
Fertility by Age in East Millstone
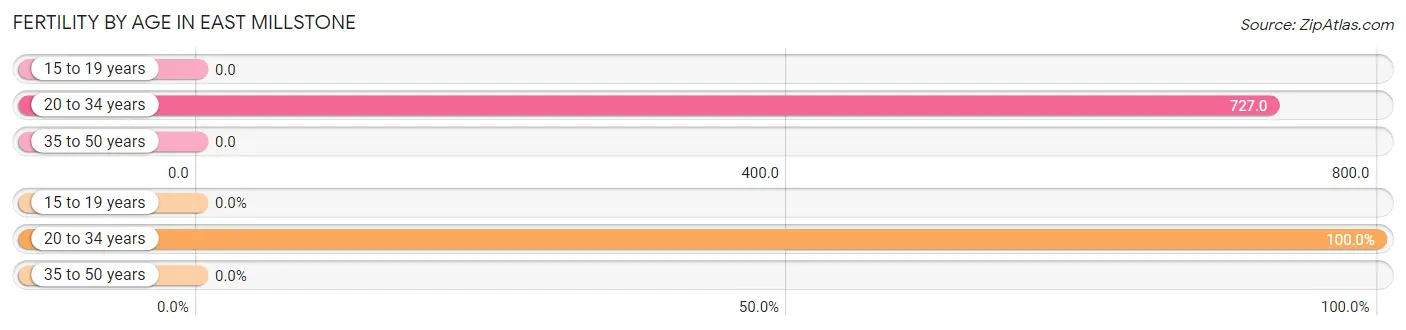
Average fertility rate in East Millstone is 278.0 births per 1,000 women. Women in the age bracket of 20 to 34 years have the highest fertility rate with 727.0 births per 1,000 women. Women in the age bracket of 20 to 34 years acount for 100.0% of all women with births.
| Age Bracket | Women with Births | Births / 1,000 Women |
| 15 to 19 years | 0 (0.0%) | 0.0 |
| 20 to 34 years | 40 (100.0%) | 727.0 |
| 35 to 50 years | 0 (0.0%) | 0.0 |
| Total | 40 (100.0%) | 278.0 |
Fertility by Age by Marriage Status in East Millstone
| Age Bracket | Married | Unmarried |
| 15 to 19 years | 0 (0.0%) | 0 (0.0%) |
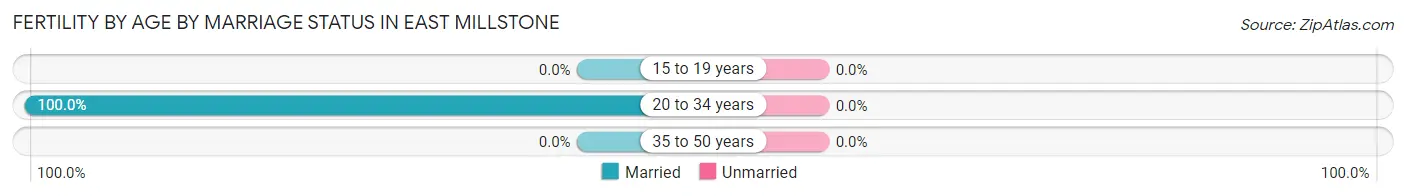
| 20 to 34 years | 40 (100.0%) | 0 (0.0%) |
| 35 to 50 years | 0 (0.0%) | 0 (0.0%) |
| Total | 40 (100.0%) | 0 (0.0%) |
Fertility by Education in East Millstone
| Educational Attainment | Women with Births | Births / 1,000 Women |
| Less than High School | 0 (0.0%) | 0.0 |
| High School Diploma | 0 (0.0%) | 0.0 |
| College or Associate's Degree | 0 (0.0%) | 0.0 |
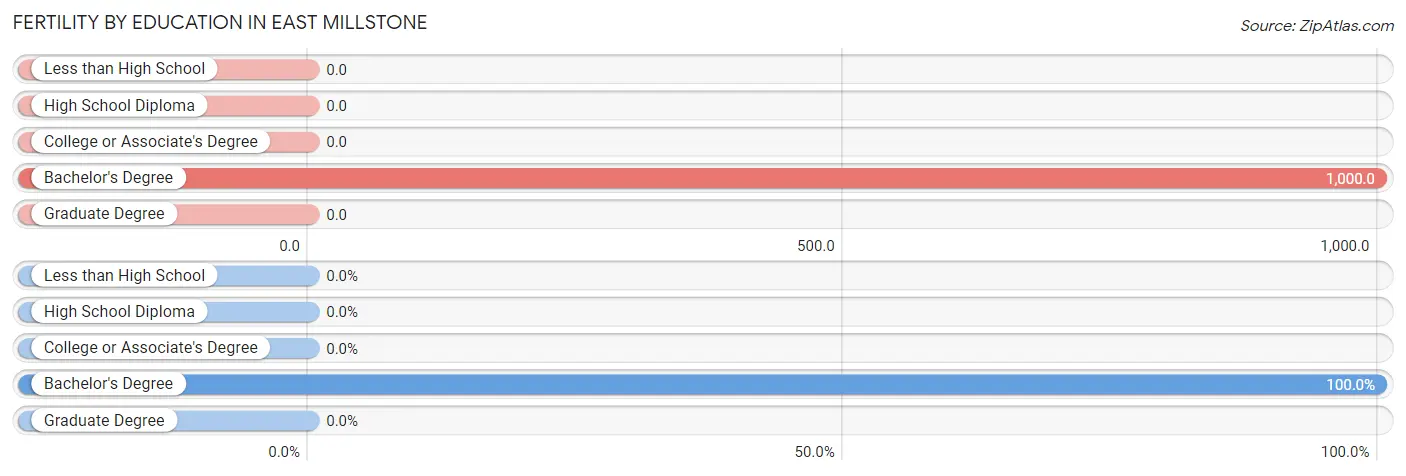
| Bachelor's Degree | 40 (100.0%) | 1,000.0 |
| Graduate Degree | 0 (0.0%) | 0.0 |
| Total | 40 (100.0%) | 278.0 |
Fertility by Education by Marriage Status in East Millstone
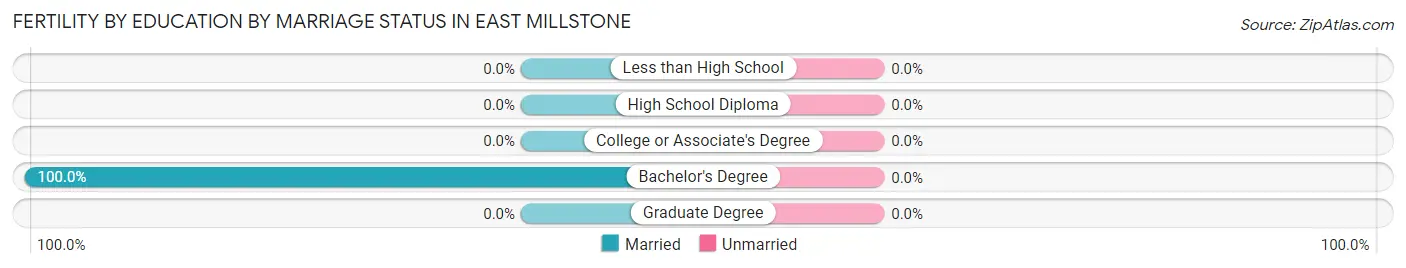
| Educational Attainment | Married | Unmarried |
| Less than High School | 0 (0.0%) | 0 (0.0%) |
| High School Diploma | 0 (0.0%) | 0 (0.0%) |
| College or Associate's Degree | 0 (0.0%) | 0 (0.0%) |
| Bachelor's Degree | 40 (100.0%) | 0 (0.0%) |
| Graduate Degree | 0 (0.0%) | 0 (0.0%) |
| Total | 40 (100.0%) | 0 (0.0%) |
Employment Characteristics in East Millstone
Employment by Class of Employer in East Millstone
Among the 358 employed individuals in East Millstone, private company employees (202 | 56.4%), state government employees (82 | 22.9%), and not-for-profit organizations (72 | 20.1%) make up the most common classes of employment.
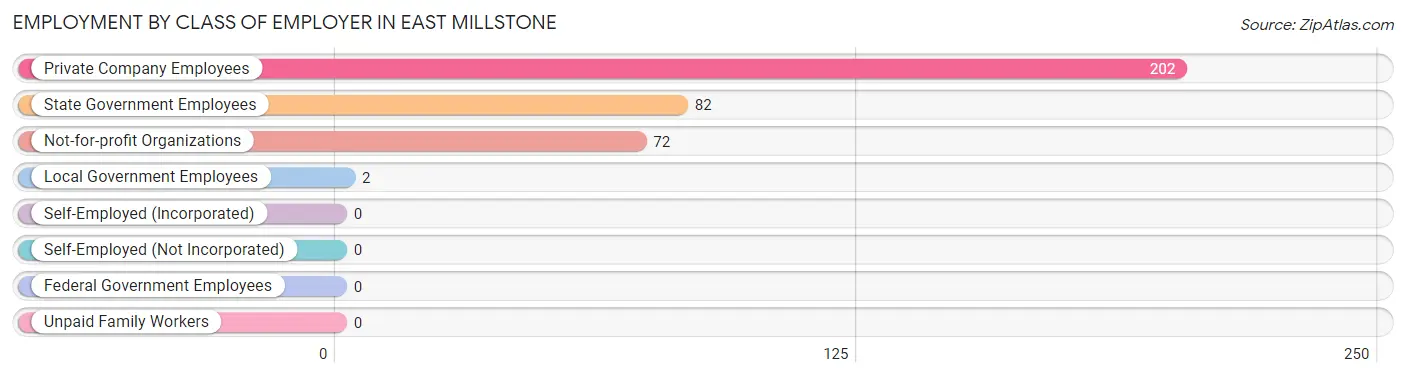
| Employer Class | # Employees | % Employees |
| Private Company Employees | 202 | 56.4% |
| Self-Employed (Incorporated) | 0 | 0.0% |
| Self-Employed (Not Incorporated) | 0 | 0.0% |
| Not-for-profit Organizations | 72 | 20.1% |
| Local Government Employees | 2 | 0.6% |
| State Government Employees | 82 | 22.9% |
| Federal Government Employees | 0 | 0.0% |
| Unpaid Family Workers | 0 | 0.0% |
| Total | 358 | 100.0% |
Employment Status by Age in East Millstone
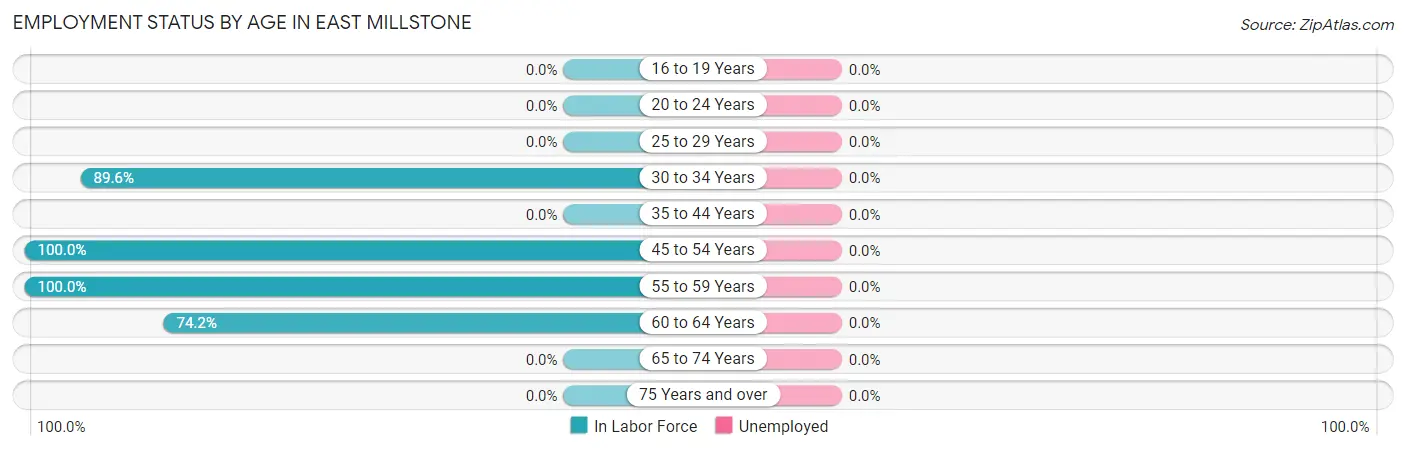
| Age Bracket | In Labor Force | Unemployed |
| 16 to 19 Years | 0 (0.0%) | 0 (0.0%) |
| 20 to 24 Years | 0 (0.0%) | 0 (0.0%) |
| 25 to 29 Years | 0 (0.0%) | 0 (0.0%) |
| 30 to 34 Years | 129 (89.6%) | 0 (0.0%) |
| 35 to 44 Years | 0 (0.0%) | 0 (0.0%) |
| 45 to 54 Years | 187 (100.0%) | 0 (0.0%) |
| 55 to 59 Years | 19 (100.0%) | 0 (0.0%) |
| 60 to 64 Years | 23 (74.2%) | 0 (0.0%) |
| 65 to 74 Years | 0 (0.0%) | 0 (0.0%) |
| 75 Years and over | 0 (0.0%) | 0 (0.0%) |
| Total | 358 (91.6%) | 0 (0.0%) |
Employment Status by Educational Attainment in East Millstone
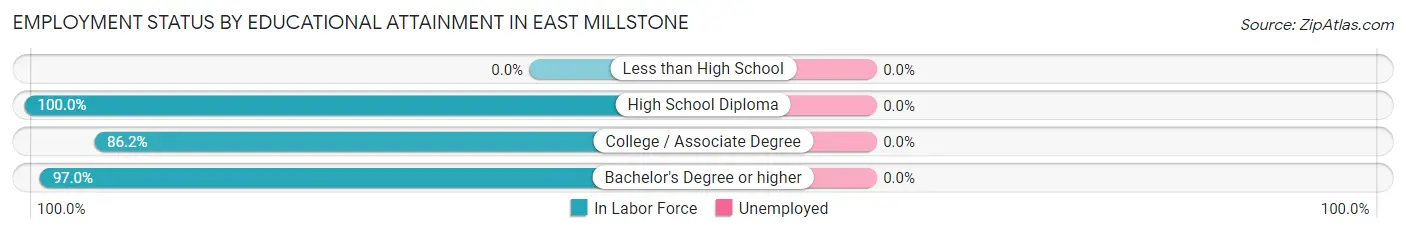
| Educational Attainment | In Labor Force | Unemployed |
| Less than High School | 0 (0.0%) | 0 (0.0%) |
| High School Diploma | 2 (100.0%) | 0 (0.0%) |
| College / Associate Degree | 94 (86.2%) | 0 (0.0%) |
| Bachelor's Degree or higher | 262 (97.0%) | 0 (0.0%) |
| Total | 358 (94.0%) | 0 (0.0%) |
Employment Occupations by Sex in East Millstone
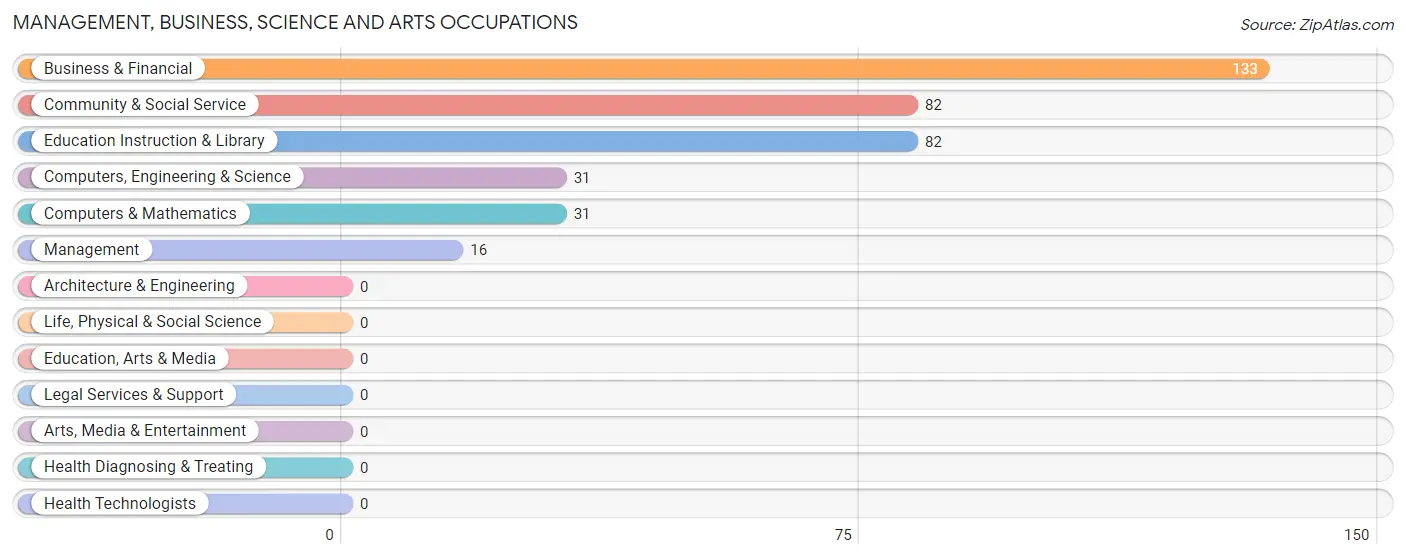
Management, Business, Science and Arts Occupations
The most common Management, Business, Science and Arts occupations in East Millstone are Business & Financial (133 | 37.1%), Community & Social Service (82 | 22.9%), Education Instruction & Library (82 | 22.9%), Computers, Engineering & Science (31 | 8.7%), and Computers & Mathematics (31 | 8.7%).
Management, Business, Science and Arts Occupations by Sex
Within the Management, Business, Science and Arts occupations in East Millstone, the most male-oriented occupations are Management (100.0%), Computers, Engineering & Science (100.0%), and Computers & Mathematics (100.0%), while the most female-oriented occupations are Community & Social Service (48.8%), Education Instruction & Library (48.8%), and Business & Financial (41.3%).
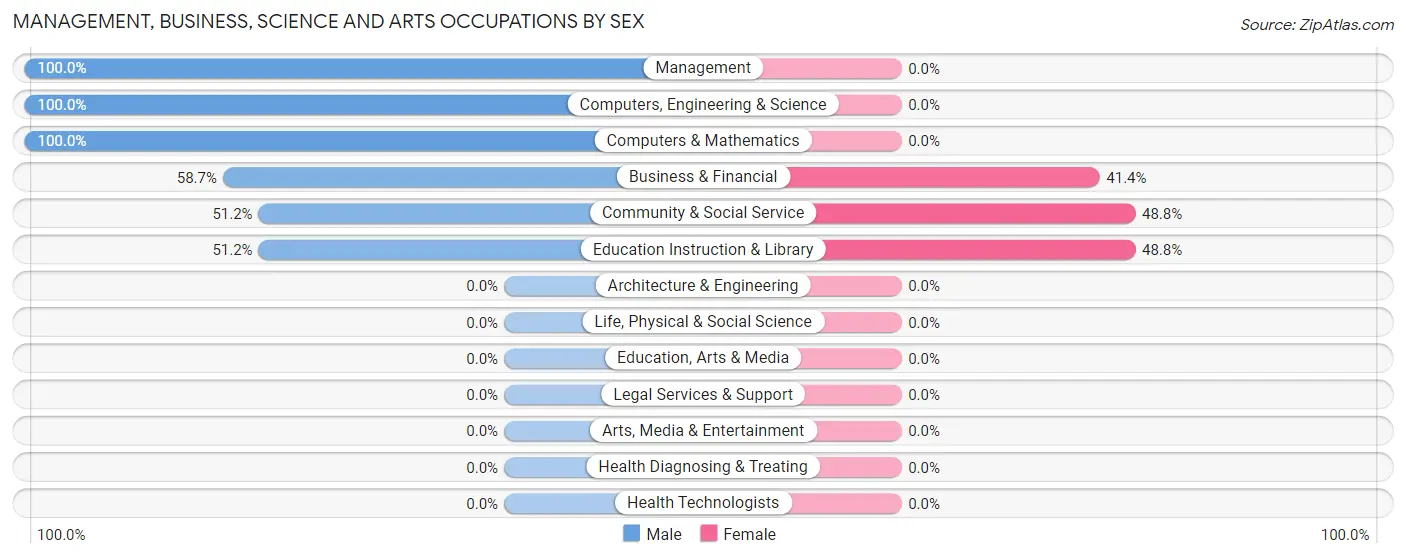
| Occupation | Male | Female |
| Management | 16 (100.0%) | 0 (0.0%) |
| Business & Financial | 78 (58.7%) | 55 (41.3%) |
| Computers, Engineering & Science | 31 (100.0%) | 0 (0.0%) |
| Computers & Mathematics | 31 (100.0%) | 0 (0.0%) |
| Architecture & Engineering | 0 (0.0%) | 0 (0.0%) |
| Life, Physical & Social Science | 0 (0.0%) | 0 (0.0%) |
| Community & Social Service | 42 (51.2%) | 40 (48.8%) |
| Education, Arts & Media | 0 (0.0%) | 0 (0.0%) |
| Legal Services & Support | 0 (0.0%) | 0 (0.0%) |
| Education Instruction & Library | 42 (51.2%) | 40 (48.8%) |
| Arts, Media & Entertainment | 0 (0.0%) | 0 (0.0%) |
| Health Diagnosing & Treating | 0 (0.0%) | 0 (0.0%) |
| Health Technologists | 0 (0.0%) | 0 (0.0%) |
| Total (Category) | 167 (63.7%) | 95 (36.3%) |
| Total (Overall) | 210 (58.7%) | 148 (41.3%) |
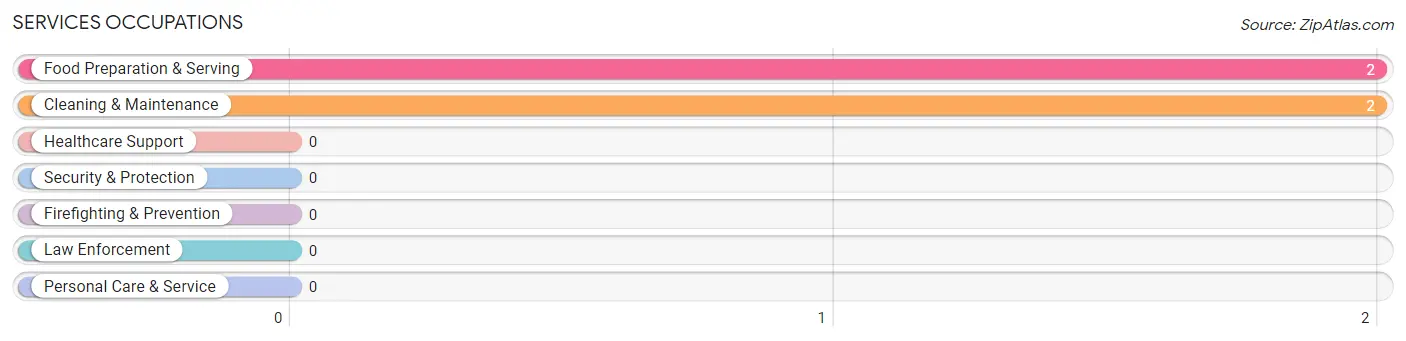
Services Occupations
The most common Services occupations in East Millstone are Food Preparation & Serving (2 | 0.6%), and Cleaning & Maintenance (2 | 0.6%).
Services Occupations by Sex
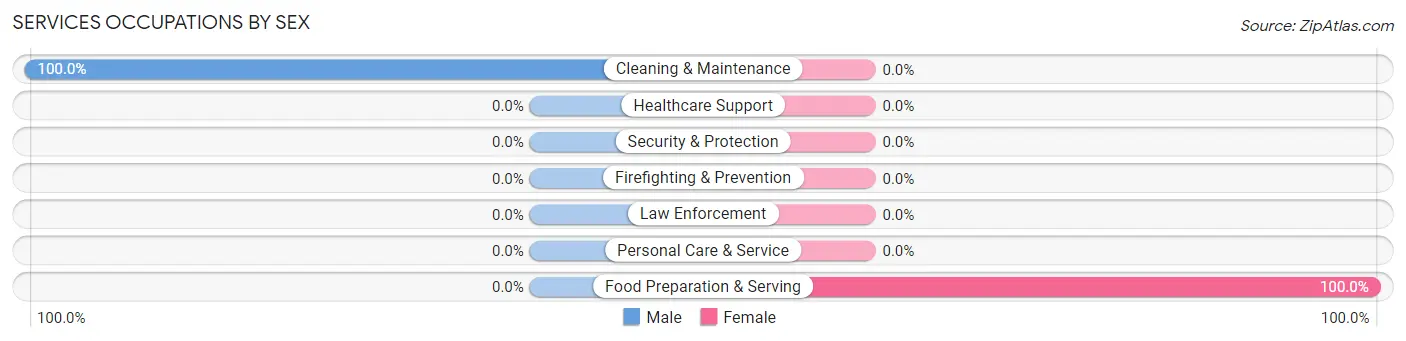
| Occupation | Male | Female |
| Healthcare Support | 0 (0.0%) | 0 (0.0%) |
| Security & Protection | 0 (0.0%) | 0 (0.0%) |
| Firefighting & Prevention | 0 (0.0%) | 0 (0.0%) |
| Law Enforcement | 0 (0.0%) | 0 (0.0%) |
| Food Preparation & Serving | 0 (0.0%) | 2 (100.0%) |
| Cleaning & Maintenance | 2 (100.0%) | 0 (0.0%) |
| Personal Care & Service | 0 (0.0%) | 0 (0.0%) |
| Total (Category) | 2 (50.0%) | 2 (50.0%) |
| Total (Overall) | 210 (58.7%) | 148 (41.3%) |
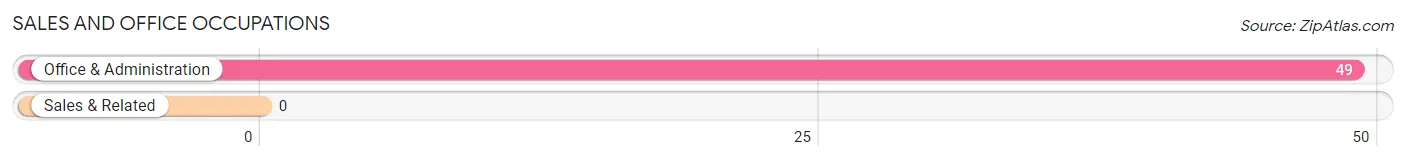
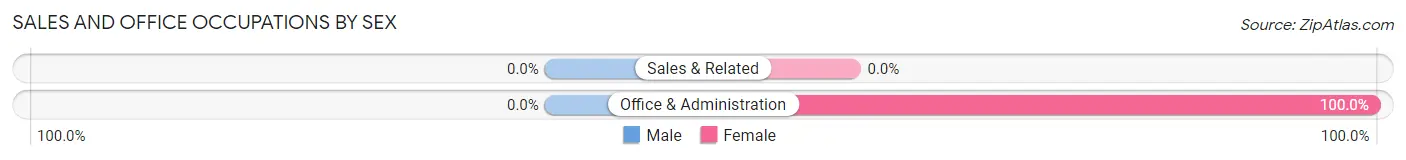
Sales and Office Occupations
The most common Sales and Office occupations in East Millstone are , and Office & Administration (49 | 13.7%).
Sales and Office Occupations by Sex
| Occupation | Male | Female |
| Sales & Related | 0 (0.0%) | 0 (0.0%) |
| Office & Administration | 0 (0.0%) | 49 (100.0%) |
| Total (Category) | 0 (0.0%) | 49 (100.0%) |
| Total (Overall) | 210 (58.7%) | 148 (41.3%) |
Natural Resources, Construction and Maintenance Occupations
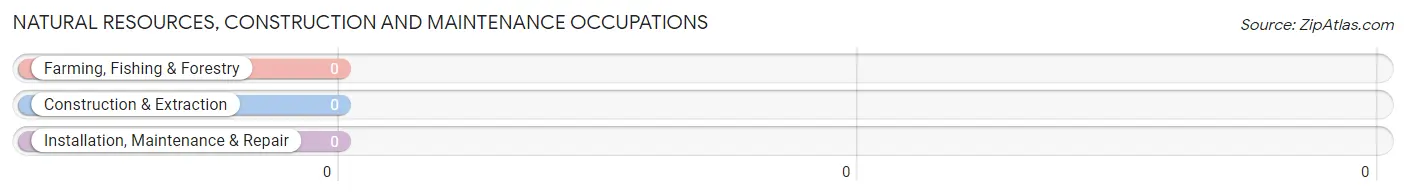
Natural Resources, Construction and Maintenance Occupations by Sex
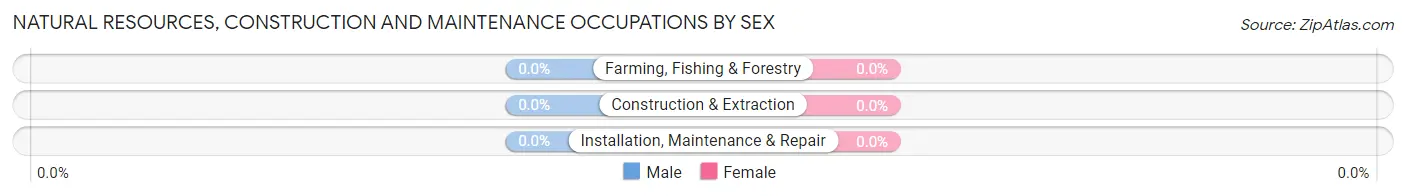
| Occupation | Male | Female |
| Farming, Fishing & Forestry | 0 (0.0%) | 0 (0.0%) |
| Construction & Extraction | 0 (0.0%) | 0 (0.0%) |
| Installation, Maintenance & Repair | 0 (0.0%) | 0 (0.0%) |
| Total (Category) | 0 (0.0%) | 0 (0.0%) |
| Total (Overall) | 210 (58.7%) | 148 (41.3%) |
Production, Transportation and Moving Occupations
The most common Production, Transportation and Moving occupations in East Millstone are , and Material Moving (43 | 12.0%).
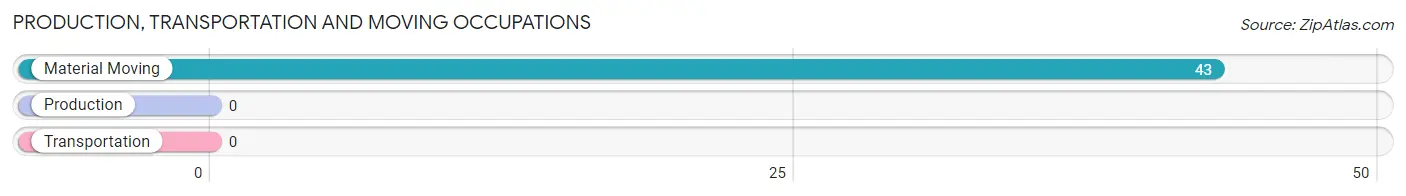
Production, Transportation and Moving Occupations by Sex
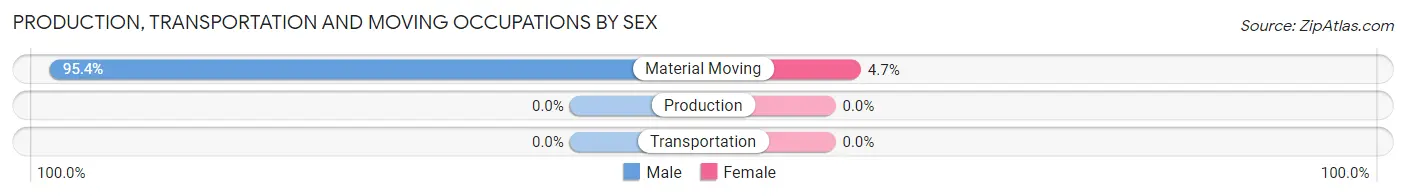
| Occupation | Male | Female |
| Production | 0 (0.0%) | 0 (0.0%) |
| Transportation | 0 (0.0%) | 0 (0.0%) |
| Material Moving | 41 (95.4%) | 2 (4.6%) |
| Total (Category) | 41 (95.4%) | 2 (4.6%) |
| Total (Overall) | 210 (58.7%) | 148 (41.3%) |
Employment Industries by Sex in East Millstone
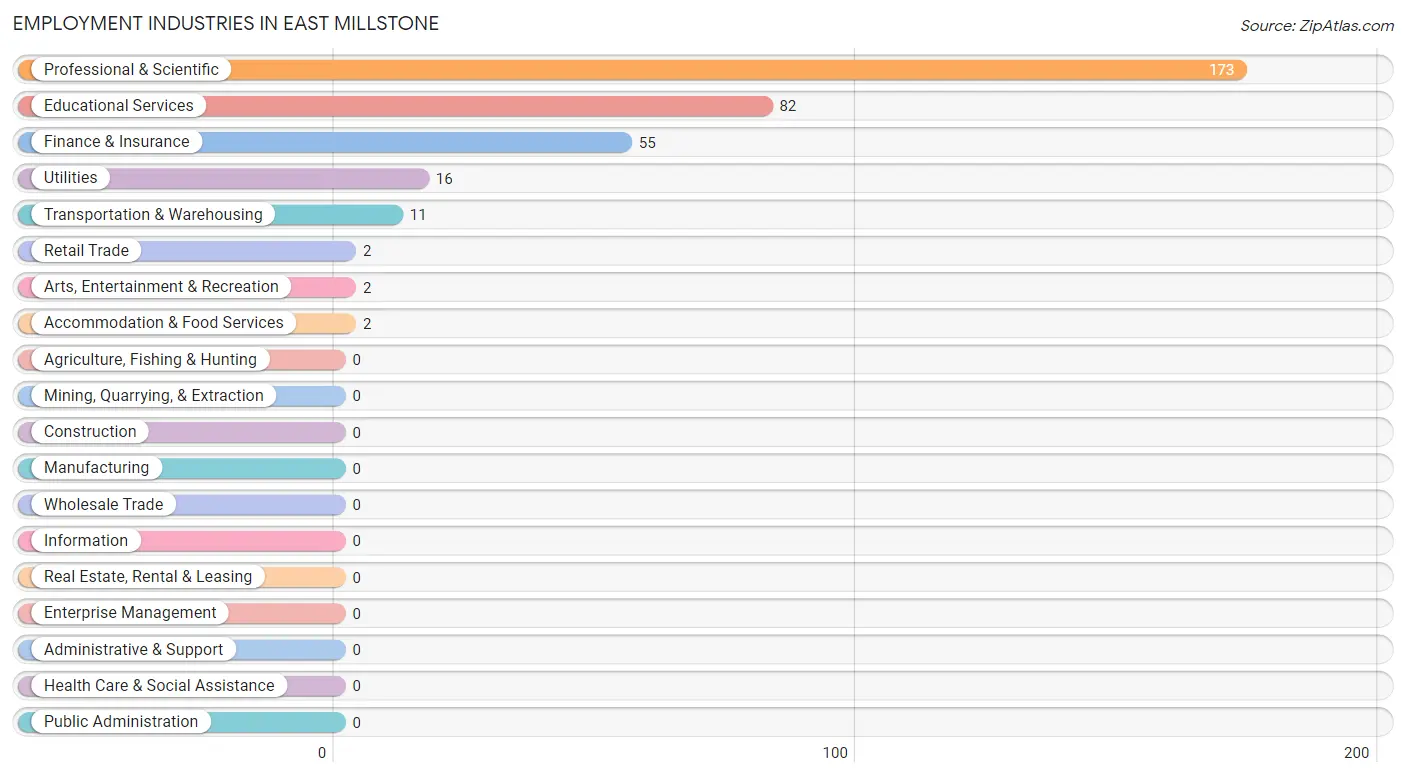
Employment Industries in East Millstone
The major employment industries in East Millstone include Professional & Scientific (173 | 48.3%), Educational Services (82 | 22.9%), Finance & Insurance (55 | 15.4%), Utilities (16 | 4.5%), and Transportation & Warehousing (11 | 3.1%).
Employment Industries by Sex in East Millstone
The East Millstone industries that see more men than women are Transportation & Warehousing (100.0%), Utilities (100.0%), and Arts, Entertainment & Recreation (100.0%), whereas the industries that tend to have a higher number of women are Retail Trade (100.0%), Finance & Insurance (100.0%), and Accommodation & Food Services (100.0%).
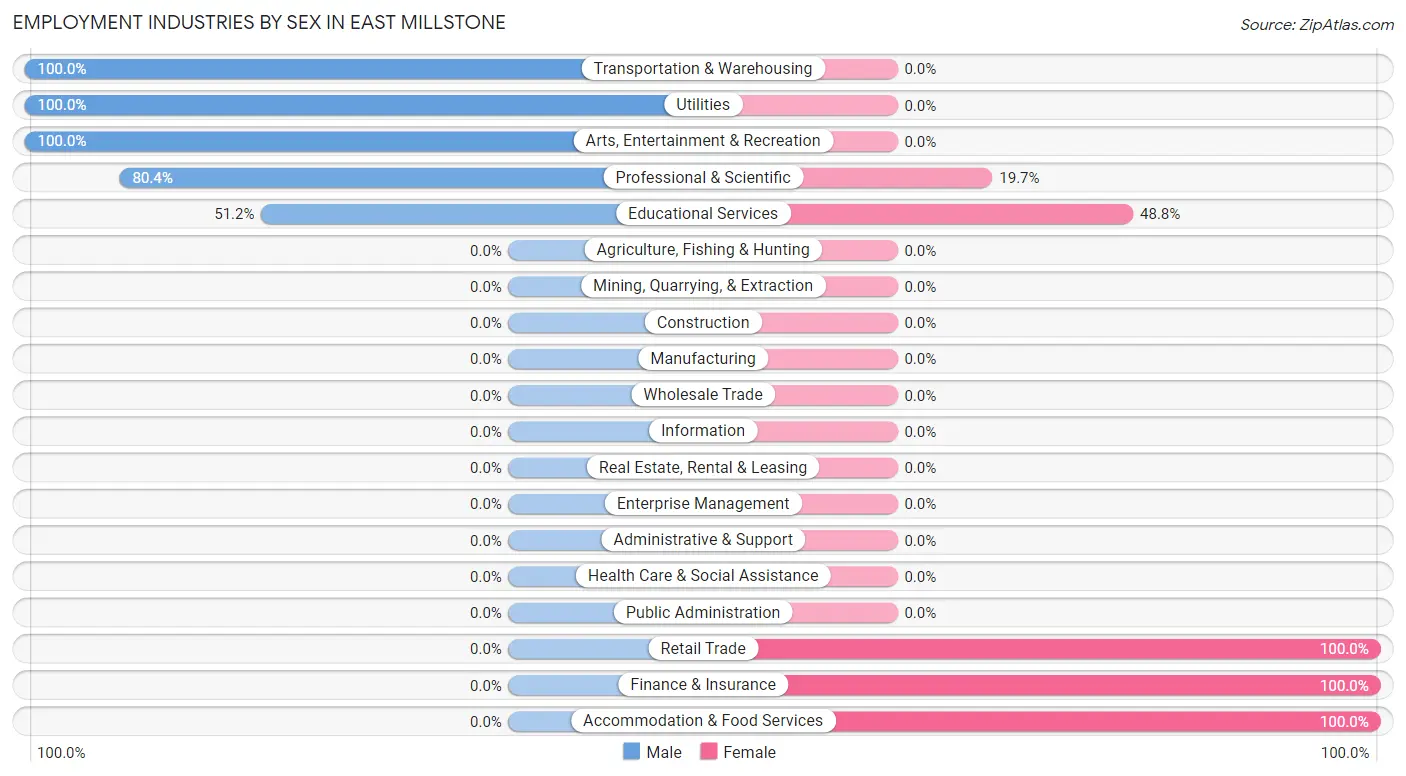
| Industry | Male | Female |
| Agriculture, Fishing & Hunting | 0 (0.0%) | 0 (0.0%) |
| Mining, Quarrying, & Extraction | 0 (0.0%) | 0 (0.0%) |
| Construction | 0 (0.0%) | 0 (0.0%) |
| Manufacturing | 0 (0.0%) | 0 (0.0%) |
| Wholesale Trade | 0 (0.0%) | 0 (0.0%) |
| Retail Trade | 0 (0.0%) | 2 (100.0%) |
| Transportation & Warehousing | 11 (100.0%) | 0 (0.0%) |
| Utilities | 16 (100.0%) | 0 (0.0%) |
| Information | 0 (0.0%) | 0 (0.0%) |
| Finance & Insurance | 0 (0.0%) | 55 (100.0%) |
| Real Estate, Rental & Leasing | 0 (0.0%) | 0 (0.0%) |
| Professional & Scientific | 139 (80.3%) | 34 (19.7%) |
| Enterprise Management | 0 (0.0%) | 0 (0.0%) |
| Administrative & Support | 0 (0.0%) | 0 (0.0%) |
| Educational Services | 42 (51.2%) | 40 (48.8%) |
| Health Care & Social Assistance | 0 (0.0%) | 0 (0.0%) |
| Arts, Entertainment & Recreation | 2 (100.0%) | 0 (0.0%) |
| Accommodation & Food Services | 0 (0.0%) | 2 (100.0%) |
| Public Administration | 0 (0.0%) | 0 (0.0%) |
| Total | 210 (58.7%) | 148 (41.3%) |
Education in East Millstone
School Enrollment in East Millstone
The most common levels of schooling among the 198 students in East Millstone are graduate / professional (82 | 41.4%), kindergarten (54 | 27.3%), and elementary school (51 | 25.8%).
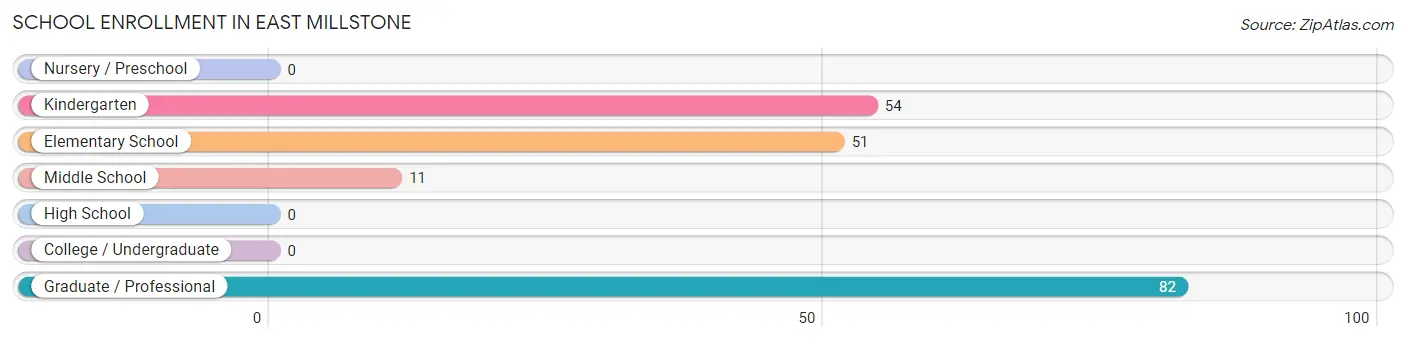
| School Level | # Students | % Students |
| Nursery / Preschool | 0 | 0.0% |
| Kindergarten | 54 | 27.3% |
| Elementary School | 51 | 25.8% |
| Middle School | 11 | 5.6% |
| High School | 0 | 0.0% |
| College / Undergraduate | 0 | 0.0% |
| Graduate / Professional | 82 | 41.4% |
| Total | 198 | 100.0% |
School Enrollment by Age by Funding Source in East Millstone
Out of a total of 198 students who are enrolled in schools in East Millstone, 53 (26.8%) attend a private institution, while the remaining 145 (73.2%) are enrolled in public schools. The age group of 10 to 14 year olds has the highest likelihood of being enrolled in private schools, with 11 (100.0% in the age bracket) enrolled. Conversely, the age group of 5 to 9 year old has the lowest likelihood of being enrolled in a private school, with 105 (100.0% in the age bracket) attending a public institution.
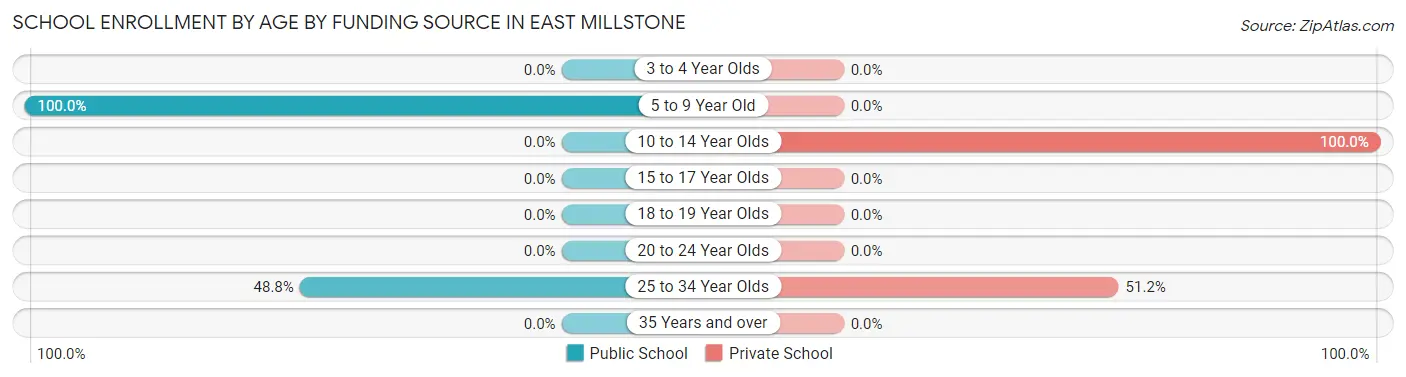
| Age Bracket | Public School | Private School |
| 3 to 4 Year Olds | 0 (0.0%) | 0 (0.0%) |
| 5 to 9 Year Old | 105 (100.0%) | 0 (0.0%) |
| 10 to 14 Year Olds | 0 (0.0%) | 11 (100.0%) |
| 15 to 17 Year Olds | 0 (0.0%) | 0 (0.0%) |
| 18 to 19 Year Olds | 0 (0.0%) | 0 (0.0%) |
| 20 to 24 Year Olds | 0 (0.0%) | 0 (0.0%) |
| 25 to 34 Year Olds | 40 (48.8%) | 42 (51.2%) |
| 35 Years and over | 0 (0.0%) | 0 (0.0%) |
| Total | 145 (73.2%) | 53 (26.8%) |
Educational Attainment by Field of Study in East Millstone
Bio, nature & agricultural (82 | 30.4%), business (55 | 20.4%), literature & languages (55 | 20.4%), communications (34 | 12.6%), and computers & mathematics (23 | 8.5%) are the most common fields of study among 270 individuals in East Millstone who have obtained a bachelor's degree or higher.
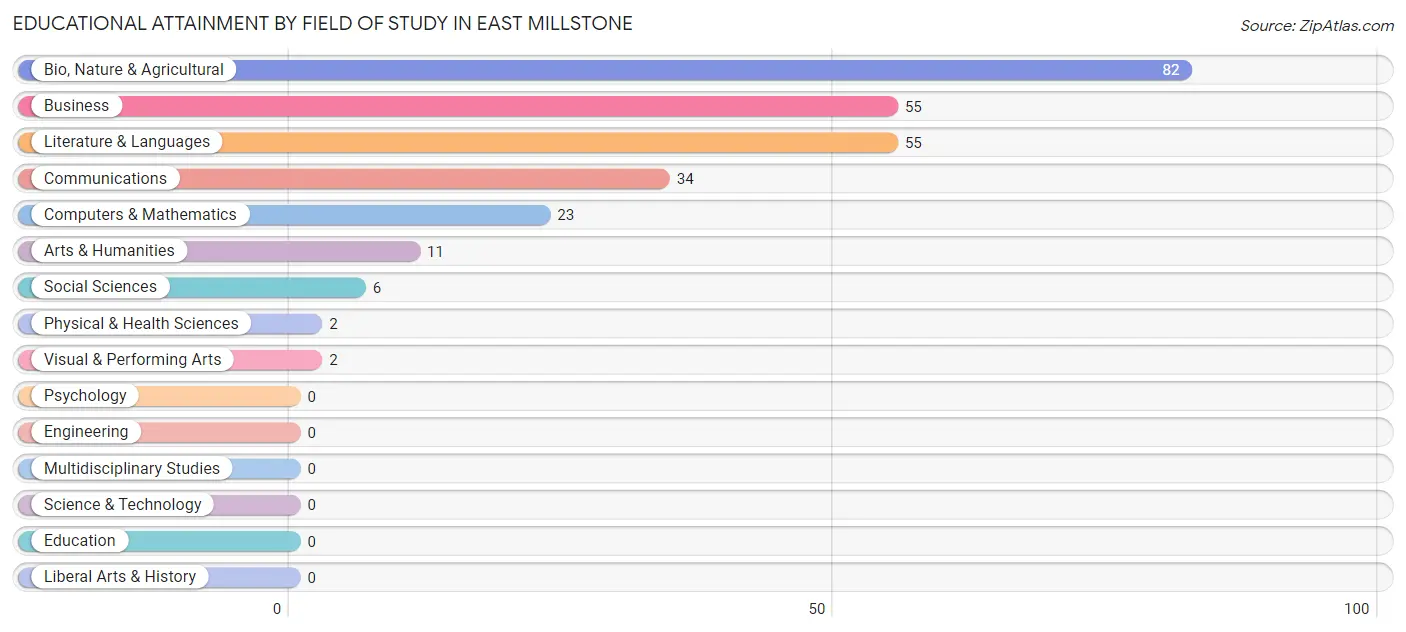
| Field of Study | # Graduates | % Graduates |
| Computers & Mathematics | 23 | 8.5% |
| Bio, Nature & Agricultural | 82 | 30.4% |
| Physical & Health Sciences | 2 | 0.7% |
| Psychology | 0 | 0.0% |
| Social Sciences | 6 | 2.2% |
| Engineering | 0 | 0.0% |
| Multidisciplinary Studies | 0 | 0.0% |
| Science & Technology | 0 | 0.0% |
| Business | 55 | 20.4% |
| Education | 0 | 0.0% |
| Literature & Languages | 55 | 20.4% |
| Liberal Arts & History | 0 | 0.0% |
| Visual & Performing Arts | 2 | 0.7% |
| Communications | 34 | 12.6% |
| Arts & Humanities | 11 | 4.1% |
| Total | 270 | 100.0% |
Transportation & Commute in East Millstone
Vehicle Availability by Sex in East Millstone
The most prevalent vehicle ownership categories in East Millstone are males with 2 vehicles (108, accounting for 51.4%) and females with 2 vehicles (129, making up 73.0%).
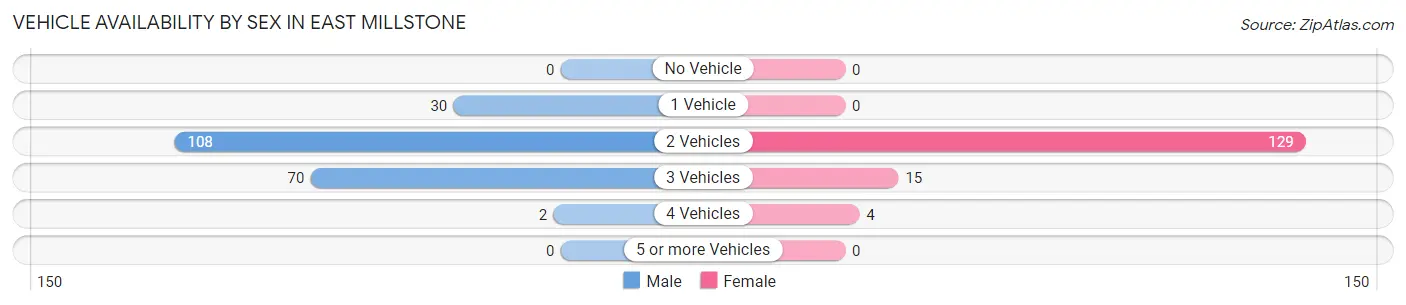
| Vehicles Available | Male | Female |
| No Vehicle | 0 (0.0%) | 0 (0.0%) |
| 1 Vehicle | 30 (14.3%) | 0 (0.0%) |
| 2 Vehicles | 108 (51.4%) | 129 (87.2%) |
| 3 Vehicles | 70 (33.3%) | 15 (10.1%) |
| 4 Vehicles | 2 (0.9%) | 4 (2.7%) |
| 5 or more Vehicles | 0 (0.0%) | 0 (0.0%) |
| Total | 210 (100.0%) | 148 (100.0%) |
Commute Time in East Millstone
The most frequently occuring commute durations in East Millstone are 30 to 34 minutes (89 commuters, 46.8%), 5 to 9 minutes (30 commuters, 15.8%), and 90 or more minutes (23 commuters, 12.1%).
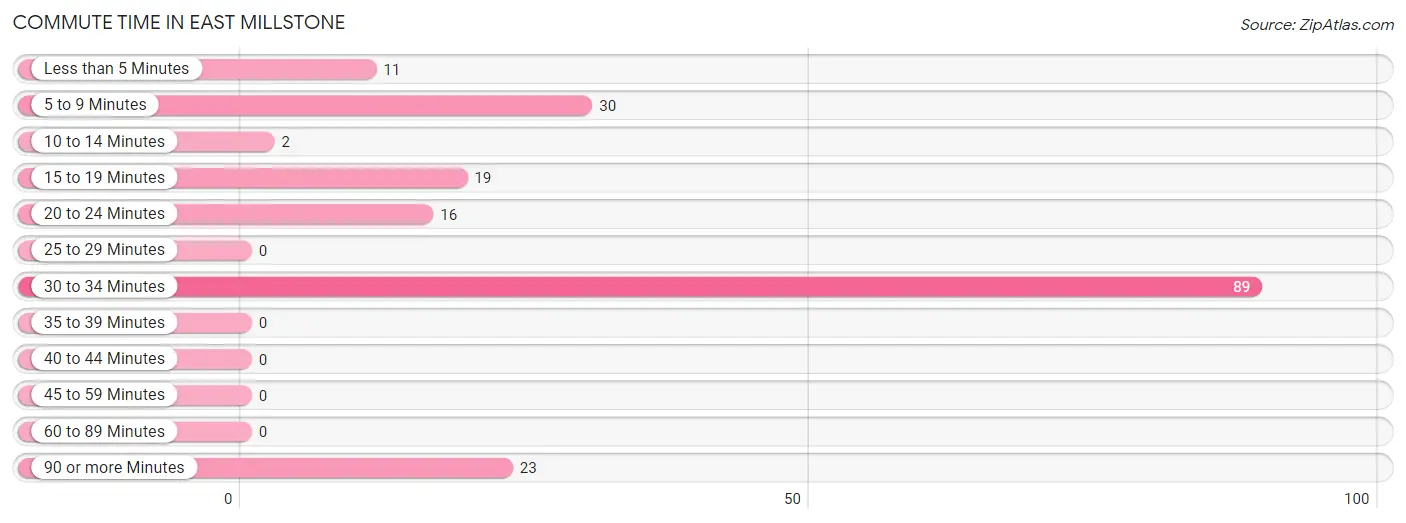
| Commute Time | # Commuters | % Commuters |
| Less than 5 Minutes | 11 | 5.8% |
| 5 to 9 Minutes | 30 | 15.8% |
| 10 to 14 Minutes | 2 | 1.1% |
| 15 to 19 Minutes | 19 | 10.0% |
| 20 to 24 Minutes | 16 | 8.4% |
| 25 to 29 Minutes | 0 | 0.0% |
| 30 to 34 Minutes | 89 | 46.8% |
| 35 to 39 Minutes | 0 | 0.0% |
| 40 to 44 Minutes | 0 | 0.0% |
| 45 to 59 Minutes | 0 | 0.0% |
| 60 to 89 Minutes | 0 | 0.0% |
| 90 or more Minutes | 23 | 12.1% |
Commute Time by Sex in East Millstone
The most common commute times in East Millstone are 30 to 34 minutes (55 commuters, 40.2%) for males and 30 to 34 minutes (34 commuters, 64.1%) for females.
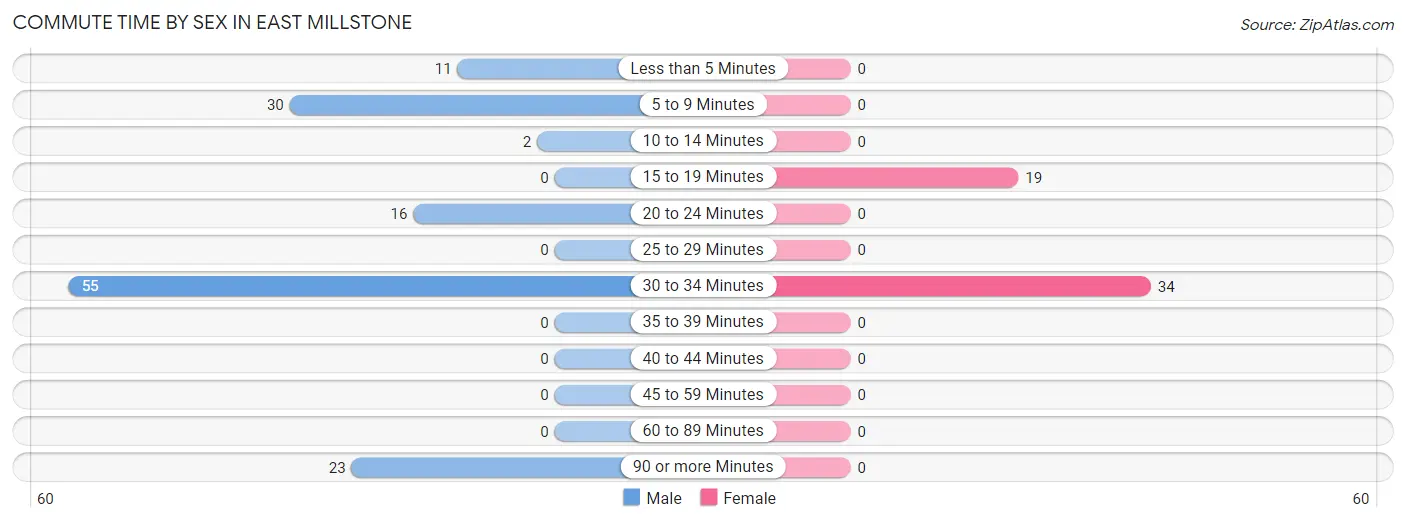
| Commute Time | Male | Female |
| Less than 5 Minutes | 11 (8.0%) | 0 (0.0%) |
| 5 to 9 Minutes | 30 (21.9%) | 0 (0.0%) |
| 10 to 14 Minutes | 2 (1.5%) | 0 (0.0%) |
| 15 to 19 Minutes | 0 (0.0%) | 19 (35.8%) |
| 20 to 24 Minutes | 16 (11.7%) | 0 (0.0%) |
| 25 to 29 Minutes | 0 (0.0%) | 0 (0.0%) |
| 30 to 34 Minutes | 55 (40.2%) | 34 (64.1%) |
| 35 to 39 Minutes | 0 (0.0%) | 0 (0.0%) |
| 40 to 44 Minutes | 0 (0.0%) | 0 (0.0%) |
| 45 to 59 Minutes | 0 (0.0%) | 0 (0.0%) |
| 60 to 89 Minutes | 0 (0.0%) | 0 (0.0%) |
| 90 or more Minutes | 23 (16.8%) | 0 (0.0%) |
Time of Departure to Work by Sex in East Millstone
The most frequent times of departure to work in East Millstone are 8:30 AM to 8:59 AM (85, 62.0%) for males and 7:00 AM to 7:29 AM (34, 64.1%) for females.
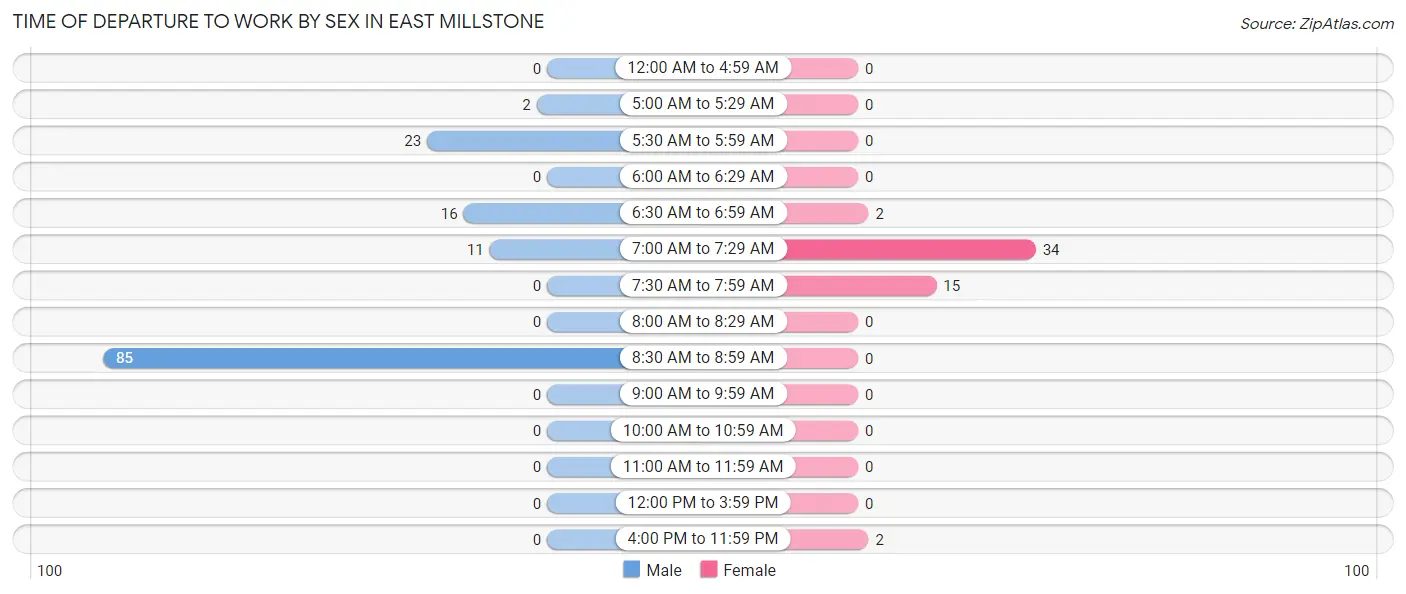
| Time of Departure | Male | Female |
| 12:00 AM to 4:59 AM | 0 (0.0%) | 0 (0.0%) |
| 5:00 AM to 5:29 AM | 2 (1.5%) | 0 (0.0%) |
| 5:30 AM to 5:59 AM | 23 (16.8%) | 0 (0.0%) |
| 6:00 AM to 6:29 AM | 0 (0.0%) | 0 (0.0%) |
| 6:30 AM to 6:59 AM | 16 (11.7%) | 2 (3.8%) |
| 7:00 AM to 7:29 AM | 11 (8.0%) | 34 (64.1%) |
| 7:30 AM to 7:59 AM | 0 (0.0%) | 15 (28.3%) |
| 8:00 AM to 8:29 AM | 0 (0.0%) | 0 (0.0%) |
| 8:30 AM to 8:59 AM | 85 (62.0%) | 0 (0.0%) |
| 9:00 AM to 9:59 AM | 0 (0.0%) | 0 (0.0%) |
| 10:00 AM to 10:59 AM | 0 (0.0%) | 0 (0.0%) |
| 11:00 AM to 11:59 AM | 0 (0.0%) | 0 (0.0%) |
| 12:00 PM to 3:59 PM | 0 (0.0%) | 0 (0.0%) |
| 4:00 PM to 11:59 PM | 0 (0.0%) | 2 (3.8%) |
| Total | 137 (100.0%) | 53 (100.0%) |
Housing Occupancy in East Millstone
Occupancy by Ownership in East Millstone
Of the total 193 dwellings in East Millstone, owner-occupied units account for 121 (62.7%), while renter-occupied units make up 72 (37.3%).
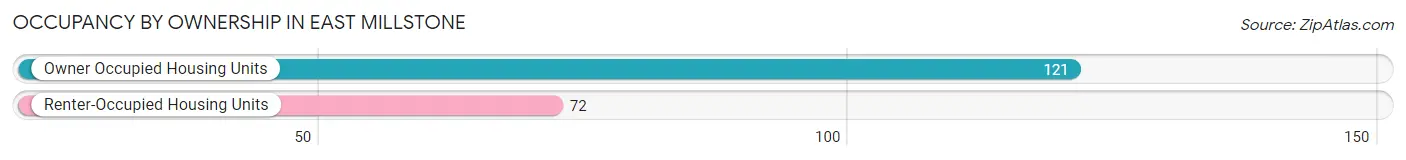
| Occupancy | # Housing Units | % Housing Units |
| Owner Occupied Housing Units | 121 | 62.7% |
| Renter-Occupied Housing Units | 72 | 37.3% |
| Total Occupied Housing Units | 193 | 100.0% |
Occupancy by Household Size in East Millstone
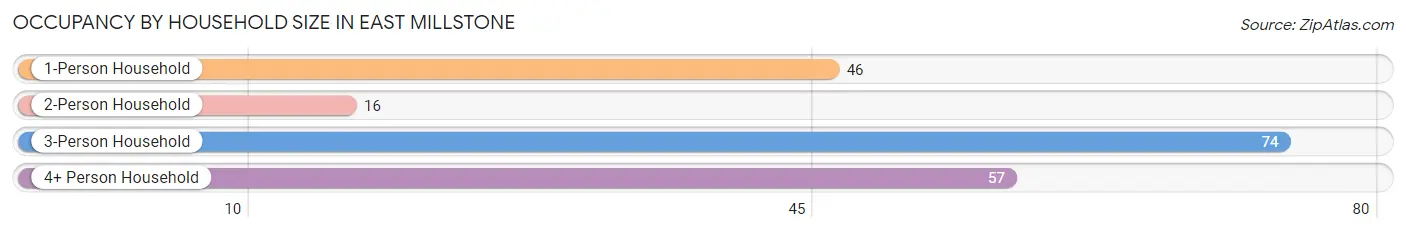
| Household Size | # Housing Units | % Housing Units |
| 1-Person Household | 46 | 23.8% |
| 2-Person Household | 16 | 8.3% |
| 3-Person Household | 74 | 38.3% |
| 4+ Person Household | 57 | 29.5% |
| Total Housing Units | 193 | 100.0% |
Occupancy by Ownership by Household Size in East Millstone
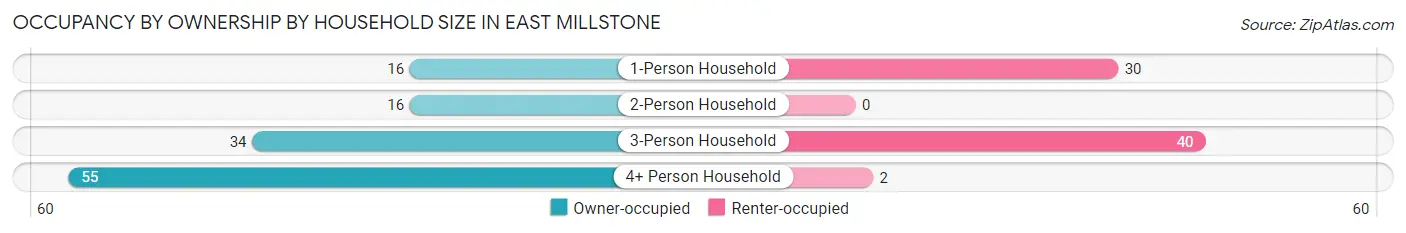
| Household Size | Owner-occupied | Renter-occupied |
| 1-Person Household | 16 (34.8%) | 30 (65.2%) |
| 2-Person Household | 16 (100.0%) | 0 (0.0%) |
| 3-Person Household | 34 (46.0%) | 40 (54.0%) |
| 4+ Person Household | 55 (96.5%) | 2 (3.5%) |
| Total Housing Units | 121 (62.7%) | 72 (37.3%) |
Occupancy by Educational Attainment in East Millstone
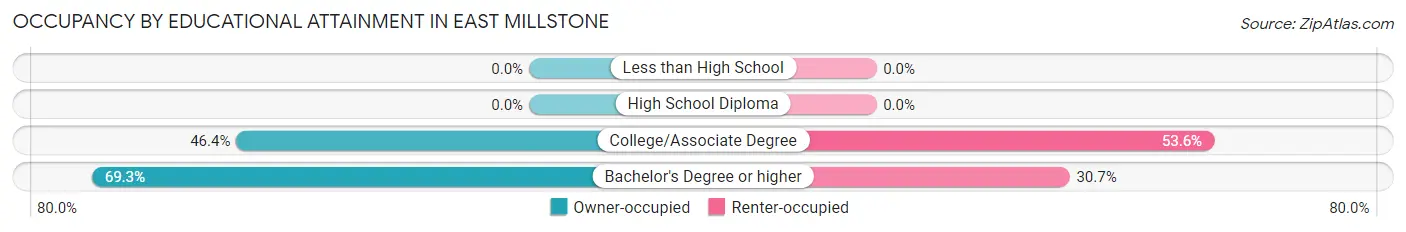
| Household Size | Owner-occupied | Renter-occupied |
| Less than High School | 0 (0.0%) | 0 (0.0%) |
| High School Diploma | 0 (0.0%) | 0 (0.0%) |
| College/Associate Degree | 26 (46.4%) | 30 (53.6%) |
| Bachelor's Degree or higher | 95 (69.3%) | 42 (30.7%) |
Occupancy by Age of Householder in East Millstone
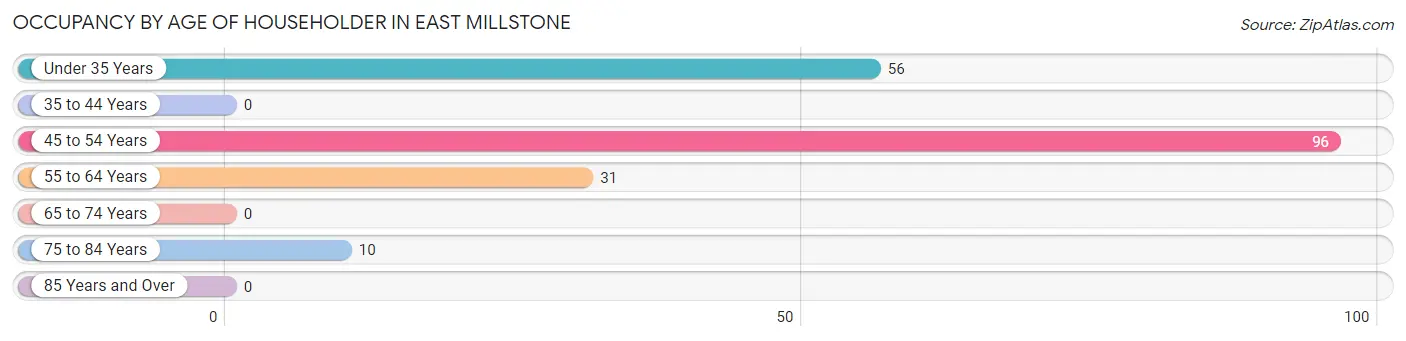
| Age Bracket | # Households | % Households |
| Under 35 Years | 56 | 29.0% |
| 35 to 44 Years | 0 | 0.0% |
| 45 to 54 Years | 96 | 49.7% |
| 55 to 64 Years | 31 | 16.1% |
| 65 to 74 Years | 0 | 0.0% |
| 75 to 84 Years | 10 | 5.2% |
| 85 Years and Over | 0 | 0.0% |
| Total | 193 | 100.0% |
Housing Finances in East Millstone
Median Income by Occupancy in East Millstone
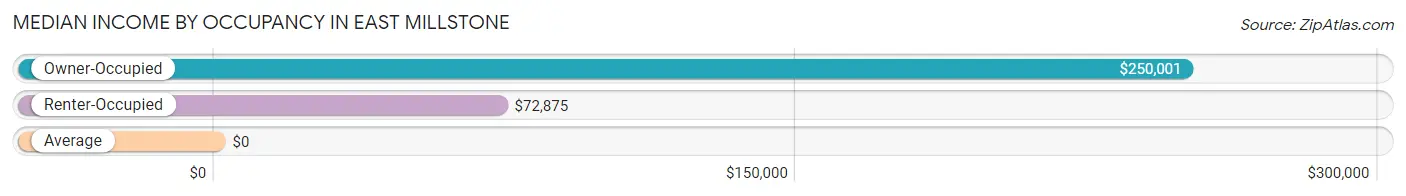
| Occupancy Type | # Households | Median Income |
| Owner-Occupied | 121 (62.7%) | $250,001 |
| Renter-Occupied | 72 (37.3%) | $72,875 |
| Average | 193 (100.0%) | $0 |
Occupancy by Householder Income Bracket in East Millstone
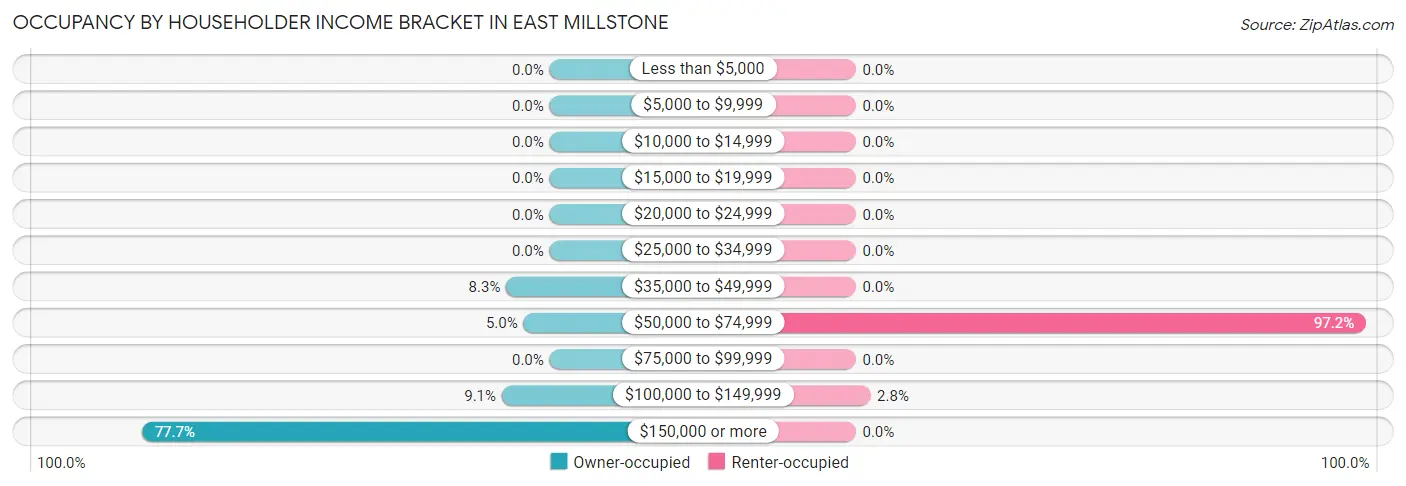
| Income Bracket | Owner-occupied | Renter-occupied |
| Less than $5,000 | 0 (0.0%) | 0 (0.0%) |
| $5,000 to $9,999 | 0 (0.0%) | 0 (0.0%) |
| $10,000 to $14,999 | 0 (0.0%) | 0 (0.0%) |
| $15,000 to $19,999 | 0 (0.0%) | 0 (0.0%) |
| $20,000 to $24,999 | 0 (0.0%) | 0 (0.0%) |
| $25,000 to $34,999 | 0 (0.0%) | 0 (0.0%) |
| $35,000 to $49,999 | 10 (8.3%) | 0 (0.0%) |
| $50,000 to $74,999 | 6 (5.0%) | 70 (97.2%) |
| $75,000 to $99,999 | 0 (0.0%) | 0 (0.0%) |
| $100,000 to $149,999 | 11 (9.1%) | 2 (2.8%) |
| $150,000 or more | 94 (77.7%) | 0 (0.0%) |
| Total | 121 (100.0%) | 72 (100.0%) |
Monthly Housing Cost Tiers in East Millstone
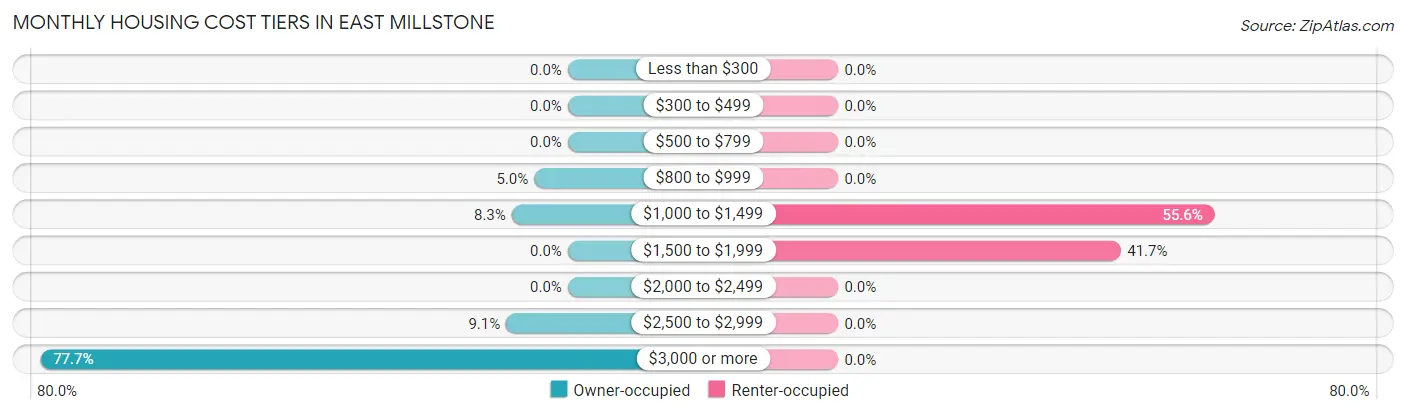
| Monthly Cost | Owner-occupied | Renter-occupied |
| Less than $300 | 0 (0.0%) | 0 (0.0%) |
| $300 to $499 | 0 (0.0%) | 0 (0.0%) |
| $500 to $799 | 0 (0.0%) | 0 (0.0%) |
| $800 to $999 | 6 (5.0%) | 0 (0.0%) |
| $1,000 to $1,499 | 10 (8.3%) | 40 (55.6%) |
| $1,500 to $1,999 | 0 (0.0%) | 30 (41.7%) |
| $2,000 to $2,499 | 0 (0.0%) | 0 (0.0%) |
| $2,500 to $2,999 | 11 (9.1%) | 0 (0.0%) |
| $3,000 or more | 94 (77.7%) | 0 (0.0%) |
| Total | 121 (100.0%) | 72 (100.0%) |
Physical Housing Characteristics in East Millstone
Housing Structures in East Millstone
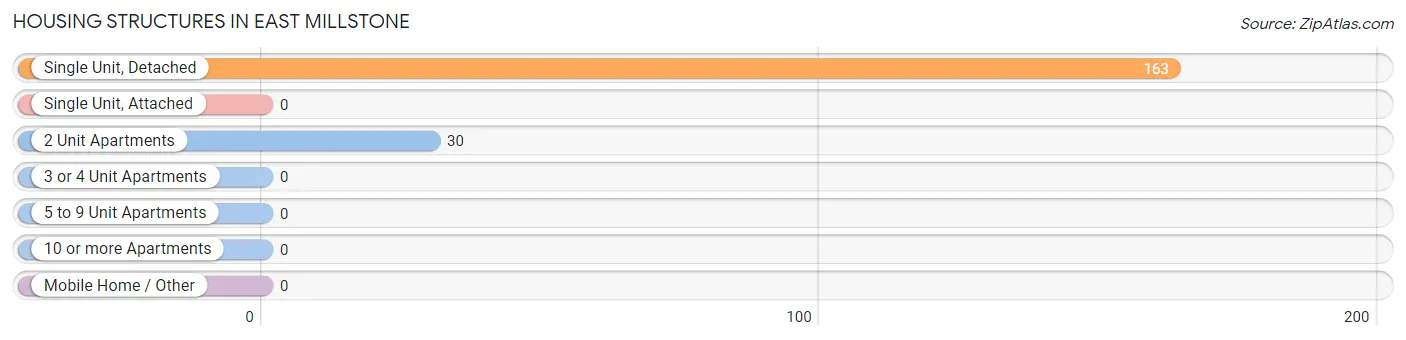
| Structure Type | # Housing Units | % Housing Units |
| Single Unit, Detached | 163 | 84.5% |
| Single Unit, Attached | 0 | 0.0% |
| 2 Unit Apartments | 30 | 15.5% |
| 3 or 4 Unit Apartments | 0 | 0.0% |
| 5 to 9 Unit Apartments | 0 | 0.0% |
| 10 or more Apartments | 0 | 0.0% |
| Mobile Home / Other | 0 | 0.0% |
| Total | 193 | 100.0% |
Housing Structures by Occupancy in East Millstone
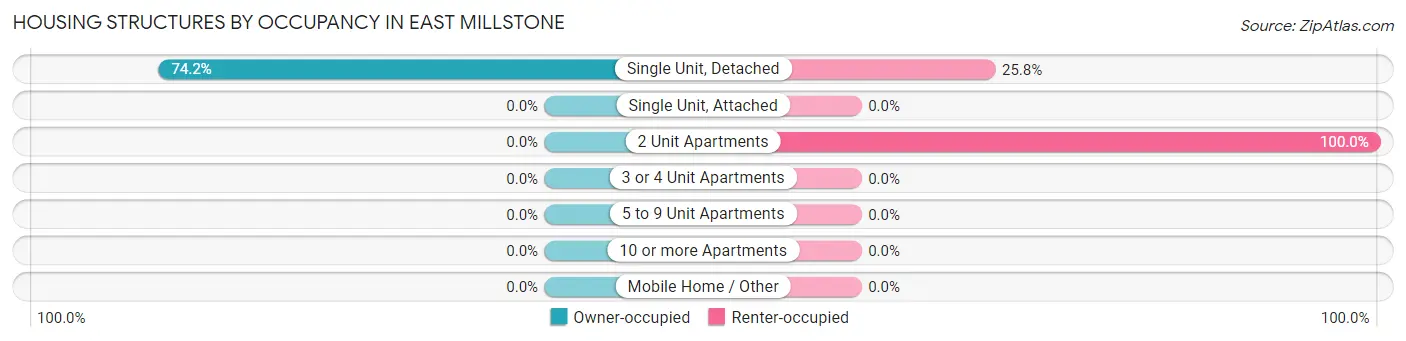
| Structure Type | Owner-occupied | Renter-occupied |
| Single Unit, Detached | 121 (74.2%) | 42 (25.8%) |
| Single Unit, Attached | 0 (0.0%) | 0 (0.0%) |
| 2 Unit Apartments | 0 (0.0%) | 30 (100.0%) |
| 3 or 4 Unit Apartments | 0 (0.0%) | 0 (0.0%) |
| 5 to 9 Unit Apartments | 0 (0.0%) | 0 (0.0%) |
| 10 or more Apartments | 0 (0.0%) | 0 (0.0%) |
| Mobile Home / Other | 0 (0.0%) | 0 (0.0%) |
| Total | 121 (62.7%) | 72 (37.3%) |
Housing Structures by Number of Rooms in East Millstone
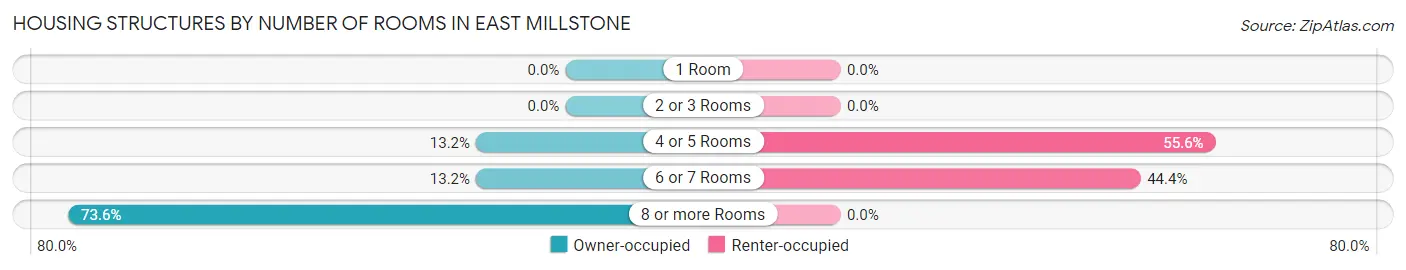
| Number of Rooms | Owner-occupied | Renter-occupied |
| 1 Room | 0 (0.0%) | 0 (0.0%) |
| 2 or 3 Rooms | 0 (0.0%) | 0 (0.0%) |
| 4 or 5 Rooms | 16 (13.2%) | 40 (55.6%) |
| 6 or 7 Rooms | 16 (13.2%) | 32 (44.4%) |
| 8 or more Rooms | 89 (73.6%) | 0 (0.0%) |
| Total | 121 (100.0%) | 72 (100.0%) |
Housing Structure by Heating Type in East Millstone
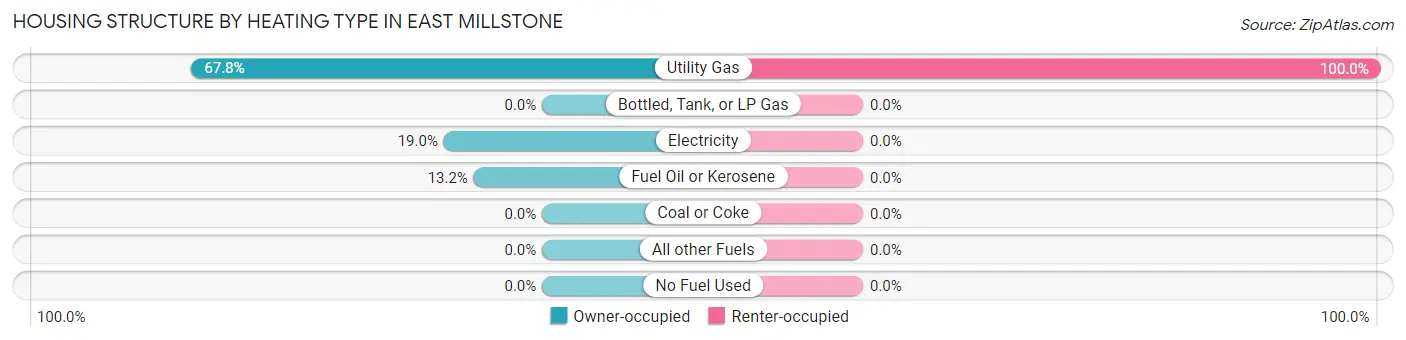
| Heating Type | Owner-occupied | Renter-occupied |
| Utility Gas | 82 (67.8%) | 72 (100.0%) |
| Bottled, Tank, or LP Gas | 0 (0.0%) | 0 (0.0%) |
| Electricity | 23 (19.0%) | 0 (0.0%) |
| Fuel Oil or Kerosene | 16 (13.2%) | 0 (0.0%) |
| Coal or Coke | 0 (0.0%) | 0 (0.0%) |
| All other Fuels | 0 (0.0%) | 0 (0.0%) |
| No Fuel Used | 0 (0.0%) | 0 (0.0%) |
| Total | 121 (100.0%) | 72 (100.0%) |
Household Vehicle Usage in East Millstone
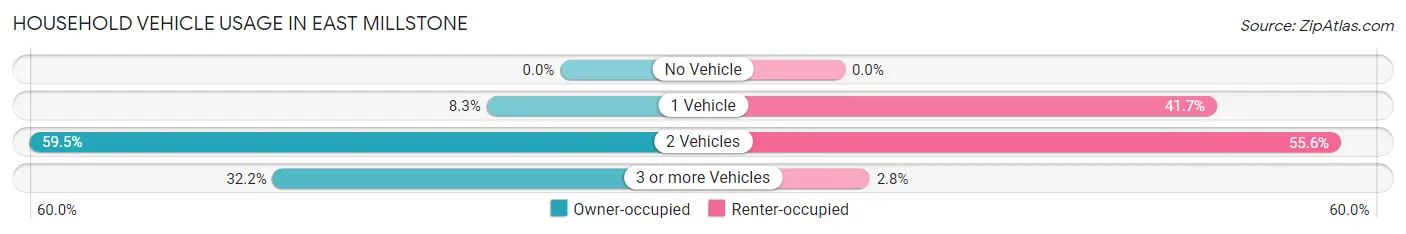
| Vehicles per Household | Owner-occupied | Renter-occupied |
| No Vehicle | 0 (0.0%) | 0 (0.0%) |
| 1 Vehicle | 10 (8.3%) | 30 (41.7%) |
| 2 Vehicles | 72 (59.5%) | 40 (55.6%) |
| 3 or more Vehicles | 39 (32.2%) | 2 (2.8%) |
| Total | 121 (100.0%) | 72 (100.0%) |
Real Estate & Mortgages in East Millstone
Real Estate and Mortgage Overview in East Millstone
| Characteristic | Without Mortgage | With Mortgage |
| Housing Units | 16 | 105 |
| Median Property Value | - | - |
| Median Household Income | - | - |
| Monthly Housing Costs | - | - |
| Real Estate Taxes | - | - |
Property Value by Mortgage Status in East Millstone
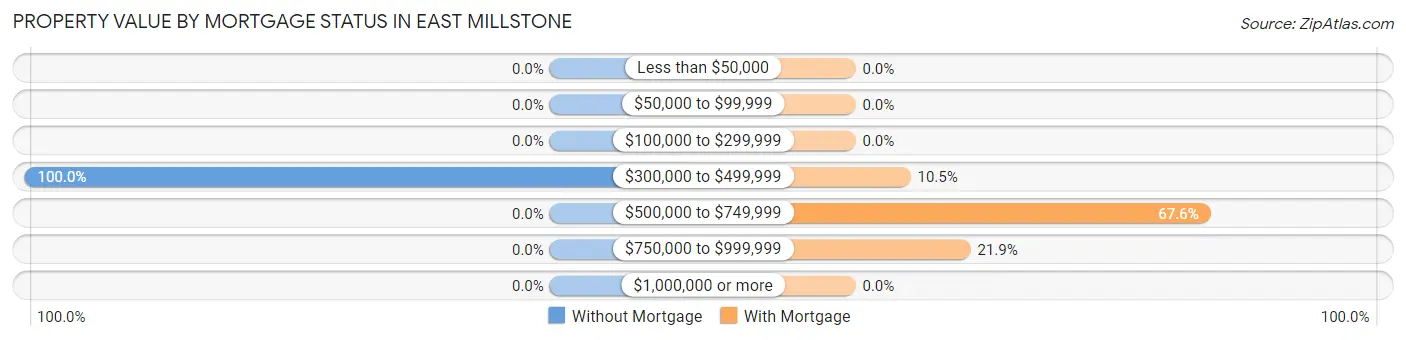
| Property Value | Without Mortgage | With Mortgage |
| Less than $50,000 | 0 (0.0%) | 0 (0.0%) |
| $50,000 to $99,999 | 0 (0.0%) | 0 (0.0%) |
| $100,000 to $299,999 | 0 (0.0%) | 0 (0.0%) |
| $300,000 to $499,999 | 16 (100.0%) | 11 (10.5%) |
| $500,000 to $749,999 | 0 (0.0%) | 71 (67.6%) |
| $750,000 to $999,999 | 0 (0.0%) | 23 (21.9%) |
| $1,000,000 or more | 0 (0.0%) | 0 (0.0%) |
| Total | 16 (100.0%) | 105 (100.0%) |
Household Income by Mortgage Status in East Millstone
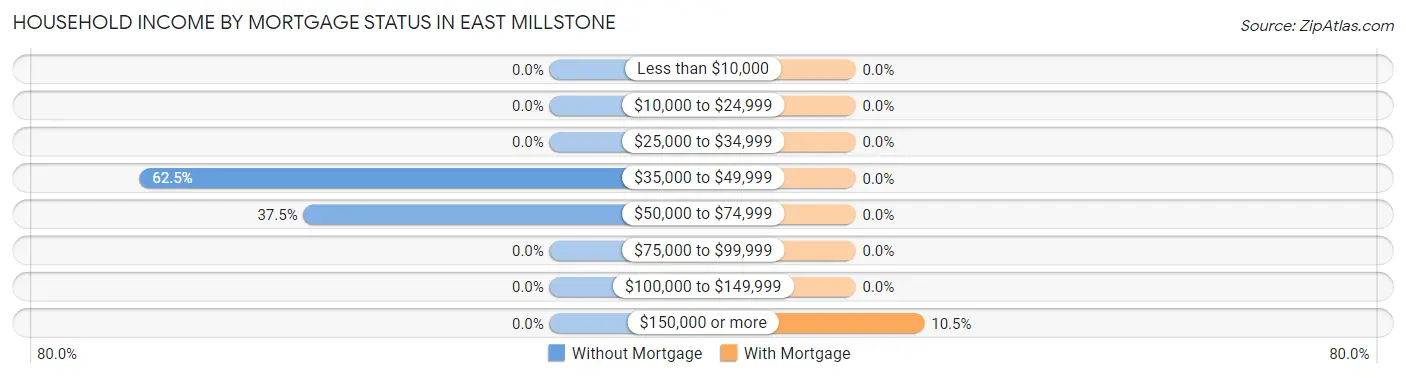
| Household Income | Without Mortgage | With Mortgage |
| Less than $10,000 | 0 (0.0%) | 0 (0.0%) |
| $10,000 to $24,999 | 0 (0.0%) | 0 (0.0%) |
| $25,000 to $34,999 | 0 (0.0%) | 0 (0.0%) |
| $35,000 to $49,999 | 10 (62.5%) | 0 (0.0%) |
| $50,000 to $74,999 | 6 (37.5%) | 0 (0.0%) |
| $75,000 to $99,999 | 0 (0.0%) | 0 (0.0%) |
| $100,000 to $149,999 | 0 (0.0%) | 0 (0.0%) |
| $150,000 or more | 0 (0.0%) | 11 (10.5%) |
| Total | 16 (100.0%) | 105 (100.0%) |
Property Value to Household Income Ratio in East Millstone
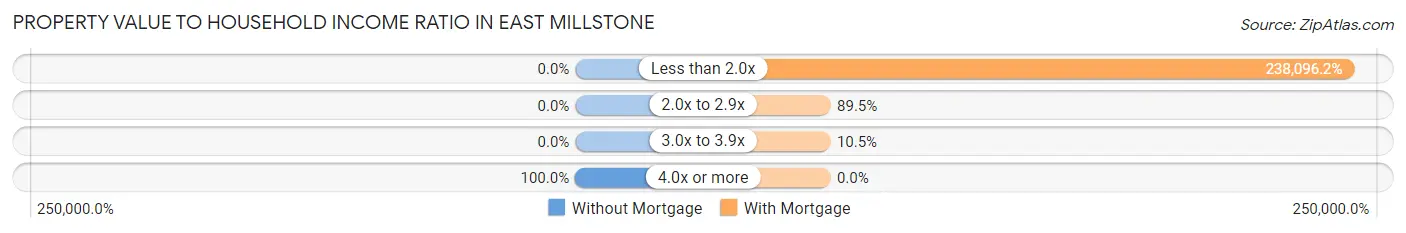
| Value-to-Income Ratio | Without Mortgage | With Mortgage |
| Less than 2.0x | 0 (0.0%) | 250,001 (238,096.2%) |
| 2.0x to 2.9x | 0 (0.0%) | 94 (89.5%) |
| 3.0x to 3.9x | 0 (0.0%) | 11 (10.5%) |
| 4.0x or more | 16 (100.0%) | 0 (0.0%) |
| Total | 16 (100.0%) | 105 (100.0%) |
Real Estate Taxes by Mortgage Status in East Millstone
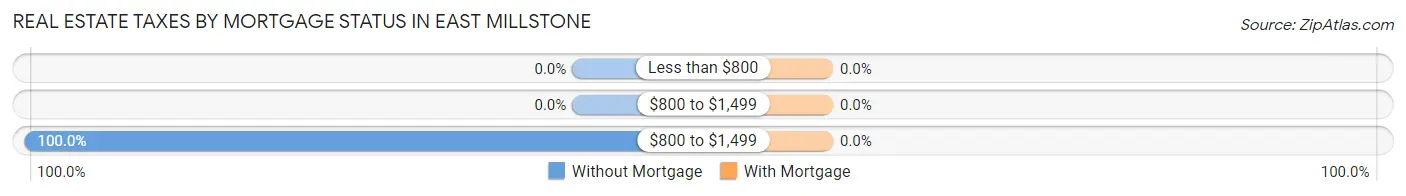
| Property Taxes | Without Mortgage | With Mortgage |
| Less than $800 | 0 (0.0%) | 0 (0.0%) |
| $800 to $1,499 | 0 (0.0%) | 0 (0.0%) |
| $800 to $1,499 | 16 (100.0%) | 0 (0.0%) |
| Total | 16 (100.0%) | 105 (100.0%) |
Health & Disability in East Millstone
Health Insurance Coverage by Age in East Millstone
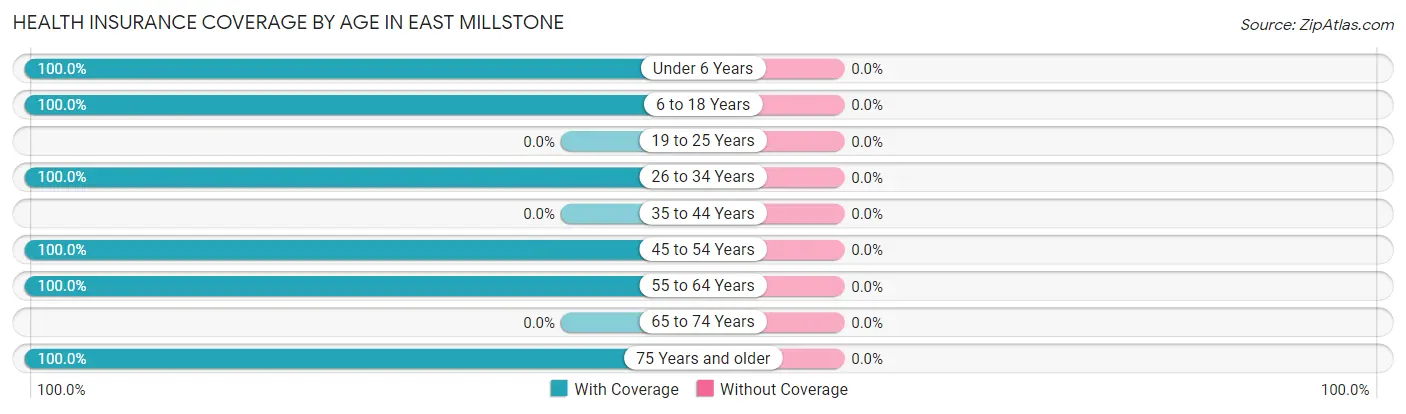
| Age Bracket | With Coverage | Without Coverage |
| Under 6 Years | 88 (100.0%) | 0 (0.0%) |
| 6 to 18 Years | 62 (100.0%) | 0 (0.0%) |
| 19 to 25 Years | 0 (0.0%) | 0 (0.0%) |
| 26 to 34 Years | 144 (100.0%) | 0 (0.0%) |
| 35 to 44 Years | 0 (0.0%) | 0 (0.0%) |
| 45 to 54 Years | 187 (100.0%) | 0 (0.0%) |
| 55 to 64 Years | 50 (100.0%) | 0 (0.0%) |
| 65 to 74 Years | 0 (0.0%) | 0 (0.0%) |
| 75 Years and older | 10 (100.0%) | 0 (0.0%) |
| Total | 541 (100.0%) | 0 (0.0%) |
Health Insurance Coverage by Citizenship Status in East Millstone
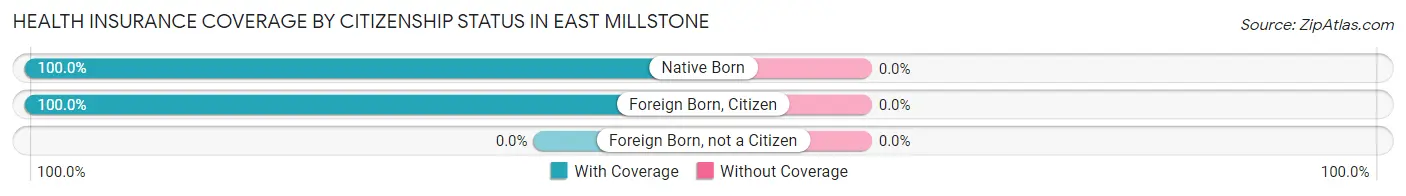
| Citizenship Status | With Coverage | Without Coverage |
| Native Born | 88 (100.0%) | 0 (0.0%) |
| Foreign Born, Citizen | 62 (100.0%) | 0 (0.0%) |
| Foreign Born, not a Citizen | 0 (0.0%) | 0 (0.0%) |
Health Insurance Coverage by Household Income in East Millstone
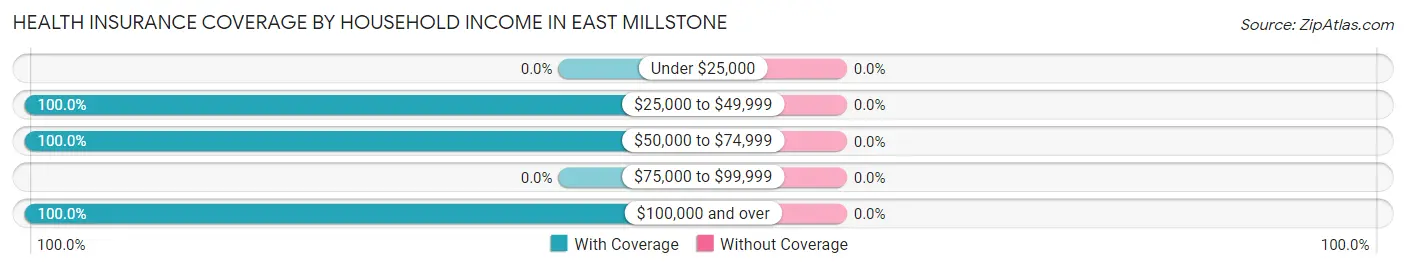
| Household Income | With Coverage | Without Coverage |
| Under $25,000 | 0 (0.0%) | 0 (0.0%) |
| $25,000 to $49,999 | 10 (100.0%) | 0 (0.0%) |
| $50,000 to $74,999 | 152 (100.0%) | 0 (0.0%) |
| $75,000 to $99,999 | 0 (0.0%) | 0 (0.0%) |
| $100,000 and over | 379 (100.0%) | 0 (0.0%) |
Public vs Private Health Insurance Coverage by Age in East Millstone
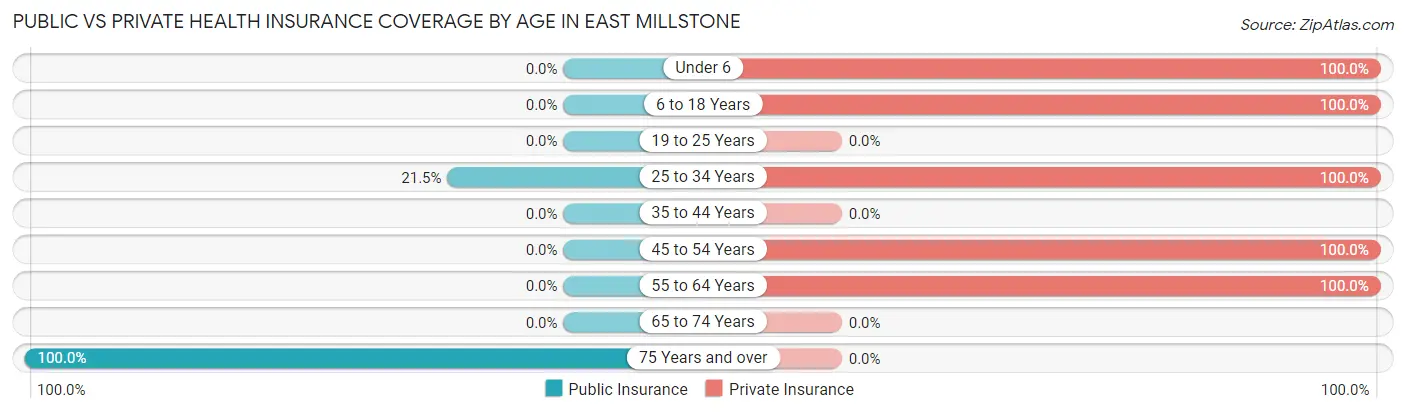
| Age Bracket | Public Insurance | Private Insurance |
| Under 6 | 0 (0.0%) | 88 (100.0%) |
| 6 to 18 Years | 0 (0.0%) | 62 (100.0%) |
| 19 to 25 Years | 0 (0.0%) | 0 (0.0%) |
| 25 to 34 Years | 31 (21.5%) | 144 (100.0%) |
| 35 to 44 Years | 0 (0.0%) | 0 (0.0%) |
| 45 to 54 Years | 0 (0.0%) | 187 (100.0%) |
| 55 to 64 Years | 0 (0.0%) | 50 (100.0%) |
| 65 to 74 Years | 0 (0.0%) | 0 (0.0%) |
| 75 Years and over | 10 (100.0%) | 0 (0.0%) |
| Total | 41 (7.6%) | 531 (98.2%) |
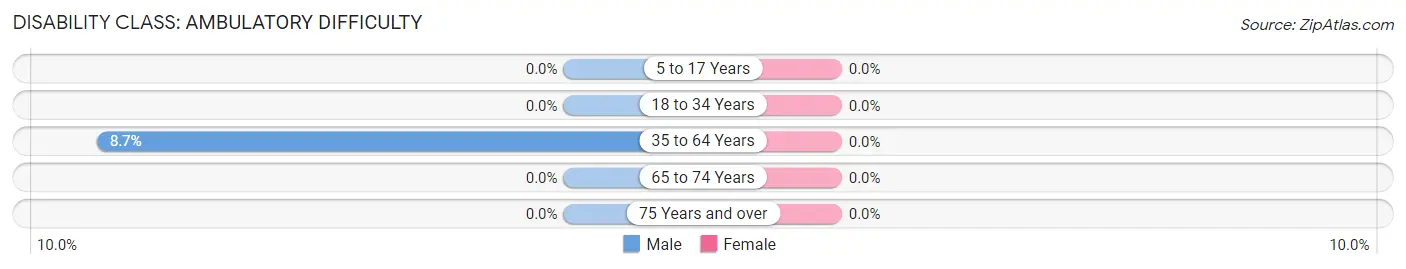
Disability Status by Sex by Age in East Millstone
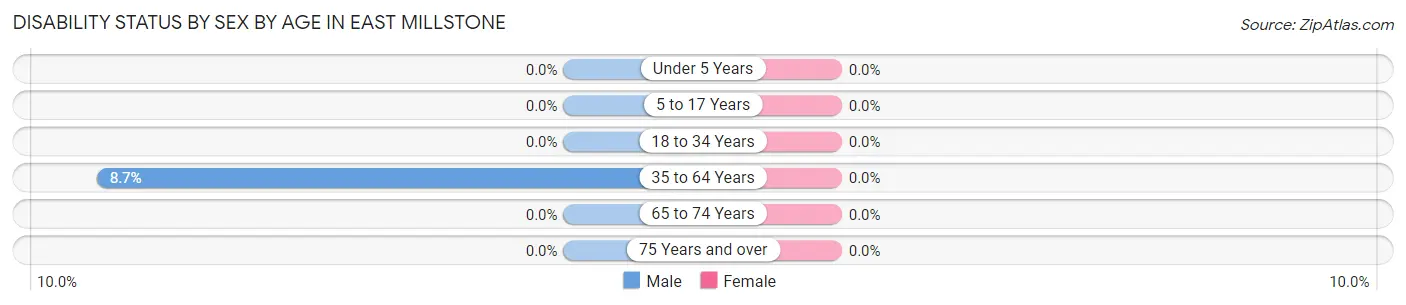
| Age Bracket | Male | Female |
| Under 5 Years | 0 (0.0%) | 0 (0.0%) |
| 5 to 17 Years | 0 (0.0%) | 0 (0.0%) |
| 18 to 34 Years | 0 (0.0%) | 0 (0.0%) |
| 35 to 64 Years | 11 (8.7%) | 0 (0.0%) |
| 65 to 74 Years | 0 (0.0%) | 0 (0.0%) |
| 75 Years and over | 0 (0.0%) | 0 (0.0%) |
Disability Class by Sex by Age in East Millstone
Disability Class: Hearing Difficulty
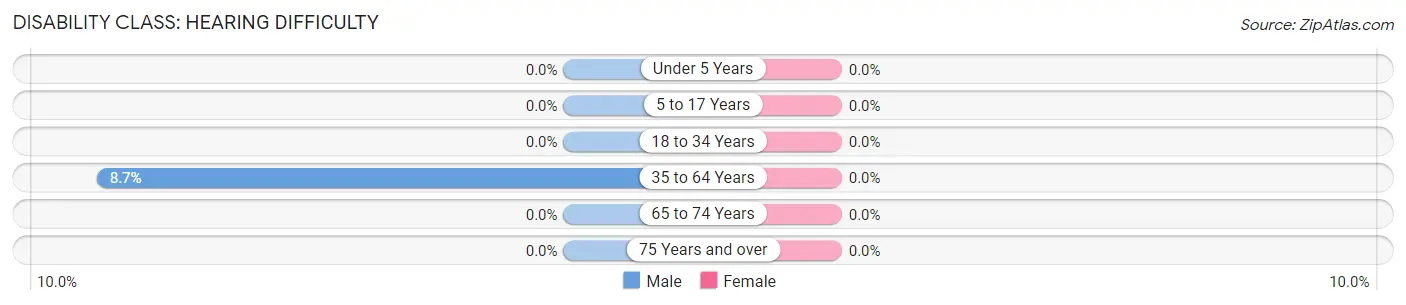
| Age Bracket | Male | Female |
| Under 5 Years | 0 (0.0%) | 0 (0.0%) |
| 5 to 17 Years | 0 (0.0%) | 0 (0.0%) |
| 18 to 34 Years | 0 (0.0%) | 0 (0.0%) |
| 35 to 64 Years | 11 (8.7%) | 0 (0.0%) |
| 65 to 74 Years | 0 (0.0%) | 0 (0.0%) |
| 75 Years and over | 0 (0.0%) | 0 (0.0%) |
Disability Class: Vision Difficulty
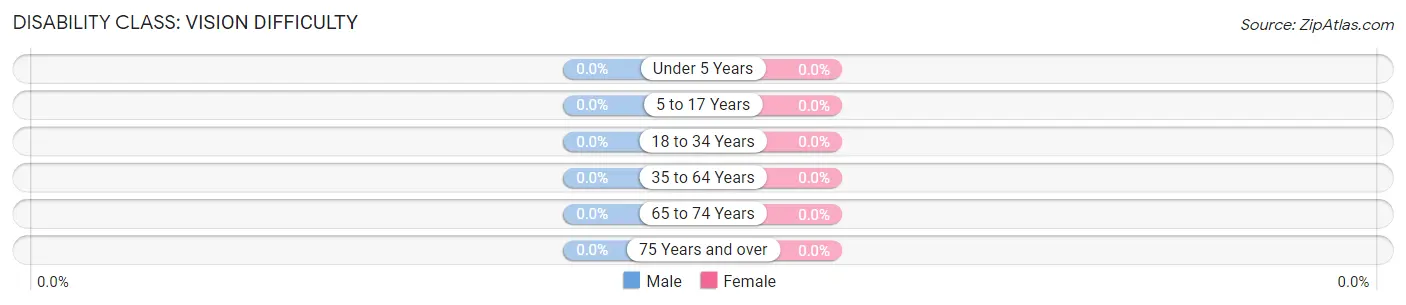
| Age Bracket | Male | Female |
| Under 5 Years | 0 (0.0%) | 0 (0.0%) |
| 5 to 17 Years | 0 (0.0%) | 0 (0.0%) |
| 18 to 34 Years | 0 (0.0%) | 0 (0.0%) |
| 35 to 64 Years | 0 (0.0%) | 0 (0.0%) |
| 65 to 74 Years | 0 (0.0%) | 0 (0.0%) |
| 75 Years and over | 0 (0.0%) | 0 (0.0%) |
Disability Class: Cognitive Difficulty
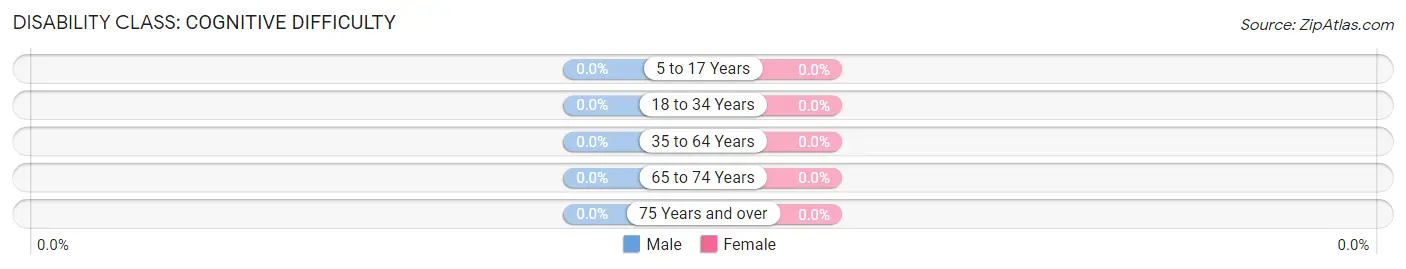
| Age Bracket | Male | Female |
| 5 to 17 Years | 0 (0.0%) | 0 (0.0%) |
| 18 to 34 Years | 0 (0.0%) | 0 (0.0%) |
| 35 to 64 Years | 0 (0.0%) | 0 (0.0%) |
| 65 to 74 Years | 0 (0.0%) | 0 (0.0%) |
| 75 Years and over | 0 (0.0%) | 0 (0.0%) |
Disability Class: Ambulatory Difficulty
| Age Bracket | Male | Female |
| 5 to 17 Years | 0 (0.0%) | 0 (0.0%) |
| 18 to 34 Years | 0 (0.0%) | 0 (0.0%) |
| 35 to 64 Years | 11 (8.7%) | 0 (0.0%) |
| 65 to 74 Years | 0 (0.0%) | 0 (0.0%) |
| 75 Years and over | 0 (0.0%) | 0 (0.0%) |
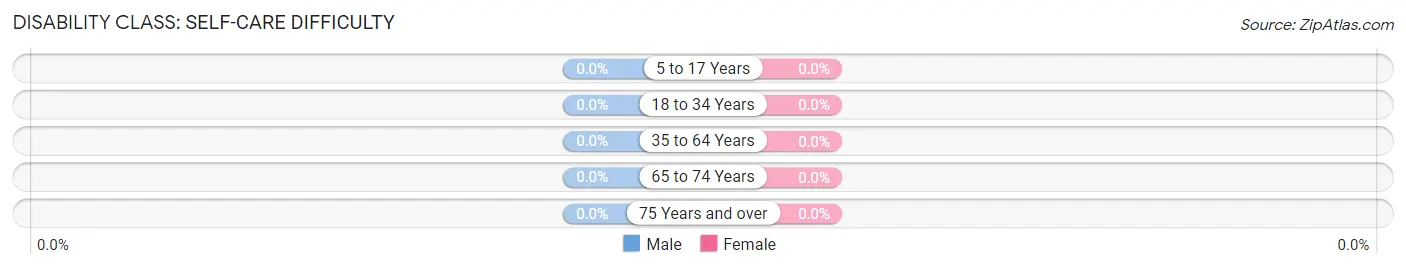
Disability Class: Self-Care Difficulty
| Age Bracket | Male | Female |
| 5 to 17 Years | 0 (0.0%) | 0 (0.0%) |
| 18 to 34 Years | 0 (0.0%) | 0 (0.0%) |
| 35 to 64 Years | 0 (0.0%) | 0 (0.0%) |
| 65 to 74 Years | 0 (0.0%) | 0 (0.0%) |
| 75 Years and over | 0 (0.0%) | 0 (0.0%) |
Technology Access in East Millstone
Computing Device Access in East Millstone
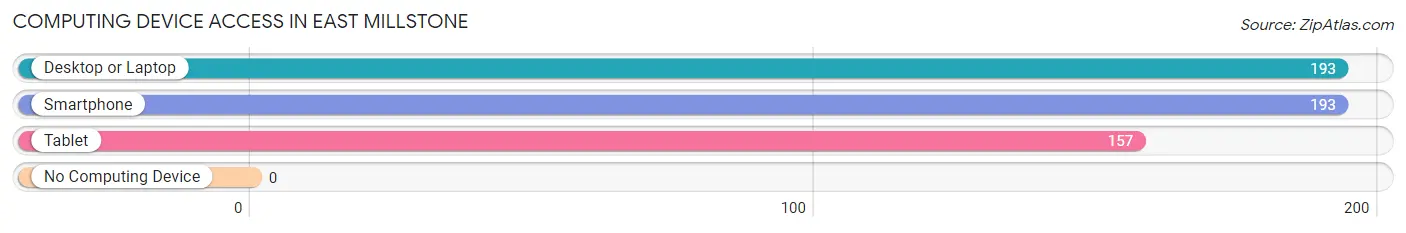
| Device Type | # Households | % Households |
| Desktop or Laptop | 193 | 100.0% |
| Smartphone | 193 | 100.0% |
| Tablet | 157 | 81.4% |
| No Computing Device | 0 | 0.0% |
| Total | 193 | 100.0% |
Internet Access in East Millstone
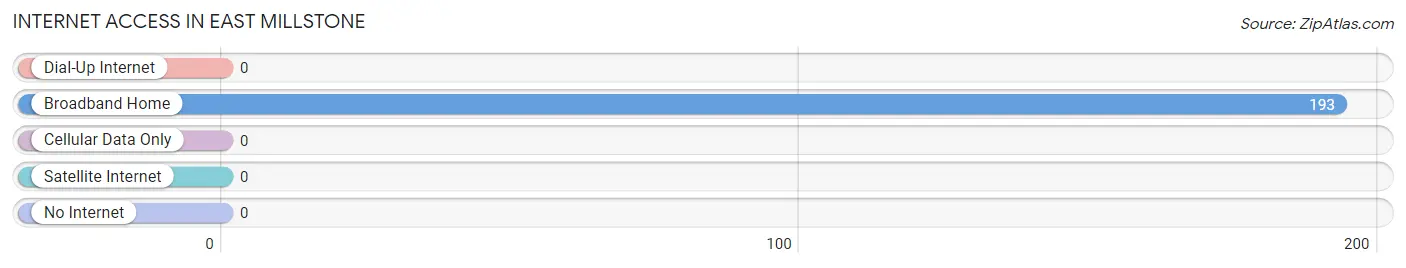
| Internet Type | # Households | % Households |
| Dial-Up Internet | 0 | 0.0% |
| Broadband Home | 193 | 100.0% |
| Cellular Data Only | 0 | 0.0% |
| Satellite Internet | 0 | 0.0% |
| No Internet | 0 | 0.0% |
| Total | 193 | 100.0% |
East Millstone Summary
History
East Millstone is a small unincorporated community located in Somerset County, New Jersey. It is located within Franklin Township, and is situated along the Millstone River. The area was first settled in the late 1700s by Dutch and German immigrants, and the community was officially established in 1845. The name “East Millstone” was derived from the nearby Millstone River, which was used to power several mills in the area.
The area was primarily agricultural in the 19th century, with many of the residents working in the local mills. The area was also home to several small businesses, including a blacksmith, a general store, and a post office. In the early 20th century, the area began to experience a population boom as more people moved to the area to take advantage of the growing industrial economy.
Geography
East Millstone is located in Somerset County, New Jersey. It is situated along the Millstone River, and is bordered by Franklin Township to the north, Manville to the east, and Hillsborough Township to the south. The area is mostly flat, with some rolling hills in the northern part of the community. The climate is humid subtropical, with hot, humid summers and cold, wet winters.
Economy
East Millstone’s economy is primarily based on agriculture and light industry. The area is home to several small businesses, including a general store, a post office, and a few restaurants. The area is also home to several industrial parks, which provide employment opportunities for local residents.
Demographics
As of the 2010 census, the population of East Millstone was 2,845. The racial makeup of the community was 87.3% White, 8.2% African American, 0.7% Asian, and 3.8% from other races. The median household income was $68,958, and the median family income was $76,958. The per capita income was $30,958. The unemployment rate was 5.2%.
Conclusion
East Millstone is a small unincorporated community located in Somerset County, New Jersey. It is situated along the Millstone River, and is bordered by Franklin Township to the north, Manville to the east, and Hillsborough Township to the south. The area was first settled in the late 1700s by Dutch and German immigrants, and the community was officially established in 1845. The economy of East Millstone is primarily based on agriculture and light industry, and the area is home to several small businesses. As of the 2010 census, the population of East Millstone was 2,845, and the median household income was $68,958.
Common Questions
What is Per Capita Income in East Millstone?
Per Capita income in East Millstone is $152,756.
What is the Median Family Income in East Millstone?
Median Family Income in East Millstone is $250,001.
What is Inequality or Gini Index in East Millstone?
Inequality or Gini Index in East Millstone is 0.50.
What is the Total Population of East Millstone?
Total Population of East Millstone is 541.
What is the Total Male Population of East Millstone?
Total Male Population of East Millstone is 278.
What is the Total Female Population of East Millstone?
Total Female Population of East Millstone is 263.
What is the Ratio of Males per 100 Females in East Millstone?
There are 105.70 Males per 100 Females in East Millstone.
What is the Ratio of Females per 100 Males in East Millstone?
There are 94.60 Females per 100 Males in East Millstone.
What is the Median Population Age in East Millstone?
Median Population Age in East Millstone is 31.8 Years.
What is the Average Family Size in East Millstone
Average Family Size in East Millstone is 3.4 People.
What is the Average Household Size in East Millstone
Average Household Size in East Millstone is 2.8 People.
How Large is the Labor Force in East Millstone?
There are 358 People in the Labor Forcein in East Millstone.
What is the Percentage of People in the Labor Force in East Millstone?
91.6% of People are in the Labor Force in East Millstone.