Stone Harbor borough, NJ Map & Demographics
Stone Harbor borough Overview
$123,693
PER CAPITA INCOME
$194,583
AVG FAMILY INCOME
$130,000
AVG HOUSEHOLD INCOME
66.4%
WAGE / INCOME GAP [ % ]
33.6¢/ $1
WAGE / INCOME GAP [ $ ]
0.56
INEQUALITY / GINI INDEX
887
TOTAL POPULATION
404
MALE POPULATION
483
FEMALE POPULATION
83.64
MALES / 100 FEMALES
119.55
FEMALES / 100 MALES
65.7
MEDIAN AGE
2.3
AVG FAMILY SIZE
1.8
AVG HOUSEHOLD SIZE
378
LABOR FORCE [ PEOPLE ]
43.8%
PERCENT IN LABOR FORCE
3.6%
UNEMPLOYMENT RATE
Income in Stone Harbor borough
Income Overview in Stone Harbor borough
Per Capita Income in Stone Harbor borough is $123,693, while median incomes of families and households are $194,583 and $130,000 respectively.
| Characteristic | Number | Measure |
| Per Capita Income | 887 | $123,693 |
| Median Family Income | 289 | $194,583 |
| Mean Family Income | 289 | $274,765 |
| Median Household Income | 488 | $130,000 |
| Mean Household Income | 488 | $231,245 |
| Income Deficit | 289 | $0 |
| Wage / Income Gap (%) | 887 | 66.38% |
| Wage / Income Gap ($) | 887 | 33.62¢ per $1 |
| Gini / Inequality Index | 887 | 0.56 |
Earnings by Sex in Stone Harbor borough
Average Earnings in Stone Harbor borough are $57,361, $86,250 for men and $29,000 for women, a difference of 66.4%.
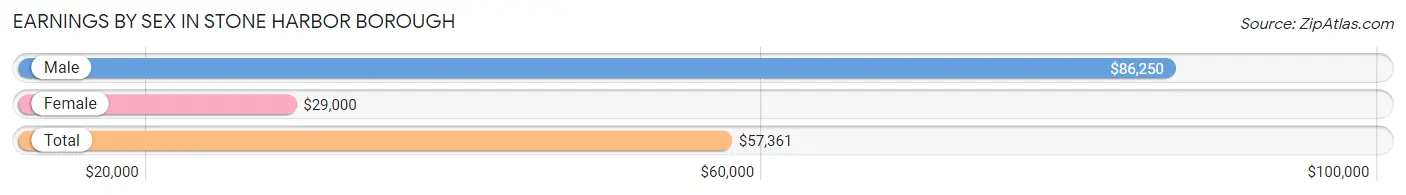
| Sex | Number | Average Earnings |
| Male | 222 (54.1%) | $86,250 |
| Female | 188 (45.9%) | $29,000 |
| Total | 410 (100.0%) | $57,361 |
Earnings by Sex by Income Bracket in Stone Harbor borough
The most common earnings brackets in Stone Harbor borough are $100,000+ for men (105 | 47.3%) and $75,000 to $99,999 for women (33 | 17.5%).
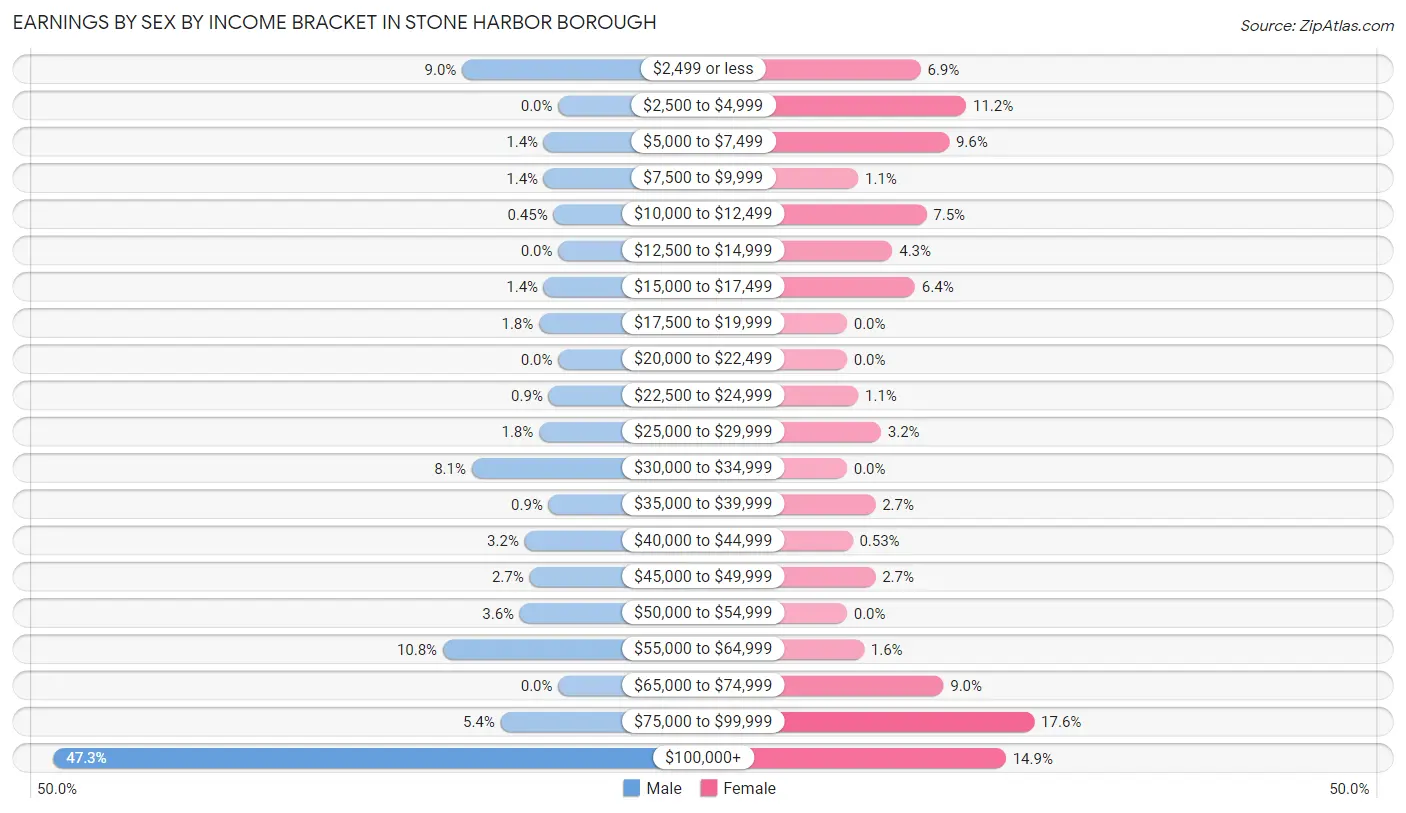
| Income | Male | Female |
| $2,499 or less | 20 (9.0%) | 13 (6.9%) |
| $2,500 to $4,999 | 0 (0.0%) | 21 (11.2%) |
| $5,000 to $7,499 | 3 (1.3%) | 18 (9.6%) |
| $7,500 to $9,999 | 3 (1.3%) | 2 (1.1%) |
| $10,000 to $12,499 | 1 (0.4%) | 14 (7.4%) |
| $12,500 to $14,999 | 0 (0.0%) | 8 (4.3%) |
| $15,000 to $17,499 | 3 (1.3%) | 12 (6.4%) |
| $17,500 to $19,999 | 4 (1.8%) | 0 (0.0%) |
| $20,000 to $22,499 | 0 (0.0%) | 0 (0.0%) |
| $22,500 to $24,999 | 2 (0.9%) | 2 (1.1%) |
| $25,000 to $29,999 | 4 (1.8%) | 6 (3.2%) |
| $30,000 to $34,999 | 18 (8.1%) | 0 (0.0%) |
| $35,000 to $39,999 | 2 (0.9%) | 5 (2.7%) |
| $40,000 to $44,999 | 7 (3.2%) | 1 (0.5%) |
| $45,000 to $49,999 | 6 (2.7%) | 5 (2.7%) |
| $50,000 to $54,999 | 8 (3.6%) | 0 (0.0%) |
| $55,000 to $64,999 | 24 (10.8%) | 3 (1.6%) |
| $65,000 to $74,999 | 0 (0.0%) | 17 (9.0%) |
| $75,000 to $99,999 | 12 (5.4%) | 33 (17.5%) |
| $100,000+ | 105 (47.3%) | 28 (14.9%) |
| Total | 222 (100.0%) | 188 (100.0%) |
Earnings by Sex by Educational Attainment in Stone Harbor borough
Average earnings in Stone Harbor borough are $143,750 for men and $49,500 for women, a difference of 65.6%. Men with an educational attainment of bachelor's degree enjoy the highest average annual earnings of $250,001, while those with high school diploma education earn the least with $32,321. Women with an educational attainment of graduate degree earn the most with the average annual earnings of $73,281, while those with college or associate's degree education have the smallest earnings of $11,250.
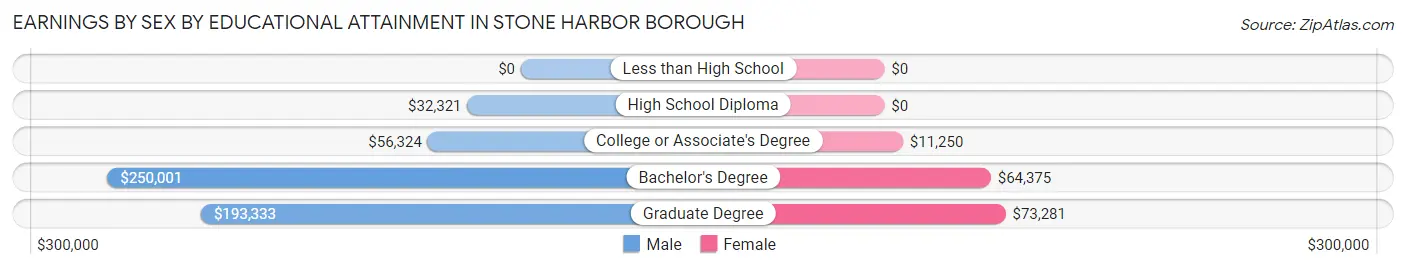
| Educational Attainment | Male Income | Female Income |
| Less than High School | - | - |
| High School Diploma | $32,321 | $0 |
| College or Associate's Degree | $56,324 | $11,250 |
| Bachelor's Degree | $250,001 | $64,375 |
| Graduate Degree | $193,333 | $73,281 |
| Total | $143,750 | $49,500 |
Family Income in Stone Harbor borough
Family Income Brackets in Stone Harbor borough
According to the Stone Harbor borough family income data, there are 141 families falling into the $200,000+ income range, which is the most common income bracket and makes up 48.8% of all families.
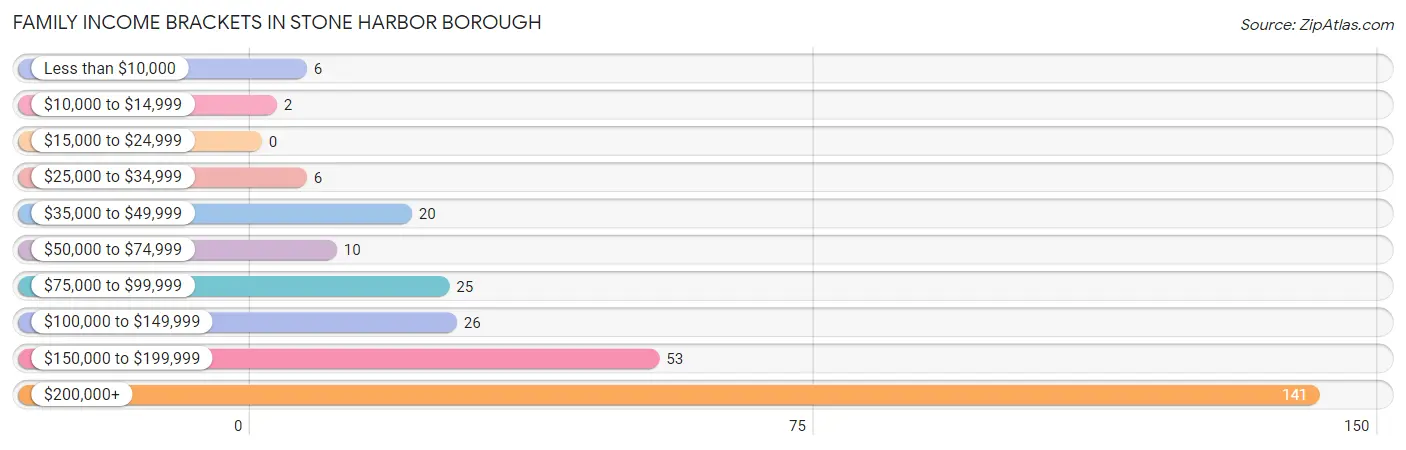
| Income Bracket | # Families | % Families |
| Less than $10,000 | 6 | 2.1% |
| $10,000 to $14,999 | 2 | 0.7% |
| $15,000 to $24,999 | 0 | 0.0% |
| $25,000 to $34,999 | 6 | 2.1% |
| $35,000 to $49,999 | 20 | 6.9% |
| $50,000 to $74,999 | 10 | 3.5% |
| $75,000 to $99,999 | 25 | 8.7% |
| $100,000 to $149,999 | 26 | 9.0% |
| $150,000 to $199,999 | 53 | 18.3% |
| $200,000+ | 141 | 48.8% |
Family Income by Famaliy Size in Stone Harbor borough
4-person families (6 | 2.1%) account for the highest median family income in Stone Harbor borough with $250,001 per family, while 2-person families (213 | 73.7%) have the highest median income of $121,875 per family member.
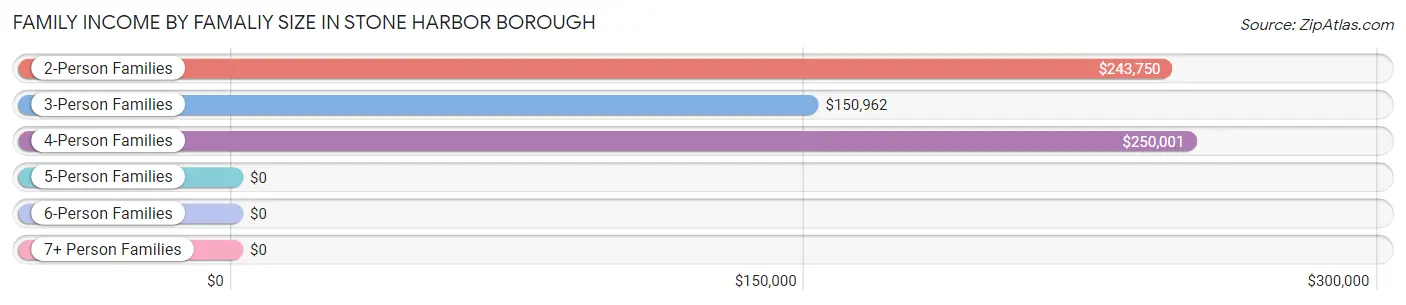
| Income Bracket | # Families | Median Income |
| 2-Person Families | 213 (73.7%) | $243,750 |
| 3-Person Families | 56 (19.4%) | $150,962 |
| 4-Person Families | 6 (2.1%) | $250,001 |
| 5-Person Families | 6 (2.1%) | $0 |
| 6-Person Families | 8 (2.8%) | $0 |
| 7+ Person Families | 0 (0.0%) | $0 |
| Total | 289 (100.0%) | $194,583 |
Family Income by Number of Earners in Stone Harbor borough
The median family income in Stone Harbor borough is $194,583, with families comprising 2 earners (98) having the highest median family income of $250,001, while families with no earners (100) have the lowest median family income of $157,500, accounting for 33.9% and 34.6% of families, respectively.
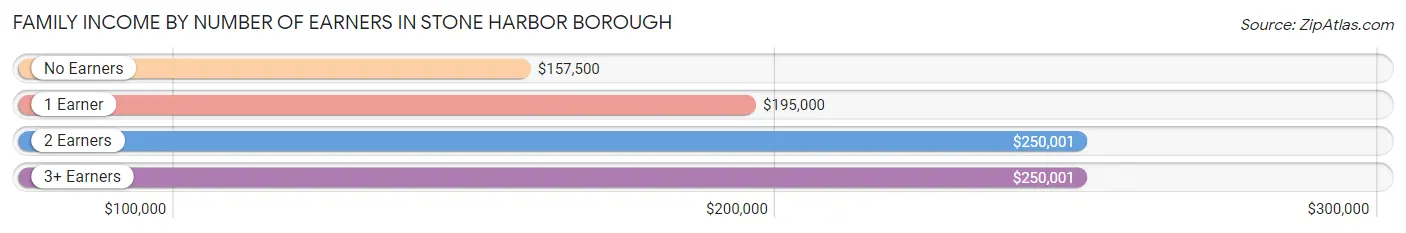
| Number of Earners | # Families | Median Income |
| No Earners | 100 (34.6%) | $157,500 |
| 1 Earner | 82 (28.4%) | $195,000 |
| 2 Earners | 98 (33.9%) | $250,001 |
| 3+ Earners | 9 (3.1%) | $250,001 |
| Total | 289 (100.0%) | $194,583 |
Household Income in Stone Harbor borough
Household Income Brackets in Stone Harbor borough
With 171 households falling in the category, the $200,000+ income range is the most frequent in Stone Harbor borough, accounting for 35.0% of all households. In contrast, only 7 households (1.4%) fall into the $10,000 to $14,999 income bracket, making it the least populous group.
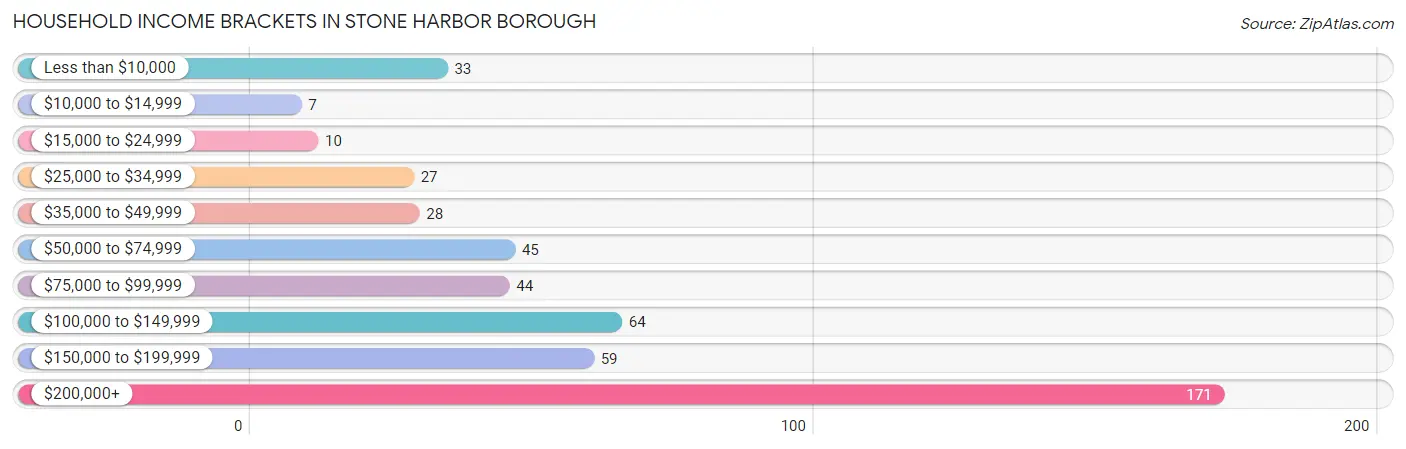
| Income Bracket | # Households | % Households |
| Less than $10,000 | 33 | 6.8% |
| $10,000 to $14,999 | 7 | 1.4% |
| $15,000 to $24,999 | 10 | 2.0% |
| $25,000 to $34,999 | 27 | 5.5% |
| $35,000 to $49,999 | 28 | 5.7% |
| $50,000 to $74,999 | 45 | 9.2% |
| $75,000 to $99,999 | 44 | 9.0% |
| $100,000 to $149,999 | 64 | 13.1% |
| $150,000 to $199,999 | 59 | 12.1% |
| $200,000+ | 171 | 35.0% |
Household Income by Householder Age in Stone Harbor borough
The median household income in Stone Harbor borough is $130,000, with the highest median household income of $249,688 found in the 45 to 64 years age bracket for the primary householder. A total of 130 households (26.6%) fall into this category. Meanwhile, the 15 to 24 years age bracket for the primary householder has the lowest median household income of $0, with 17 households (3.5%) in this group.
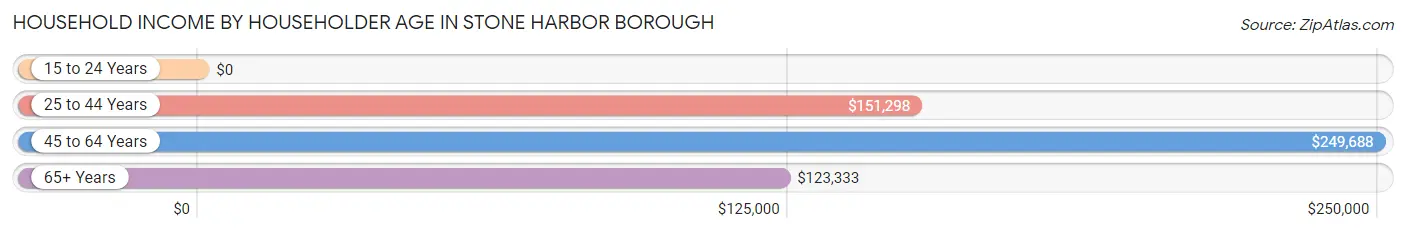
| Income Bracket | # Households | Median Income |
| 15 to 24 Years | 17 (3.5%) | $0 |
| 25 to 44 Years | 45 (9.2%) | $151,298 |
| 45 to 64 Years | 130 (26.6%) | $249,688 |
| 65+ Years | 296 (60.7%) | $123,333 |
| Total | 488 (100.0%) | $130,000 |
Poverty in Stone Harbor borough
Income Below Poverty by Sex and Age in Stone Harbor borough
With 6.4% poverty level for males and 6.4% for females among the residents of Stone Harbor borough, 12 to 14 year old males and 35 to 44 year old females are the most vulnerable to poverty, with 3 males (100.0%) and 5 females (35.7%) in their respective age groups living below the poverty level.
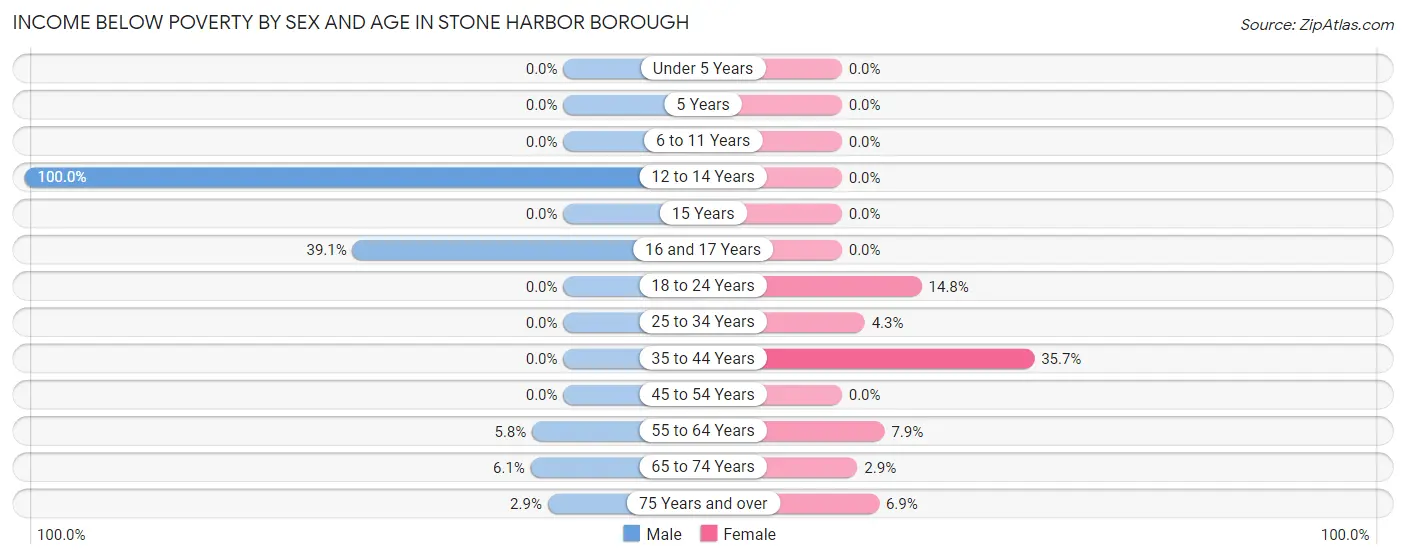
| Age Bracket | Male | Female |
| Under 5 Years | 0 (0.0%) | 0 (0.0%) |
| 5 Years | 0 (0.0%) | 0 (0.0%) |
| 6 to 11 Years | 0 (0.0%) | 0 (0.0%) |
| 12 to 14 Years | 3 (100.0%) | 0 (0.0%) |
| 15 Years | 0 (0.0%) | 0 (0.0%) |
| 16 and 17 Years | 9 (39.1%) | 0 (0.0%) |
| 18 to 24 Years | 0 (0.0%) | 4 (14.8%) |
| 25 to 34 Years | 0 (0.0%) | 2 (4.3%) |
| 35 to 44 Years | 0 (0.0%) | 5 (35.7%) |
| 45 to 54 Years | 0 (0.0%) | 0 (0.0%) |
| 55 to 64 Years | 4 (5.8%) | 8 (7.9%) |
| 65 to 74 Years | 8 (6.1%) | 4 (2.9%) |
| 75 Years and over | 2 (2.9%) | 8 (6.9%) |
| Total | 26 (6.4%) | 31 (6.4%) |
Income Above Poverty by Sex and Age in Stone Harbor borough
According to the poverty statistics in Stone Harbor borough, males aged 18 to 24 years and females aged under 5 years are the age groups that are most secure financially, with 100.0% of males and 100.0% of females in these age groups living above the poverty line.
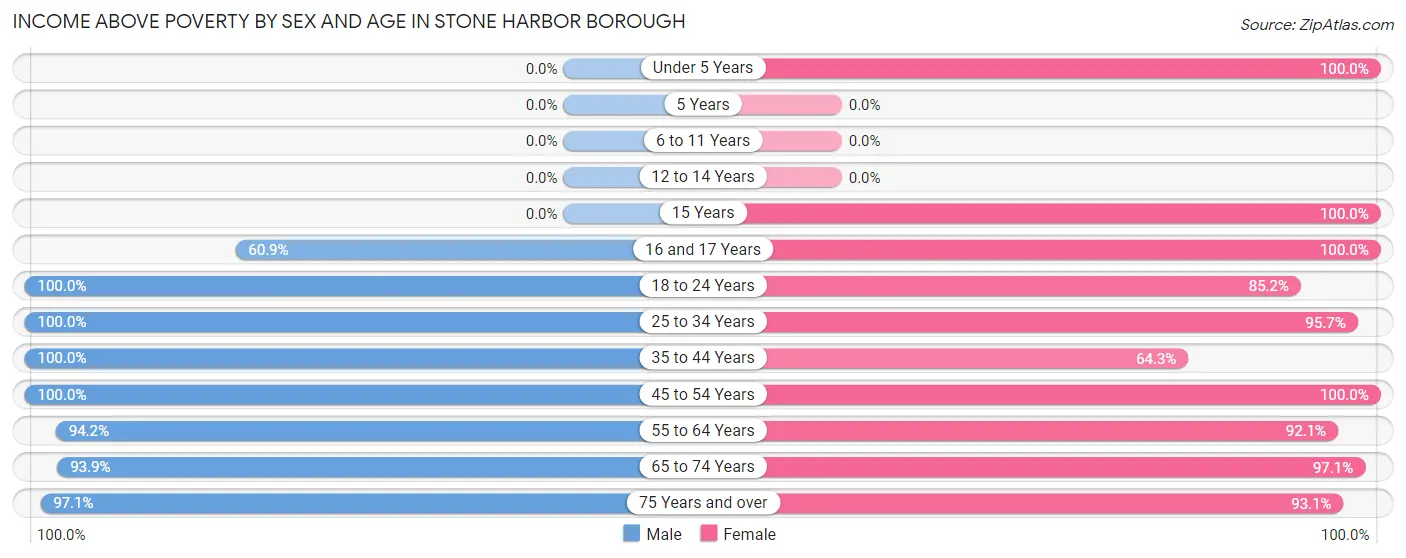
| Age Bracket | Male | Female |
| Under 5 Years | 0 (0.0%) | 19 (100.0%) |
| 5 Years | 0 (0.0%) | 0 (0.0%) |
| 6 to 11 Years | 0 (0.0%) | 0 (0.0%) |
| 12 to 14 Years | 0 (0.0%) | 0 (0.0%) |
| 15 Years | 0 (0.0%) | 2 (100.0%) |
| 16 and 17 Years | 14 (60.9%) | 3 (100.0%) |
| 18 to 24 Years | 32 (100.0%) | 23 (85.2%) |
| 25 to 34 Years | 21 (100.0%) | 45 (95.7%) |
| 35 to 44 Years | 12 (100.0%) | 9 (64.3%) |
| 45 to 54 Years | 43 (100.0%) | 16 (100.0%) |
| 55 to 64 Years | 65 (94.2%) | 93 (92.1%) |
| 65 to 74 Years | 124 (93.9%) | 134 (97.1%) |
| 75 Years and over | 67 (97.1%) | 108 (93.1%) |
| Total | 378 (93.6%) | 452 (93.6%) |
Income Below Poverty Among Married-Couple Families in Stone Harbor borough
The poverty statistics for married-couple families in Stone Harbor borough show that 1.5% or 4 of the total 276 families live below the poverty line. Families with no children have the highest poverty rate of 1.7%, comprising of 4 families. On the other hand, families with 1 or 2 children have the lowest poverty rate of 0.0%, which includes 0 families.
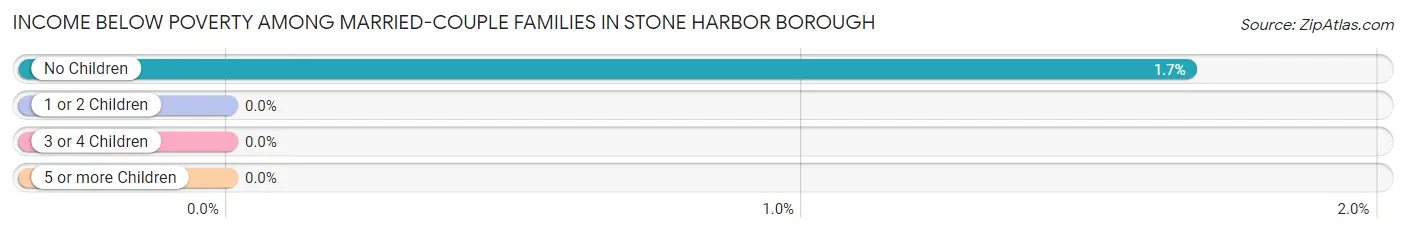
| Children | Above Poverty | Below Poverty |
| No Children | 235 (98.3%) | 4 (1.7%) |
| 1 or 2 Children | 37 (100.0%) | 0 (0.0%) |
| 3 or 4 Children | 0 (0.0%) | 0 (0.0%) |
| 5 or more Children | 0 (0.0%) | 0 (0.0%) |
| Total | 272 (98.6%) | 4 (1.5%) |
Income Below Poverty Among Single-Parent Households in Stone Harbor borough
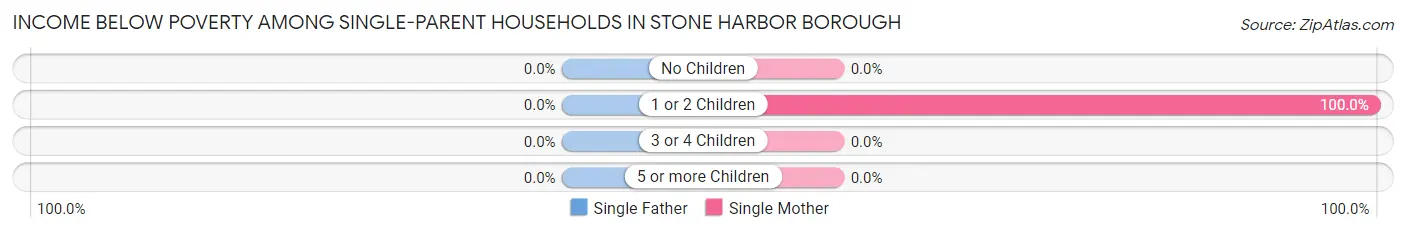
| Children | Single Father | Single Mother |
| No Children | 0 (0.0%) | 0 (0.0%) |
| 1 or 2 Children | 0 (0.0%) | 4 (100.0%) |
| 3 or 4 Children | 0 (0.0%) | 0 (0.0%) |
| 5 or more Children | 0 (0.0%) | 0 (0.0%) |
| Total | 0 (0.0%) | 4 (40.0%) |
Income Below Poverty Among Married-Couple vs Single-Parent Households in Stone Harbor borough
The poverty data for Stone Harbor borough shows that 4 of the married-couple family households (1.5%) and 4 of the single-parent households (30.8%) are living below the poverty level. Within the married-couple family households, those with no children have the highest poverty rate, with 4 households (1.7%) falling below the poverty line. Among the single-parent households, those with 1 or 2 children have the highest poverty rate, with 4 household (100.0%) living below poverty.
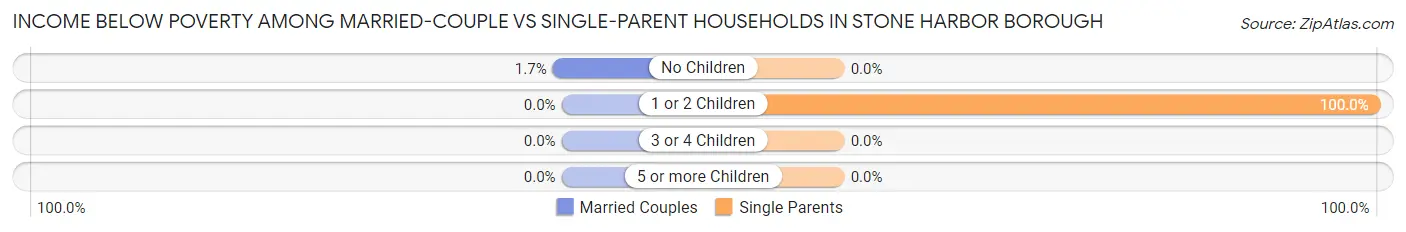
| Children | Married-Couple Families | Single-Parent Households |
| No Children | 4 (1.7%) | 0 (0.0%) |
| 1 or 2 Children | 0 (0.0%) | 4 (100.0%) |
| 3 or 4 Children | 0 (0.0%) | 0 (0.0%) |
| 5 or more Children | 0 (0.0%) | 0 (0.0%) |
| Total | 4 (1.5%) | 4 (30.8%) |
Race in Stone Harbor borough
The most populous races in Stone Harbor borough are White / Caucasian (875 | 98.7%), Hispanic or Latino (5 | 0.6%), and Asian (4 | 0.4%).
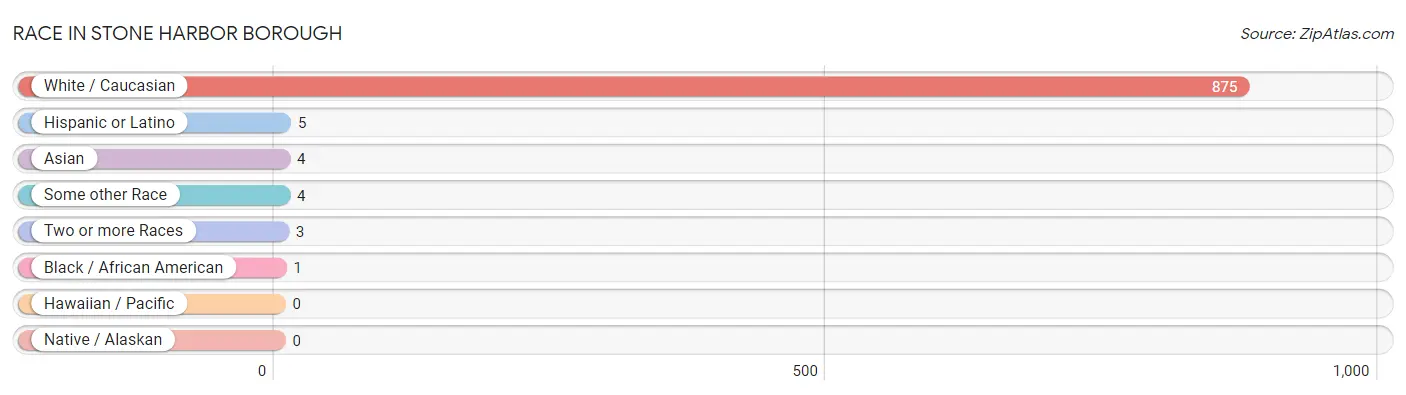
| Race | # Population | % Population |
| Asian | 4 | 0.4% |
| Black / African American | 1 | 0.1% |
| Hawaiian / Pacific | 0 | 0.0% |
| Hispanic or Latino | 5 | 0.6% |
| Native / Alaskan | 0 | 0.0% |
| White / Caucasian | 875 | 98.7% |
| Two or more Races | 3 | 0.3% |
| Some other Race | 4 | 0.4% |
| Total | 887 | 100.0% |
Ancestry in Stone Harbor borough
The most populous ancestries reported in Stone Harbor borough are Irish (285 | 32.1%), German (201 | 22.7%), English (143 | 16.1%), Italian (121 | 13.6%), and Polish (58 | 6.5%), together accounting for 91.1% of all Stone Harbor borough residents.
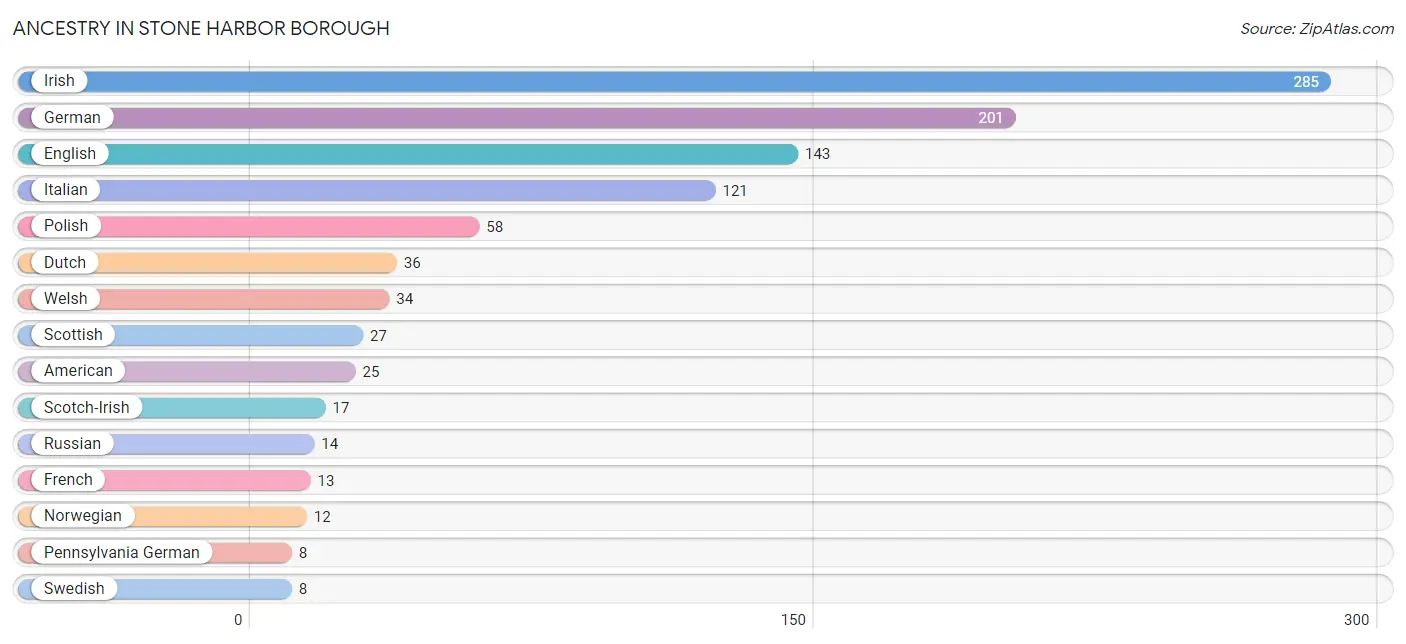
| Ancestry | # Population | % Population |
| American | 25 | 2.8% |
| Arab | 6 | 0.7% |
| Canadian | 2 | 0.2% |
| Cherokee | 1 | 0.1% |
| Croatian | 7 | 0.8% |
| Dutch | 36 | 4.1% |
| Eastern European | 3 | 0.3% |
| English | 143 | 16.1% |
| European | 7 | 0.8% |
| French | 13 | 1.5% |
| German | 201 | 22.7% |
| Greek | 7 | 0.8% |
| Hungarian | 6 | 0.7% |
| Irish | 285 | 32.1% |
| Italian | 121 | 13.6% |
| Korean | 4 | 0.4% |
| Lebanese | 6 | 0.7% |
| Lithuanian | 2 | 0.2% |
| Norwegian | 12 | 1.3% |
| Pennsylvania German | 8 | 0.9% |
| Polish | 58 | 6.5% |
| Romanian | 3 | 0.3% |
| Russian | 14 | 1.6% |
| Scotch-Irish | 17 | 1.9% |
| Scottish | 27 | 3.0% |
| Slovak | 5 | 0.6% |
| Spaniard | 1 | 0.1% |
| Swedish | 8 | 0.9% |
| Swiss | 1 | 0.1% |
| Ukrainian | 6 | 0.7% |
| Welsh | 34 | 3.8% | View All 31 Rows |
Immigrants in Stone Harbor borough
The most numerous immigrant groups reported in Stone Harbor borough came from Europe (18 | 2.0%), Canada (13 | 1.5%), Germany (13 | 1.5%), Western Europe (13 | 1.5%), and Eastern Europe (5 | 0.6%), together accounting for 7.0% of all Stone Harbor borough residents.
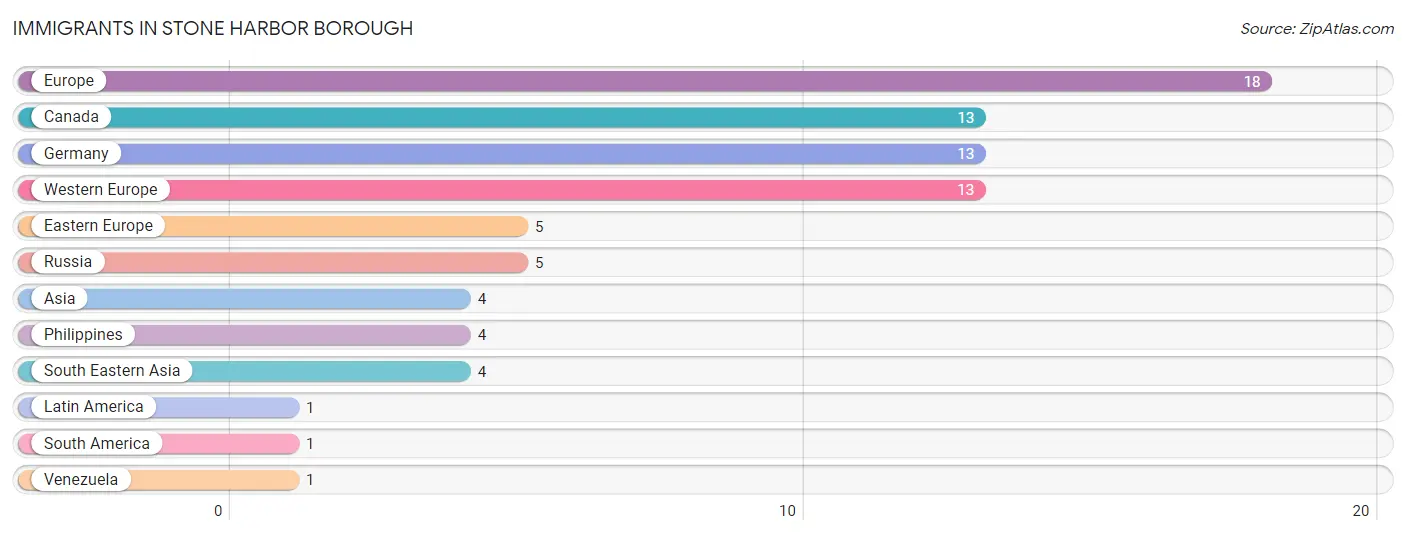
| Immigration Origin | # Population | % Population |
| Asia | 4 | 0.4% |
| Canada | 13 | 1.5% |
| Eastern Europe | 5 | 0.6% |
| Europe | 18 | 2.0% |
| Germany | 13 | 1.5% |
| Latin America | 1 | 0.1% |
| Philippines | 4 | 0.4% |
| Russia | 5 | 0.6% |
| South America | 1 | 0.1% |
| South Eastern Asia | 4 | 0.4% |
| Venezuela | 1 | 0.1% |
| Western Europe | 13 | 1.5% | View All 12 Rows |
Sex and Age in Stone Harbor borough
Sex and Age in Stone Harbor borough
The most populous age groups in Stone Harbor borough are 70 to 74 Years (81 | 20.1%) for men and 70 to 74 Years (77 | 15.9%) for women.
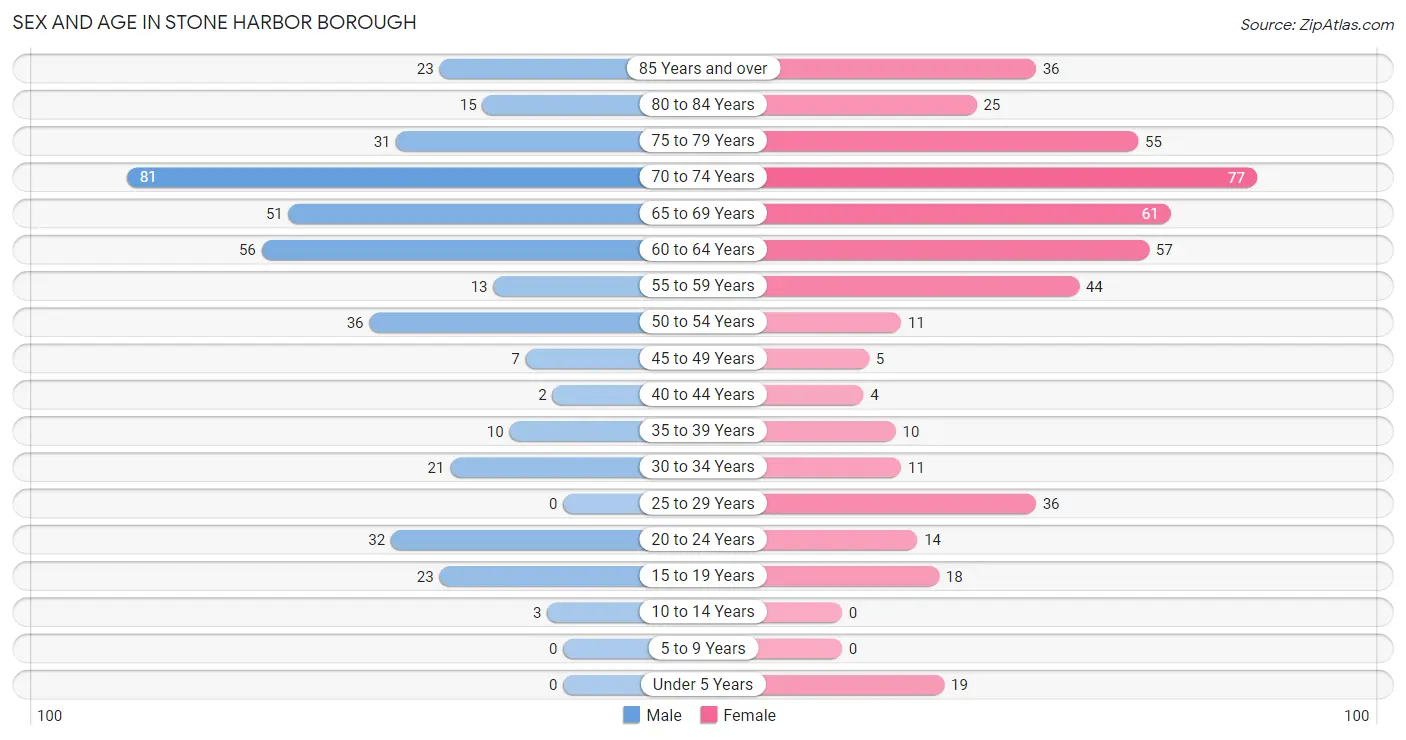
| Age Bracket | Male | Female |
| Under 5 Years | 0 (0.0%) | 19 (3.9%) |
| 5 to 9 Years | 0 (0.0%) | 0 (0.0%) |
| 10 to 14 Years | 3 (0.7%) | 0 (0.0%) |
| 15 to 19 Years | 23 (5.7%) | 18 (3.7%) |
| 20 to 24 Years | 32 (7.9%) | 14 (2.9%) |
| 25 to 29 Years | 0 (0.0%) | 36 (7.4%) |
| 30 to 34 Years | 21 (5.2%) | 11 (2.3%) |
| 35 to 39 Years | 10 (2.5%) | 10 (2.1%) |
| 40 to 44 Years | 2 (0.5%) | 4 (0.8%) |
| 45 to 49 Years | 7 (1.7%) | 5 (1.0%) |
| 50 to 54 Years | 36 (8.9%) | 11 (2.3%) |
| 55 to 59 Years | 13 (3.2%) | 44 (9.1%) |
| 60 to 64 Years | 56 (13.9%) | 57 (11.8%) |
| 65 to 69 Years | 51 (12.6%) | 61 (12.6%) |
| 70 to 74 Years | 81 (20.1%) | 77 (15.9%) |
| 75 to 79 Years | 31 (7.7%) | 55 (11.4%) |
| 80 to 84 Years | 15 (3.7%) | 25 (5.2%) |
| 85 Years and over | 23 (5.7%) | 36 (7.4%) |
| Total | 404 (100.0%) | 483 (100.0%) |
Families and Households in Stone Harbor borough
Median Family Size in Stone Harbor borough
The median family size in Stone Harbor borough is 2.33 persons per family, with single male/father families (3 | 1.0%) accounting for the largest median family size of 2.67 persons per family. On the other hand, single female/mother families (10 | 3.5%) represent the smallest median family size with 1.90 persons per family.
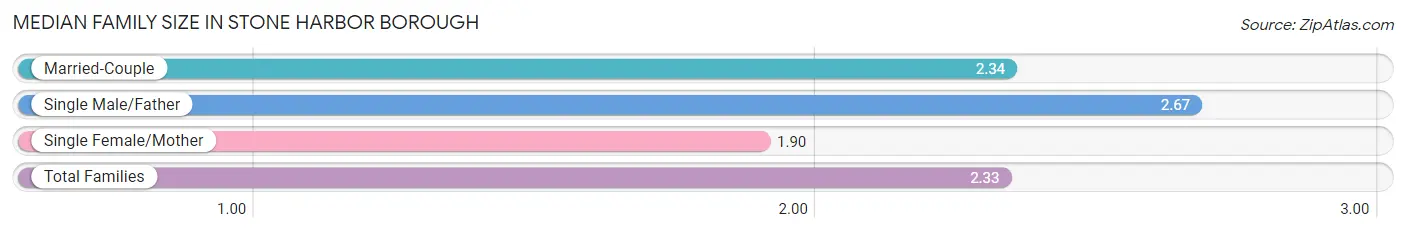
| Family Type | # Families | Family Size |
| Married-Couple | 276 (95.5%) | 2.34 |
| Single Male/Father | 3 (1.0%) | 2.67 |
| Single Female/Mother | 10 (3.5%) | 1.90 |
| Total Families | 289 (100.0%) | 2.33 |
Median Household Size in Stone Harbor borough
The median household size in Stone Harbor borough is 1.81 persons per household, with single male/father households (3 | 0.6%) accounting for the largest median household size of 2.67 persons per household. non-family households (199 | 40.8%) represent the smallest median household size with 1.03 persons per household.
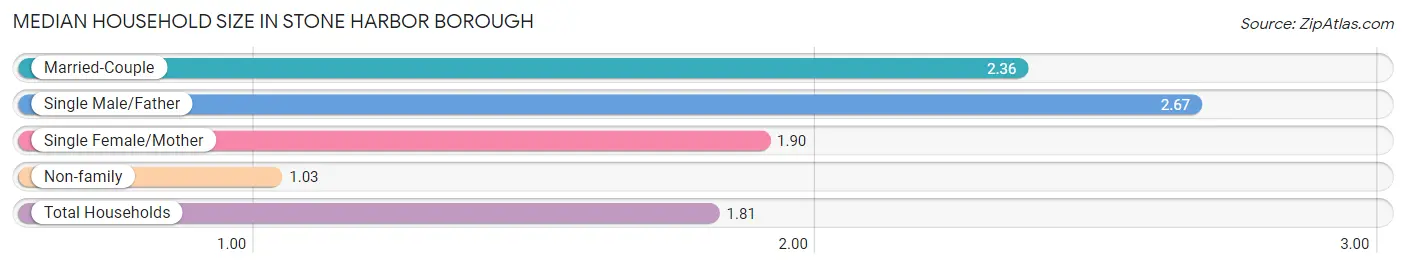
| Household Type | # Households | Household Size |
| Married-Couple | 276 (56.6%) | 2.36 |
| Single Male/Father | 3 (0.6%) | 2.67 |
| Single Female/Mother | 10 (2.1%) | 1.90 |
| Non-family | 199 (40.8%) | 1.03 |
| Total Households | 488 (100.0%) | 1.81 |
Household Size by Marriage Status in Stone Harbor borough
Out of a total of 488 households in Stone Harbor borough, 289 (59.2%) are family households, while 199 (40.8%) are nonfamily households. The most numerous type of family households are 2-person households, comprising 209, and the most common type of nonfamily households are 1-person households, comprising 194.
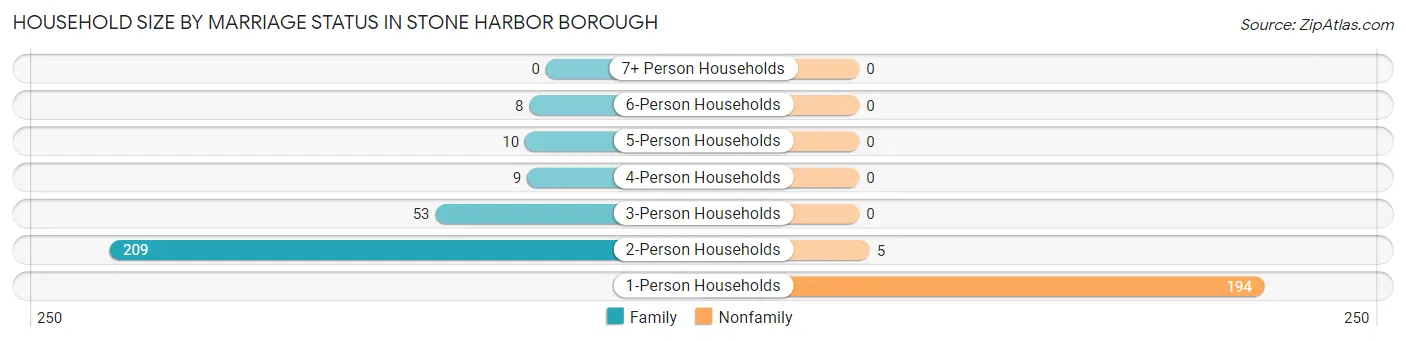
| Household Size | Family Households | Nonfamily Households |
| 1-Person Households | - | 194 (39.8%) |
| 2-Person Households | 209 (42.8%) | 5 (1.0%) |
| 3-Person Households | 53 (10.9%) | 0 (0.0%) |
| 4-Person Households | 9 (1.8%) | 0 (0.0%) |
| 5-Person Households | 10 (2.1%) | 0 (0.0%) |
| 6-Person Households | 8 (1.6%) | 0 (0.0%) |
| 7+ Person Households | 0 (0.0%) | 0 (0.0%) |
| Total | 289 (59.2%) | 199 (40.8%) |
Female Fertility in Stone Harbor borough
Fertility by Age in Stone Harbor borough
Average fertility rate in Stone Harbor borough is 257.0 births per 1,000 women. Women in the age bracket of 20 to 34 years have the highest fertility rate with 426.0 births per 1,000 women. Women in the age bracket of 20 to 34 years acount for 100.0% of all women with births.
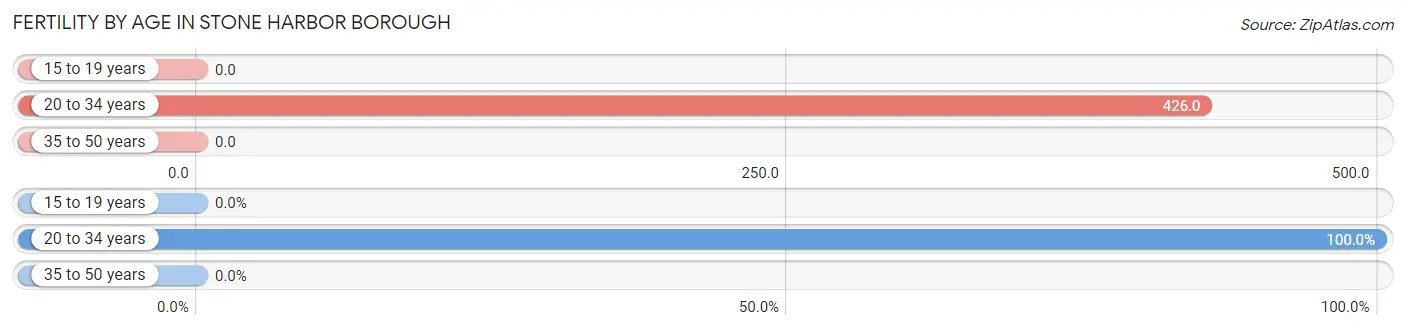
| Age Bracket | Women with Births | Births / 1,000 Women |
| 15 to 19 years | 0 (0.0%) | 0.0 |
| 20 to 34 years | 26 (100.0%) | 426.0 |
| 35 to 50 years | 0 (0.0%) | 0.0 |
| Total | 26 (100.0%) | 257.0 |
Fertility by Age by Marriage Status in Stone Harbor borough
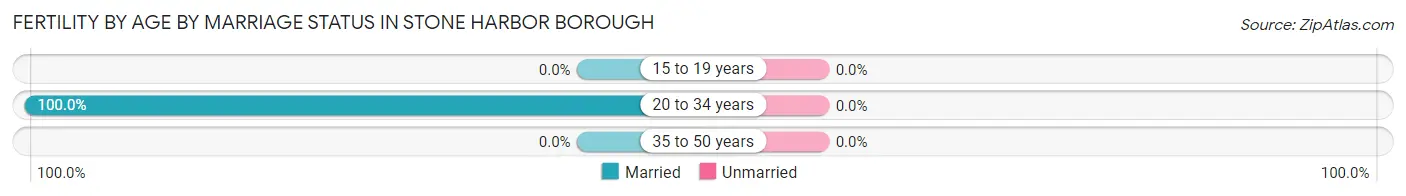
| Age Bracket | Married | Unmarried |
| 15 to 19 years | 0 (0.0%) | 0 (0.0%) |
| 20 to 34 years | 26 (100.0%) | 0 (0.0%) |
| 35 to 50 years | 0 (0.0%) | 0 (0.0%) |
| Total | 26 (100.0%) | 0 (0.0%) |
Fertility by Education in Stone Harbor borough
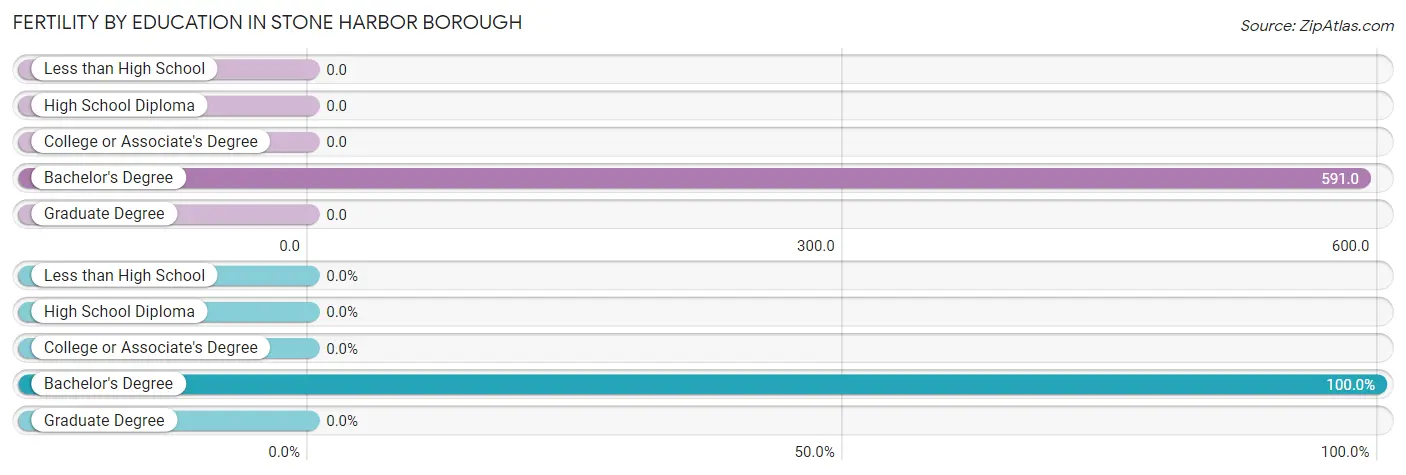
| Educational Attainment | Women with Births | Births / 1,000 Women |
| Less than High School | 0 (0.0%) | 0.0 |
| High School Diploma | 0 (0.0%) | 0.0 |
| College or Associate's Degree | 0 (0.0%) | 0.0 |
| Bachelor's Degree | 26 (100.0%) | 591.0 |
| Graduate Degree | 0 (0.0%) | 0.0 |
| Total | 26 (100.0%) | 257.0 |
Fertility by Education by Marriage Status in Stone Harbor borough
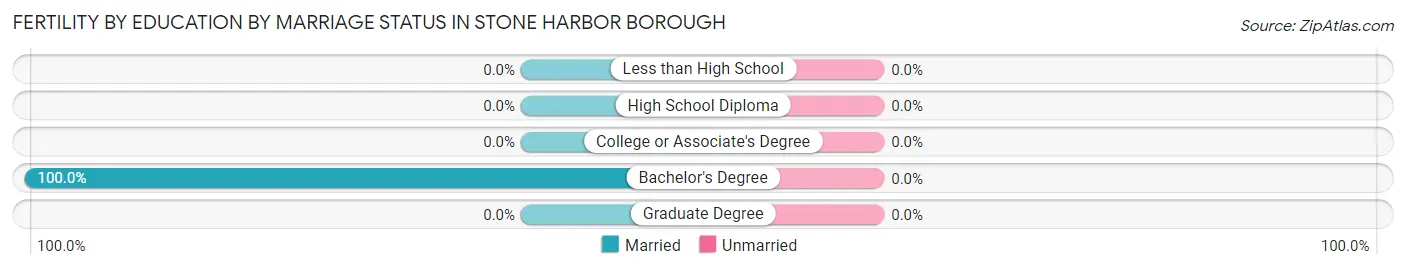
| Educational Attainment | Married | Unmarried |
| Less than High School | 0 (0.0%) | 0 (0.0%) |
| High School Diploma | 0 (0.0%) | 0 (0.0%) |
| College or Associate's Degree | 0 (0.0%) | 0 (0.0%) |
| Bachelor's Degree | 26 (100.0%) | 0 (0.0%) |
| Graduate Degree | 0 (0.0%) | 0 (0.0%) |
| Total | 26 (100.0%) | 0 (0.0%) |
Employment Characteristics in Stone Harbor borough
Employment by Class of Employer in Stone Harbor borough
Among the 356 employed individuals in Stone Harbor borough, private company employees (162 | 45.5%), self-employed (incorporated) (82 | 23.0%), and unpaid family workers (28 | 7.9%) make up the most common classes of employment.
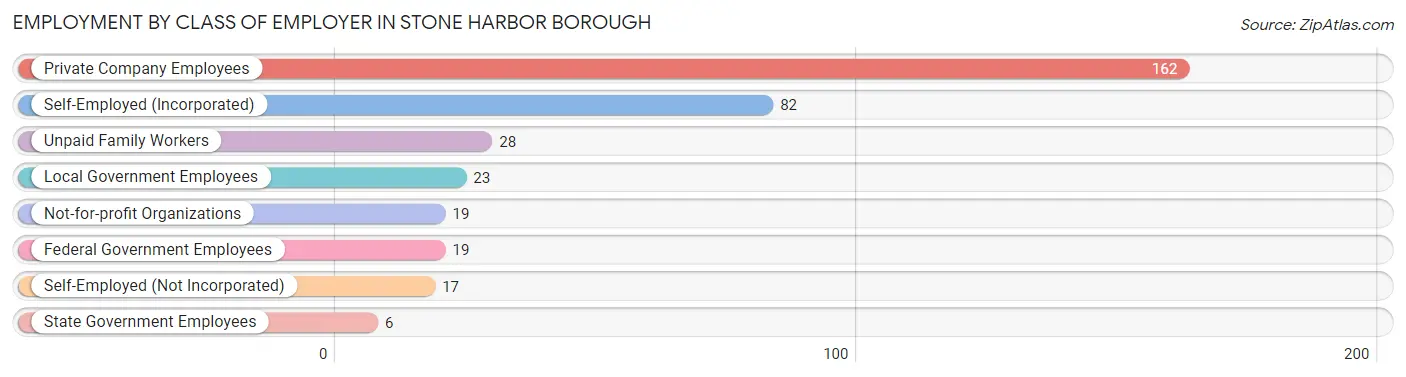
| Employer Class | # Employees | % Employees |
| Private Company Employees | 162 | 45.5% |
| Self-Employed (Incorporated) | 82 | 23.0% |
| Self-Employed (Not Incorporated) | 17 | 4.8% |
| Not-for-profit Organizations | 19 | 5.3% |
| Local Government Employees | 23 | 6.5% |
| State Government Employees | 6 | 1.7% |
| Federal Government Employees | 19 | 5.3% |
| Unpaid Family Workers | 28 | 7.9% |
| Total | 356 | 100.0% |
Employment Status by Age in Stone Harbor borough
According to the labor force statistics for Stone Harbor borough, out of the total population over 16 years of age (863), 43.8% or 378 individuals are in the labor force, with 3.6% or 14 of them unemployed. The age group with the highest labor force participation rate is 25 to 29 years, with 100.0% or 36 individuals in the labor force. Within the labor force, the 75 years and over age range has the highest percentage of unemployed individuals, with 15.4% or 2 of them being unemployed.
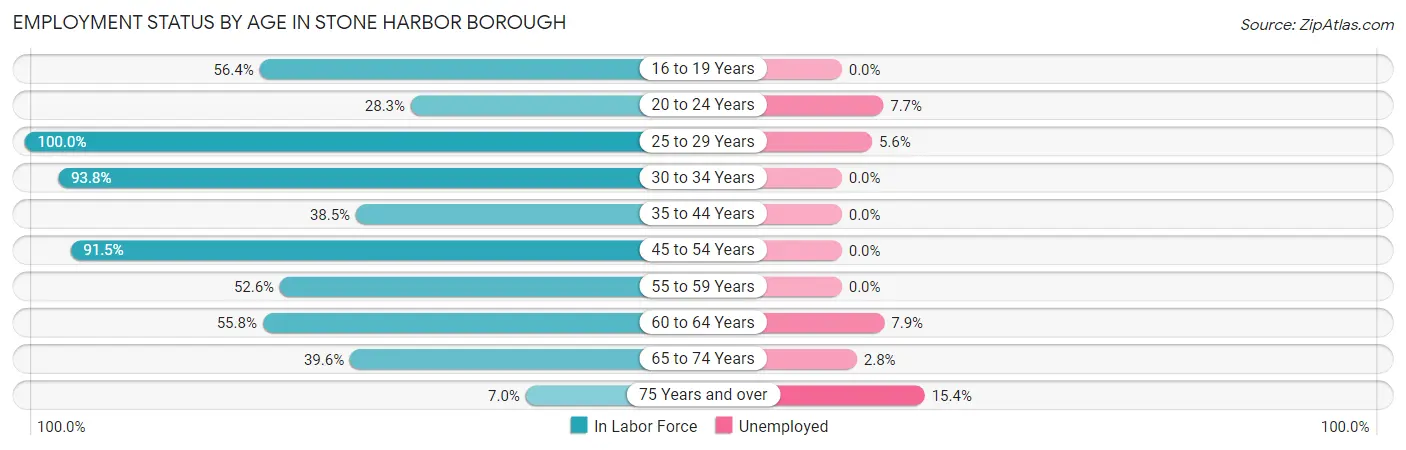
| Age Bracket | In Labor Force | Unemployed |
| 16 to 19 Years | 22 (56.4%) | 0 (0.0%) |
| 20 to 24 Years | 13 (28.3%) | 1 (7.7%) |
| 25 to 29 Years | 36 (100.0%) | 2 (5.6%) |
| 30 to 34 Years | 30 (93.8%) | 0 (0.0%) |
| 35 to 44 Years | 10 (38.5%) | 0 (0.0%) |
| 45 to 54 Years | 54 (91.5%) | 0 (0.0%) |
| 55 to 59 Years | 30 (52.6%) | 0 (0.0%) |
| 60 to 64 Years | 63 (55.8%) | 5 (7.9%) |
| 65 to 74 Years | 107 (39.6%) | 3 (2.8%) |
| 75 Years and over | 13 (7.0%) | 2 (15.4%) |
| Total | 378 (43.8%) | 14 (3.6%) |
Employment Status by Educational Attainment in Stone Harbor borough
According to labor force statistics for Stone Harbor borough, 69.0% of individuals (223) out of the total population between 25 and 64 years of age (323) are in the labor force, with 3.4% or 8 of them being unemployed. The group with the highest labor force participation rate are those with the educational attainment of less than high school, with 100.0% or 2 individuals in the labor force. Within the labor force, individuals with bachelor's degree or higher education have the highest percentage of unemployment, with 4.5% or 7 of them being unemployed.
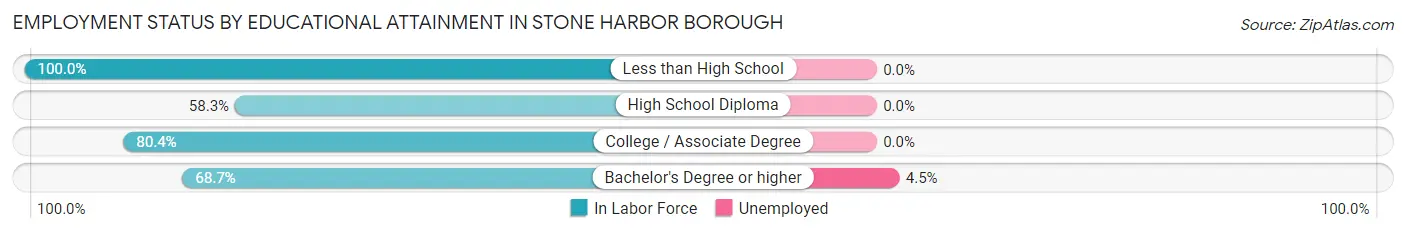
| Educational Attainment | In Labor Force | Unemployed |
| Less than High School | 2 (100.0%) | 0 (0.0%) |
| High School Diploma | 28 (58.3%) | 0 (0.0%) |
| College / Associate Degree | 37 (80.4%) | 0 (0.0%) |
| Bachelor's Degree or higher | 156 (68.7%) | 10 (4.5%) |
| Total | 223 (69.0%) | 11 (3.4%) |
Employment Occupations by Sex in Stone Harbor borough
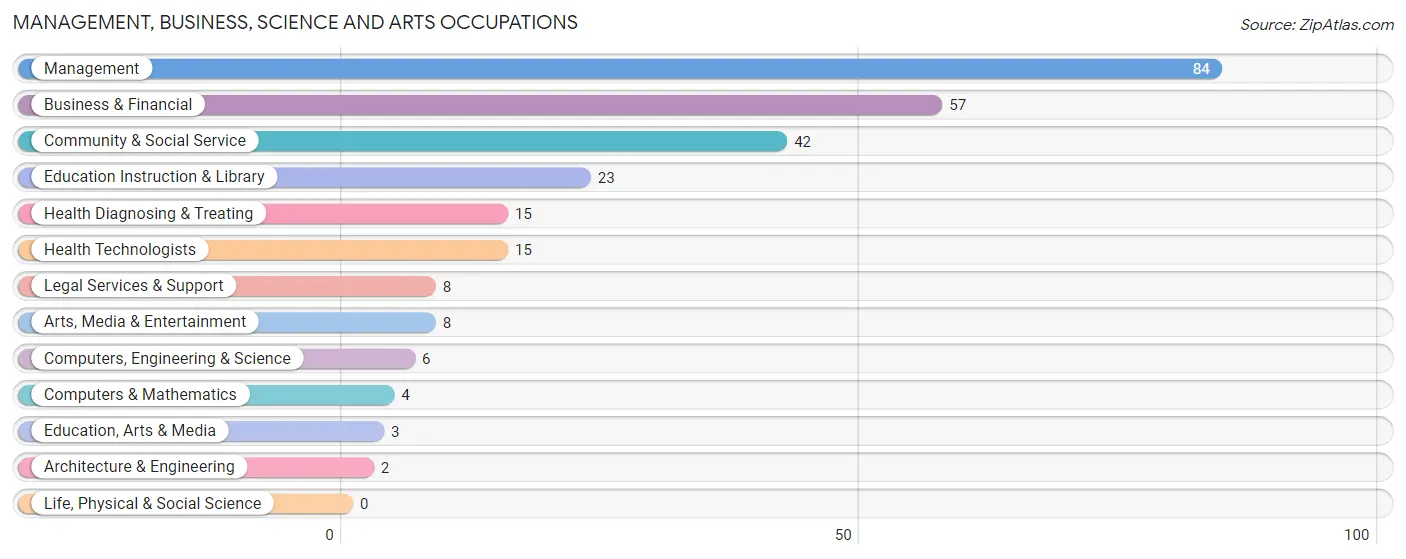
Management, Business, Science and Arts Occupations
The most common Management, Business, Science and Arts occupations in Stone Harbor borough are Management (84 | 24.1%), Business & Financial (57 | 16.4%), Community & Social Service (42 | 12.1%), Education Instruction & Library (23 | 6.6%), and Health Diagnosing & Treating (15 | 4.3%).
Management, Business, Science and Arts Occupations by Sex
Within the Management, Business, Science and Arts occupations in Stone Harbor borough, the most male-oriented occupations are Computers, Engineering & Science (100.0%), Computers & Mathematics (100.0%), and Architecture & Engineering (100.0%), while the most female-oriented occupations are Business & Financial (98.3%), Education Instruction & Library (82.6%), and Community & Social Service (57.1%).
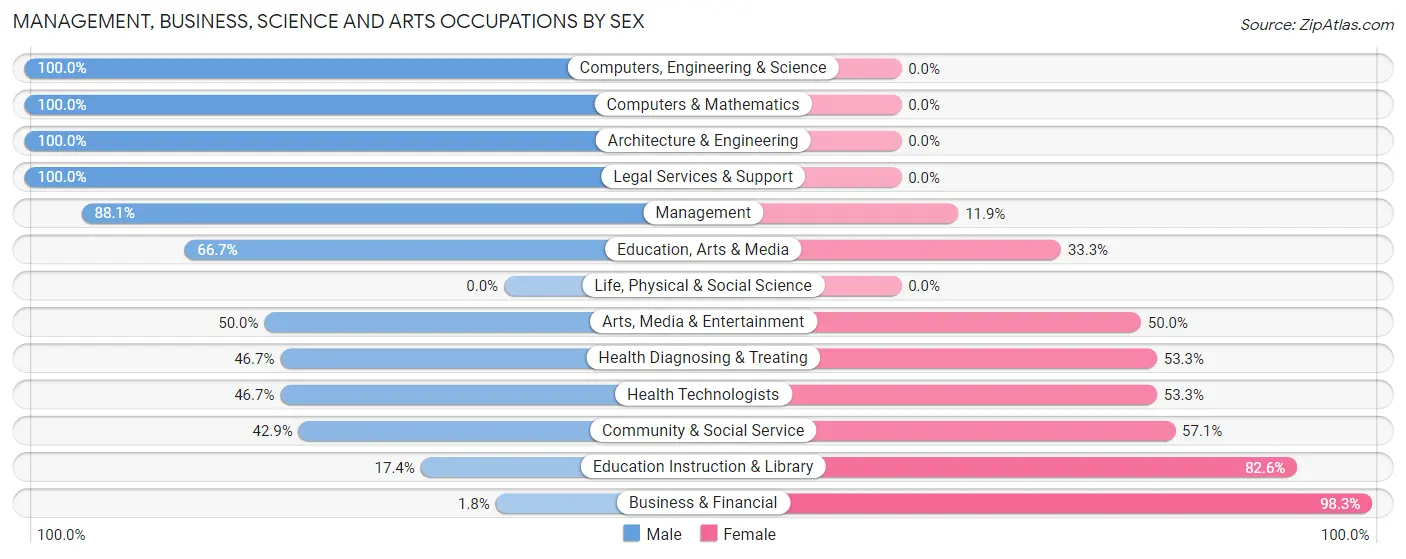
| Occupation | Male | Female |
| Management | 74 (88.1%) | 10 (11.9%) |
| Business & Financial | 1 (1.8%) | 56 (98.3%) |
| Computers, Engineering & Science | 6 (100.0%) | 0 (0.0%) |
| Computers & Mathematics | 4 (100.0%) | 0 (0.0%) |
| Architecture & Engineering | 2 (100.0%) | 0 (0.0%) |
| Life, Physical & Social Science | 0 (0.0%) | 0 (0.0%) |
| Community & Social Service | 18 (42.9%) | 24 (57.1%) |
| Education, Arts & Media | 2 (66.7%) | 1 (33.3%) |
| Legal Services & Support | 8 (100.0%) | 0 (0.0%) |
| Education Instruction & Library | 4 (17.4%) | 19 (82.6%) |
| Arts, Media & Entertainment | 4 (50.0%) | 4 (50.0%) |
| Health Diagnosing & Treating | 7 (46.7%) | 8 (53.3%) |
| Health Technologists | 7 (46.7%) | 8 (53.3%) |
| Total (Category) | 106 (52.0%) | 98 (48.0%) |
| Total (Overall) | 189 (54.3%) | 159 (45.7%) |
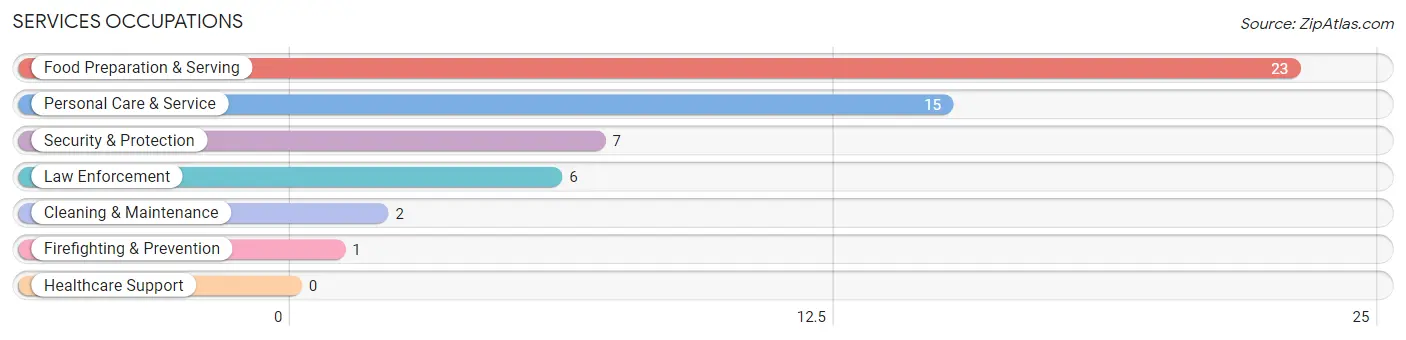
Services Occupations
The most common Services occupations in Stone Harbor borough are Food Preparation & Serving (23 | 6.6%), Personal Care & Service (15 | 4.3%), Security & Protection (7 | 2.0%), Law Enforcement (6 | 1.7%), and Cleaning & Maintenance (2 | 0.6%).
Services Occupations by Sex
Within the Services occupations in Stone Harbor borough, the most male-oriented occupations are Law Enforcement (100.0%), Cleaning & Maintenance (100.0%), and Security & Protection (85.7%), while the most female-oriented occupations are Firefighting & Prevention (100.0%), Personal Care & Service (20.0%), and Food Preparation & Serving (17.4%).
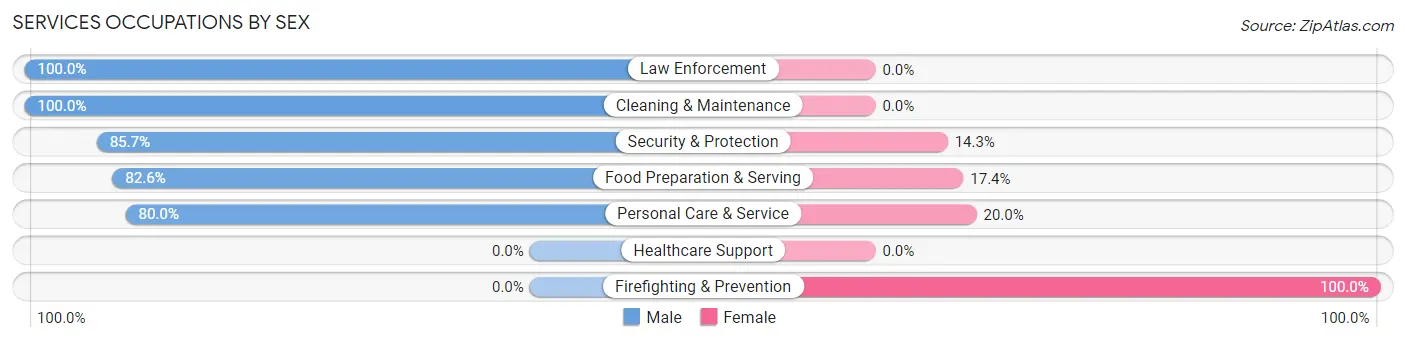
| Occupation | Male | Female |
| Healthcare Support | 0 (0.0%) | 0 (0.0%) |
| Security & Protection | 6 (85.7%) | 1 (14.3%) |
| Firefighting & Prevention | 0 (0.0%) | 1 (100.0%) |
| Law Enforcement | 6 (100.0%) | 0 (0.0%) |
| Food Preparation & Serving | 19 (82.6%) | 4 (17.4%) |
| Cleaning & Maintenance | 2 (100.0%) | 0 (0.0%) |
| Personal Care & Service | 12 (80.0%) | 3 (20.0%) |
| Total (Category) | 39 (83.0%) | 8 (17.0%) |
| Total (Overall) | 189 (54.3%) | 159 (45.7%) |
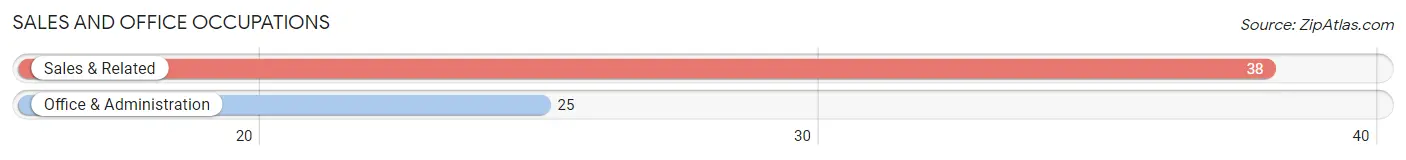
Sales and Office Occupations
The most common Sales and Office occupations in Stone Harbor borough are Sales & Related (38 | 10.9%), and Office & Administration (25 | 7.2%).
Sales and Office Occupations by Sex
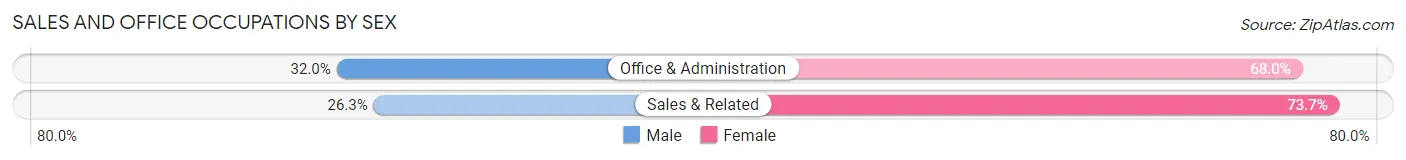
| Occupation | Male | Female |
| Sales & Related | 10 (26.3%) | 28 (73.7%) |
| Office & Administration | 8 (32.0%) | 17 (68.0%) |
| Total (Category) | 18 (28.6%) | 45 (71.4%) |
| Total (Overall) | 189 (54.3%) | 159 (45.7%) |
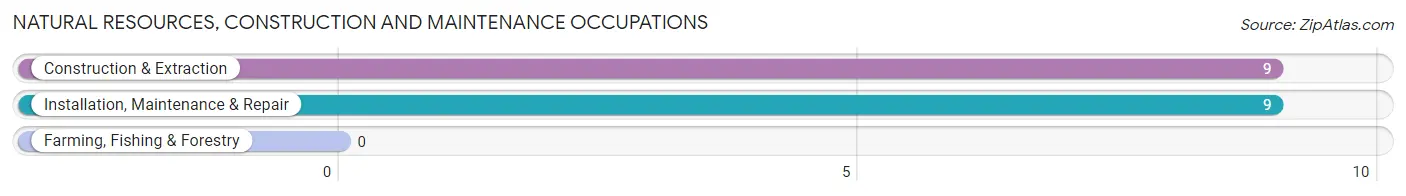
Natural Resources, Construction and Maintenance Occupations
The most common Natural Resources, Construction and Maintenance occupations in Stone Harbor borough are Construction & Extraction (9 | 2.6%), and Installation, Maintenance & Repair (9 | 2.6%).
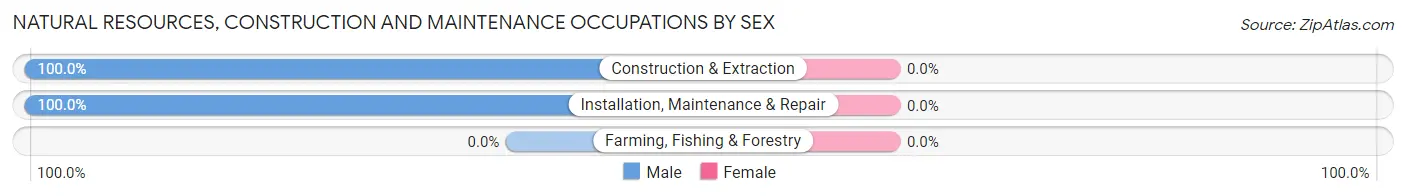
Natural Resources, Construction and Maintenance Occupations by Sex
| Occupation | Male | Female |
| Farming, Fishing & Forestry | 0 (0.0%) | 0 (0.0%) |
| Construction & Extraction | 9 (100.0%) | 0 (0.0%) |
| Installation, Maintenance & Repair | 9 (100.0%) | 0 (0.0%) |
| Total (Category) | 18 (100.0%) | 0 (0.0%) |
| Total (Overall) | 189 (54.3%) | 159 (45.7%) |
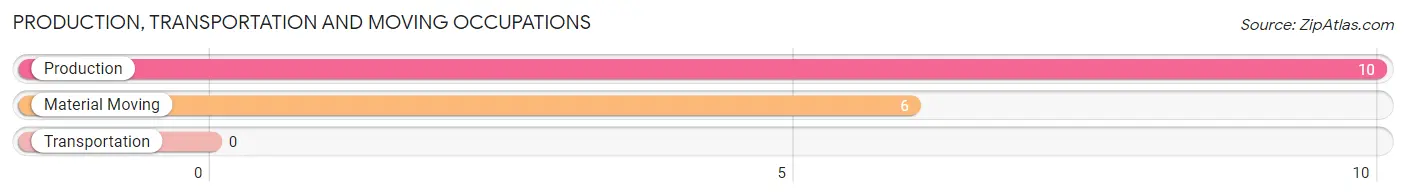
Production, Transportation and Moving Occupations
The most common Production, Transportation and Moving occupations in Stone Harbor borough are Production (10 | 2.9%), and Material Moving (6 | 1.7%).
Production, Transportation and Moving Occupations by Sex
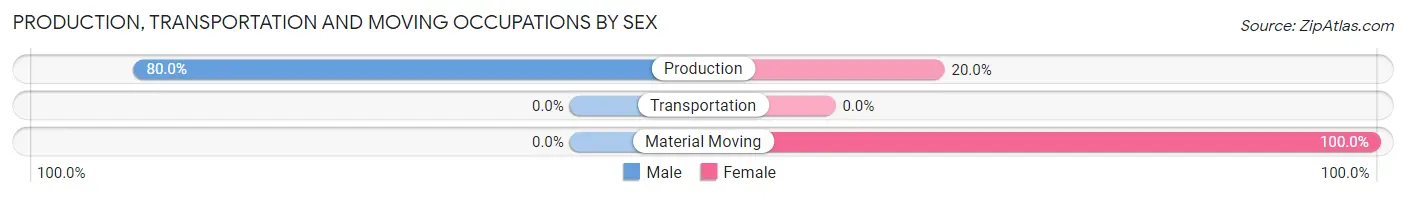
| Occupation | Male | Female |
| Production | 8 (80.0%) | 2 (20.0%) |
| Transportation | 0 (0.0%) | 0 (0.0%) |
| Material Moving | 0 (0.0%) | 6 (100.0%) |
| Total (Category) | 8 (50.0%) | 8 (50.0%) |
| Total (Overall) | 189 (54.3%) | 159 (45.7%) |
Employment Industries by Sex in Stone Harbor borough
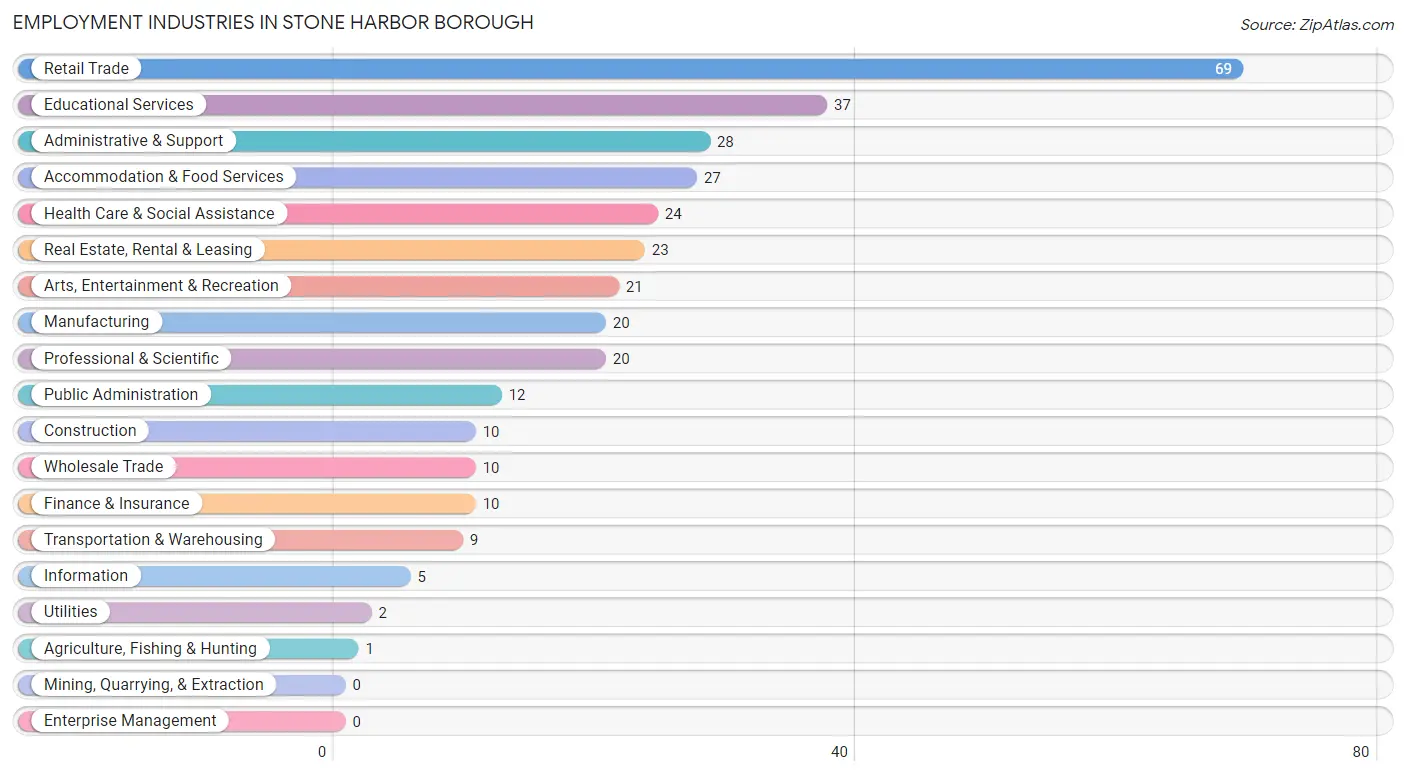
Employment Industries in Stone Harbor borough
The major employment industries in Stone Harbor borough include Retail Trade (69 | 19.8%), Educational Services (37 | 10.6%), Administrative & Support (28 | 8.1%), Accommodation & Food Services (27 | 7.8%), and Health Care & Social Assistance (24 | 6.9%).
Employment Industries by Sex in Stone Harbor borough
The Stone Harbor borough industries that see more men than women are Agriculture, Fishing & Hunting (100.0%), Construction (100.0%), and Transportation & Warehousing (100.0%), whereas the industries that tend to have a higher number of women are Administrative & Support (92.9%), Educational Services (78.4%), and Real Estate, Rental & Leasing (65.2%).
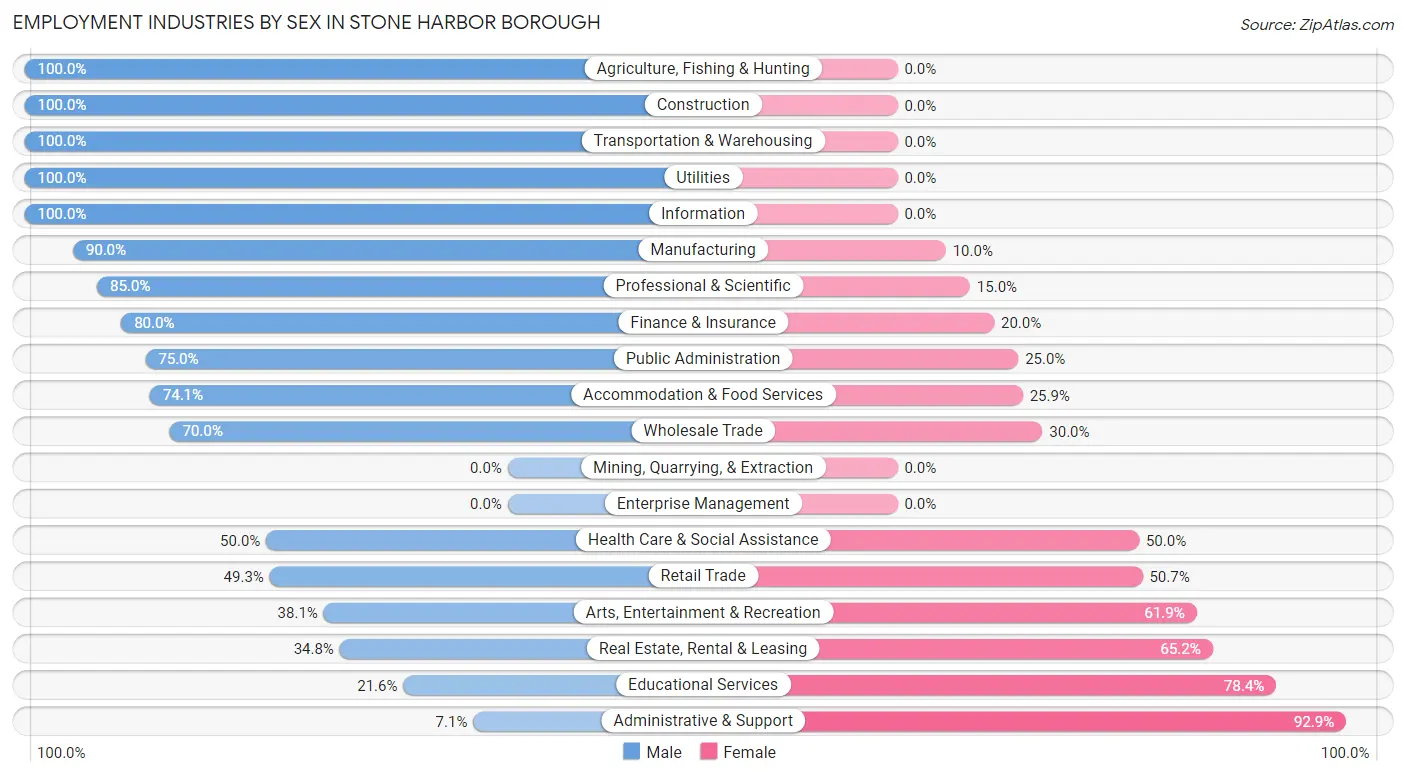
| Industry | Male | Female |
| Agriculture, Fishing & Hunting | 1 (100.0%) | 0 (0.0%) |
| Mining, Quarrying, & Extraction | 0 (0.0%) | 0 (0.0%) |
| Construction | 10 (100.0%) | 0 (0.0%) |
| Manufacturing | 18 (90.0%) | 2 (10.0%) |
| Wholesale Trade | 7 (70.0%) | 3 (30.0%) |
| Retail Trade | 34 (49.3%) | 35 (50.7%) |
| Transportation & Warehousing | 9 (100.0%) | 0 (0.0%) |
| Utilities | 2 (100.0%) | 0 (0.0%) |
| Information | 5 (100.0%) | 0 (0.0%) |
| Finance & Insurance | 8 (80.0%) | 2 (20.0%) |
| Real Estate, Rental & Leasing | 8 (34.8%) | 15 (65.2%) |
| Professional & Scientific | 17 (85.0%) | 3 (15.0%) |
| Enterprise Management | 0 (0.0%) | 0 (0.0%) |
| Administrative & Support | 2 (7.1%) | 26 (92.9%) |
| Educational Services | 8 (21.6%) | 29 (78.4%) |
| Health Care & Social Assistance | 12 (50.0%) | 12 (50.0%) |
| Arts, Entertainment & Recreation | 8 (38.1%) | 13 (61.9%) |
| Accommodation & Food Services | 20 (74.1%) | 7 (25.9%) |
| Public Administration | 9 (75.0%) | 3 (25.0%) |
| Total | 189 (54.3%) | 159 (45.7%) |
Education in Stone Harbor borough
School Enrollment in Stone Harbor borough
The most common levels of schooling among the 59 students in Stone Harbor borough are high school (32 | 54.2%), college / undergraduate (22 | 37.3%), and middle school (3 | 5.1%).
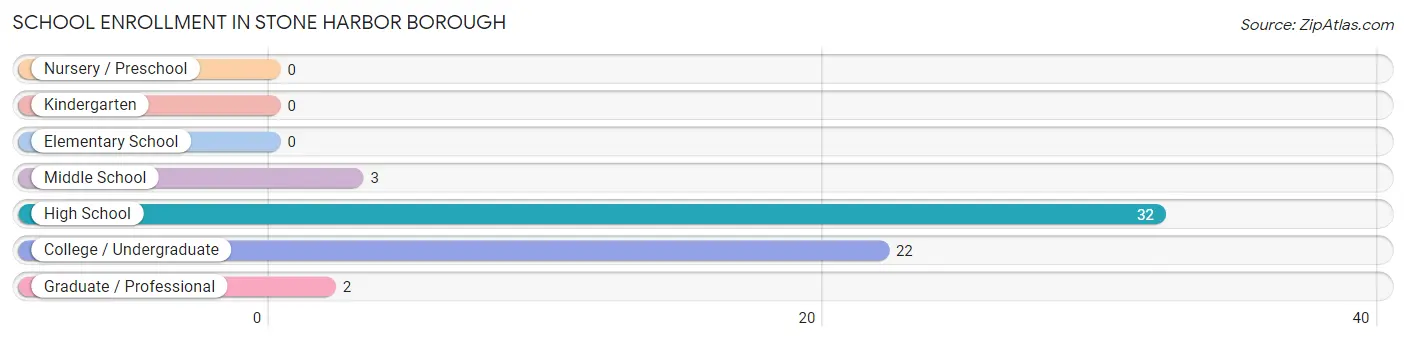
| School Level | # Students | % Students |
| Nursery / Preschool | 0 | 0.0% |
| Kindergarten | 0 | 0.0% |
| Elementary School | 0 | 0.0% |
| Middle School | 3 | 5.1% |
| High School | 32 | 54.2% |
| College / Undergraduate | 22 | 37.3% |
| Graduate / Professional | 2 | 3.4% |
| Total | 59 | 100.0% |
School Enrollment by Age by Funding Source in Stone Harbor borough
Out of a total of 59 students who are enrolled in schools in Stone Harbor borough, 39 (66.1%) attend a private institution, while the remaining 20 (33.9%) are enrolled in public schools. The age group of 10 to 14 year olds has the highest likelihood of being enrolled in private schools, with 3 (100.0% in the age bracket) enrolled. Conversely, the age group of 15 to 17 year olds has the lowest likelihood of being enrolled in a private school, with 14 (50.0% in the age bracket) attending a public institution.
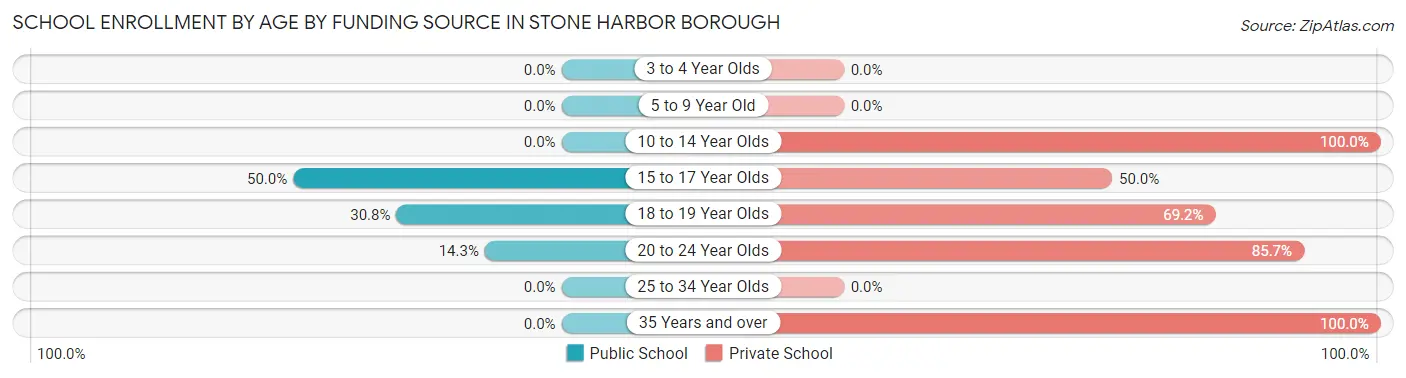
| Age Bracket | Public School | Private School |
| 3 to 4 Year Olds | 0 (0.0%) | 0 (0.0%) |
| 5 to 9 Year Old | 0 (0.0%) | 0 (0.0%) |
| 10 to 14 Year Olds | 0 (0.0%) | 3 (100.0%) |
| 15 to 17 Year Olds | 14 (50.0%) | 14 (50.0%) |
| 18 to 19 Year Olds | 4 (30.8%) | 9 (69.2%) |
| 20 to 24 Year Olds | 2 (14.3%) | 12 (85.7%) |
| 25 to 34 Year Olds | 0 (0.0%) | 0 (0.0%) |
| 35 Years and over | 0 (0.0%) | 1 (100.0%) |
| Total | 20 (33.9%) | 39 (66.1%) |
Educational Attainment by Field of Study in Stone Harbor borough
Business (140 | 24.9%), social sciences (60 | 10.7%), education (58 | 10.3%), psychology (54 | 9.6%), and literature & languages (51 | 9.1%) are the most common fields of study among 563 individuals in Stone Harbor borough who have obtained a bachelor's degree or higher.
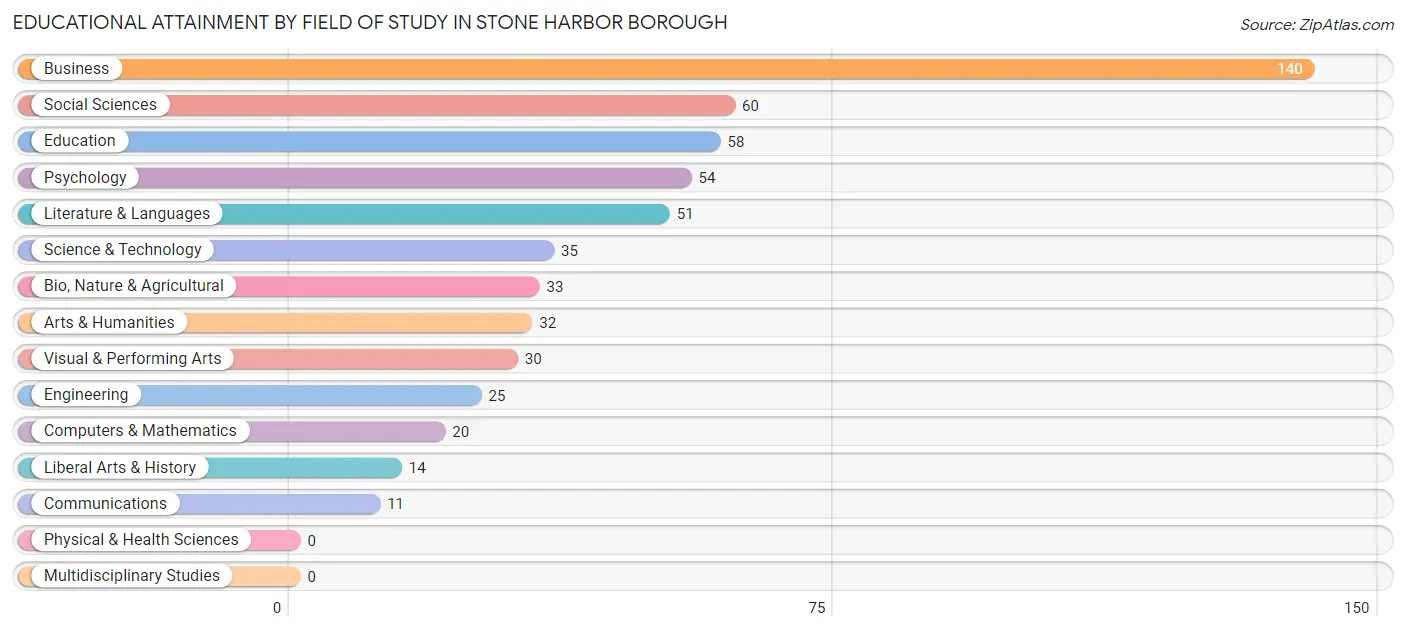
| Field of Study | # Graduates | % Graduates |
| Computers & Mathematics | 20 | 3.5% |
| Bio, Nature & Agricultural | 33 | 5.9% |
| Physical & Health Sciences | 0 | 0.0% |
| Psychology | 54 | 9.6% |
| Social Sciences | 60 | 10.7% |
| Engineering | 25 | 4.4% |
| Multidisciplinary Studies | 0 | 0.0% |
| Science & Technology | 35 | 6.2% |
| Business | 140 | 24.9% |
| Education | 58 | 10.3% |
| Literature & Languages | 51 | 9.1% |
| Liberal Arts & History | 14 | 2.5% |
| Visual & Performing Arts | 30 | 5.3% |
| Communications | 11 | 1.9% |
| Arts & Humanities | 32 | 5.7% |
| Total | 563 | 100.0% |
Transportation & Commute in Stone Harbor borough
Vehicle Availability by Sex in Stone Harbor borough
The most prevalent vehicle ownership categories in Stone Harbor borough are males with 1 vehicle (72, accounting for 35.5%) and females with 1 vehicle (67, making up 48.0%).
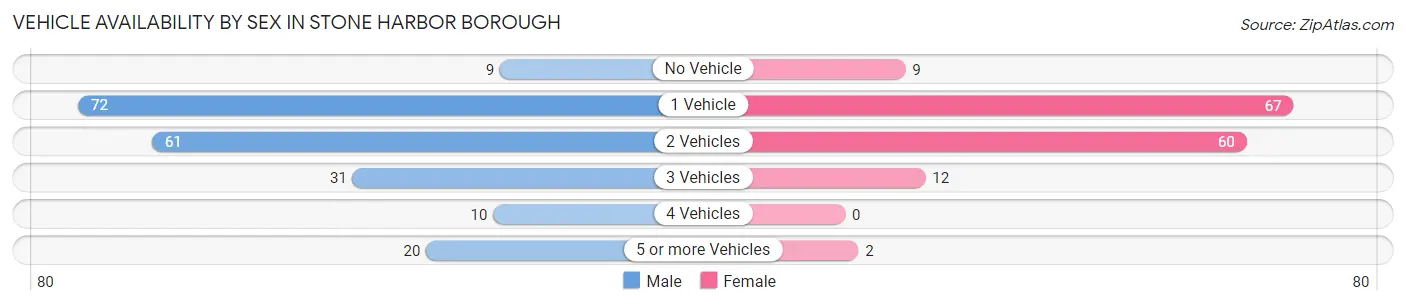
| Vehicles Available | Male | Female |
| No Vehicle | 9 (4.4%) | 9 (6.0%) |
| 1 Vehicle | 72 (35.5%) | 67 (44.7%) |
| 2 Vehicles | 61 (30.0%) | 60 (40.0%) |
| 3 Vehicles | 31 (15.3%) | 12 (8.0%) |
| 4 Vehicles | 10 (4.9%) | 0 (0.0%) |
| 5 or more Vehicles | 20 (9.9%) | 2 (1.3%) |
| Total | 203 (100.0%) | 150 (100.0%) |
Commute Time in Stone Harbor borough
The most frequently occuring commute durations in Stone Harbor borough are less than 5 minutes (54 commuters, 19.4%), 5 to 9 minutes (49 commuters, 17.6%), and 15 to 19 minutes (41 commuters, 14.7%).
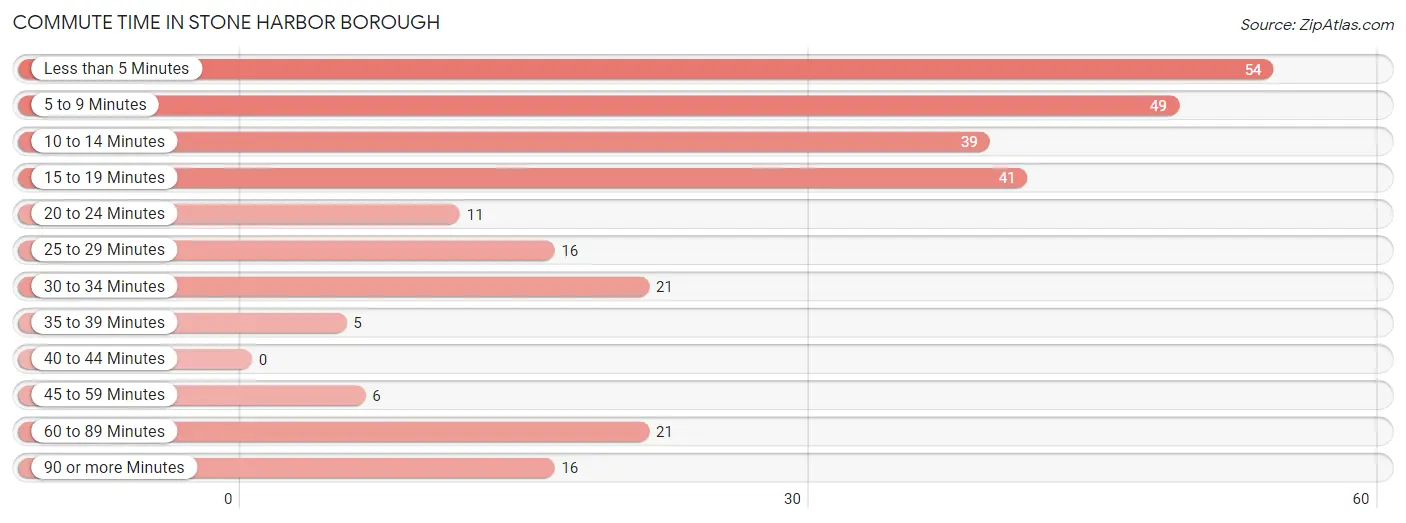
| Commute Time | # Commuters | % Commuters |
| Less than 5 Minutes | 54 | 19.4% |
| 5 to 9 Minutes | 49 | 17.6% |
| 10 to 14 Minutes | 39 | 14.0% |
| 15 to 19 Minutes | 41 | 14.7% |
| 20 to 24 Minutes | 11 | 3.9% |
| 25 to 29 Minutes | 16 | 5.7% |
| 30 to 34 Minutes | 21 | 7.5% |
| 35 to 39 Minutes | 5 | 1.8% |
| 40 to 44 Minutes | 0 | 0.0% |
| 45 to 59 Minutes | 6 | 2.1% |
| 60 to 89 Minutes | 21 | 7.5% |
| 90 or more Minutes | 16 | 5.7% |
Commute Time by Sex in Stone Harbor borough
The most common commute times in Stone Harbor borough are less than 5 minutes (27 commuters, 16.0%) for males and 5 to 9 minutes (28 commuters, 25.5%) for females.
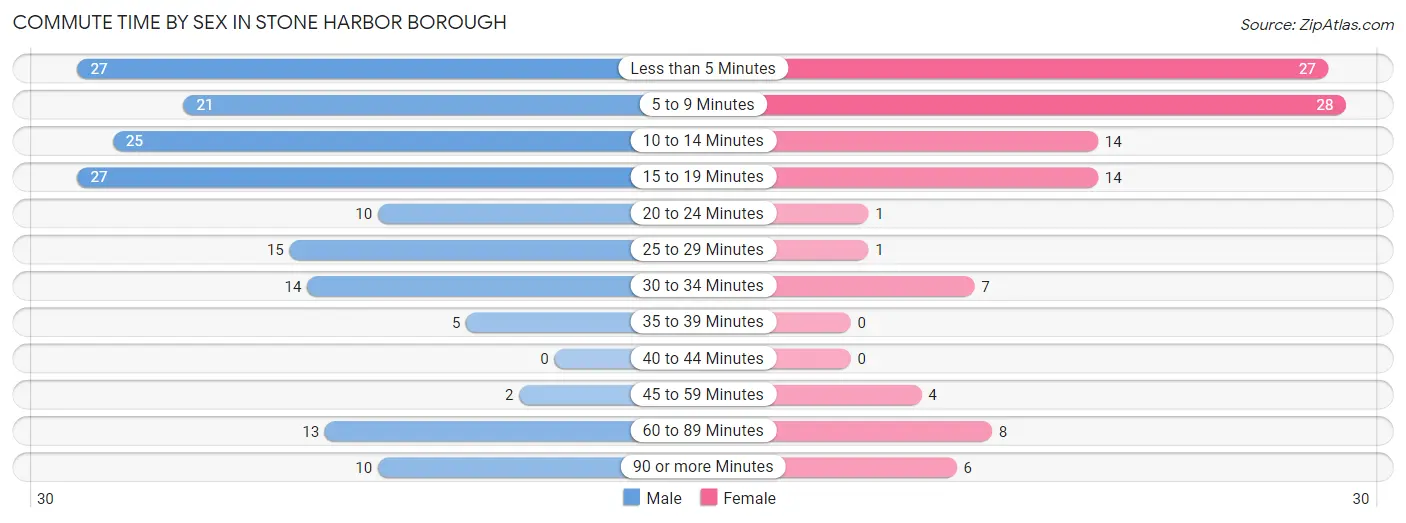
| Commute Time | Male | Female |
| Less than 5 Minutes | 27 (16.0%) | 27 (24.5%) |
| 5 to 9 Minutes | 21 (12.4%) | 28 (25.5%) |
| 10 to 14 Minutes | 25 (14.8%) | 14 (12.7%) |
| 15 to 19 Minutes | 27 (16.0%) | 14 (12.7%) |
| 20 to 24 Minutes | 10 (5.9%) | 1 (0.9%) |
| 25 to 29 Minutes | 15 (8.9%) | 1 (0.9%) |
| 30 to 34 Minutes | 14 (8.3%) | 7 (6.4%) |
| 35 to 39 Minutes | 5 (3.0%) | 0 (0.0%) |
| 40 to 44 Minutes | 0 (0.0%) | 0 (0.0%) |
| 45 to 59 Minutes | 2 (1.2%) | 4 (3.6%) |
| 60 to 89 Minutes | 13 (7.7%) | 8 (7.3%) |
| 90 or more Minutes | 10 (5.9%) | 6 (5.4%) |
Time of Departure to Work by Sex in Stone Harbor borough
The most frequent times of departure to work in Stone Harbor borough are 7:00 AM to 7:29 AM (27, 16.0%) for males and 7:30 AM to 7:59 AM (34, 30.9%) for females.
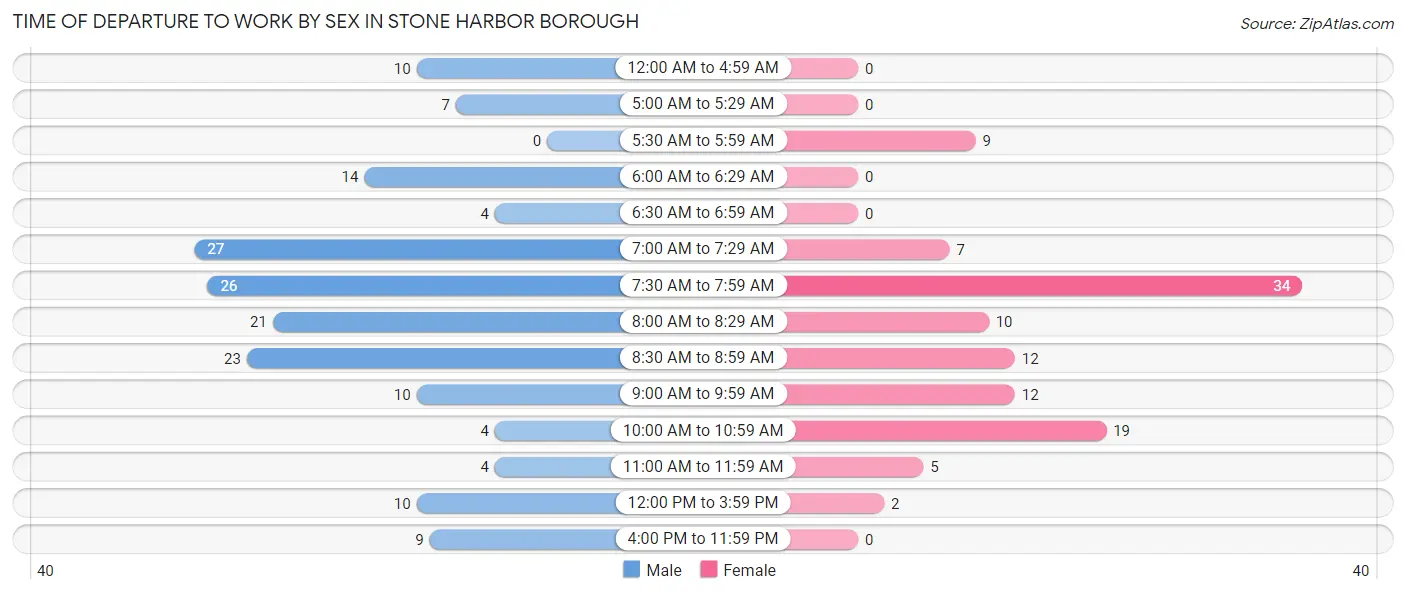
| Time of Departure | Male | Female |
| 12:00 AM to 4:59 AM | 10 (5.9%) | 0 (0.0%) |
| 5:00 AM to 5:29 AM | 7 (4.1%) | 0 (0.0%) |
| 5:30 AM to 5:59 AM | 0 (0.0%) | 9 (8.2%) |
| 6:00 AM to 6:29 AM | 14 (8.3%) | 0 (0.0%) |
| 6:30 AM to 6:59 AM | 4 (2.4%) | 0 (0.0%) |
| 7:00 AM to 7:29 AM | 27 (16.0%) | 7 (6.4%) |
| 7:30 AM to 7:59 AM | 26 (15.4%) | 34 (30.9%) |
| 8:00 AM to 8:29 AM | 21 (12.4%) | 10 (9.1%) |
| 8:30 AM to 8:59 AM | 23 (13.6%) | 12 (10.9%) |
| 9:00 AM to 9:59 AM | 10 (5.9%) | 12 (10.9%) |
| 10:00 AM to 10:59 AM | 4 (2.4%) | 19 (17.3%) |
| 11:00 AM to 11:59 AM | 4 (2.4%) | 5 (4.5%) |
| 12:00 PM to 3:59 PM | 10 (5.9%) | 2 (1.8%) |
| 4:00 PM to 11:59 PM | 9 (5.3%) | 0 (0.0%) |
| Total | 169 (100.0%) | 110 (100.0%) |
Housing Occupancy in Stone Harbor borough
Occupancy by Ownership in Stone Harbor borough
Of the total 488 dwellings in Stone Harbor borough, owner-occupied units account for 420 (86.1%), while renter-occupied units make up 68 (13.9%).
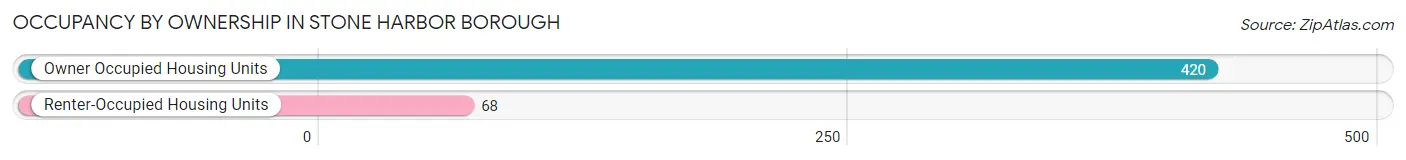
| Occupancy | # Housing Units | % Housing Units |
| Owner Occupied Housing Units | 420 | 86.1% |
| Renter-Occupied Housing Units | 68 | 13.9% |
| Total Occupied Housing Units | 488 | 100.0% |
Occupancy by Household Size in Stone Harbor borough
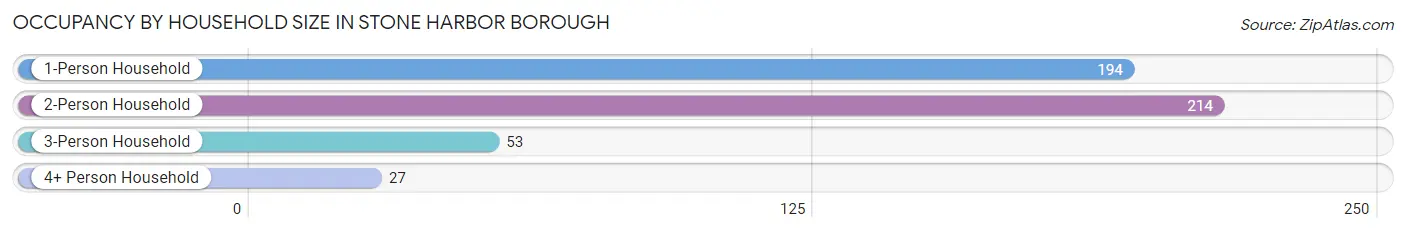
| Household Size | # Housing Units | % Housing Units |
| 1-Person Household | 194 | 39.8% |
| 2-Person Household | 214 | 43.9% |
| 3-Person Household | 53 | 10.9% |
| 4+ Person Household | 27 | 5.5% |
| Total Housing Units | 488 | 100.0% |
Occupancy by Ownership by Household Size in Stone Harbor borough
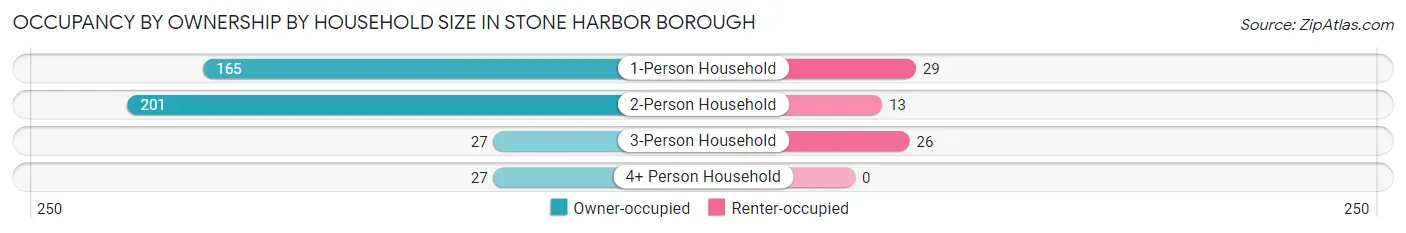
| Household Size | Owner-occupied | Renter-occupied |
| 1-Person Household | 165 (85.1%) | 29 (14.9%) |
| 2-Person Household | 201 (93.9%) | 13 (6.1%) |
| 3-Person Household | 27 (50.9%) | 26 (49.1%) |
| 4+ Person Household | 27 (100.0%) | 0 (0.0%) |
| Total Housing Units | 420 (86.1%) | 68 (13.9%) |
Occupancy by Educational Attainment in Stone Harbor borough
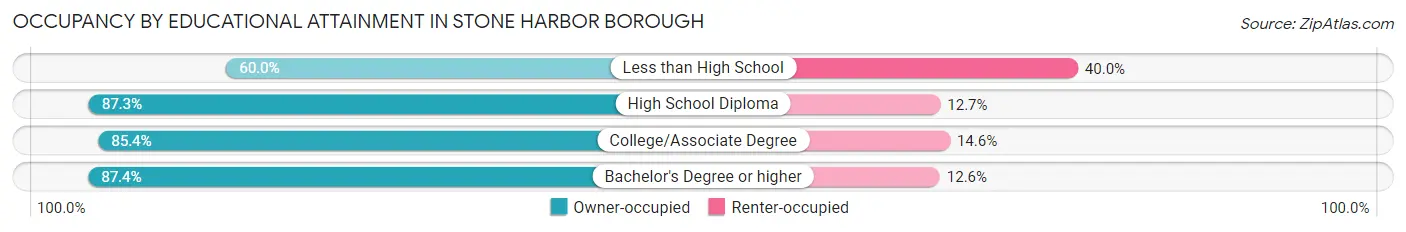
| Household Size | Owner-occupied | Renter-occupied |
| Less than High School | 12 (60.0%) | 8 (40.0%) |
| High School Diploma | 48 (87.3%) | 7 (12.7%) |
| College/Associate Degree | 35 (85.4%) | 6 (14.6%) |
| Bachelor's Degree or higher | 325 (87.4%) | 47 (12.6%) |
Occupancy by Age of Householder in Stone Harbor borough
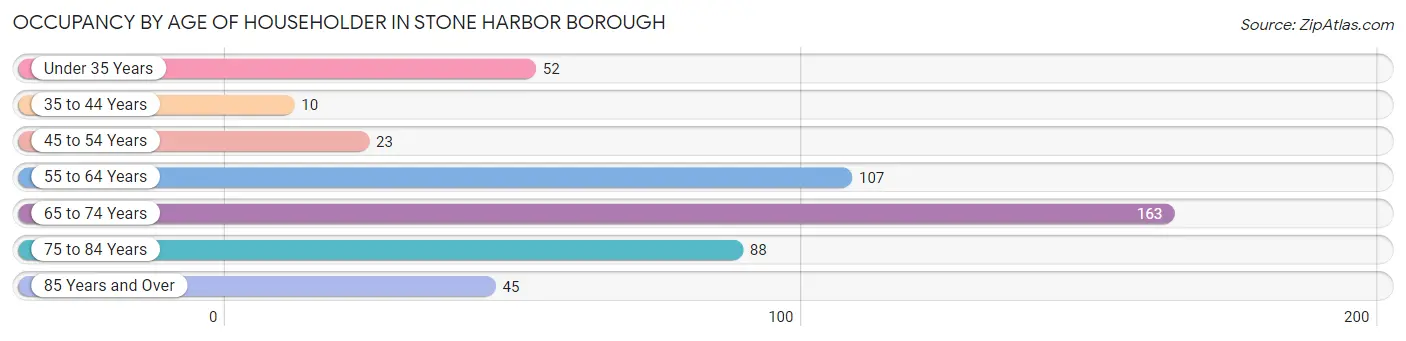
| Age Bracket | # Households | % Households |
| Under 35 Years | 52 | 10.7% |
| 35 to 44 Years | 10 | 2.1% |
| 45 to 54 Years | 23 | 4.7% |
| 55 to 64 Years | 107 | 21.9% |
| 65 to 74 Years | 163 | 33.4% |
| 75 to 84 Years | 88 | 18.0% |
| 85 Years and Over | 45 | 9.2% |
| Total | 488 | 100.0% |
Housing Finances in Stone Harbor borough
Median Income by Occupancy in Stone Harbor borough
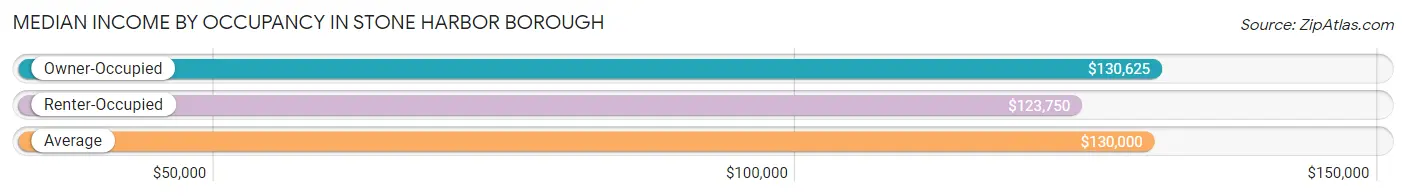
| Occupancy Type | # Households | Median Income |
| Owner-Occupied | 420 (86.1%) | $130,625 |
| Renter-Occupied | 68 (13.9%) | $123,750 |
| Average | 488 (100.0%) | $130,000 |
Occupancy by Householder Income Bracket in Stone Harbor borough
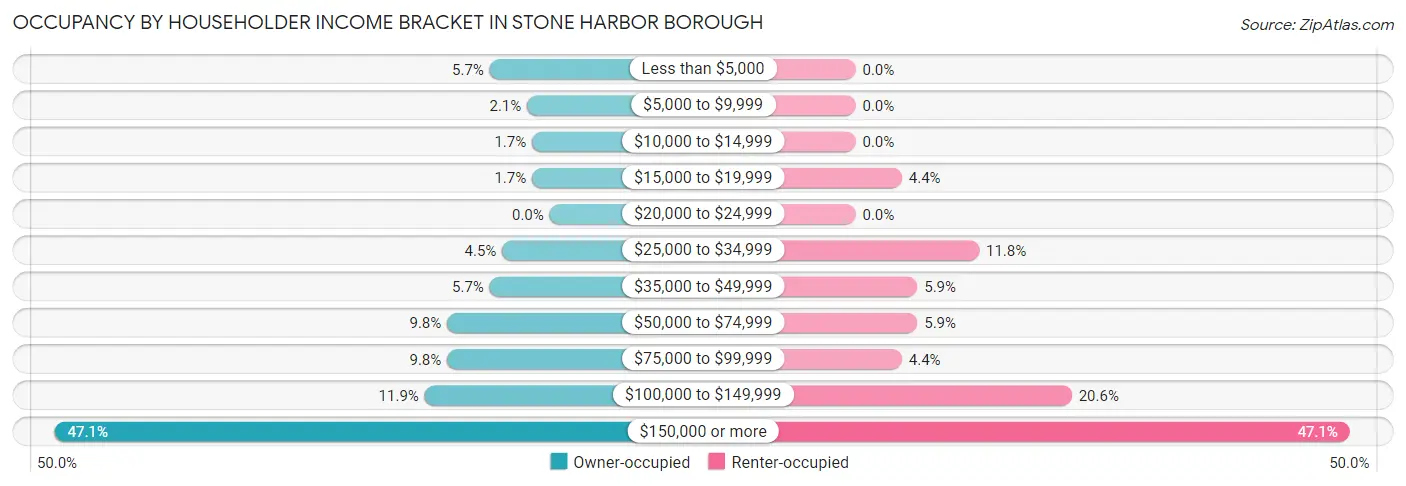
| Income Bracket | Owner-occupied | Renter-occupied |
| Less than $5,000 | 24 (5.7%) | 0 (0.0%) |
| $5,000 to $9,999 | 9 (2.1%) | 0 (0.0%) |
| $10,000 to $14,999 | 7 (1.7%) | 0 (0.0%) |
| $15,000 to $19,999 | 7 (1.7%) | 3 (4.4%) |
| $20,000 to $24,999 | 0 (0.0%) | 0 (0.0%) |
| $25,000 to $34,999 | 19 (4.5%) | 8 (11.8%) |
| $35,000 to $49,999 | 24 (5.7%) | 4 (5.9%) |
| $50,000 to $74,999 | 41 (9.8%) | 4 (5.9%) |
| $75,000 to $99,999 | 41 (9.8%) | 3 (4.4%) |
| $100,000 to $149,999 | 50 (11.9%) | 14 (20.6%) |
| $150,000 or more | 198 (47.1%) | 32 (47.1%) |
| Total | 420 (100.0%) | 68 (100.0%) |
Monthly Housing Cost Tiers in Stone Harbor borough
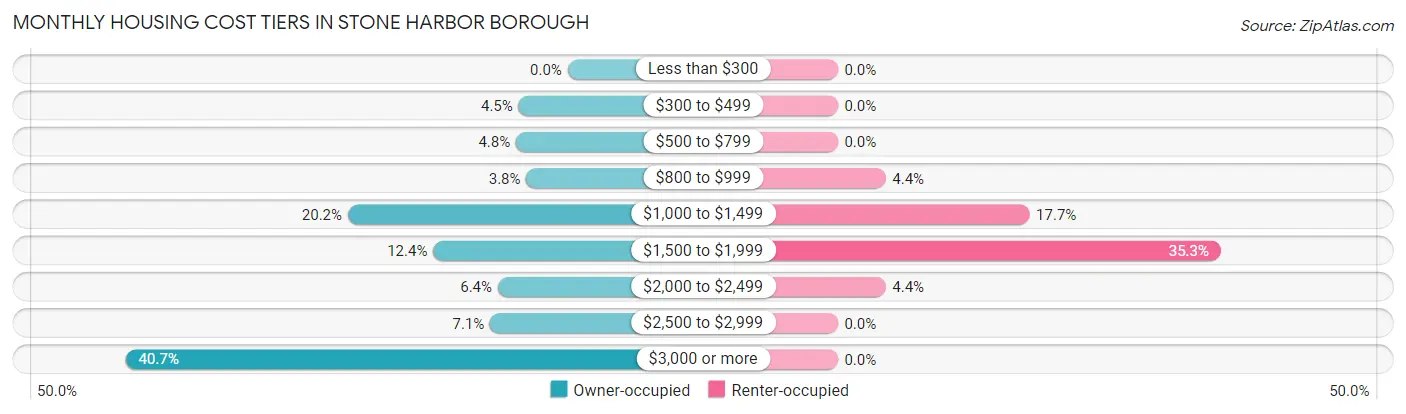
| Monthly Cost | Owner-occupied | Renter-occupied |
| Less than $300 | 0 (0.0%) | 0 (0.0%) |
| $300 to $499 | 19 (4.5%) | 0 (0.0%) |
| $500 to $799 | 20 (4.8%) | 0 (0.0%) |
| $800 to $999 | 16 (3.8%) | 3 (4.4%) |
| $1,000 to $1,499 | 85 (20.2%) | 12 (17.6%) |
| $1,500 to $1,999 | 52 (12.4%) | 24 (35.3%) |
| $2,000 to $2,499 | 27 (6.4%) | 3 (4.4%) |
| $2,500 to $2,999 | 30 (7.1%) | 0 (0.0%) |
| $3,000 or more | 171 (40.7%) | 0 (0.0%) |
| Total | 420 (100.0%) | 68 (100.0%) |
Physical Housing Characteristics in Stone Harbor borough
Housing Structures in Stone Harbor borough
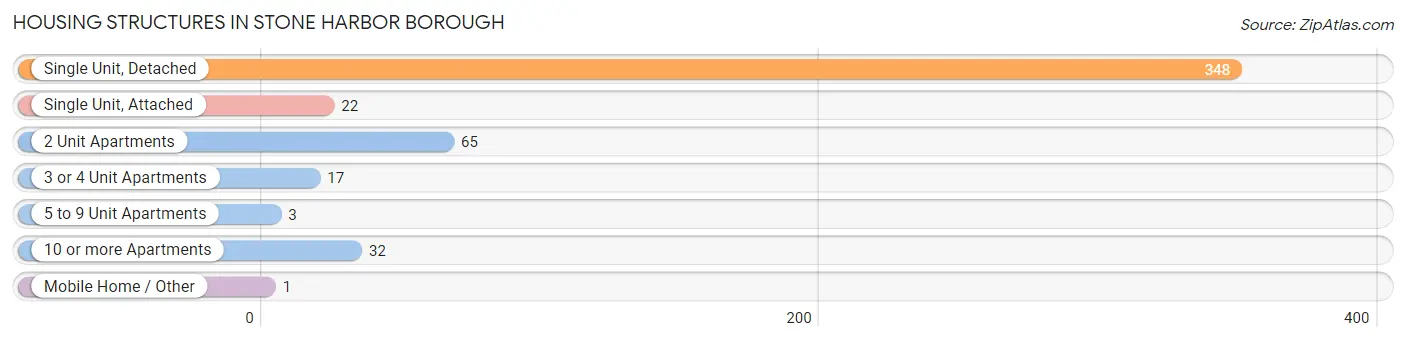
| Structure Type | # Housing Units | % Housing Units |
| Single Unit, Detached | 348 | 71.3% |
| Single Unit, Attached | 22 | 4.5% |
| 2 Unit Apartments | 65 | 13.3% |
| 3 or 4 Unit Apartments | 17 | 3.5% |
| 5 to 9 Unit Apartments | 3 | 0.6% |
| 10 or more Apartments | 32 | 6.6% |
| Mobile Home / Other | 1 | 0.2% |
| Total | 488 | 100.0% |
Housing Structures by Occupancy in Stone Harbor borough
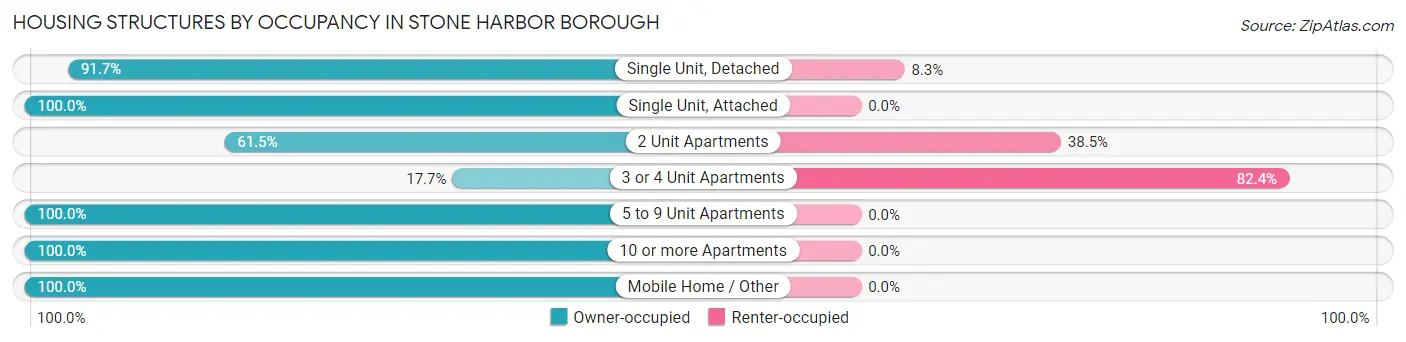
| Structure Type | Owner-occupied | Renter-occupied |
| Single Unit, Detached | 319 (91.7%) | 29 (8.3%) |
| Single Unit, Attached | 22 (100.0%) | 0 (0.0%) |
| 2 Unit Apartments | 40 (61.5%) | 25 (38.5%) |
| 3 or 4 Unit Apartments | 3 (17.6%) | 14 (82.4%) |
| 5 to 9 Unit Apartments | 3 (100.0%) | 0 (0.0%) |
| 10 or more Apartments | 32 (100.0%) | 0 (0.0%) |
| Mobile Home / Other | 1 (100.0%) | 0 (0.0%) |
| Total | 420 (86.1%) | 68 (13.9%) |
Housing Structures by Number of Rooms in Stone Harbor borough
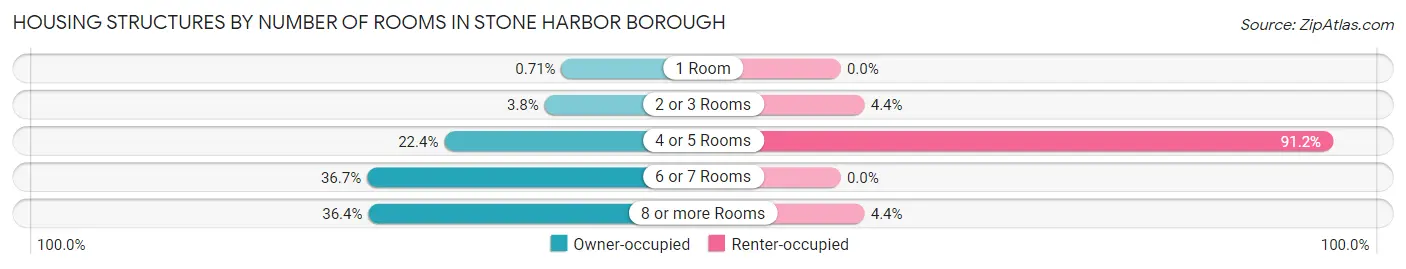
| Number of Rooms | Owner-occupied | Renter-occupied |
| 1 Room | 3 (0.7%) | 0 (0.0%) |
| 2 or 3 Rooms | 16 (3.8%) | 3 (4.4%) |
| 4 or 5 Rooms | 94 (22.4%) | 62 (91.2%) |
| 6 or 7 Rooms | 154 (36.7%) | 0 (0.0%) |
| 8 or more Rooms | 153 (36.4%) | 3 (4.4%) |
| Total | 420 (100.0%) | 68 (100.0%) |
Housing Structure by Heating Type in Stone Harbor borough
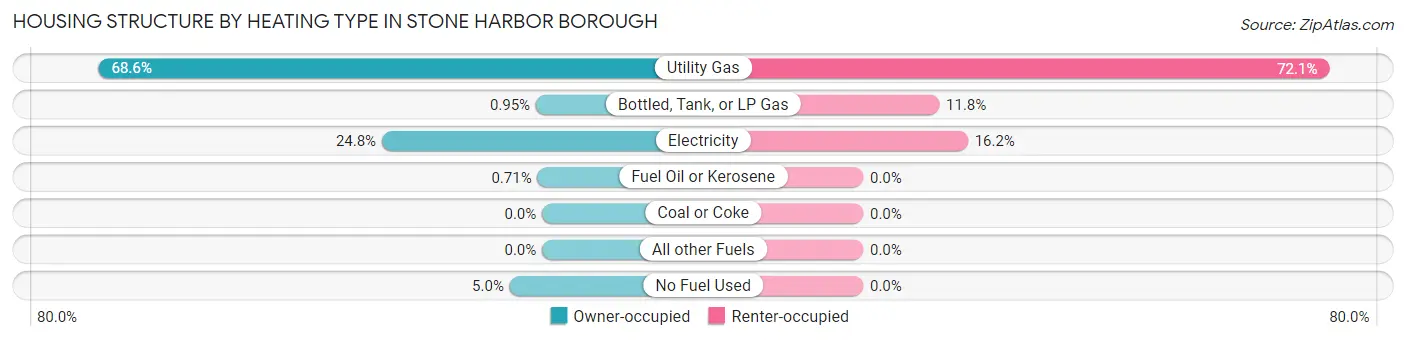
| Heating Type | Owner-occupied | Renter-occupied |
| Utility Gas | 288 (68.6%) | 49 (72.1%) |
| Bottled, Tank, or LP Gas | 4 (0.9%) | 8 (11.8%) |
| Electricity | 104 (24.8%) | 11 (16.2%) |
| Fuel Oil or Kerosene | 3 (0.7%) | 0 (0.0%) |
| Coal or Coke | 0 (0.0%) | 0 (0.0%) |
| All other Fuels | 0 (0.0%) | 0 (0.0%) |
| No Fuel Used | 21 (5.0%) | 0 (0.0%) |
| Total | 420 (100.0%) | 68 (100.0%) |
Household Vehicle Usage in Stone Harbor borough
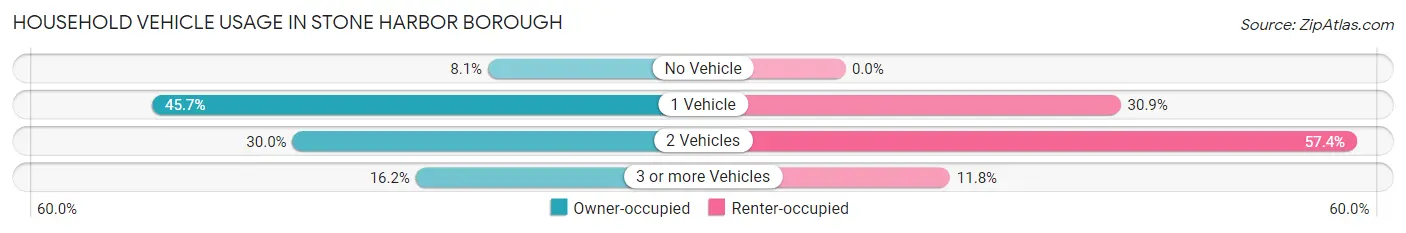
| Vehicles per Household | Owner-occupied | Renter-occupied |
| No Vehicle | 34 (8.1%) | 0 (0.0%) |
| 1 Vehicle | 192 (45.7%) | 21 (30.9%) |
| 2 Vehicles | 126 (30.0%) | 39 (57.4%) |
| 3 or more Vehicles | 68 (16.2%) | 8 (11.8%) |
| Total | 420 (100.0%) | 68 (100.0%) |
Real Estate & Mortgages in Stone Harbor borough
Real Estate and Mortgage Overview in Stone Harbor borough
| Characteristic | Without Mortgage | With Mortgage |
| Housing Units | 227 | 193 |
| Median Property Value | $1,584,800 | $2,000,001 |
| Median Household Income | $114,375 | $117 |
| Monthly Housing Costs | $1,412 | $156 |
| Real Estate Taxes | $9,265 | $2 |
Property Value by Mortgage Status in Stone Harbor borough
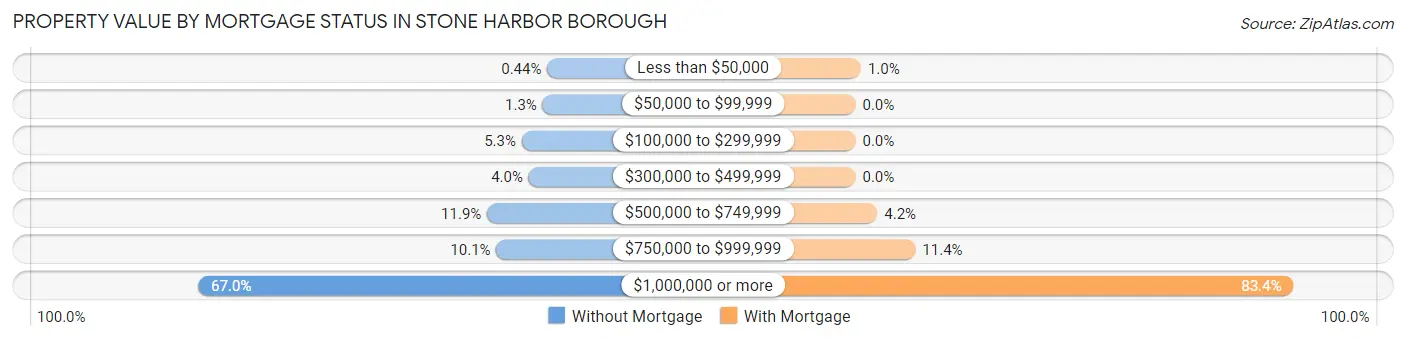
| Property Value | Without Mortgage | With Mortgage |
| Less than $50,000 | 1 (0.4%) | 2 (1.0%) |
| $50,000 to $99,999 | 3 (1.3%) | 0 (0.0%) |
| $100,000 to $299,999 | 12 (5.3%) | 0 (0.0%) |
| $300,000 to $499,999 | 9 (4.0%) | 0 (0.0%) |
| $500,000 to $749,999 | 27 (11.9%) | 8 (4.2%) |
| $750,000 to $999,999 | 23 (10.1%) | 22 (11.4%) |
| $1,000,000 or more | 152 (67.0%) | 161 (83.4%) |
| Total | 227 (100.0%) | 193 (100.0%) |
Household Income by Mortgage Status in Stone Harbor borough
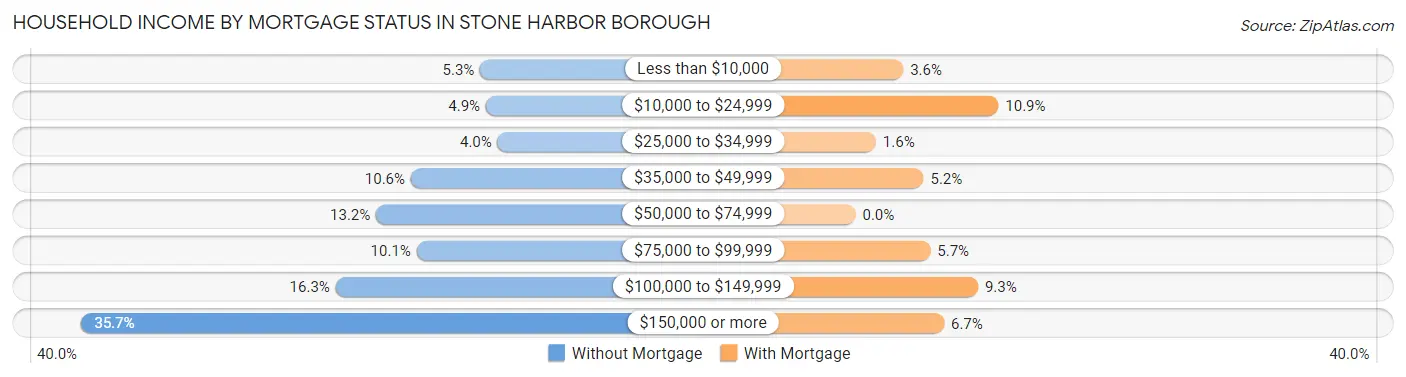
| Household Income | Without Mortgage | With Mortgage |
| Less than $10,000 | 12 (5.3%) | 7 (3.6%) |
| $10,000 to $24,999 | 11 (4.9%) | 21 (10.9%) |
| $25,000 to $34,999 | 9 (4.0%) | 3 (1.5%) |
| $35,000 to $49,999 | 24 (10.6%) | 10 (5.2%) |
| $50,000 to $74,999 | 30 (13.2%) | 0 (0.0%) |
| $75,000 to $99,999 | 23 (10.1%) | 11 (5.7%) |
| $100,000 to $149,999 | 37 (16.3%) | 18 (9.3%) |
| $150,000 or more | 81 (35.7%) | 13 (6.7%) |
| Total | 227 (100.0%) | 193 (100.0%) |
Property Value to Household Income Ratio in Stone Harbor borough
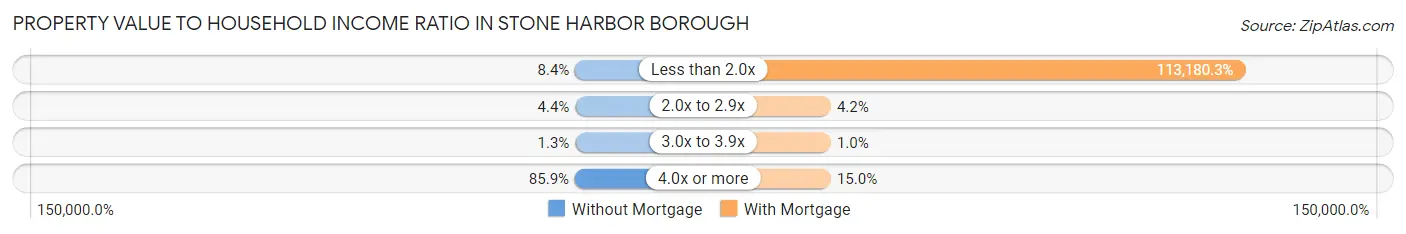
| Value-to-Income Ratio | Without Mortgage | With Mortgage |
| Less than 2.0x | 19 (8.4%) | 218,438 (113,180.3%) |
| 2.0x to 2.9x | 10 (4.4%) | 8 (4.2%) |
| 3.0x to 3.9x | 3 (1.3%) | 2 (1.0%) |
| 4.0x or more | 195 (85.9%) | 29 (15.0%) |
| Total | 227 (100.0%) | 193 (100.0%) |
Real Estate Taxes by Mortgage Status in Stone Harbor borough
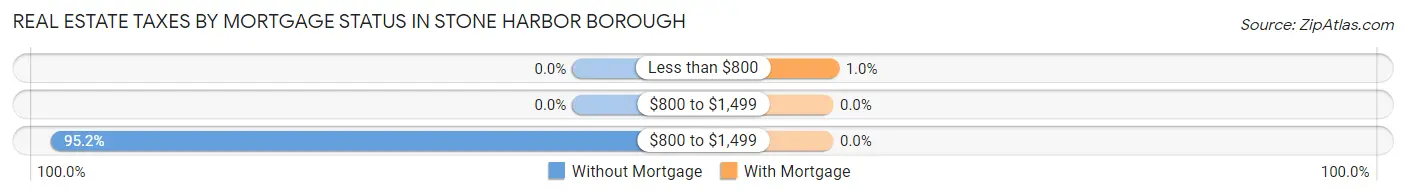
| Property Taxes | Without Mortgage | With Mortgage |
| Less than $800 | 0 (0.0%) | 2 (1.0%) |
| $800 to $1,499 | 0 (0.0%) | 0 (0.0%) |
| $800 to $1,499 | 216 (95.2%) | 0 (0.0%) |
| Total | 227 (100.0%) | 193 (100.0%) |
Health & Disability in Stone Harbor borough
Health Insurance Coverage by Age in Stone Harbor borough
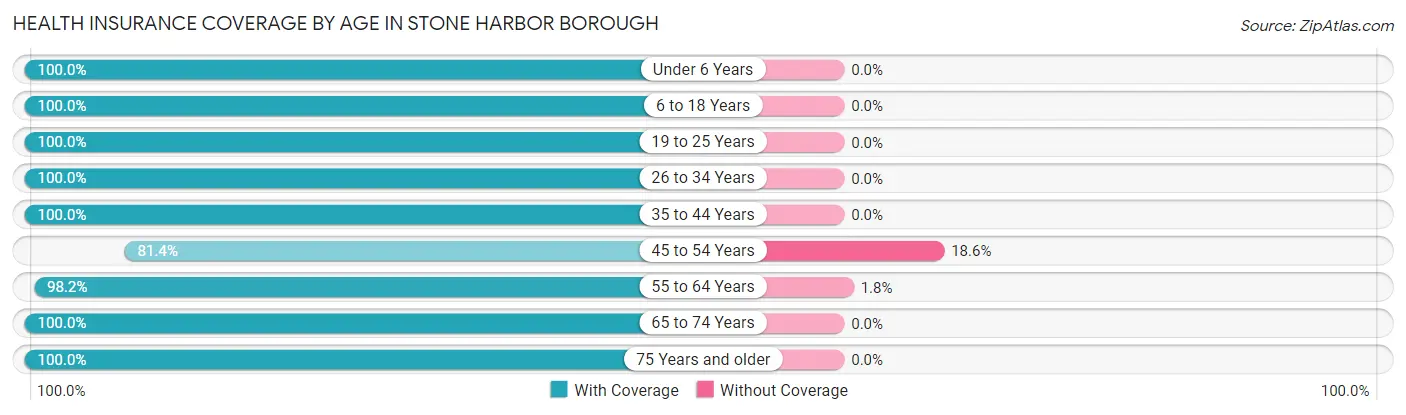
| Age Bracket | With Coverage | Without Coverage |
| Under 6 Years | 19 (100.0%) | 0 (0.0%) |
| 6 to 18 Years | 44 (100.0%) | 0 (0.0%) |
| 19 to 25 Years | 48 (100.0%) | 0 (0.0%) |
| 26 to 34 Years | 49 (100.0%) | 0 (0.0%) |
| 35 to 44 Years | 26 (100.0%) | 0 (0.0%) |
| 45 to 54 Years | 48 (81.4%) | 11 (18.6%) |
| 55 to 64 Years | 167 (98.2%) | 3 (1.8%) |
| 65 to 74 Years | 270 (100.0%) | 0 (0.0%) |
| 75 Years and older | 185 (100.0%) | 0 (0.0%) |
| Total | 856 (98.4%) | 14 (1.6%) |
Health Insurance Coverage by Citizenship Status in Stone Harbor borough
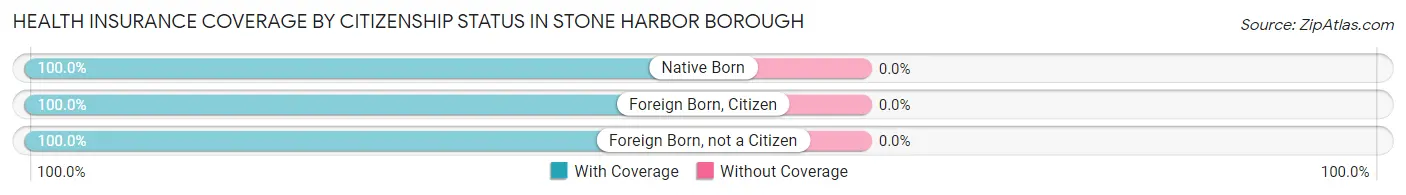
| Citizenship Status | With Coverage | Without Coverage |
| Native Born | 19 (100.0%) | 0 (0.0%) |
| Foreign Born, Citizen | 44 (100.0%) | 0 (0.0%) |
| Foreign Born, not a Citizen | 48 (100.0%) | 0 (0.0%) |
Health Insurance Coverage by Household Income in Stone Harbor borough
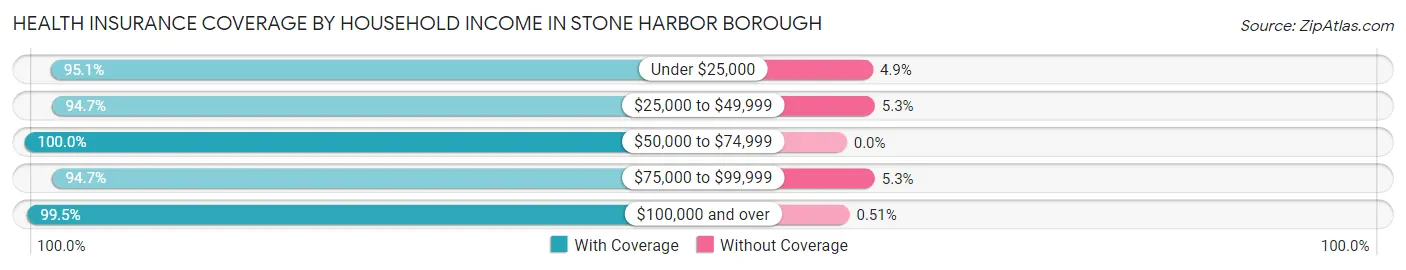
| Household Income | With Coverage | Without Coverage |
| Under $25,000 | 58 (95.1%) | 3 (4.9%) |
| $25,000 to $49,999 | 72 (94.7%) | 4 (5.3%) |
| $50,000 to $74,999 | 60 (100.0%) | 0 (0.0%) |
| $75,000 to $99,999 | 72 (94.7%) | 4 (5.3%) |
| $100,000 and over | 589 (99.5%) | 3 (0.5%) |
Public vs Private Health Insurance Coverage by Age in Stone Harbor borough
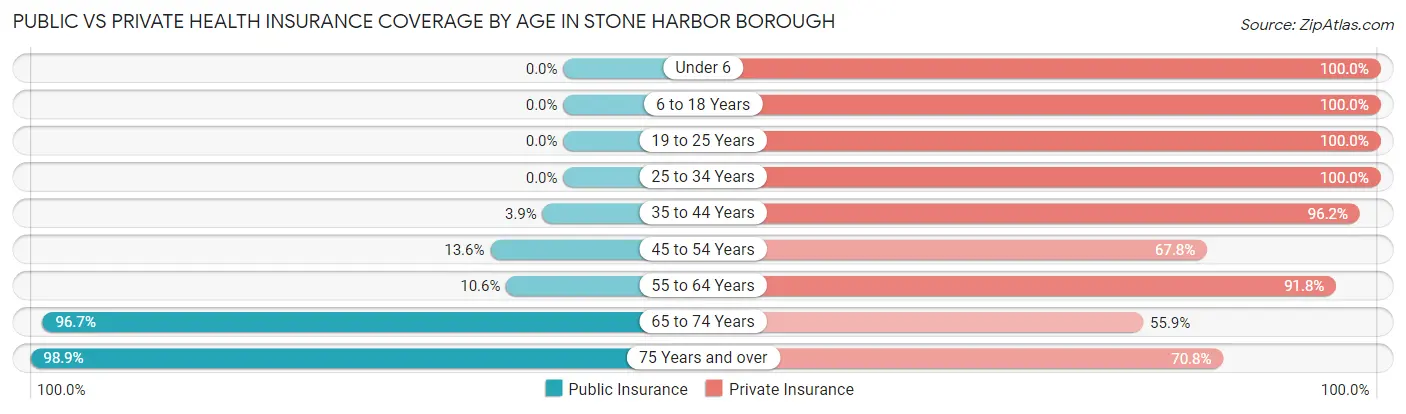
| Age Bracket | Public Insurance | Private Insurance |
| Under 6 | 0 (0.0%) | 19 (100.0%) |
| 6 to 18 Years | 0 (0.0%) | 44 (100.0%) |
| 19 to 25 Years | 0 (0.0%) | 48 (100.0%) |
| 25 to 34 Years | 0 (0.0%) | 49 (100.0%) |
| 35 to 44 Years | 1 (3.8%) | 25 (96.2%) |
| 45 to 54 Years | 8 (13.6%) | 40 (67.8%) |
| 55 to 64 Years | 18 (10.6%) | 156 (91.8%) |
| 65 to 74 Years | 261 (96.7%) | 151 (55.9%) |
| 75 Years and over | 183 (98.9%) | 131 (70.8%) |
| Total | 471 (54.1%) | 663 (76.2%) |
Disability Status by Sex by Age in Stone Harbor borough
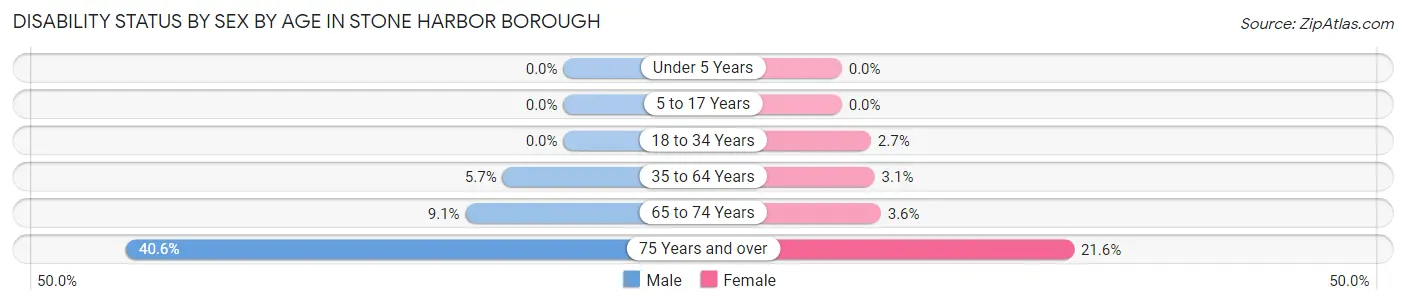
| Age Bracket | Male | Female |
| Under 5 Years | 0 (0.0%) | 0 (0.0%) |
| 5 to 17 Years | 0 (0.0%) | 0 (0.0%) |
| 18 to 34 Years | 0 (0.0%) | 2 (2.7%) |
| 35 to 64 Years | 7 (5.7%) | 4 (3.0%) |
| 65 to 74 Years | 12 (9.1%) | 5 (3.6%) |
| 75 Years and over | 28 (40.6%) | 25 (21.5%) |
Disability Class by Sex by Age in Stone Harbor borough
Disability Class: Hearing Difficulty
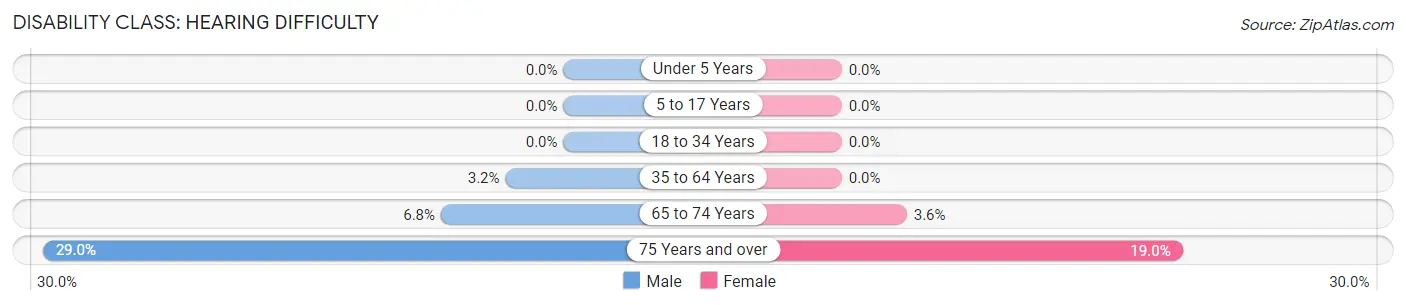
| Age Bracket | Male | Female |
| Under 5 Years | 0 (0.0%) | 0 (0.0%) |
| 5 to 17 Years | 0 (0.0%) | 0 (0.0%) |
| 18 to 34 Years | 0 (0.0%) | 0 (0.0%) |
| 35 to 64 Years | 4 (3.2%) | 0 (0.0%) |
| 65 to 74 Years | 9 (6.8%) | 5 (3.6%) |
| 75 Years and over | 20 (29.0%) | 22 (19.0%) |
Disability Class: Vision Difficulty
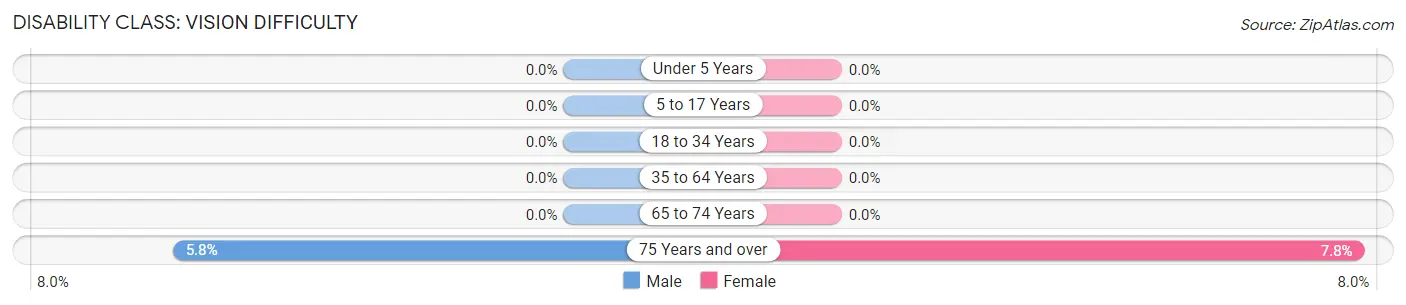
| Age Bracket | Male | Female |
| Under 5 Years | 0 (0.0%) | 0 (0.0%) |
| 5 to 17 Years | 0 (0.0%) | 0 (0.0%) |
| 18 to 34 Years | 0 (0.0%) | 0 (0.0%) |
| 35 to 64 Years | 0 (0.0%) | 0 (0.0%) |
| 65 to 74 Years | 0 (0.0%) | 0 (0.0%) |
| 75 Years and over | 4 (5.8%) | 9 (7.8%) |
Disability Class: Cognitive Difficulty
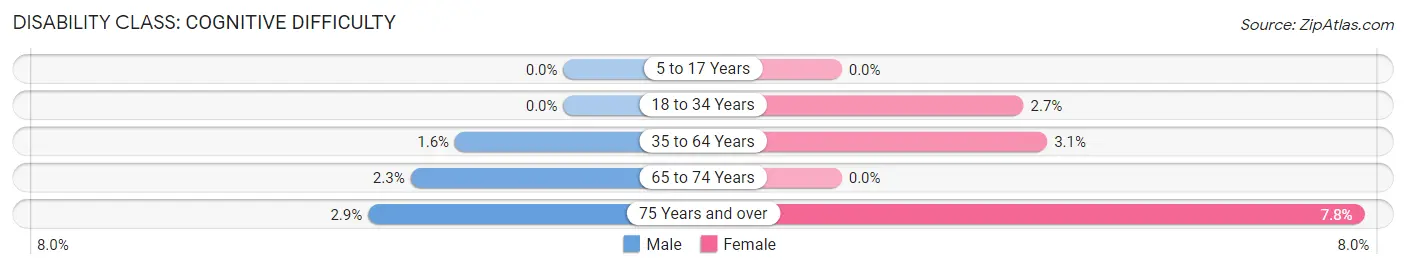
| Age Bracket | Male | Female |
| 5 to 17 Years | 0 (0.0%) | 0 (0.0%) |
| 18 to 34 Years | 0 (0.0%) | 2 (2.7%) |
| 35 to 64 Years | 2 (1.6%) | 4 (3.0%) |
| 65 to 74 Years | 3 (2.3%) | 0 (0.0%) |
| 75 Years and over | 2 (2.9%) | 9 (7.8%) |
Disability Class: Ambulatory Difficulty
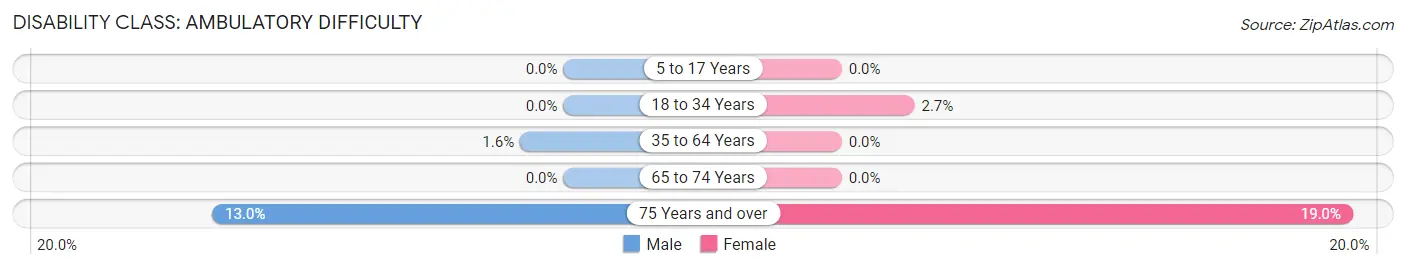
| Age Bracket | Male | Female |
| 5 to 17 Years | 0 (0.0%) | 0 (0.0%) |
| 18 to 34 Years | 0 (0.0%) | 2 (2.7%) |
| 35 to 64 Years | 2 (1.6%) | 0 (0.0%) |
| 65 to 74 Years | 0 (0.0%) | 0 (0.0%) |
| 75 Years and over | 9 (13.0%) | 22 (19.0%) |
Disability Class: Self-Care Difficulty
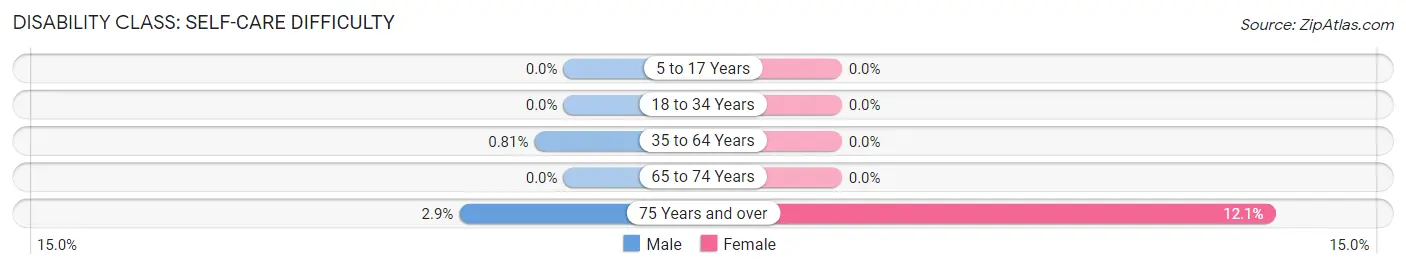
| Age Bracket | Male | Female |
| 5 to 17 Years | 0 (0.0%) | 0 (0.0%) |
| 18 to 34 Years | 0 (0.0%) | 0 (0.0%) |
| 35 to 64 Years | 1 (0.8%) | 0 (0.0%) |
| 65 to 74 Years | 0 (0.0%) | 0 (0.0%) |
| 75 Years and over | 2 (2.9%) | 14 (12.1%) |
Technology Access in Stone Harbor borough
Computing Device Access in Stone Harbor borough
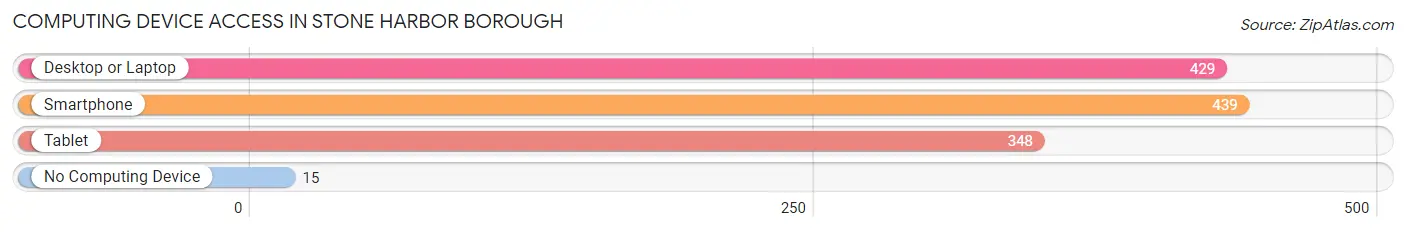
| Device Type | # Households | % Households |
| Desktop or Laptop | 429 | 87.9% |
| Smartphone | 439 | 90.0% |
| Tablet | 348 | 71.3% |
| No Computing Device | 15 | 3.1% |
| Total | 488 | 100.0% |
Internet Access in Stone Harbor borough
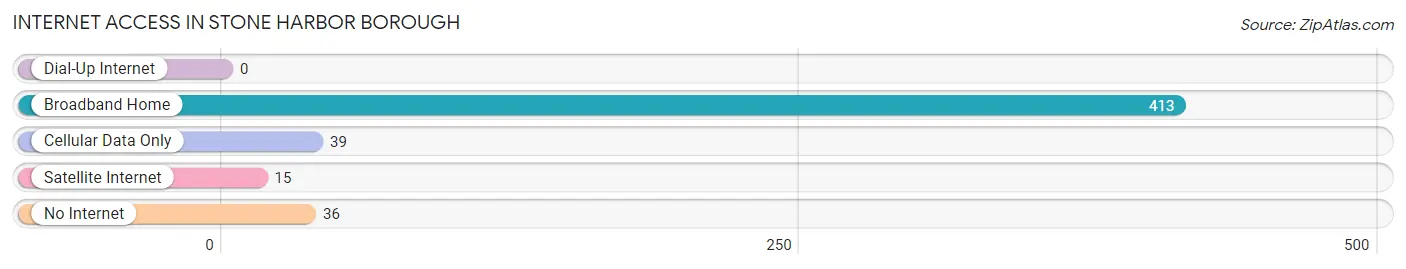
| Internet Type | # Households | % Households |
| Dial-Up Internet | 0 | 0.0% |
| Broadband Home | 413 | 84.6% |
| Cellular Data Only | 39 | 8.0% |
| Satellite Internet | 15 | 3.1% |
| No Internet | 36 | 7.4% |
| Total | 488 | 100.0% |
Stone Harbor borough Summary
History
Stone Harbor Borough is a small coastal town located in Cape May County, New Jersey. It is situated on Seven Mile Island, which is a barrier island located between the Atlantic Ocean and the back bays of the mainland. The town was originally known as “Townsend’s Inlet” and was founded in 1894 by William Townsend. The town was renamed “Stone Harbor” in 1895 after the abundance of stones found on the beach.
The town was originally a fishing village and was home to a number of commercial fishing boats. In the early 1900s, the town began to attract tourists and vacationers, and the fishing industry began to decline. The town was incorporated in 1914 and the first mayor was elected in 1915.
In the 1920s, the town began to develop as a resort destination. Hotels, restaurants, and other businesses began to open up, and the town began to attract more and more visitors. The town was also home to a number of summer homes and cottages, which were popular with vacationers.
In the 1950s, the town began to develop into a year-round community. The population began to grow and the town began to attract more and more permanent residents. The town was also home to a number of businesses, including a number of restaurants, shops, and other businesses.
Geography
Stone Harbor Borough is located in Cape May County, New Jersey. It is situated on Seven Mile Island, which is a barrier island located between the Atlantic Ocean and the back bays of the mainland. The town is bordered by Avalon Borough to the north, Sea Isle City to the south, and Strathmere to the west.
The town is located on a narrow strip of land that is approximately two miles long and one mile wide. The town is located on the Atlantic Ocean side of the island and is bordered by the Atlantic Ocean to the east and the back bays of the mainland to the west.
The town is home to a number of beaches, including Stone Harbor Beach, 80th Street Beach, and 96th Street Beach. The town is also home to a number of parks, including Stone Harbor Point, Stone Harbor Wildlife Refuge, and Stone Harbor Bird Sanctuary.
Economy
The economy of Stone Harbor Borough is largely based on tourism and hospitality. The town is home to a number of hotels, restaurants, and other businesses that cater to tourists and vacationers. The town is also home to a number of retail stores, including clothing stores, souvenir shops, and other stores.
The town is also home to a number of businesses that provide services to the local community, including medical offices, banks, and other businesses. The town is also home to a number of marinas, which provide services to boaters and fishermen.
Demographics
As of the 2010 census, the population of Stone Harbor Borough was 1,521. The population is largely white (94.3%) and the median age is 48.7 years. The median household income is $77,917 and the median home value is $817,500.
The town is home to a number of seasonal residents, as well as a number of permanent residents. The town is also home to a number of retirees, as well as a number of young professionals. The town is also home to a number of businesses, including hotels, restaurants, and other businesses.
Common Questions
What is Per Capita Income in Stone Harbor borough?
Per Capita income in Stone Harbor borough is $123,693.
What is the Median Family Income in Stone Harbor borough?
Median Family Income in Stone Harbor borough is $194,583.
What is the Median Household income in Stone Harbor borough?
Median Household Income in Stone Harbor borough is $130,000.
What is Income or Wage Gap in Stone Harbor borough?
Income or Wage Gap in Stone Harbor borough is 66.4%.
Women in Stone Harbor borough earn 33.6 cents for every dollar earned by a man.
What is Inequality or Gini Index in Stone Harbor borough?
Inequality or Gini Index in Stone Harbor borough is 0.56.
What is the Total Population of Stone Harbor borough?
Total Population of Stone Harbor borough is 887.
What is the Total Male Population of Stone Harbor borough?
Total Male Population of Stone Harbor borough is 404.
What is the Total Female Population of Stone Harbor borough?
Total Female Population of Stone Harbor borough is 483.
What is the Ratio of Males per 100 Females in Stone Harbor borough?
There are 83.64 Males per 100 Females in Stone Harbor borough.
What is the Ratio of Females per 100 Males in Stone Harbor borough?
There are 119.55 Females per 100 Males in Stone Harbor borough.
What is the Median Population Age in Stone Harbor borough?
Median Population Age in Stone Harbor borough is 65.7 Years.
What is the Average Family Size in Stone Harbor borough
Average Family Size in Stone Harbor borough is 2.3 People.
What is the Average Household Size in Stone Harbor borough
Average Household Size in Stone Harbor borough is 1.8 People.
How Large is the Labor Force in Stone Harbor borough?
There are 378 People in the Labor Forcein in Stone Harbor borough.
What is the Percentage of People in the Labor Force in Stone Harbor borough?
43.8% of People are in the Labor Force in Stone Harbor borough.
What is the Unemployment Rate in Stone Harbor borough?
Unemployment Rate in Stone Harbor borough is 3.6%.