Ho Ho Kus borough, NJ Map & Demographics
Ho Ho Kus borough Overview
$127,820
PER CAPITA INCOME
$250,001
AVG FAMILY INCOME
$250,001
AVG HOUSEHOLD INCOME
59.2%
WAGE / INCOME GAP [ % ]
40.8¢/ $1
WAGE / INCOME GAP [ $ ]
0.44
INEQUALITY / GINI INDEX
4,234
TOTAL POPULATION
2,136
MALE POPULATION
2,098
FEMALE POPULATION
101.81
MALES / 100 FEMALES
98.22
FEMALES / 100 MALES
43.0
MEDIAN AGE
3.4
AVG FAMILY SIZE
3.0
AVG HOUSEHOLD SIZE
2,146
LABOR FORCE [ PEOPLE ]
69.4%
PERCENT IN LABOR FORCE
2.0%
UNEMPLOYMENT RATE
Income in Ho Ho Kus borough
Income Overview in Ho Ho Kus borough
Per Capita Income in Ho Ho Kus borough is $127,820, while median incomes of families and households are $250,001 and $250,001 respectively.
| Characteristic | Number | Measure |
| Per Capita Income | 4,234 | $127,820 |
| Median Family Income | 1,180 | $250,001 |
| Mean Family Income | 1,180 | $420,093 |
| Median Household Income | 1,409 | $250,001 |
| Mean Household Income | 1,409 | $387,818 |
| Income Deficit | 1,180 | $0 |
| Wage / Income Gap (%) | 4,234 | 59.20% |
| Wage / Income Gap ($) | 4,234 | 40.80¢ per $1 |
| Gini / Inequality Index | 4,234 | 0.44 |
Earnings by Sex in Ho Ho Kus borough
Average Earnings in Ho Ho Kus borough are $109,922, $191,250 for men and $78,026 for women, a difference of 59.2%.
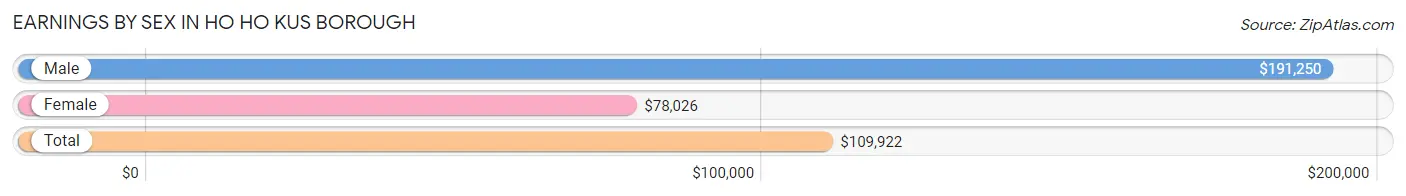
| Sex | Number | Average Earnings |
| Male | 1,176 (50.2%) | $191,250 |
| Female | 1,166 (49.8%) | $78,026 |
| Total | 2,342 (100.0%) | $109,922 |
Earnings by Sex by Income Bracket in Ho Ho Kus borough
The most common earnings brackets in Ho Ho Kus borough are $100,000+ for men (853 | 72.5%) and $100,000+ for women (393 | 33.7%).
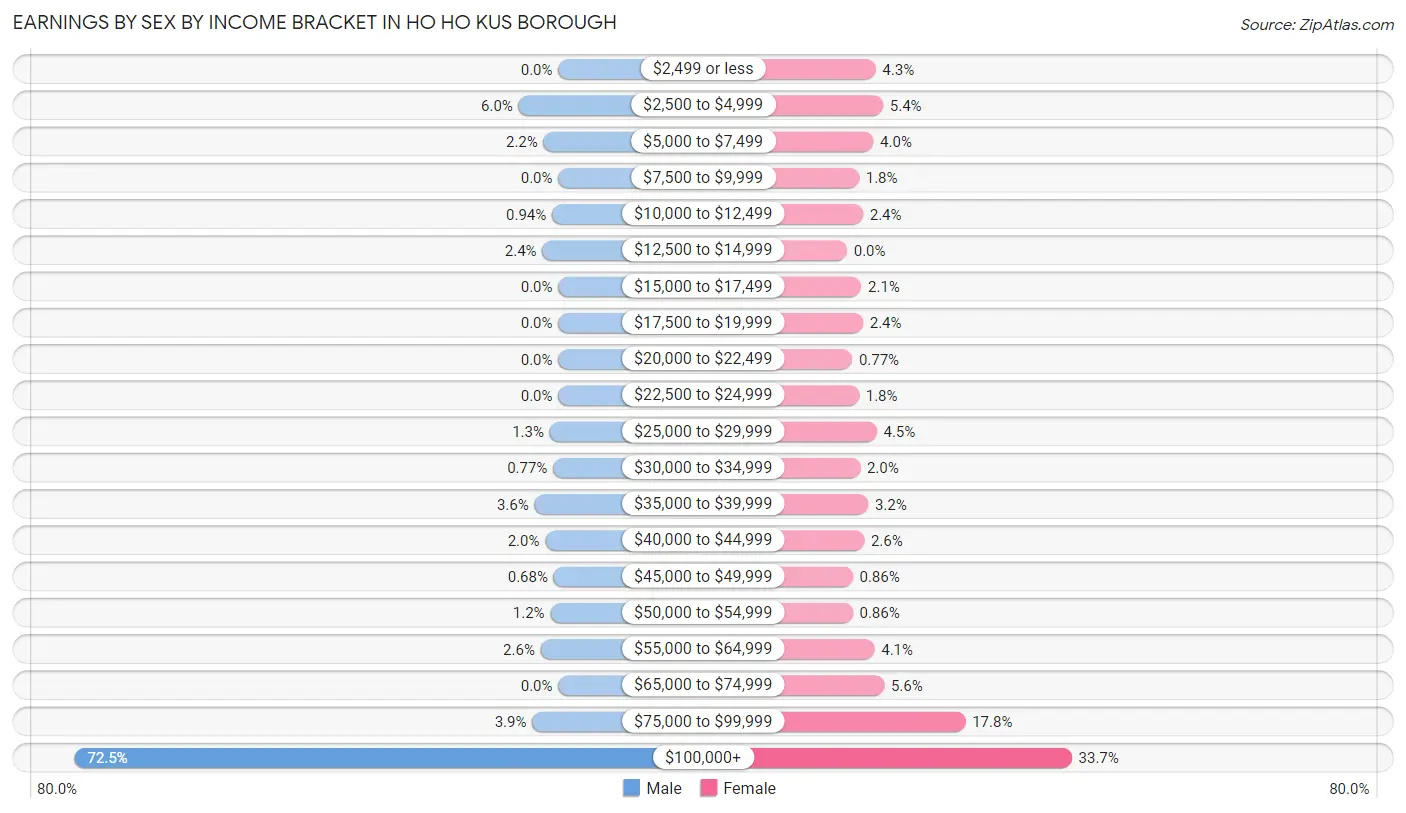
| Income | Male | Female |
| $2,499 or less | 0 (0.0%) | 50 (4.3%) |
| $2,500 to $4,999 | 70 (5.9%) | 63 (5.4%) |
| $5,000 to $7,499 | 26 (2.2%) | 46 (4.0%) |
| $7,500 to $9,999 | 0 (0.0%) | 21 (1.8%) |
| $10,000 to $12,499 | 11 (0.9%) | 28 (2.4%) |
| $12,500 to $14,999 | 28 (2.4%) | 0 (0.0%) |
| $15,000 to $17,499 | 0 (0.0%) | 25 (2.1%) |
| $17,500 to $19,999 | 0 (0.0%) | 28 (2.4%) |
| $20,000 to $22,499 | 0 (0.0%) | 9 (0.8%) |
| $22,500 to $24,999 | 0 (0.0%) | 21 (1.8%) |
| $25,000 to $29,999 | 15 (1.3%) | 52 (4.5%) |
| $30,000 to $34,999 | 9 (0.8%) | 23 (2.0%) |
| $35,000 to $39,999 | 42 (3.6%) | 37 (3.2%) |
| $40,000 to $44,999 | 23 (2.0%) | 30 (2.6%) |
| $45,000 to $49,999 | 8 (0.7%) | 10 (0.9%) |
| $50,000 to $54,999 | 14 (1.2%) | 10 (0.9%) |
| $55,000 to $64,999 | 31 (2.6%) | 48 (4.1%) |
| $65,000 to $74,999 | 0 (0.0%) | 65 (5.6%) |
| $75,000 to $99,999 | 46 (3.9%) | 207 (17.7%) |
| $100,000+ | 853 (72.5%) | 393 (33.7%) |
| Total | 1,176 (100.0%) | 1,166 (100.0%) |
Earnings by Sex by Educational Attainment in Ho Ho Kus borough
Average earnings in Ho Ho Kus borough are $250,001 for men and $81,229 for women, a difference of 67.5%. Men with an educational attainment of graduate degree enjoy the highest average annual earnings of $250,001, while those with college or associate's degree education earn the least with $94,750. Women with an educational attainment of graduate degree earn the most with the average annual earnings of $108,008, while those with college or associate's degree education have the smallest earnings of $68,042.
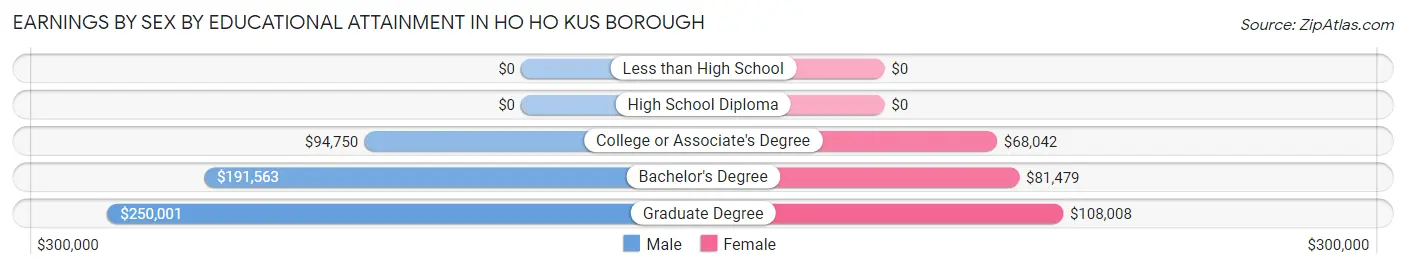
| Educational Attainment | Male Income | Female Income |
| Less than High School | - | - |
| High School Diploma | - | - |
| College or Associate's Degree | $94,750 | $68,042 |
| Bachelor's Degree | $191,563 | $81,479 |
| Graduate Degree | $250,001 | $108,008 |
| Total | $250,001 | $81,229 |
Family Income in Ho Ho Kus borough
Family Income Brackets in Ho Ho Kus borough
According to the Ho Ho Kus borough family income data, there are 861 families falling into the $200,000+ income range, which is the most common income bracket and makes up 73.0% of all families.
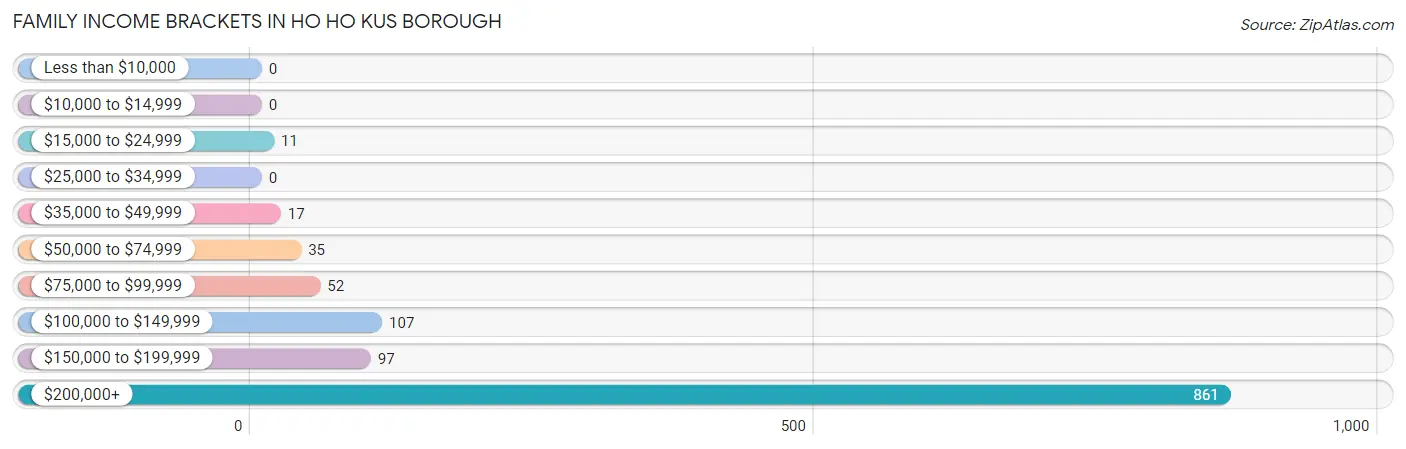
| Income Bracket | # Families | % Families |
| Less than $10,000 | 0 | 0.0% |
| $10,000 to $14,999 | 0 | 0.0% |
| $15,000 to $24,999 | 11 | 0.9% |
| $25,000 to $34,999 | 0 | 0.0% |
| $35,000 to $49,999 | 17 | 1.4% |
| $50,000 to $74,999 | 35 | 3.0% |
| $75,000 to $99,999 | 52 | 4.4% |
| $100,000 to $149,999 | 107 | 9.1% |
| $150,000 to $199,999 | 97 | 8.2% |
| $200,000+ | 861 | 73.0% |
Family Income by Famaliy Size in Ho Ho Kus borough
3-person families (254 | 21.5%) account for the highest median family income in Ho Ho Kus borough with $250,001 per family, while 2-person families (333 | 28.2%) have the highest median income of $105,703 per family member.
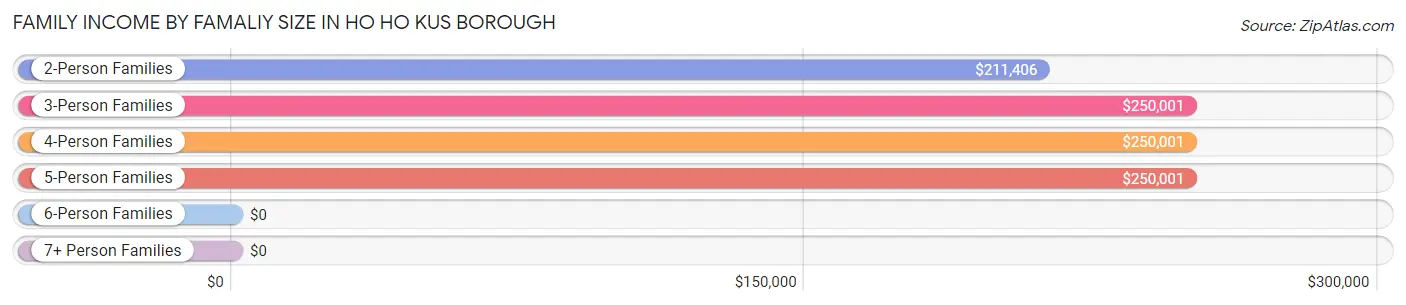
| Income Bracket | # Families | Median Income |
| 2-Person Families | 333 (28.2%) | $211,406 |
| 3-Person Families | 254 (21.5%) | $250,001 |
| 4-Person Families | 436 (36.9%) | $250,001 |
| 5-Person Families | 136 (11.5%) | $250,001 |
| 6-Person Families | 21 (1.8%) | $0 |
| 7+ Person Families | 0 (0.0%) | $0 |
| Total | 1,180 (100.0%) | $250,001 |
Family Income by Number of Earners in Ho Ho Kus borough
The median family income in Ho Ho Kus borough is $250,001, with families comprising 2 earners (676) having the highest median family income of $250,001, while families with no earners (78) have the lowest median family income of $144,500, accounting for 57.3% and 6.6% of families, respectively.
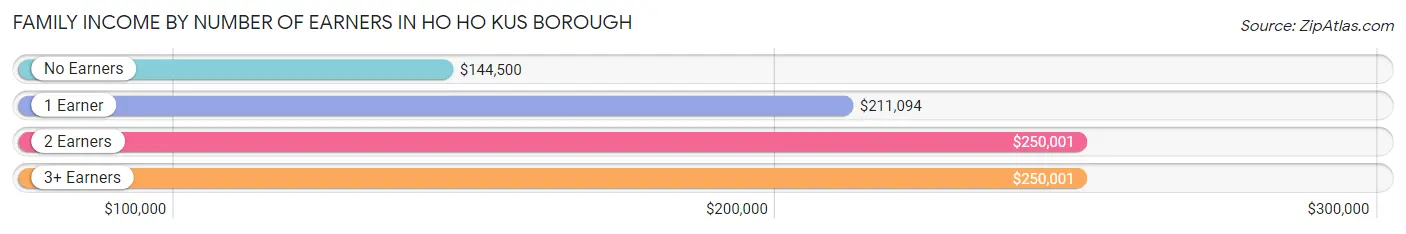
| Number of Earners | # Families | Median Income |
| No Earners | 78 (6.6%) | $144,500 |
| 1 Earner | 307 (26.0%) | $211,094 |
| 2 Earners | 676 (57.3%) | $250,001 |
| 3+ Earners | 119 (10.1%) | $250,001 |
| Total | 1,180 (100.0%) | $250,001 |
Household Income in Ho Ho Kus borough
Household Income Brackets in Ho Ho Kus borough
With 919 households falling in the category, the $200,000+ income range is the most frequent in Ho Ho Kus borough, accounting for 65.2% of all households.
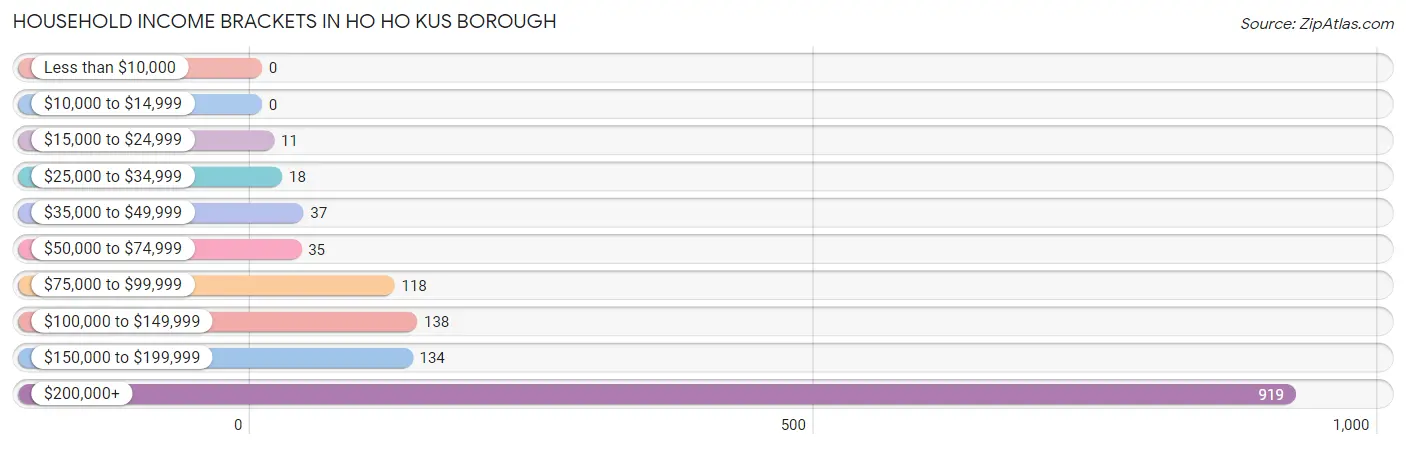
| Income Bracket | # Households | % Households |
| Less than $10,000 | 0 | 0.0% |
| $10,000 to $14,999 | 0 | 0.0% |
| $15,000 to $24,999 | 11 | 0.8% |
| $25,000 to $34,999 | 18 | 1.3% |
| $35,000 to $49,999 | 37 | 2.6% |
| $50,000 to $74,999 | 35 | 2.5% |
| $75,000 to $99,999 | 118 | 8.4% |
| $100,000 to $149,999 | 138 | 9.8% |
| $150,000 to $199,999 | 134 | 9.5% |
| $200,000+ | 919 | 65.2% |
Household Income by Householder Age in Ho Ho Kus borough
The median household income in Ho Ho Kus borough is $250,001, with the highest median household income of $250,001 found in the 25 to 44 years age bracket for the primary householder. A total of 288 households (20.4%) fall into this category.
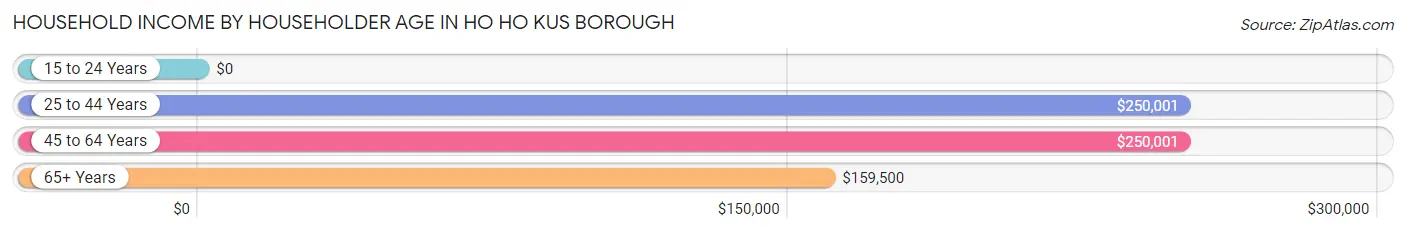
| Income Bracket | # Households | Median Income |
| 15 to 24 Years | 0 (0.0%) | $0 |
| 25 to 44 Years | 288 (20.4%) | $250,001 |
| 45 to 64 Years | 803 (57.0%) | $250,001 |
| 65+ Years | 318 (22.6%) | $159,500 |
| Total | 1,409 (100.0%) | $250,001 |
Poverty in Ho Ho Kus borough
Income Below Poverty by Sex and Age in Ho Ho Kus borough
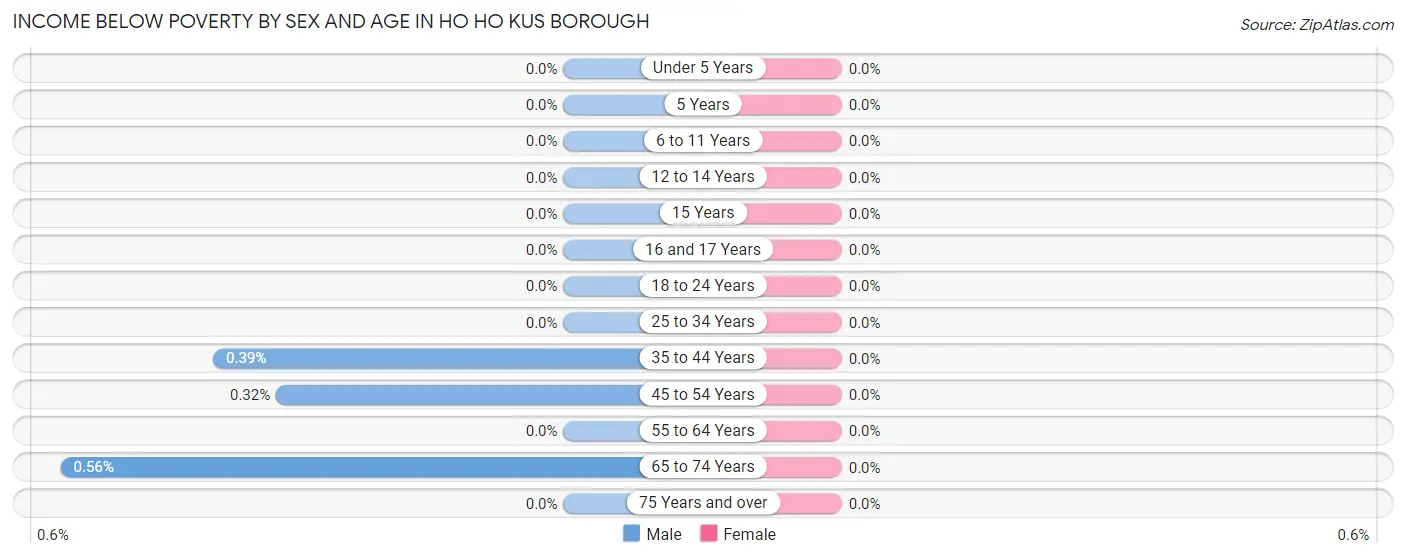
| Age Bracket | Male | Female |
| Under 5 Years | 0 (0.0%) | 0 (0.0%) |
| 5 Years | 0 (0.0%) | 0 (0.0%) |
| 6 to 11 Years | 0 (0.0%) | 0 (0.0%) |
| 12 to 14 Years | 0 (0.0%) | 0 (0.0%) |
| 15 Years | 0 (0.0%) | 0 (0.0%) |
| 16 and 17 Years | 0 (0.0%) | 0 (0.0%) |
| 18 to 24 Years | 0 (0.0%) | 0 (0.0%) |
| 25 to 34 Years | 0 (0.0%) | 0 (0.0%) |
| 35 to 44 Years | 1 (0.4%) | 0 (0.0%) |
| 45 to 54 Years | 1 (0.3%) | 0 (0.0%) |
| 55 to 64 Years | 0 (0.0%) | 0 (0.0%) |
| 65 to 74 Years | 1 (0.6%) | 0 (0.0%) |
| 75 Years and over | 0 (0.0%) | 0 (0.0%) |
| Total | 3 (0.1%) | 0 (0.0%) |
Income Above Poverty by Sex and Age in Ho Ho Kus borough
According to the poverty statistics in Ho Ho Kus borough, males aged under 5 years and females aged under 5 years are the age groups that are most secure financially, with 100.0% of males and 100.0% of females in these age groups living above the poverty line.
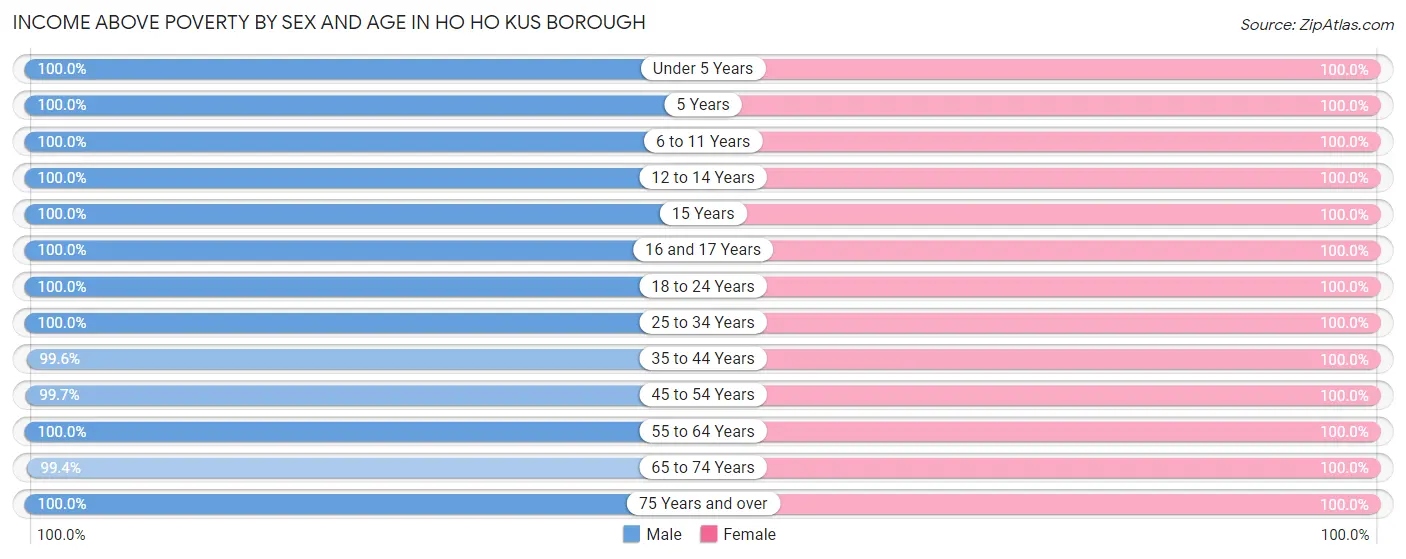
| Age Bracket | Male | Female |
| Under 5 Years | 175 (100.0%) | 126 (100.0%) |
| 5 Years | 36 (100.0%) | 32 (100.0%) |
| 6 to 11 Years | 300 (100.0%) | 151 (100.0%) |
| 12 to 14 Years | 81 (100.0%) | 126 (100.0%) |
| 15 Years | 48 (100.0%) | 67 (100.0%) |
| 16 and 17 Years | 61 (100.0%) | 30 (100.0%) |
| 18 to 24 Years | 213 (100.0%) | 170 (100.0%) |
| 25 to 34 Years | 33 (100.0%) | 107 (100.0%) |
| 35 to 44 Years | 255 (99.6%) | 353 (100.0%) |
| 45 to 54 Years | 311 (99.7%) | 249 (100.0%) |
| 55 to 64 Years | 351 (100.0%) | 384 (100.0%) |
| 65 to 74 Years | 179 (99.4%) | 157 (100.0%) |
| 75 Years and over | 90 (100.0%) | 146 (100.0%) |
| Total | 2,133 (99.9%) | 2,098 (100.0%) |
Income Below Poverty Among Married-Couple Families in Ho Ho Kus borough
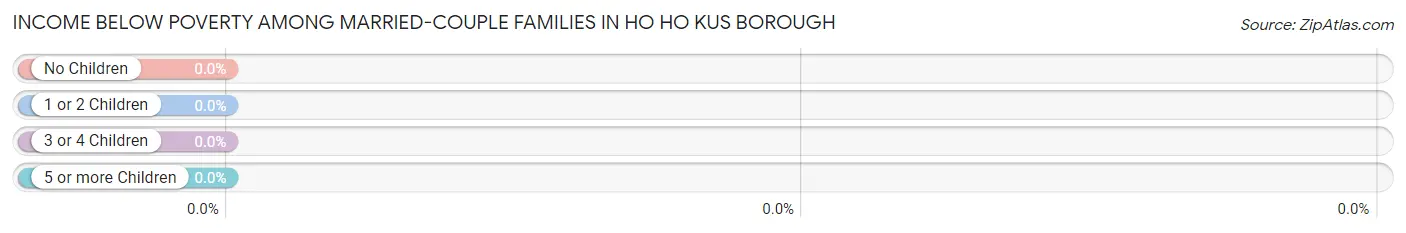
| Children | Above Poverty | Below Poverty |
| No Children | 497 (100.0%) | 0 (0.0%) |
| 1 or 2 Children | 483 (100.0%) | 0 (0.0%) |
| 3 or 4 Children | 107 (100.0%) | 0 (0.0%) |
| 5 or more Children | 0 (0.0%) | 0 (0.0%) |
| Total | 1,087 (100.0%) | 0 (0.0%) |
Income Below Poverty Among Single-Parent Households in Ho Ho Kus borough
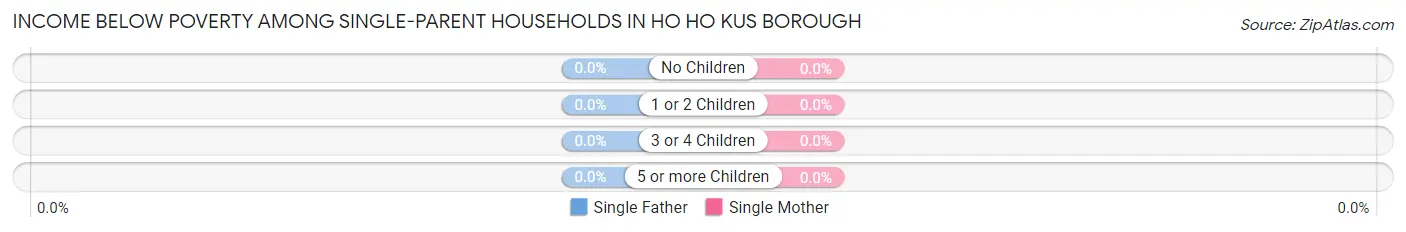
| Children | Single Father | Single Mother |
| No Children | 0 (0.0%) | 0 (0.0%) |
| 1 or 2 Children | 0 (0.0%) | 0 (0.0%) |
| 3 or 4 Children | 0 (0.0%) | 0 (0.0%) |
| 5 or more Children | 0 (0.0%) | 0 (0.0%) |
| Total | 0 (0.0%) | 0 (0.0%) |
Income Below Poverty Among Married-Couple vs Single-Parent Households in Ho Ho Kus borough
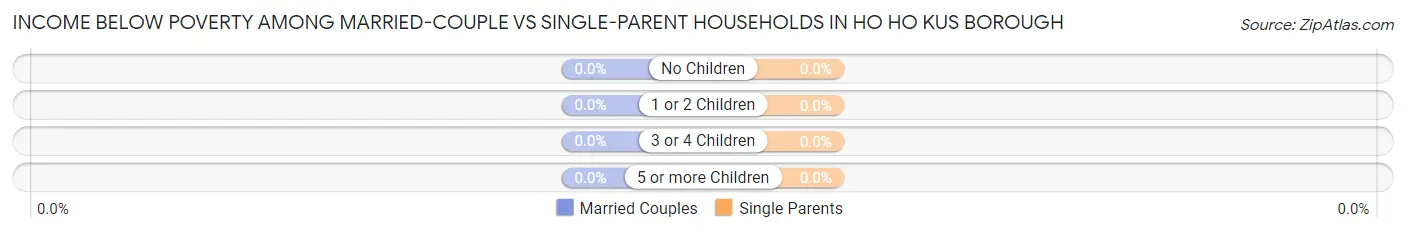
| Children | Married-Couple Families | Single-Parent Households |
| No Children | 0 (0.0%) | 0 (0.0%) |
| 1 or 2 Children | 0 (0.0%) | 0 (0.0%) |
| 3 or 4 Children | 0 (0.0%) | 0 (0.0%) |
| 5 or more Children | 0 (0.0%) | 0 (0.0%) |
| Total | 0 (0.0%) | 0 (0.0%) |
Race in Ho Ho Kus borough
The most populous races in Ho Ho Kus borough are White / Caucasian (3,242 | 76.6%), Hispanic or Latino (489 | 11.6%), and Asian (488 | 11.5%).
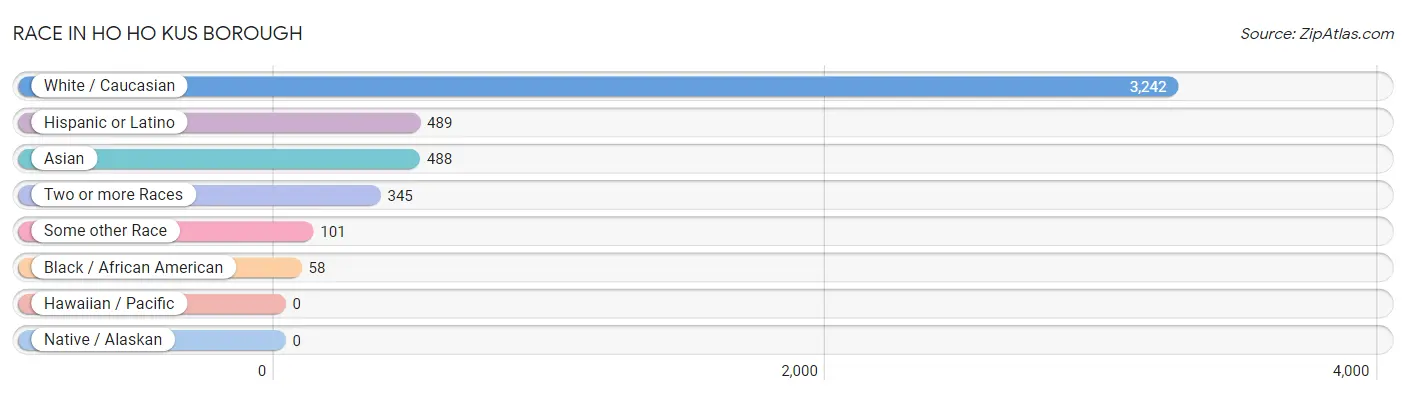
| Race | # Population | % Population |
| Asian | 488 | 11.5% |
| Black / African American | 58 | 1.4% |
| Hawaiian / Pacific | 0 | 0.0% |
| Hispanic or Latino | 489 | 11.6% |
| Native / Alaskan | 0 | 0.0% |
| White / Caucasian | 3,242 | 76.6% |
| Two or more Races | 345 | 8.2% |
| Some other Race | 101 | 2.4% |
| Total | 4,234 | 100.0% |
Ancestry in Ho Ho Kus borough
The most populous ancestries reported in Ho Ho Kus borough are Irish (1,057 | 25.0%), German (661 | 15.6%), Italian (650 | 15.3%), English (537 | 12.7%), and Thai (391 | 9.2%), together accounting for 77.8% of all Ho Ho Kus borough residents.
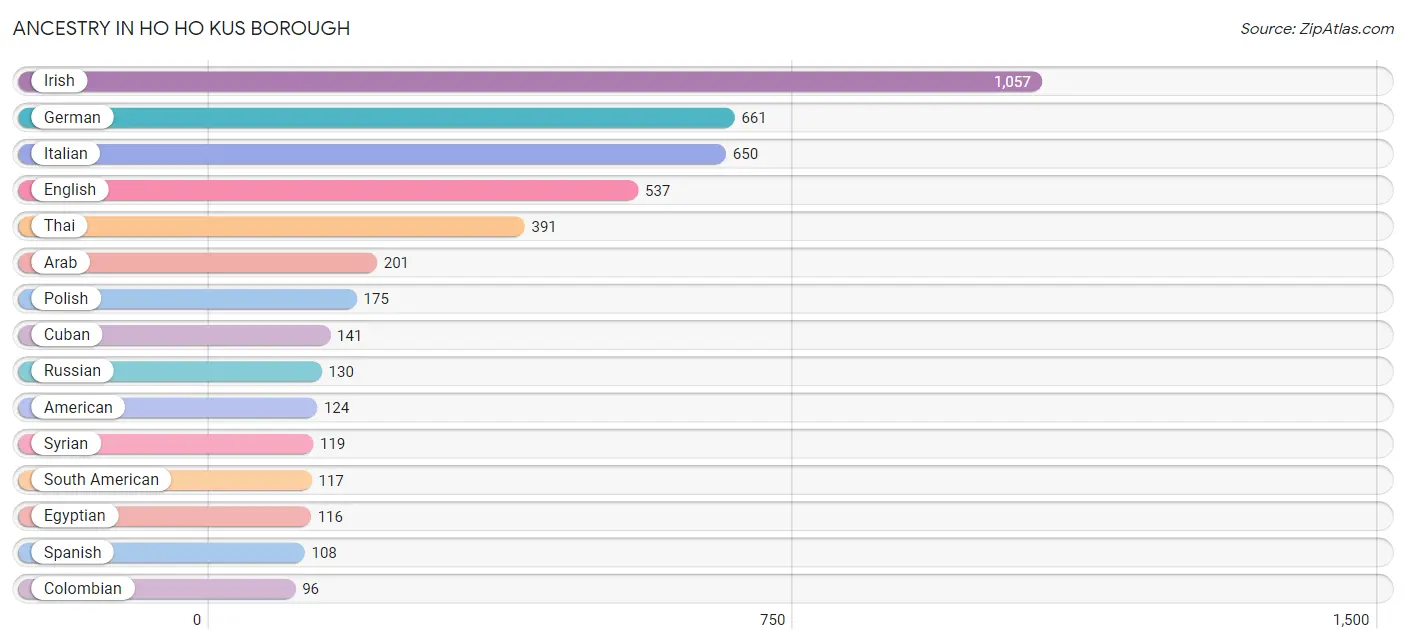
| Ancestry | # Population | % Population |
| Albanian | 7 | 0.2% |
| American | 124 | 2.9% |
| Arab | 201 | 4.8% |
| Argentinean | 11 | 0.3% |
| Armenian | 38 | 0.9% |
| Austrian | 47 | 1.1% |
| Belgian | 34 | 0.8% |
| Bhutanese | 38 | 0.9% |
| British | 19 | 0.4% |
| Canadian | 22 | 0.5% |
| Colombian | 96 | 2.3% |
| Cuban | 141 | 3.3% |
| Danish | 10 | 0.2% |
| Dutch | 39 | 0.9% |
| Eastern European | 38 | 0.9% |
| Ecuadorian | 10 | 0.2% |
| Egyptian | 116 | 2.7% |
| English | 537 | 12.7% |
| European | 26 | 0.6% |
| Filipino | 20 | 0.5% |
| French | 19 | 0.4% |
| French Canadian | 23 | 0.5% |
| German | 661 | 15.6% |
| Greek | 19 | 0.4% |
| Hungarian | 7 | 0.2% |
| Indian (Asian) | 52 | 1.2% |
| Irish | 1,057 | 25.0% |
| Italian | 650 | 15.3% |
| Jamaican | 56 | 1.3% |
| Korean | 52 | 1.2% |
| Lebanese | 36 | 0.9% |
| Lithuanian | 12 | 0.3% |
| Maltese | 19 | 0.4% |
| Northern European | 11 | 0.3% |
| Norwegian | 96 | 2.3% |
| Polish | 175 | 4.1% |
| Portuguese | 64 | 1.5% |
| Puerto Rican | 93 | 2.2% |
| Russian | 130 | 3.1% |
| Scandinavian | 10 | 0.2% |
| Scotch-Irish | 82 | 1.9% |
| Scottish | 93 | 2.2% |
| Slovak | 83 | 2.0% |
| South American | 117 | 2.8% |
| Spaniard | 19 | 0.4% |
| Spanish | 108 | 2.5% |
| Swedish | 35 | 0.8% |
| Swiss | 11 | 0.3% |
| Syrian | 119 | 2.8% |
| Thai | 391 | 9.2% |
| Ukrainian | 39 | 0.9% |
| Welsh | 8 | 0.2% | View All 52 Rows |
Immigrants in Ho Ho Kus borough
The most numerous immigrant groups reported in Ho Ho Kus borough came from Asia (279 | 6.6%), South Central Asia (166 | 3.9%), India (146 | 3.5%), Latin America (118 | 2.8%), and Europe (107 | 2.5%), together accounting for 19.3% of all Ho Ho Kus borough residents.
| Immigration Origin | # Population | % Population |
| Africa | 37 | 0.9% |
| Argentina | 11 | 0.3% |
| Asia | 279 | 6.6% |
| Austria | 13 | 0.3% |
| Azores | 8 | 0.2% |
| Canada | 13 | 0.3% |
| Caribbean | 75 | 1.8% |
| China | 33 | 0.8% |
| Colombia | 32 | 0.8% |
| Croatia | 18 | 0.4% |
| Cuba | 42 | 1.0% |
| Eastern Asia | 57 | 1.3% |
| Eastern Europe | 26 | 0.6% |
| Egypt | 37 | 0.9% |
| England | 10 | 0.2% |
| Europe | 107 | 2.5% |
| Germany | 11 | 0.3% |
| Hong Kong | 7 | 0.2% |
| India | 146 | 3.5% |
| Italy | 32 | 0.8% |
| Jamaica | 33 | 0.8% |
| Japan | 24 | 0.6% |
| Latin America | 118 | 2.8% |
| Northern Africa | 37 | 0.9% |
| Northern Europe | 10 | 0.2% |
| Philippines | 19 | 0.4% |
| Poland | 8 | 0.2% |
| Portugal | 8 | 0.2% |
| South America | 43 | 1.0% |
| South Central Asia | 166 | 3.9% |
| South Eastern Asia | 19 | 0.4% |
| Southern Europe | 47 | 1.1% |
| Spain | 7 | 0.2% |
| Syria | 37 | 0.9% |
| Uzbekistan | 20 | 0.5% |
| Western Asia | 37 | 0.9% |
| Western Europe | 24 | 0.6% | View All 37 Rows |
Sex and Age in Ho Ho Kus borough
Sex and Age in Ho Ho Kus borough
The most populous age groups in Ho Ho Kus borough are 5 to 9 Years (251 | 11.7%) for men and 40 to 44 Years (293 | 14.0%) for women.
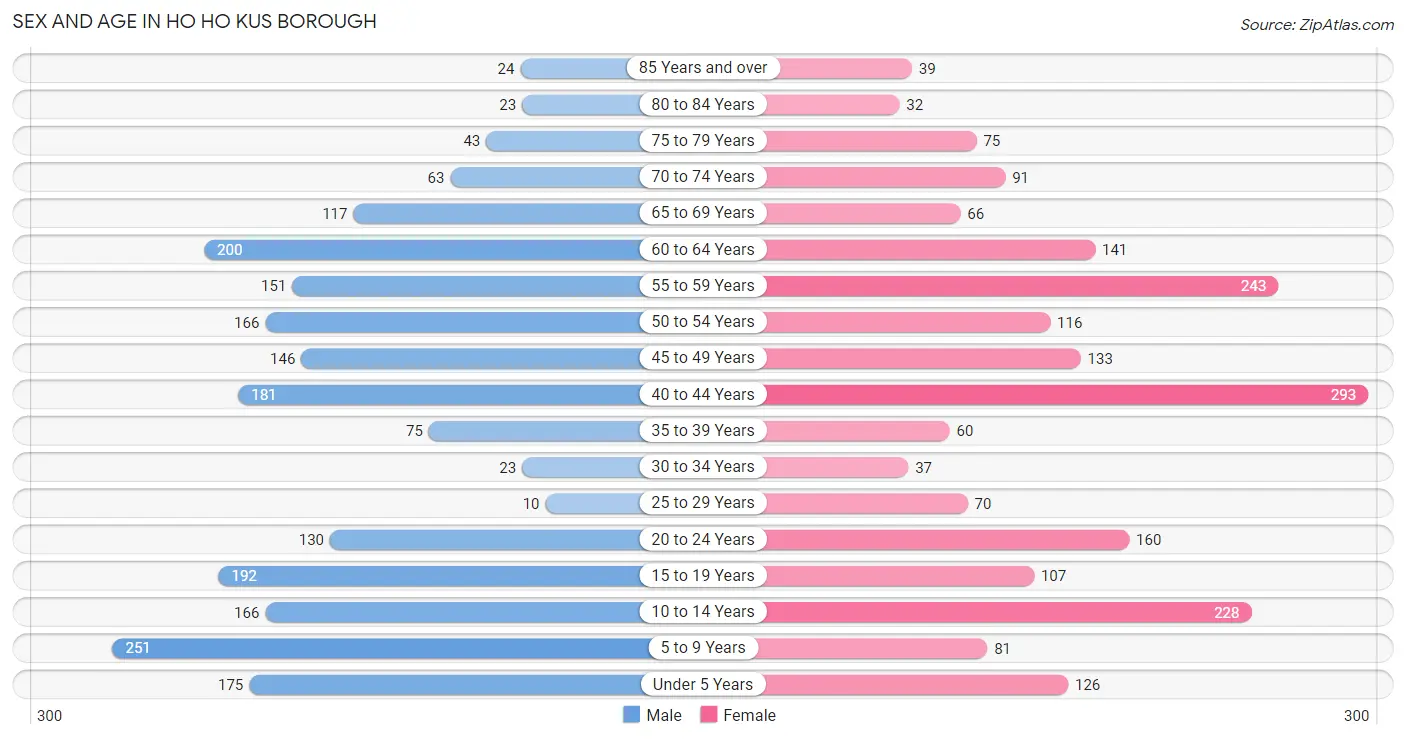
| Age Bracket | Male | Female |
| Under 5 Years | 175 (8.2%) | 126 (6.0%) |
| 5 to 9 Years | 251 (11.7%) | 81 (3.9%) |
| 10 to 14 Years | 166 (7.8%) | 228 (10.9%) |
| 15 to 19 Years | 192 (9.0%) | 107 (5.1%) |
| 20 to 24 Years | 130 (6.1%) | 160 (7.6%) |
| 25 to 29 Years | 10 (0.5%) | 70 (3.3%) |
| 30 to 34 Years | 23 (1.1%) | 37 (1.8%) |
| 35 to 39 Years | 75 (3.5%) | 60 (2.9%) |
| 40 to 44 Years | 181 (8.5%) | 293 (14.0%) |
| 45 to 49 Years | 146 (6.8%) | 133 (6.3%) |
| 50 to 54 Years | 166 (7.8%) | 116 (5.5%) |
| 55 to 59 Years | 151 (7.1%) | 243 (11.6%) |
| 60 to 64 Years | 200 (9.4%) | 141 (6.7%) |
| 65 to 69 Years | 117 (5.5%) | 66 (3.2%) |
| 70 to 74 Years | 63 (2.9%) | 91 (4.3%) |
| 75 to 79 Years | 43 (2.0%) | 75 (3.6%) |
| 80 to 84 Years | 23 (1.1%) | 32 (1.5%) |
| 85 Years and over | 24 (1.1%) | 39 (1.9%) |
| Total | 2,136 (100.0%) | 2,098 (100.0%) |
Families and Households in Ho Ho Kus borough
Median Family Size in Ho Ho Kus borough
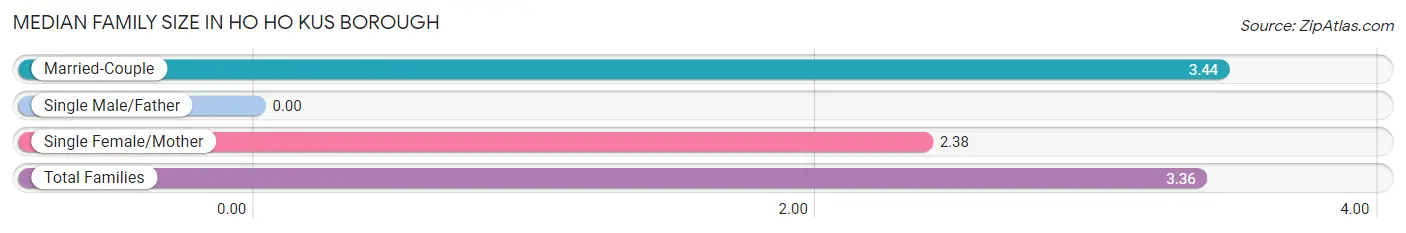
| Family Type | # Families | Family Size |
| Married-Couple | 1,087 (92.1%) | 3.44 |
| Single Male/Father | 0 (0.0%) | - |
| Single Female/Mother | 93 (7.9%) | 2.38 |
| Total Families | 1,180 (100.0%) | 3.36 |
Median Household Size in Ho Ho Kus borough
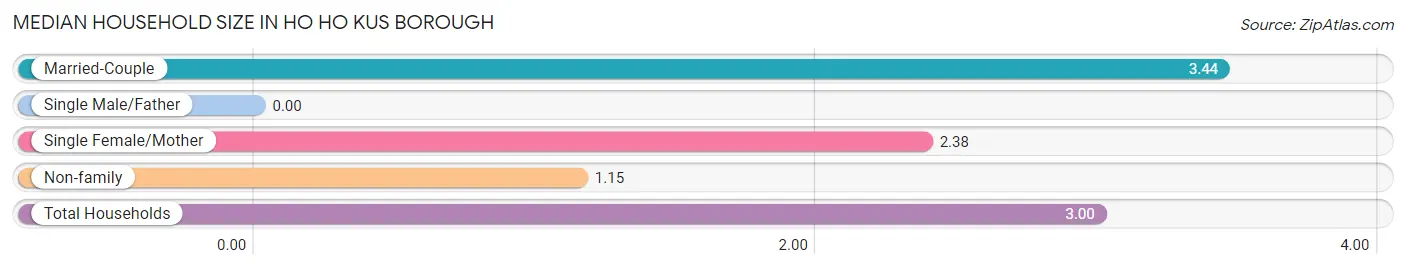
| Household Type | # Households | Household Size |
| Married-Couple | 1,087 (77.1%) | 3.44 |
| Single Male/Father | 0 (0.0%) | - |
| Single Female/Mother | 93 (6.6%) | 2.38 |
| Non-family | 229 (16.3%) | 1.15 |
| Total Households | 1,409 (100.0%) | 3.00 |
Household Size by Marriage Status in Ho Ho Kus borough
Out of a total of 1,409 households in Ho Ho Kus borough, 1,180 (83.8%) are family households, while 229 (16.3%) are nonfamily households. The most numerous type of family households are 4-person households, comprising 436, and the most common type of nonfamily households are 1-person households, comprising 203.
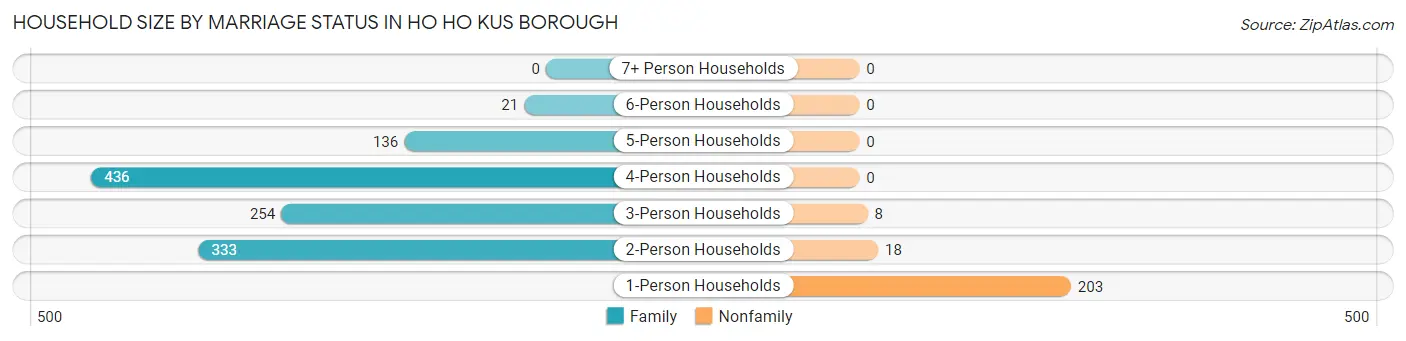
| Household Size | Family Households | Nonfamily Households |
| 1-Person Households | - | 203 (14.4%) |
| 2-Person Households | 333 (23.6%) | 18 (1.3%) |
| 3-Person Households | 254 (18.0%) | 8 (0.6%) |
| 4-Person Households | 436 (30.9%) | 0 (0.0%) |
| 5-Person Households | 136 (9.7%) | 0 (0.0%) |
| 6-Person Households | 21 (1.5%) | 0 (0.0%) |
| 7+ Person Households | 0 (0.0%) | 0 (0.0%) |
| Total | 1,180 (83.8%) | 229 (16.3%) |
Female Fertility in Ho Ho Kus borough
Fertility by Age in Ho Ho Kus borough
| Age Bracket | Women with Births | Births / 1,000 Women |
| 15 to 19 years | 0 (0.0%) | 0.0 |
| 20 to 34 years | 0 (0.0%) | 0.0 |
| 35 to 50 years | 0 (0.0%) | 0.0 |
| Total | 0 (0.0%) | 0.0 |
Fertility by Age by Marriage Status in Ho Ho Kus borough
| Age Bracket | Married | Unmarried |
| 15 to 19 years | 0 (0.0%) | 0 (0.0%) |
| 20 to 34 years | 0 (0.0%) | 0 (0.0%) |
| 35 to 50 years | 0 (0.0%) | 0 (0.0%) |
| Total | 0 (0.0%) | 0 (0.0%) |
Fertility by Education in Ho Ho Kus borough
| Educational Attainment | Women with Births | Births / 1,000 Women |
| Less than High School | 0 (0.0%) | 0.0 |
| High School Diploma | 0 (0.0%) | 0.0 |
| College or Associate's Degree | 0 (0.0%) | 0.0 |
| Bachelor's Degree | 0 (0.0%) | 0.0 |
| Graduate Degree | 0 (0.0%) | 0.0 |
| Total | 0 (0.0%) | 0.0 |
Fertility by Education by Marriage Status in Ho Ho Kus borough
| Educational Attainment | Married | Unmarried |
| Less than High School | 0 (0.0%) | 0 (0.0%) |
| High School Diploma | 0 (0.0%) | 0 (0.0%) |
| College or Associate's Degree | 0 (0.0%) | 0 (0.0%) |
| Bachelor's Degree | 0 (0.0%) | 0 (0.0%) |
| Graduate Degree | 0 (0.0%) | 0 (0.0%) |
| Total | 0 (0.0%) | 0 (0.0%) |
Employment Characteristics in Ho Ho Kus borough
Employment by Class of Employer in Ho Ho Kus borough
Among the 2,082 employed individuals in Ho Ho Kus borough, private company employees (1,542 | 74.1%), local government employees (226 | 10.8%), and not-for-profit organizations (133 | 6.4%) make up the most common classes of employment.
| Employer Class | # Employees | % Employees |
| Private Company Employees | 1,542 | 74.1% |
| Self-Employed (Incorporated) | 72 | 3.5% |
| Self-Employed (Not Incorporated) | 49 | 2.4% |
| Not-for-profit Organizations | 133 | 6.4% |
| Local Government Employees | 226 | 10.8% |
| State Government Employees | 29 | 1.4% |
| Federal Government Employees | 31 | 1.5% |
| Unpaid Family Workers | 0 | 0.0% |
| Total | 2,082 | 100.0% |
Employment Status by Age in Ho Ho Kus borough
According to the labor force statistics for Ho Ho Kus borough, out of the total population over 16 years of age (3,092), 69.4% or 2,146 individuals are in the labor force, with 2.0% or 43 of them unemployed. The age group with the highest labor force participation rate is 30 to 34 years, with 100.0% or 60 individuals in the labor force. Within the labor force, the 25 to 29 years age range has the highest percentage of unemployed individuals, with 23.3% or 10 of them being unemployed.
| Age Bracket | In Labor Force | Unemployed |
| 16 to 19 Years | 10 (5.4%) | 0 (0.0%) |
| 20 to 24 Years | 159 (54.8%) | 33 (20.8%) |
| 25 to 29 Years | 43 (53.8%) | 10 (23.3%) |
| 30 to 34 Years | 60 (100.0%) | 0 (0.0%) |
| 35 to 44 Years | 532 (87.4%) | 0 (0.0%) |
| 45 to 54 Years | 503 (89.7%) | 1 (0.2%) |
| 55 to 59 Years | 369 (93.7%) | 0 (0.0%) |
| 60 to 64 Years | 301 (88.3%) | 0 (0.0%) |
| 65 to 74 Years | 135 (40.1%) | 0 (0.0%) |
| 75 Years and over | 35 (14.8%) | 0 (0.0%) |
| Total | 2,146 (69.4%) | 43 (2.0%) |
Employment Status by Educational Attainment in Ho Ho Kus borough
According to labor force statistics for Ho Ho Kus borough, 88.4% of individuals (1,808) out of the total population between 25 and 64 years of age (2,045) are in the labor force, with 0.6% or 11 of them being unemployed. The group with the highest labor force participation rate are those with the educational attainment of less than high school, with 100.0% or 1 individuals in the labor force. Within the labor force, individuals with less than high school education have the highest percentage of unemployment, with 100.0% or 1 of them being unemployed.
| Educational Attainment | In Labor Force | Unemployed |
| Less than High School | 1 (100.0%) | 1 (100.0%) |
| High School Diploma | 31 (44.9%) | 0 (0.0%) |
| College / Associate Degree | 160 (78.0%) | 0 (0.0%) |
| Bachelor's Degree or higher | 1,616 (91.3%) | 11 (0.6%) |
| Total | 1,808 (88.4%) | 12 (0.6%) |
Employment Occupations by Sex in Ho Ho Kus borough
Management, Business, Science and Arts Occupations
The most common Management, Business, Science and Arts occupations in Ho Ho Kus borough are Community & Social Service (414 | 19.7%), Management (322 | 15.3%), Business & Financial (308 | 14.6%), Health Diagnosing & Treating (238 | 11.3%), and Health Technologists (205 | 9.8%).
Management, Business, Science and Arts Occupations by Sex
Within the Management, Business, Science and Arts occupations in Ho Ho Kus borough, the most male-oriented occupations are Computers & Mathematics (89.1%), Computers, Engineering & Science (75.4%), and Legal Services & Support (62.4%), while the most female-oriented occupations are Education Instruction & Library (95.9%), Community & Social Service (73.4%), and Education, Arts & Media (71.1%).
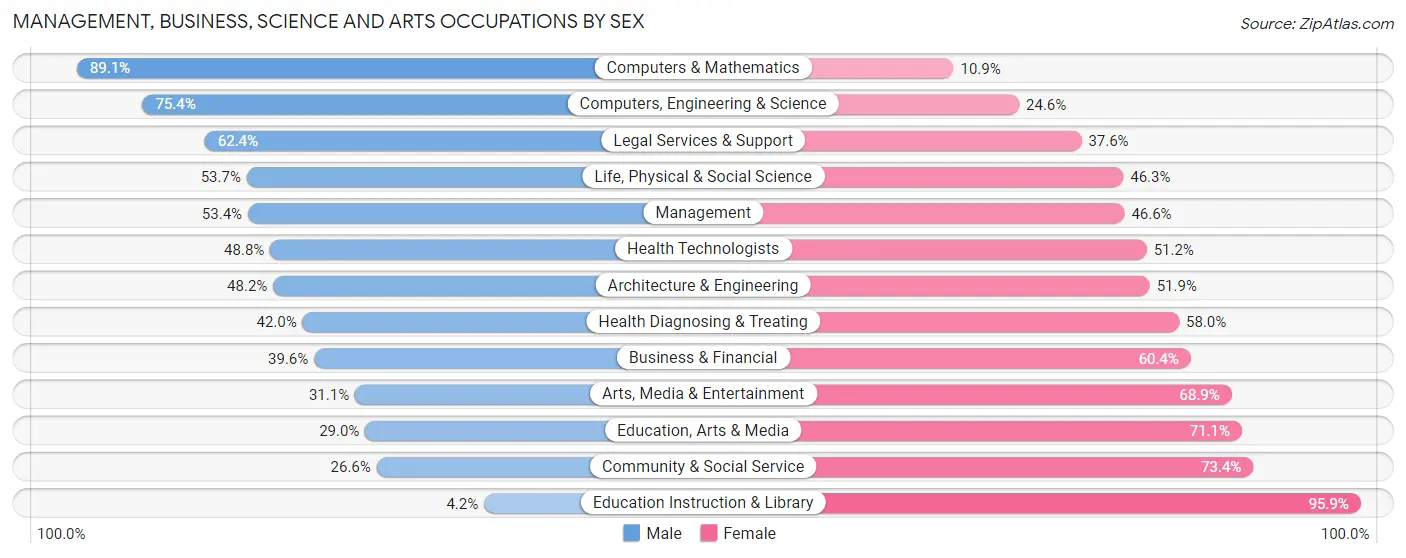
| Occupation | Male | Female |
| Management | 172 (53.4%) | 150 (46.6%) |
| Business & Financial | 122 (39.6%) | 186 (60.4%) |
| Computers, Engineering & Science | 141 (75.4%) | 46 (24.6%) |
| Computers & Mathematics | 106 (89.1%) | 13 (10.9%) |
| Architecture & Engineering | 13 (48.1%) | 14 (51.8%) |
| Life, Physical & Social Science | 22 (53.7%) | 19 (46.3%) |
| Community & Social Service | 110 (26.6%) | 304 (73.4%) |
| Education, Arts & Media | 11 (28.9%) | 27 (71.1%) |
| Legal Services & Support | 68 (62.4%) | 41 (37.6%) |
| Education Instruction & Library | 8 (4.2%) | 185 (95.9%) |
| Arts, Media & Entertainment | 23 (31.1%) | 51 (68.9%) |
| Health Diagnosing & Treating | 100 (42.0%) | 138 (58.0%) |
| Health Technologists | 100 (48.8%) | 105 (51.2%) |
| Total (Category) | 645 (43.9%) | 824 (56.1%) |
| Total (Overall) | 1,058 (50.3%) | 1,045 (49.7%) |
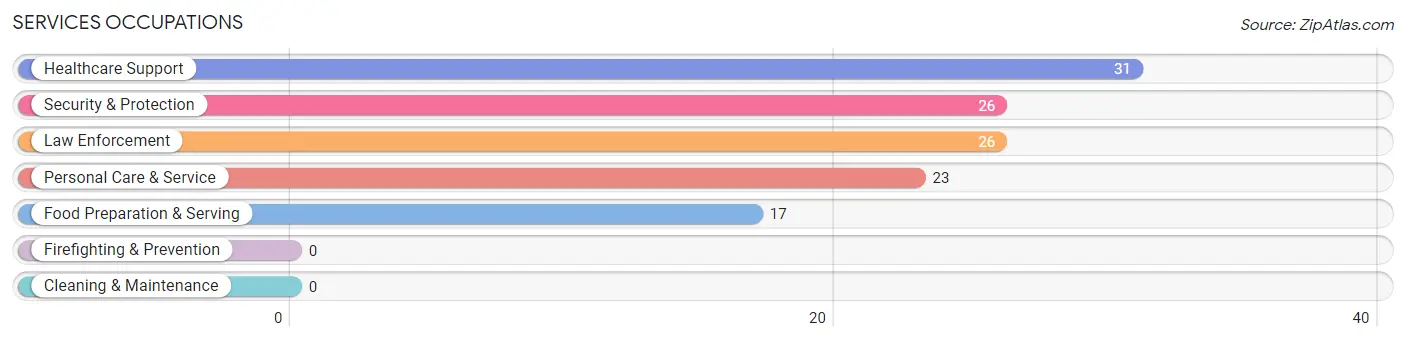
Services Occupations
The most common Services occupations in Ho Ho Kus borough are Healthcare Support (31 | 1.5%), Security & Protection (26 | 1.2%), Law Enforcement (26 | 1.2%), Personal Care & Service (23 | 1.1%), and Food Preparation & Serving (17 | 0.8%).
Services Occupations by Sex
Within the Services occupations in Ho Ho Kus borough, the most male-oriented occupations are Security & Protection (100.0%), Law Enforcement (100.0%), and Healthcare Support (35.5%), while the most female-oriented occupations are Food Preparation & Serving (100.0%), Personal Care & Service (100.0%), and Healthcare Support (64.5%).
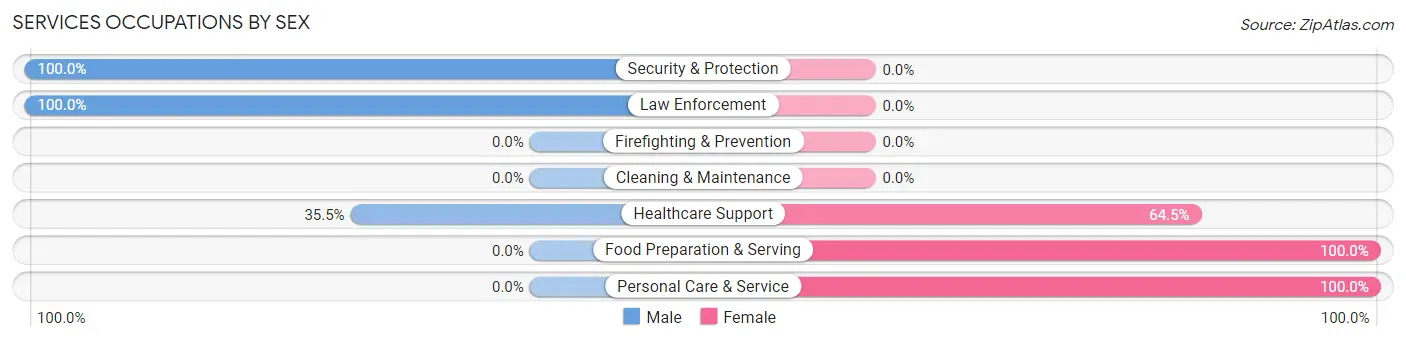
| Occupation | Male | Female |
| Healthcare Support | 11 (35.5%) | 20 (64.5%) |
| Security & Protection | 26 (100.0%) | 0 (0.0%) |
| Firefighting & Prevention | 0 (0.0%) | 0 (0.0%) |
| Law Enforcement | 26 (100.0%) | 0 (0.0%) |
| Food Preparation & Serving | 0 (0.0%) | 17 (100.0%) |
| Cleaning & Maintenance | 0 (0.0%) | 0 (0.0%) |
| Personal Care & Service | 0 (0.0%) | 23 (100.0%) |
| Total (Category) | 37 (38.1%) | 60 (61.9%) |
| Total (Overall) | 1,058 (50.3%) | 1,045 (49.7%) |
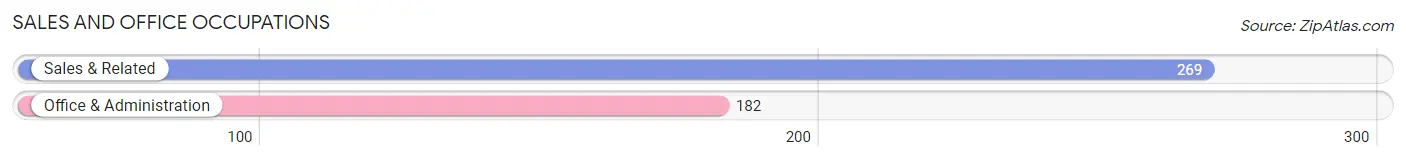
Sales and Office Occupations
The most common Sales and Office occupations in Ho Ho Kus borough are Sales & Related (269 | 12.8%), and Office & Administration (182 | 8.6%).
Sales and Office Occupations by Sex
| Occupation | Male | Female |
| Sales & Related | 230 (85.5%) | 39 (14.5%) |
| Office & Administration | 69 (37.9%) | 113 (62.1%) |
| Total (Category) | 299 (66.3%) | 152 (33.7%) |
| Total (Overall) | 1,058 (50.3%) | 1,045 (49.7%) |
Natural Resources, Construction and Maintenance Occupations
The most common Natural Resources, Construction and Maintenance occupations in Ho Ho Kus borough are Installation, Maintenance & Repair (53 | 2.5%), and Construction & Extraction (10 | 0.5%).
Natural Resources, Construction and Maintenance Occupations by Sex
| Occupation | Male | Female |
| Farming, Fishing & Forestry | 0 (0.0%) | 0 (0.0%) |
| Construction & Extraction | 10 (100.0%) | 0 (0.0%) |
| Installation, Maintenance & Repair | 53 (100.0%) | 0 (0.0%) |
| Total (Category) | 63 (100.0%) | 0 (0.0%) |
| Total (Overall) | 1,058 (50.3%) | 1,045 (49.7%) |
Production, Transportation and Moving Occupations
The most common Production, Transportation and Moving occupations in Ho Ho Kus borough are , and Material Moving (23 | 1.1%).
Production, Transportation and Moving Occupations by Sex
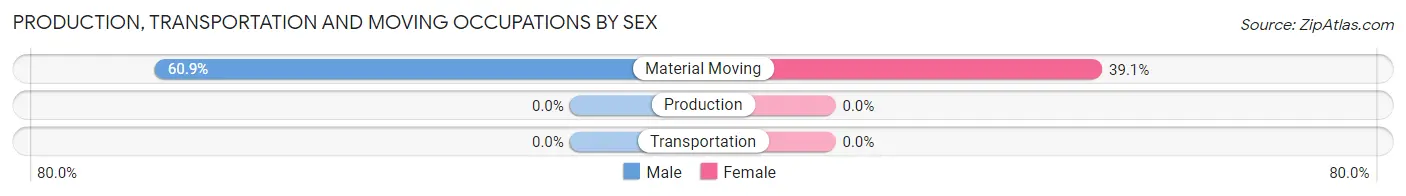
| Occupation | Male | Female |
| Production | 0 (0.0%) | 0 (0.0%) |
| Transportation | 0 (0.0%) | 0 (0.0%) |
| Material Moving | 14 (60.9%) | 9 (39.1%) |
| Total (Category) | 14 (60.9%) | 9 (39.1%) |
| Total (Overall) | 1,058 (50.3%) | 1,045 (49.7%) |
Employment Industries by Sex in Ho Ho Kus borough
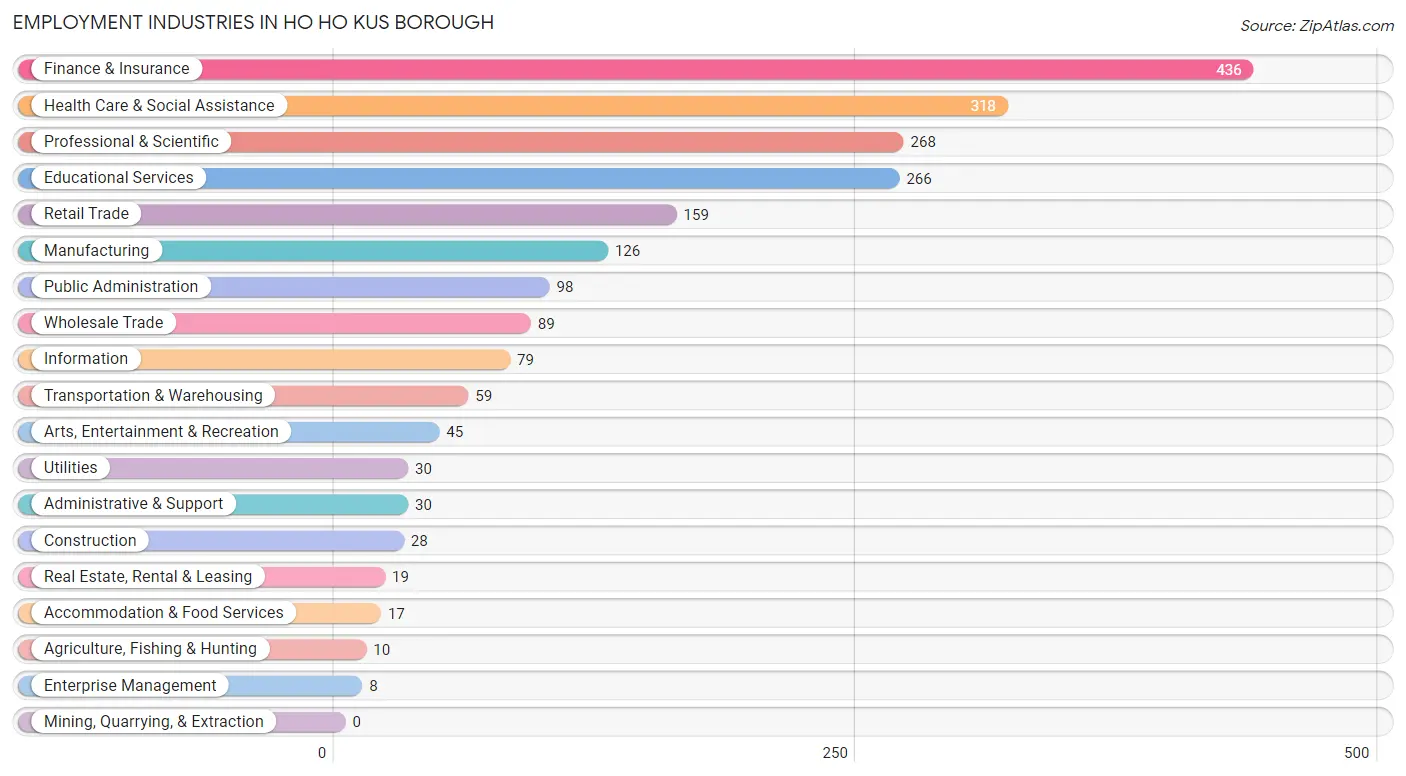
Employment Industries in Ho Ho Kus borough
The major employment industries in Ho Ho Kus borough include Finance & Insurance (436 | 20.7%), Health Care & Social Assistance (318 | 15.1%), Professional & Scientific (268 | 12.7%), Educational Services (266 | 12.7%), and Retail Trade (159 | 7.6%).
Employment Industries by Sex in Ho Ho Kus borough
The Ho Ho Kus borough industries that see more men than women are Agriculture, Fishing & Hunting (100.0%), Utilities (100.0%), and Enterprise Management (100.0%), whereas the industries that tend to have a higher number of women are Real Estate, Rental & Leasing (100.0%), Administrative & Support (100.0%), and Accommodation & Food Services (100.0%).
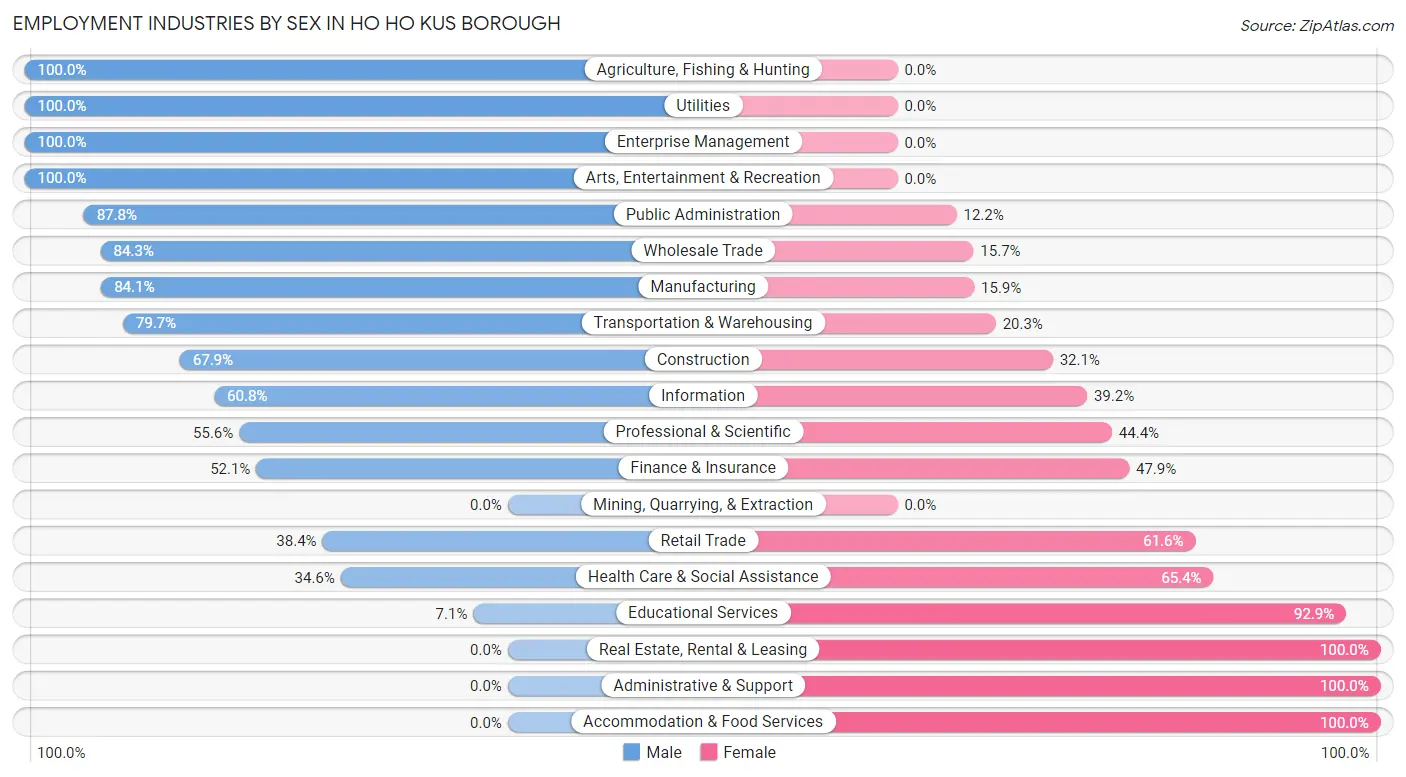
| Industry | Male | Female |
| Agriculture, Fishing & Hunting | 10 (100.0%) | 0 (0.0%) |
| Mining, Quarrying, & Extraction | 0 (0.0%) | 0 (0.0%) |
| Construction | 19 (67.9%) | 9 (32.1%) |
| Manufacturing | 106 (84.1%) | 20 (15.9%) |
| Wholesale Trade | 75 (84.3%) | 14 (15.7%) |
| Retail Trade | 61 (38.4%) | 98 (61.6%) |
| Transportation & Warehousing | 47 (79.7%) | 12 (20.3%) |
| Utilities | 30 (100.0%) | 0 (0.0%) |
| Information | 48 (60.8%) | 31 (39.2%) |
| Finance & Insurance | 227 (52.1%) | 209 (47.9%) |
| Real Estate, Rental & Leasing | 0 (0.0%) | 19 (100.0%) |
| Professional & Scientific | 149 (55.6%) | 119 (44.4%) |
| Enterprise Management | 8 (100.0%) | 0 (0.0%) |
| Administrative & Support | 0 (0.0%) | 30 (100.0%) |
| Educational Services | 19 (7.1%) | 247 (92.9%) |
| Health Care & Social Assistance | 110 (34.6%) | 208 (65.4%) |
| Arts, Entertainment & Recreation | 45 (100.0%) | 0 (0.0%) |
| Accommodation & Food Services | 0 (0.0%) | 17 (100.0%) |
| Public Administration | 86 (87.8%) | 12 (12.2%) |
| Total | 1,058 (50.3%) | 1,045 (49.7%) |
Education in Ho Ho Kus borough
School Enrollment in Ho Ho Kus borough
The most common levels of schooling among the 1,287 students in Ho Ho Kus borough are middle school (307 | 23.8%), college / undergraduate (246 | 19.1%), and high school (226 | 17.6%).
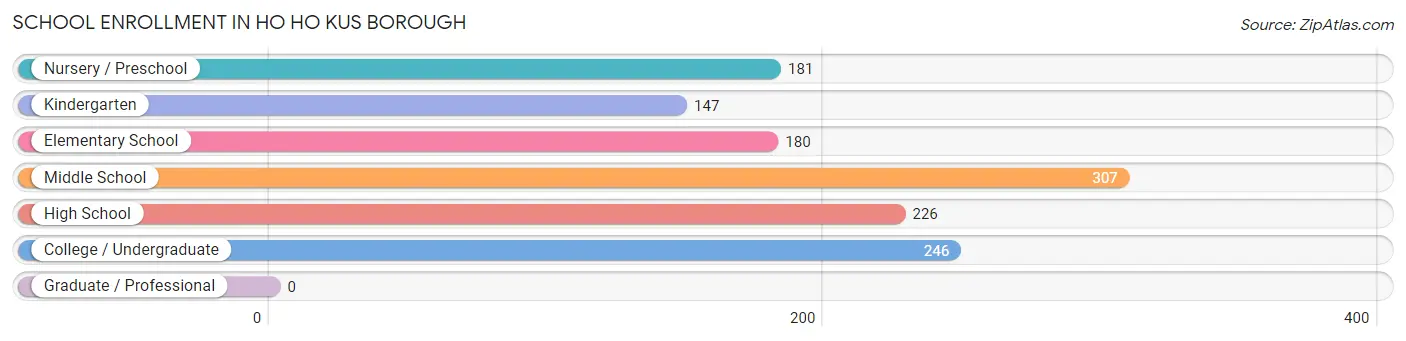
| School Level | # Students | % Students |
| Nursery / Preschool | 181 | 14.1% |
| Kindergarten | 147 | 11.4% |
| Elementary School | 180 | 14.0% |
| Middle School | 307 | 23.8% |
| High School | 226 | 17.6% |
| College / Undergraduate | 246 | 19.1% |
| Graduate / Professional | 0 | 0.0% |
| Total | 1,287 | 100.0% |
School Enrollment by Age by Funding Source in Ho Ho Kus borough
Out of a total of 1,287 students who are enrolled in schools in Ho Ho Kus borough, 360 (28.0%) attend a private institution, while the remaining 927 (72.0%) are enrolled in public schools. The age group of 18 to 19 year olds has the highest likelihood of being enrolled in private schools, with 93 (100.0% in the age bracket) enrolled. Conversely, the age group of 25 to 34 year olds has the lowest likelihood of being enrolled in a private school, with 11 (100.0% in the age bracket) attending a public institution.
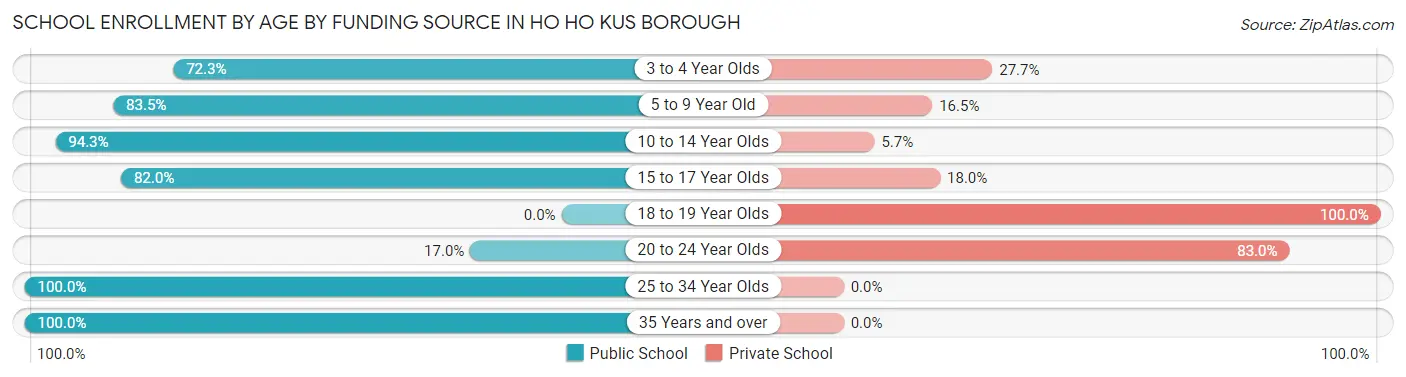
| Age Bracket | Public School | Private School |
| 3 to 4 Year Olds | 94 (72.3%) | 36 (27.7%) |
| 5 to 9 Year Old | 258 (83.5%) | 51 (16.5%) |
| 10 to 14 Year Olds | 362 (94.3%) | 22 (5.7%) |
| 15 to 17 Year Olds | 169 (82.0%) | 37 (18.0%) |
| 18 to 19 Year Olds | 0 (0.0%) | 93 (100.0%) |
| 20 to 24 Year Olds | 25 (17.0%) | 122 (83.0%) |
| 25 to 34 Year Olds | 11 (100.0%) | 0 (0.0%) |
| 35 Years and over | 7 (100.0%) | 0 (0.0%) |
| Total | 927 (72.0%) | 360 (28.0%) |
Educational Attainment by Field of Study in Ho Ho Kus borough
Business (632 | 27.6%), social sciences (319 | 13.9%), bio, nature & agricultural (246 | 10.7%), psychology (176 | 7.7%), and engineering (159 | 6.9%) are the most common fields of study among 2,293 individuals in Ho Ho Kus borough who have obtained a bachelor's degree or higher.
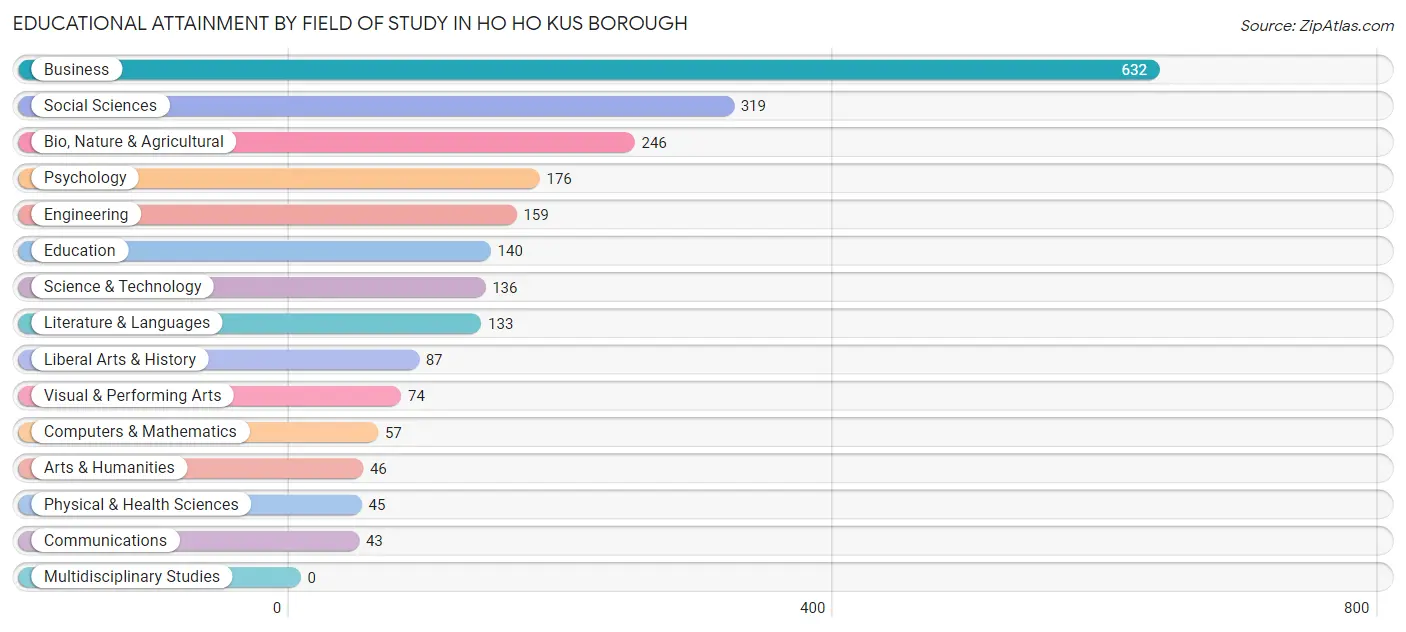
| Field of Study | # Graduates | % Graduates |
| Computers & Mathematics | 57 | 2.5% |
| Bio, Nature & Agricultural | 246 | 10.7% |
| Physical & Health Sciences | 45 | 2.0% |
| Psychology | 176 | 7.7% |
| Social Sciences | 319 | 13.9% |
| Engineering | 159 | 6.9% |
| Multidisciplinary Studies | 0 | 0.0% |
| Science & Technology | 136 | 5.9% |
| Business | 632 | 27.6% |
| Education | 140 | 6.1% |
| Literature & Languages | 133 | 5.8% |
| Liberal Arts & History | 87 | 3.8% |
| Visual & Performing Arts | 74 | 3.2% |
| Communications | 43 | 1.9% |
| Arts & Humanities | 46 | 2.0% |
| Total | 2,293 | 100.0% |
Transportation & Commute in Ho Ho Kus borough
Vehicle Availability by Sex in Ho Ho Kus borough
The most prevalent vehicle ownership categories in Ho Ho Kus borough are males with 2 vehicles (690, accounting for 65.3%) and females with 2 vehicles (585, making up 67.4%).
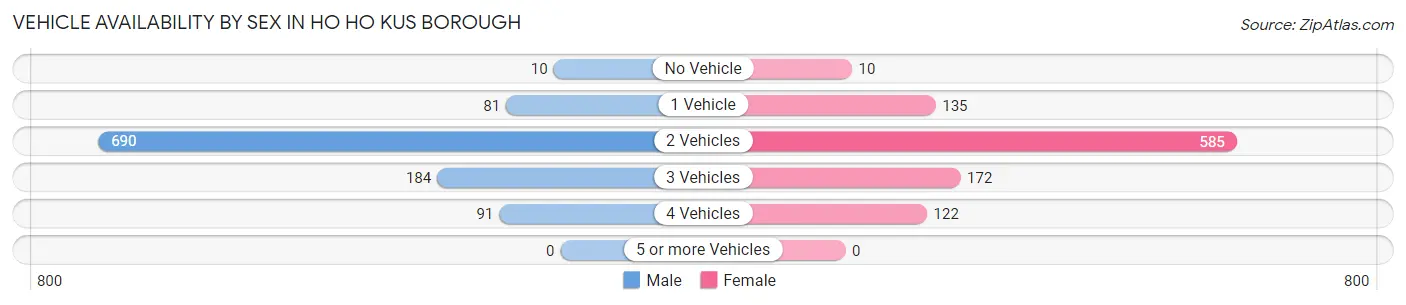
| Vehicles Available | Male | Female |
| No Vehicle | 10 (0.9%) | 10 (1.0%) |
| 1 Vehicle | 81 (7.7%) | 135 (13.2%) |
| 2 Vehicles | 690 (65.3%) | 585 (57.1%) |
| 3 Vehicles | 184 (17.4%) | 172 (16.8%) |
| 4 Vehicles | 91 (8.6%) | 122 (11.9%) |
| 5 or more Vehicles | 0 (0.0%) | 0 (0.0%) |
| Total | 1,056 (100.0%) | 1,024 (100.0%) |
Commute Time in Ho Ho Kus borough
The most frequently occuring commute durations in Ho Ho Kus borough are 60 to 89 minutes (308 commuters, 20.4%), 45 to 59 minutes (240 commuters, 15.9%), and 15 to 19 minutes (238 commuters, 15.8%).
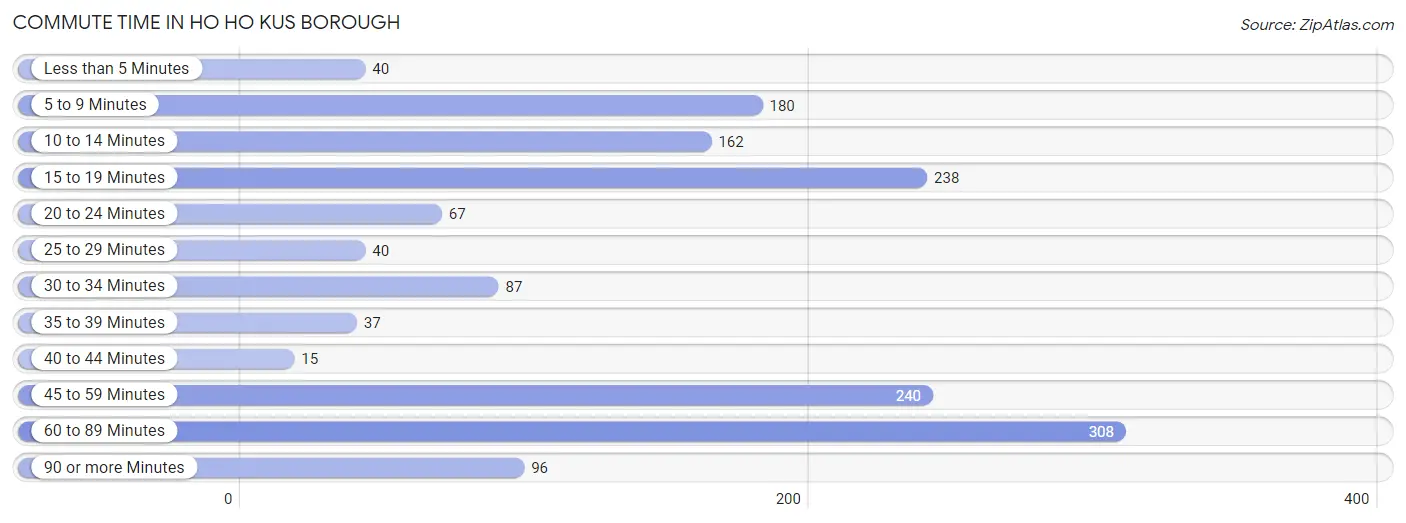
| Commute Time | # Commuters | % Commuters |
| Less than 5 Minutes | 40 | 2.6% |
| 5 to 9 Minutes | 180 | 11.9% |
| 10 to 14 Minutes | 162 | 10.7% |
| 15 to 19 Minutes | 238 | 15.8% |
| 20 to 24 Minutes | 67 | 4.4% |
| 25 to 29 Minutes | 40 | 2.6% |
| 30 to 34 Minutes | 87 | 5.8% |
| 35 to 39 Minutes | 37 | 2.5% |
| 40 to 44 Minutes | 15 | 1.0% |
| 45 to 59 Minutes | 240 | 15.9% |
| 60 to 89 Minutes | 308 | 20.4% |
| 90 or more Minutes | 96 | 6.4% |
Commute Time by Sex in Ho Ho Kus borough
The most common commute times in Ho Ho Kus borough are 60 to 89 minutes (212 commuters, 29.0%) for males and 15 to 19 minutes (148 commuters, 19.0%) for females.
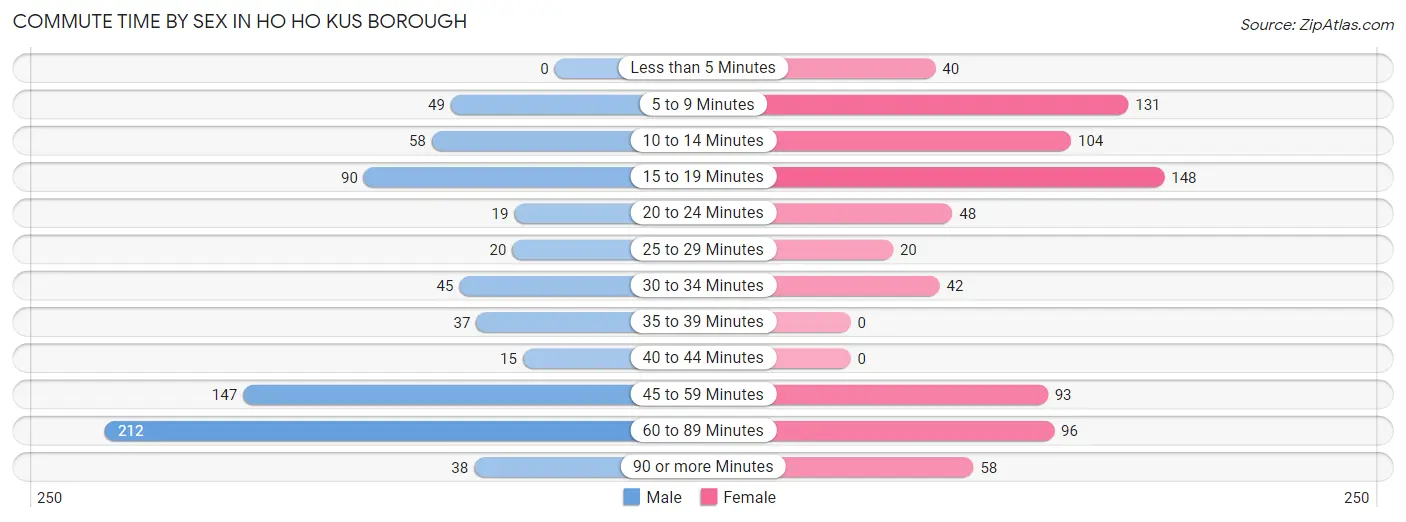
| Commute Time | Male | Female |
| Less than 5 Minutes | 0 (0.0%) | 40 (5.1%) |
| 5 to 9 Minutes | 49 (6.7%) | 131 (16.8%) |
| 10 to 14 Minutes | 58 (8.0%) | 104 (13.3%) |
| 15 to 19 Minutes | 90 (12.3%) | 148 (19.0%) |
| 20 to 24 Minutes | 19 (2.6%) | 48 (6.1%) |
| 25 to 29 Minutes | 20 (2.7%) | 20 (2.6%) |
| 30 to 34 Minutes | 45 (6.2%) | 42 (5.4%) |
| 35 to 39 Minutes | 37 (5.1%) | 0 (0.0%) |
| 40 to 44 Minutes | 15 (2.1%) | 0 (0.0%) |
| 45 to 59 Minutes | 147 (20.1%) | 93 (11.9%) |
| 60 to 89 Minutes | 212 (29.0%) | 96 (12.3%) |
| 90 or more Minutes | 38 (5.2%) | 58 (7.4%) |
Time of Departure to Work by Sex in Ho Ho Kus borough
The most frequent times of departure to work in Ho Ho Kus borough are 8:00 AM to 8:29 AM (157, 21.5%) for males and 8:00 AM to 8:29 AM (261, 33.5%) for females.
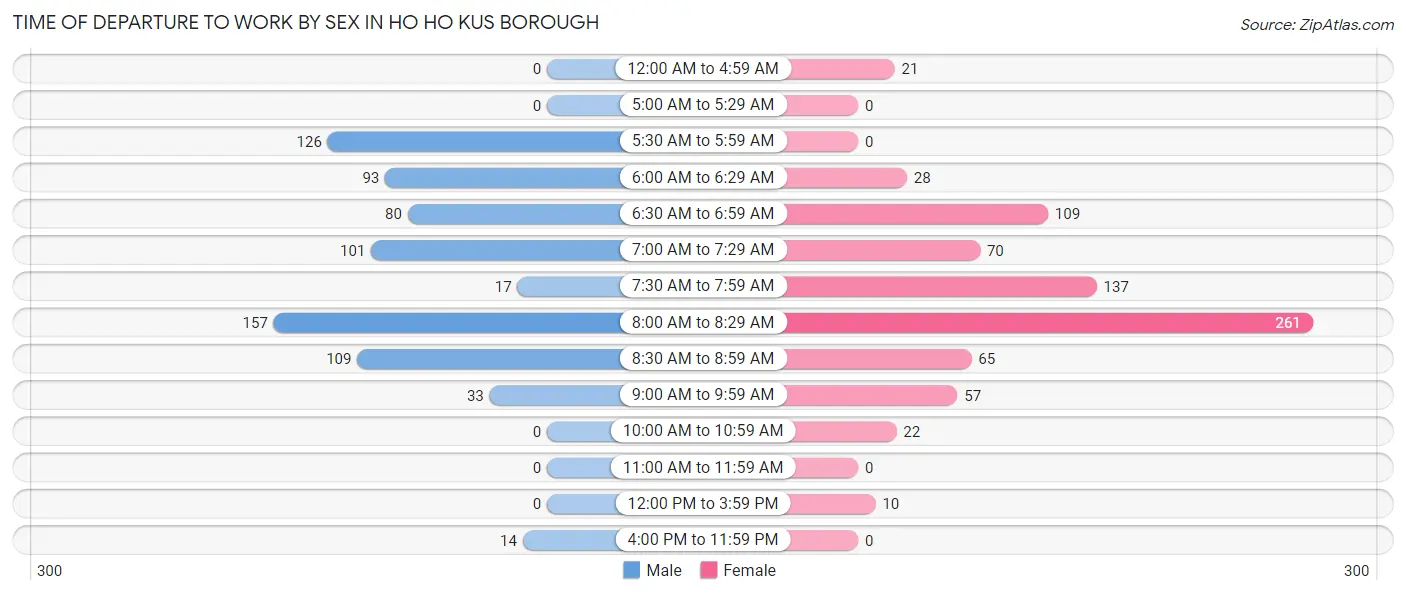
| Time of Departure | Male | Female |
| 12:00 AM to 4:59 AM | 0 (0.0%) | 21 (2.7%) |
| 5:00 AM to 5:29 AM | 0 (0.0%) | 0 (0.0%) |
| 5:30 AM to 5:59 AM | 126 (17.3%) | 0 (0.0%) |
| 6:00 AM to 6:29 AM | 93 (12.7%) | 28 (3.6%) |
| 6:30 AM to 6:59 AM | 80 (11.0%) | 109 (14.0%) |
| 7:00 AM to 7:29 AM | 101 (13.8%) | 70 (9.0%) |
| 7:30 AM to 7:59 AM | 17 (2.3%) | 137 (17.6%) |
| 8:00 AM to 8:29 AM | 157 (21.5%) | 261 (33.5%) |
| 8:30 AM to 8:59 AM | 109 (14.9%) | 65 (8.3%) |
| 9:00 AM to 9:59 AM | 33 (4.5%) | 57 (7.3%) |
| 10:00 AM to 10:59 AM | 0 (0.0%) | 22 (2.8%) |
| 11:00 AM to 11:59 AM | 0 (0.0%) | 0 (0.0%) |
| 12:00 PM to 3:59 PM | 0 (0.0%) | 10 (1.3%) |
| 4:00 PM to 11:59 PM | 14 (1.9%) | 0 (0.0%) |
| Total | 730 (100.0%) | 780 (100.0%) |
Housing Occupancy in Ho Ho Kus borough
Occupancy by Ownership in Ho Ho Kus borough
Of the total 1,409 dwellings in Ho Ho Kus borough, owner-occupied units account for 1,299 (92.2%), while renter-occupied units make up 110 (7.8%).
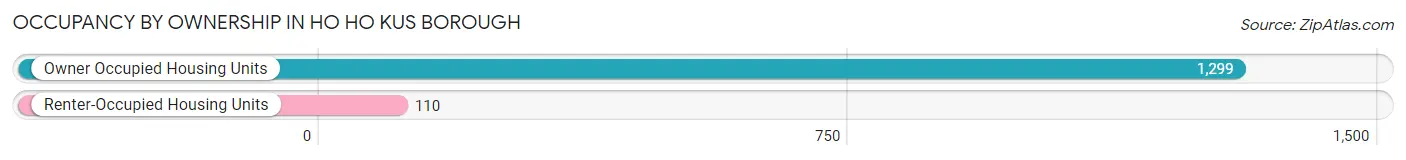
| Occupancy | # Housing Units | % Housing Units |
| Owner Occupied Housing Units | 1,299 | 92.2% |
| Renter-Occupied Housing Units | 110 | 7.8% |
| Total Occupied Housing Units | 1,409 | 100.0% |
Occupancy by Household Size in Ho Ho Kus borough
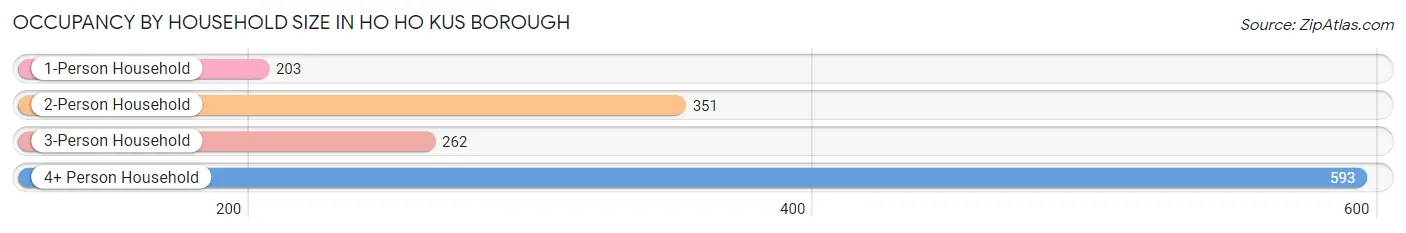
| Household Size | # Housing Units | % Housing Units |
| 1-Person Household | 203 | 14.4% |
| 2-Person Household | 351 | 24.9% |
| 3-Person Household | 262 | 18.6% |
| 4+ Person Household | 593 | 42.1% |
| Total Housing Units | 1,409 | 100.0% |
Occupancy by Ownership by Household Size in Ho Ho Kus borough
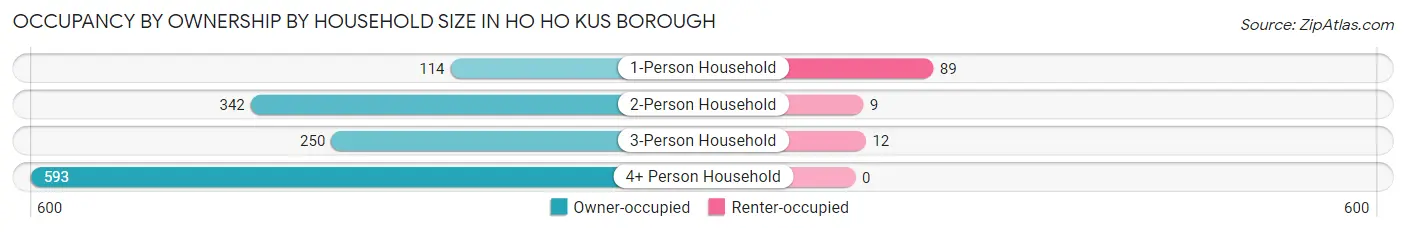
| Household Size | Owner-occupied | Renter-occupied |
| 1-Person Household | 114 (56.2%) | 89 (43.8%) |
| 2-Person Household | 342 (97.4%) | 9 (2.6%) |
| 3-Person Household | 250 (95.4%) | 12 (4.6%) |
| 4+ Person Household | 593 (100.0%) | 0 (0.0%) |
| Total Housing Units | 1,299 (92.2%) | 110 (7.8%) |
Occupancy by Educational Attainment in Ho Ho Kus borough
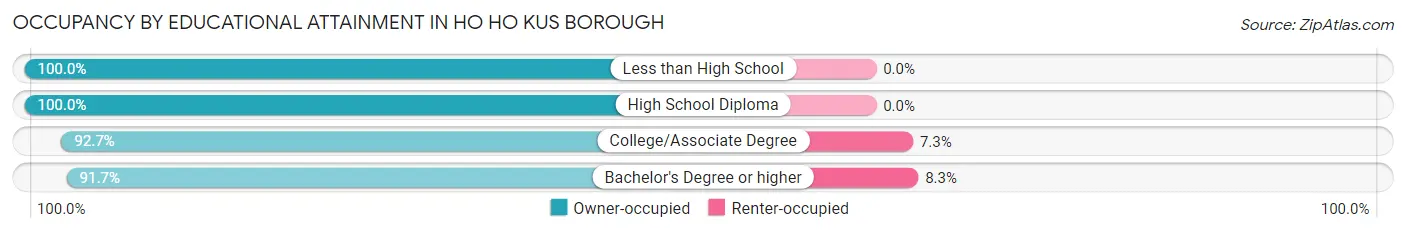
| Household Size | Owner-occupied | Renter-occupied |
| Less than High School | 7 (100.0%) | 0 (0.0%) |
| High School Diploma | 64 (100.0%) | 0 (0.0%) |
| College/Associate Degree | 127 (92.7%) | 10 (7.3%) |
| Bachelor's Degree or higher | 1,101 (91.7%) | 100 (8.3%) |
Occupancy by Age of Householder in Ho Ho Kus borough
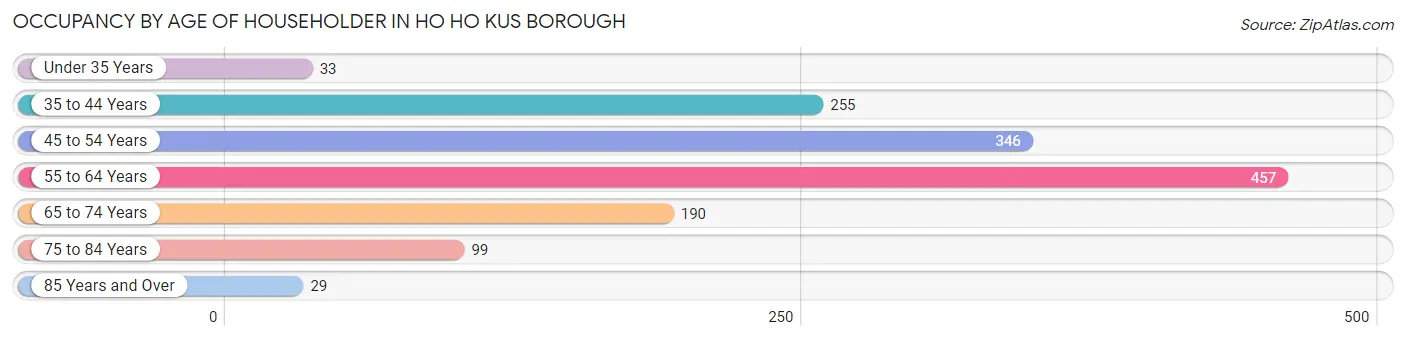
| Age Bracket | # Households | % Households |
| Under 35 Years | 33 | 2.3% |
| 35 to 44 Years | 255 | 18.1% |
| 45 to 54 Years | 346 | 24.6% |
| 55 to 64 Years | 457 | 32.4% |
| 65 to 74 Years | 190 | 13.5% |
| 75 to 84 Years | 99 | 7.0% |
| 85 Years and Over | 29 | 2.1% |
| Total | 1,409 | 100.0% |
Housing Finances in Ho Ho Kus borough
Median Income by Occupancy in Ho Ho Kus borough
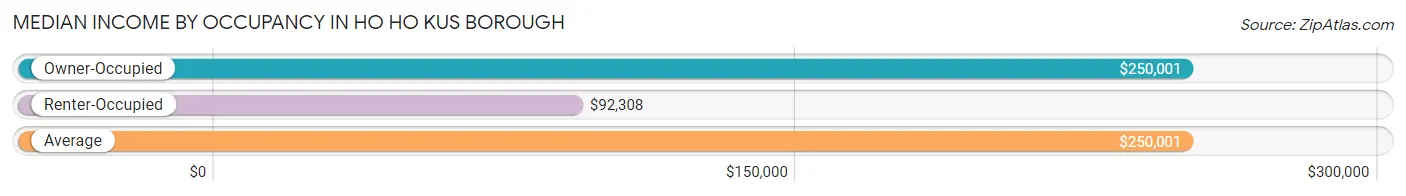
| Occupancy Type | # Households | Median Income |
| Owner-Occupied | 1,299 (92.2%) | $250,001 |
| Renter-Occupied | 110 (7.8%) | $92,308 |
| Average | 1,409 (100.0%) | $250,001 |
Occupancy by Householder Income Bracket in Ho Ho Kus borough
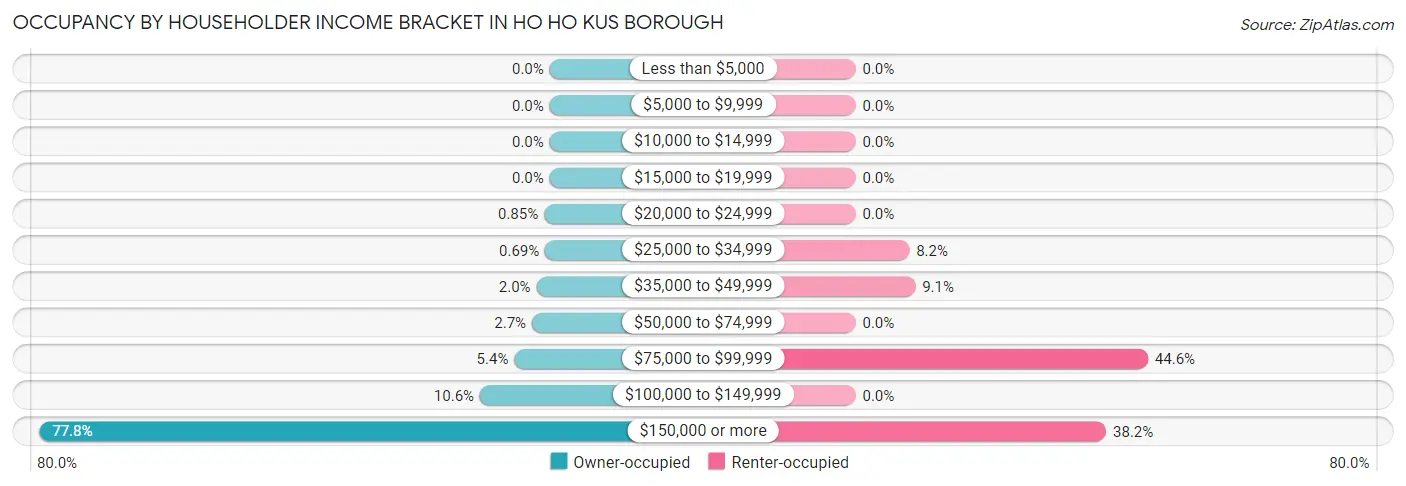
| Income Bracket | Owner-occupied | Renter-occupied |
| Less than $5,000 | 0 (0.0%) | 0 (0.0%) |
| $5,000 to $9,999 | 0 (0.0%) | 0 (0.0%) |
| $10,000 to $14,999 | 0 (0.0%) | 0 (0.0%) |
| $15,000 to $19,999 | 0 (0.0%) | 0 (0.0%) |
| $20,000 to $24,999 | 11 (0.9%) | 0 (0.0%) |
| $25,000 to $34,999 | 9 (0.7%) | 9 (8.2%) |
| $35,000 to $49,999 | 26 (2.0%) | 10 (9.1%) |
| $50,000 to $74,999 | 35 (2.7%) | 0 (0.0%) |
| $75,000 to $99,999 | 70 (5.4%) | 49 (44.6%) |
| $100,000 to $149,999 | 138 (10.6%) | 0 (0.0%) |
| $150,000 or more | 1,010 (77.7%) | 42 (38.2%) |
| Total | 1,299 (100.0%) | 110 (100.0%) |
Monthly Housing Cost Tiers in Ho Ho Kus borough
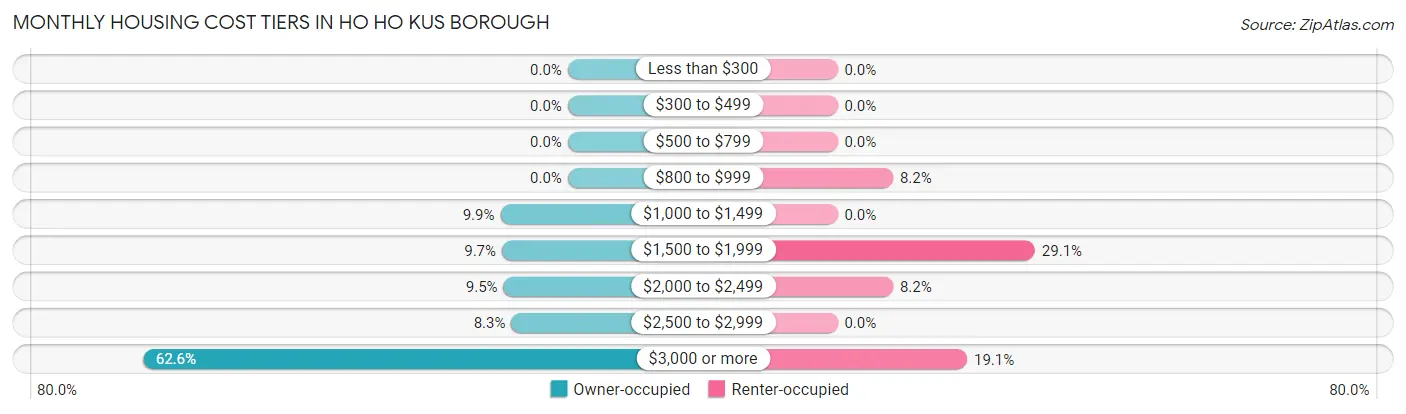
| Monthly Cost | Owner-occupied | Renter-occupied |
| Less than $300 | 0 (0.0%) | 0 (0.0%) |
| $300 to $499 | 0 (0.0%) | 0 (0.0%) |
| $500 to $799 | 0 (0.0%) | 0 (0.0%) |
| $800 to $999 | 0 (0.0%) | 9 (8.2%) |
| $1,000 to $1,499 | 129 (9.9%) | 0 (0.0%) |
| $1,500 to $1,999 | 126 (9.7%) | 32 (29.1%) |
| $2,000 to $2,499 | 123 (9.5%) | 9 (8.2%) |
| $2,500 to $2,999 | 108 (8.3%) | 0 (0.0%) |
| $3,000 or more | 813 (62.6%) | 21 (19.1%) |
| Total | 1,299 (100.0%) | 110 (100.0%) |
Physical Housing Characteristics in Ho Ho Kus borough
Housing Structures in Ho Ho Kus borough
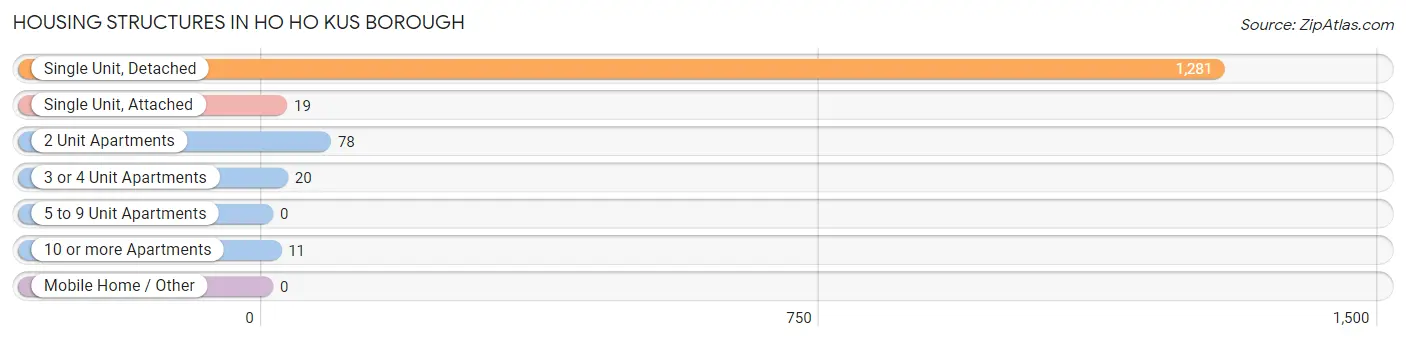
| Structure Type | # Housing Units | % Housing Units |
| Single Unit, Detached | 1,281 | 90.9% |
| Single Unit, Attached | 19 | 1.3% |
| 2 Unit Apartments | 78 | 5.5% |
| 3 or 4 Unit Apartments | 20 | 1.4% |
| 5 to 9 Unit Apartments | 0 | 0.0% |
| 10 or more Apartments | 11 | 0.8% |
| Mobile Home / Other | 0 | 0.0% |
| Total | 1,409 | 100.0% |
Housing Structures by Occupancy in Ho Ho Kus borough
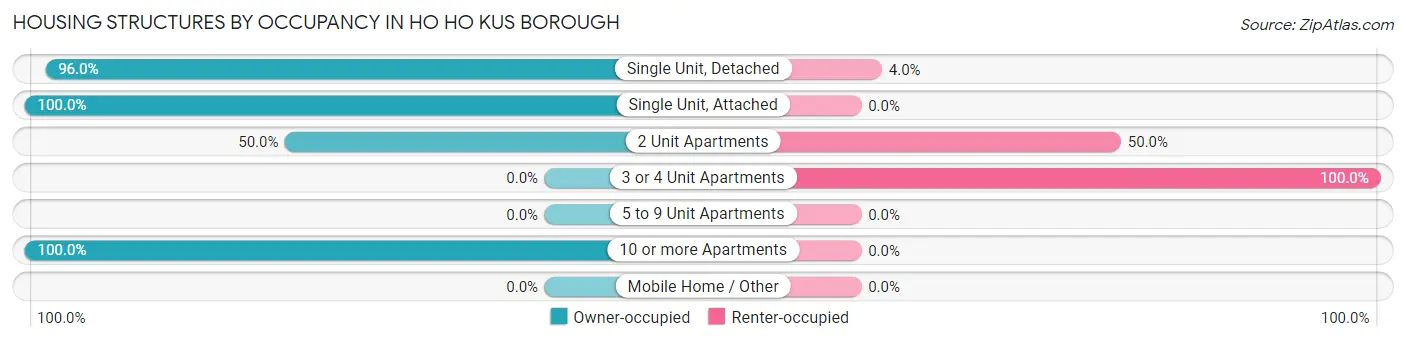
| Structure Type | Owner-occupied | Renter-occupied |
| Single Unit, Detached | 1,230 (96.0%) | 51 (4.0%) |
| Single Unit, Attached | 19 (100.0%) | 0 (0.0%) |
| 2 Unit Apartments | 39 (50.0%) | 39 (50.0%) |
| 3 or 4 Unit Apartments | 0 (0.0%) | 20 (100.0%) |
| 5 to 9 Unit Apartments | 0 (0.0%) | 0 (0.0%) |
| 10 or more Apartments | 11 (100.0%) | 0 (0.0%) |
| Mobile Home / Other | 0 (0.0%) | 0 (0.0%) |
| Total | 1,299 (92.2%) | 110 (7.8%) |
Housing Structures by Number of Rooms in Ho Ho Kus borough
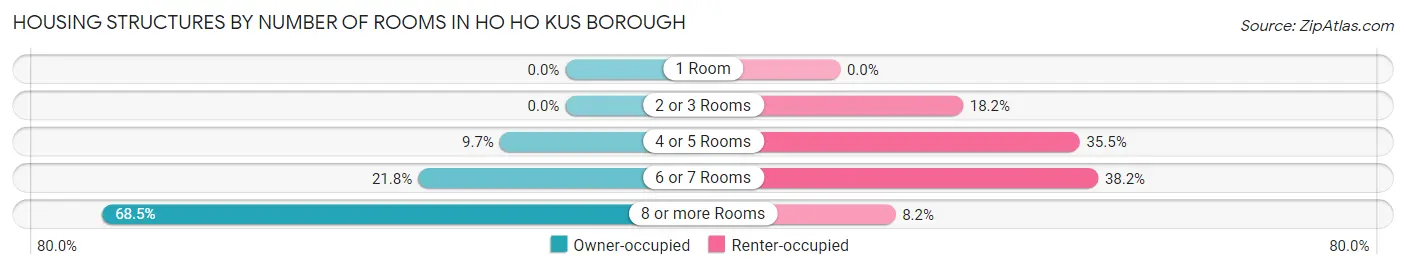
| Number of Rooms | Owner-occupied | Renter-occupied |
| 1 Room | 0 (0.0%) | 0 (0.0%) |
| 2 or 3 Rooms | 0 (0.0%) | 20 (18.2%) |
| 4 or 5 Rooms | 126 (9.7%) | 39 (35.4%) |
| 6 or 7 Rooms | 283 (21.8%) | 42 (38.2%) |
| 8 or more Rooms | 890 (68.5%) | 9 (8.2%) |
| Total | 1,299 (100.0%) | 110 (100.0%) |
Housing Structure by Heating Type in Ho Ho Kus borough
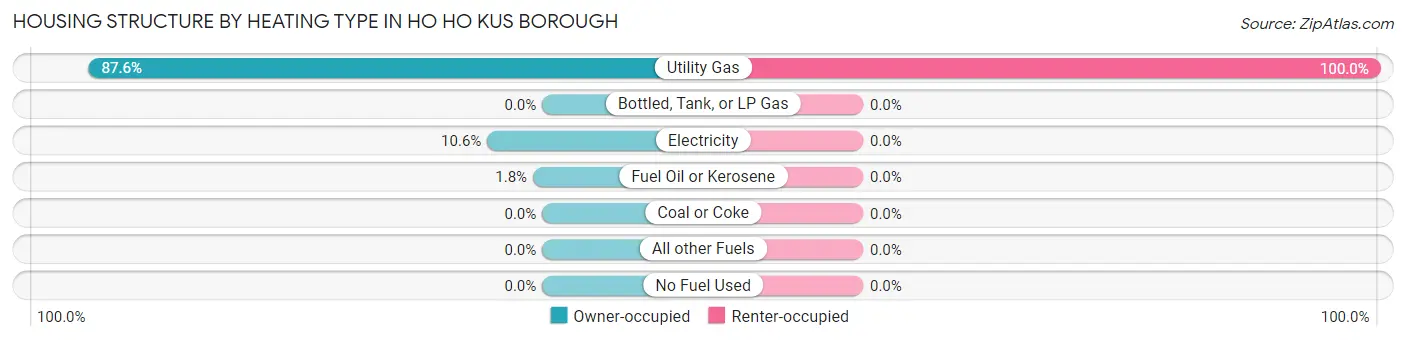
| Heating Type | Owner-occupied | Renter-occupied |
| Utility Gas | 1,138 (87.6%) | 110 (100.0%) |
| Bottled, Tank, or LP Gas | 0 (0.0%) | 0 (0.0%) |
| Electricity | 138 (10.6%) | 0 (0.0%) |
| Fuel Oil or Kerosene | 23 (1.8%) | 0 (0.0%) |
| Coal or Coke | 0 (0.0%) | 0 (0.0%) |
| All other Fuels | 0 (0.0%) | 0 (0.0%) |
| No Fuel Used | 0 (0.0%) | 0 (0.0%) |
| Total | 1,299 (100.0%) | 110 (100.0%) |
Household Vehicle Usage in Ho Ho Kus borough
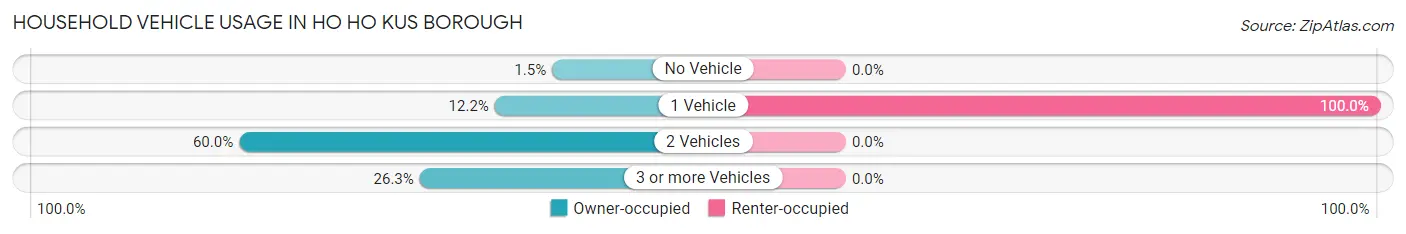
| Vehicles per Household | Owner-occupied | Renter-occupied |
| No Vehicle | 20 (1.5%) | 0 (0.0%) |
| 1 Vehicle | 159 (12.2%) | 110 (100.0%) |
| 2 Vehicles | 779 (60.0%) | 0 (0.0%) |
| 3 or more Vehicles | 341 (26.3%) | 0 (0.0%) |
| Total | 1,299 (100.0%) | 110 (100.0%) |
Real Estate & Mortgages in Ho Ho Kus borough
Real Estate and Mortgage Overview in Ho Ho Kus borough
| Characteristic | Without Mortgage | With Mortgage |
| Housing Units | 381 | 918 |
| Median Property Value | $918,500 | $957,900 |
| Median Household Income | $250,001 | $729 |
| Monthly Housing Costs | $1,501 | $763 |
| Real Estate Taxes | $10,001 | $0 |
Property Value by Mortgage Status in Ho Ho Kus borough
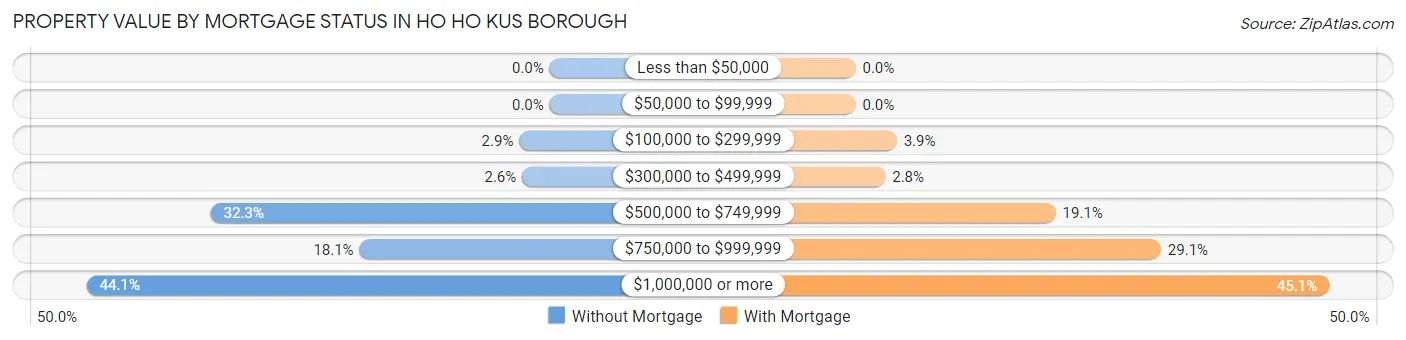
| Property Value | Without Mortgage | With Mortgage |
| Less than $50,000 | 0 (0.0%) | 0 (0.0%) |
| $50,000 to $99,999 | 0 (0.0%) | 0 (0.0%) |
| $100,000 to $299,999 | 11 (2.9%) | 36 (3.9%) |
| $300,000 to $499,999 | 10 (2.6%) | 26 (2.8%) |
| $500,000 to $749,999 | 123 (32.3%) | 175 (19.1%) |
| $750,000 to $999,999 | 69 (18.1%) | 267 (29.1%) |
| $1,000,000 or more | 168 (44.1%) | 414 (45.1%) |
| Total | 381 (100.0%) | 918 (100.0%) |
Household Income by Mortgage Status in Ho Ho Kus borough
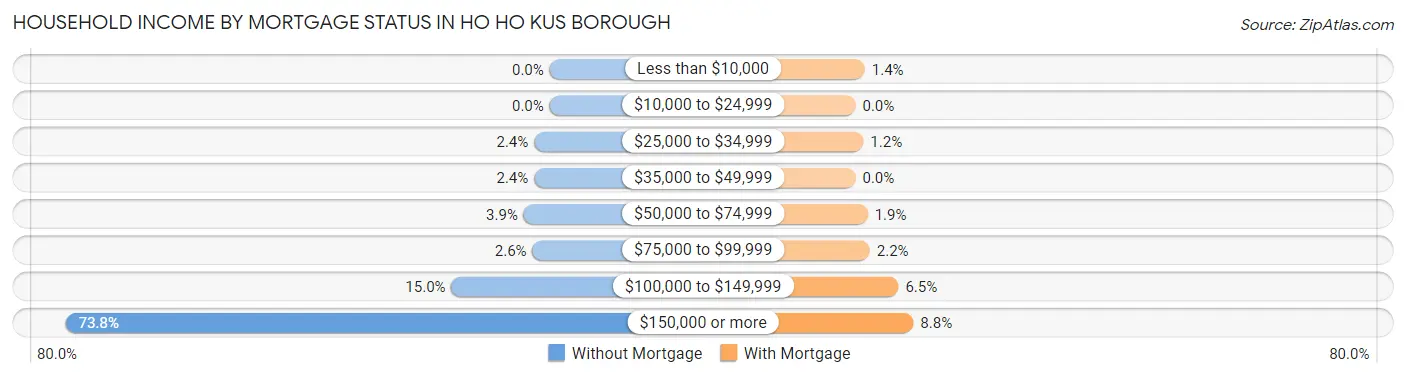
| Household Income | Without Mortgage | With Mortgage |
| Less than $10,000 | 0 (0.0%) | 13 (1.4%) |
| $10,000 to $24,999 | 0 (0.0%) | 0 (0.0%) |
| $25,000 to $34,999 | 9 (2.4%) | 11 (1.2%) |
| $35,000 to $49,999 | 9 (2.4%) | 0 (0.0%) |
| $50,000 to $74,999 | 15 (3.9%) | 17 (1.8%) |
| $75,000 to $99,999 | 10 (2.6%) | 20 (2.2%) |
| $100,000 to $149,999 | 57 (15.0%) | 60 (6.5%) |
| $150,000 or more | 281 (73.8%) | 81 (8.8%) |
| Total | 381 (100.0%) | 918 (100.0%) |
Property Value to Household Income Ratio in Ho Ho Kus borough
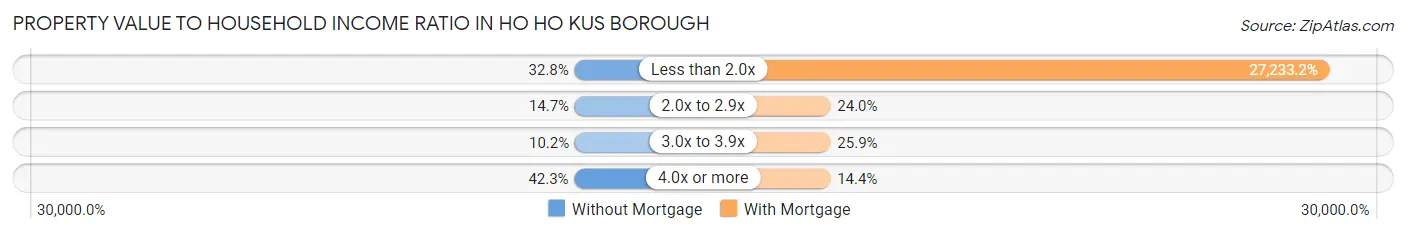
| Value-to-Income Ratio | Without Mortgage | With Mortgage |
| Less than 2.0x | 125 (32.8%) | 250,001 (27,233.2%) |
| 2.0x to 2.9x | 56 (14.7%) | 220 (24.0%) |
| 3.0x to 3.9x | 39 (10.2%) | 238 (25.9%) |
| 4.0x or more | 161 (42.3%) | 132 (14.4%) |
| Total | 381 (100.0%) | 918 (100.0%) |
Real Estate Taxes by Mortgage Status in Ho Ho Kus borough
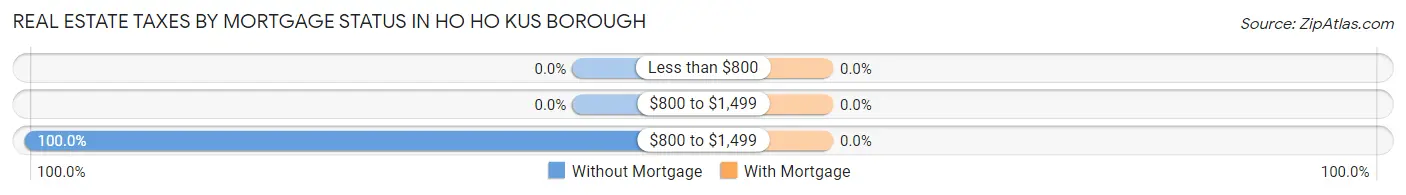
| Property Taxes | Without Mortgage | With Mortgage |
| Less than $800 | 0 (0.0%) | 0 (0.0%) |
| $800 to $1,499 | 0 (0.0%) | 0 (0.0%) |
| $800 to $1,499 | 381 (100.0%) | 0 (0.0%) |
| Total | 381 (100.0%) | 918 (100.0%) |
Health & Disability in Ho Ho Kus borough
Health Insurance Coverage by Age in Ho Ho Kus borough
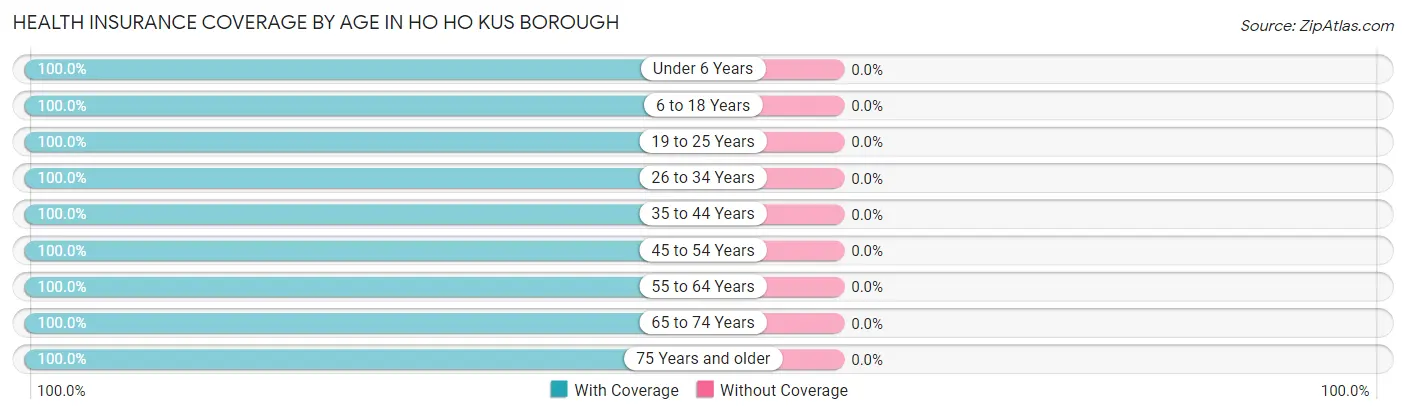
| Age Bracket | With Coverage | Without Coverage |
| Under 6 Years | 369 (100.0%) | 0 (0.0%) |
| 6 to 18 Years | 876 (100.0%) | 0 (0.0%) |
| 19 to 25 Years | 384 (100.0%) | 0 (0.0%) |
| 26 to 34 Years | 127 (100.0%) | 0 (0.0%) |
| 35 to 44 Years | 609 (100.0%) | 0 (0.0%) |
| 45 to 54 Years | 561 (100.0%) | 0 (0.0%) |
| 55 to 64 Years | 735 (100.0%) | 0 (0.0%) |
| 65 to 74 Years | 337 (100.0%) | 0 (0.0%) |
| 75 Years and older | 236 (100.0%) | 0 (0.0%) |
| Total | 4,234 (100.0%) | 0 (0.0%) |
Health Insurance Coverage by Citizenship Status in Ho Ho Kus borough
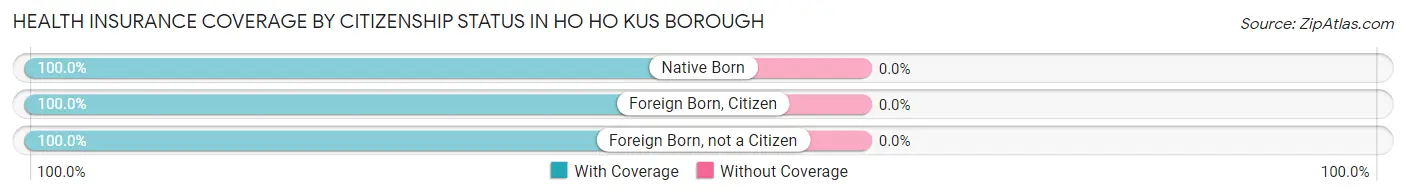
| Citizenship Status | With Coverage | Without Coverage |
| Native Born | 369 (100.0%) | 0 (0.0%) |
| Foreign Born, Citizen | 876 (100.0%) | 0 (0.0%) |
| Foreign Born, not a Citizen | 384 (100.0%) | 0 (0.0%) |
Health Insurance Coverage by Household Income in Ho Ho Kus borough
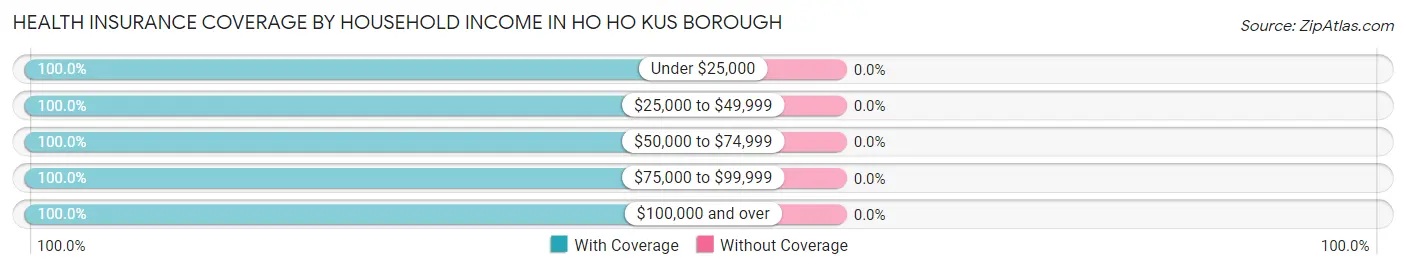
| Household Income | With Coverage | Without Coverage |
| Under $25,000 | 22 (100.0%) | 0 (0.0%) |
| $25,000 to $49,999 | 79 (100.0%) | 0 (0.0%) |
| $50,000 to $74,999 | 90 (100.0%) | 0 (0.0%) |
| $75,000 to $99,999 | 225 (100.0%) | 0 (0.0%) |
| $100,000 and over | 3,813 (100.0%) | 0 (0.0%) |
Public vs Private Health Insurance Coverage by Age in Ho Ho Kus borough
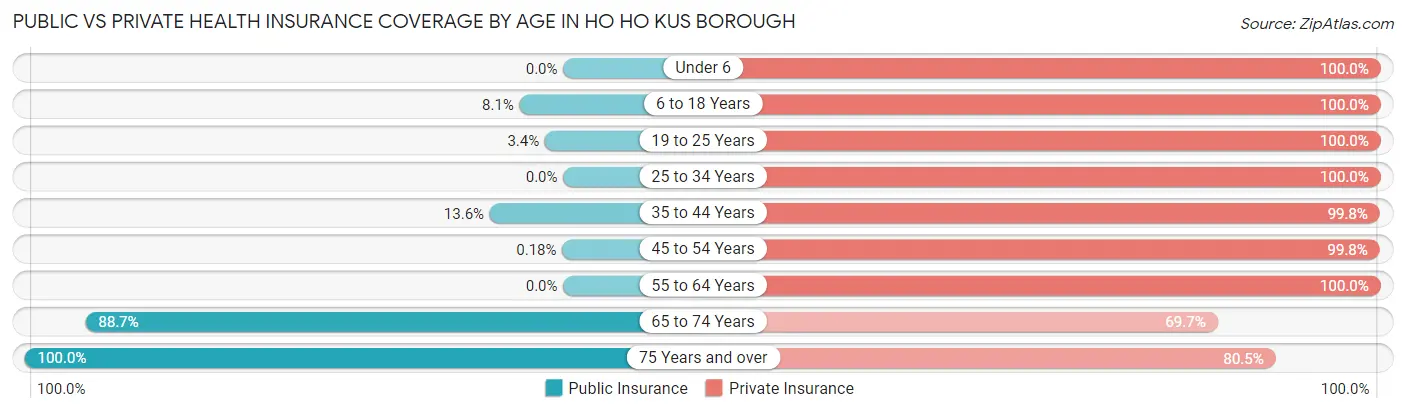
| Age Bracket | Public Insurance | Private Insurance |
| Under 6 | 0 (0.0%) | 369 (100.0%) |
| 6 to 18 Years | 71 (8.1%) | 876 (100.0%) |
| 19 to 25 Years | 13 (3.4%) | 384 (100.0%) |
| 25 to 34 Years | 0 (0.0%) | 127 (100.0%) |
| 35 to 44 Years | 83 (13.6%) | 608 (99.8%) |
| 45 to 54 Years | 1 (0.2%) | 560 (99.8%) |
| 55 to 64 Years | 0 (0.0%) | 735 (100.0%) |
| 65 to 74 Years | 299 (88.7%) | 235 (69.7%) |
| 75 Years and over | 236 (100.0%) | 190 (80.5%) |
| Total | 703 (16.6%) | 4,084 (96.5%) |
Disability Status by Sex by Age in Ho Ho Kus borough
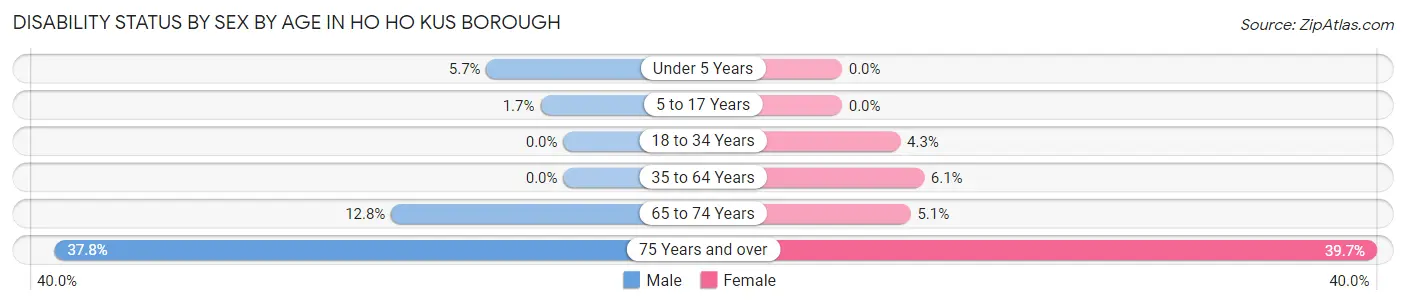
| Age Bracket | Male | Female |
| Under 5 Years | 10 (5.7%) | 0 (0.0%) |
| 5 to 17 Years | 9 (1.7%) | 0 (0.0%) |
| 18 to 34 Years | 0 (0.0%) | 12 (4.3%) |
| 35 to 64 Years | 0 (0.0%) | 60 (6.1%) |
| 65 to 74 Years | 23 (12.8%) | 8 (5.1%) |
| 75 Years and over | 34 (37.8%) | 58 (39.7%) |
Disability Class by Sex by Age in Ho Ho Kus borough
Disability Class: Hearing Difficulty
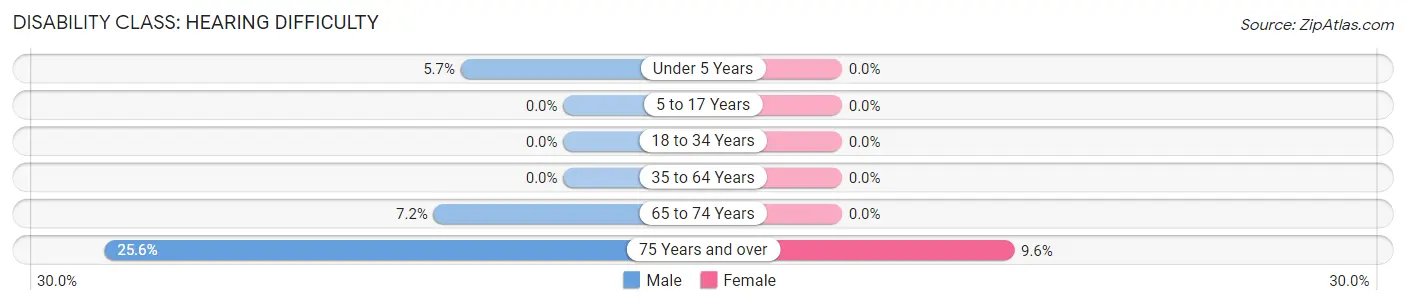
| Age Bracket | Male | Female |
| Under 5 Years | 10 (5.7%) | 0 (0.0%) |
| 5 to 17 Years | 0 (0.0%) | 0 (0.0%) |
| 18 to 34 Years | 0 (0.0%) | 0 (0.0%) |
| 35 to 64 Years | 0 (0.0%) | 0 (0.0%) |
| 65 to 74 Years | 13 (7.2%) | 0 (0.0%) |
| 75 Years and over | 23 (25.6%) | 14 (9.6%) |
Disability Class: Vision Difficulty
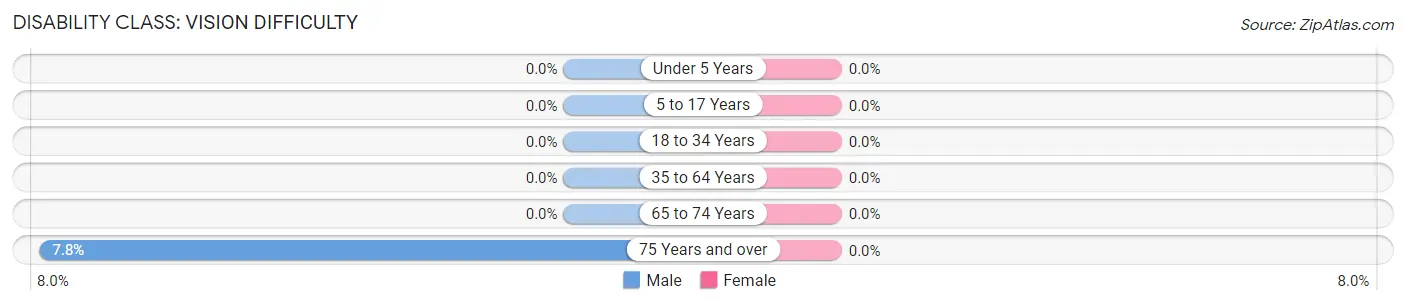
| Age Bracket | Male | Female |
| Under 5 Years | 0 (0.0%) | 0 (0.0%) |
| 5 to 17 Years | 0 (0.0%) | 0 (0.0%) |
| 18 to 34 Years | 0 (0.0%) | 0 (0.0%) |
| 35 to 64 Years | 0 (0.0%) | 0 (0.0%) |
| 65 to 74 Years | 0 (0.0%) | 0 (0.0%) |
| 75 Years and over | 7 (7.8%) | 0 (0.0%) |
Disability Class: Cognitive Difficulty
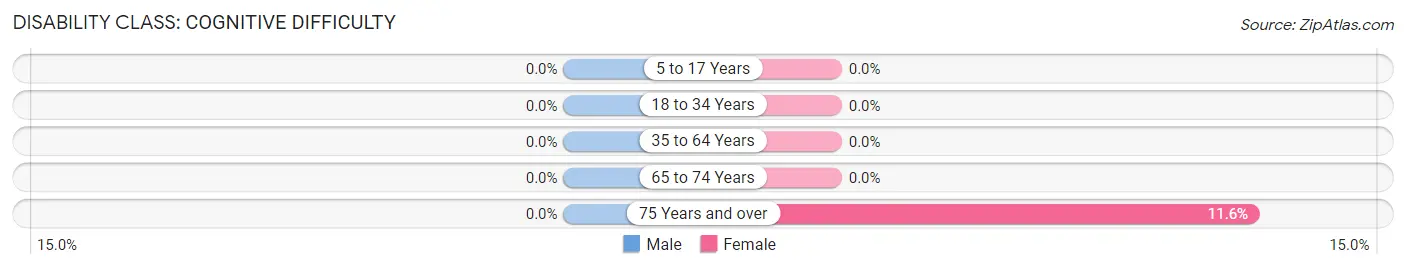
| Age Bracket | Male | Female |
| 5 to 17 Years | 0 (0.0%) | 0 (0.0%) |
| 18 to 34 Years | 0 (0.0%) | 0 (0.0%) |
| 35 to 64 Years | 0 (0.0%) | 0 (0.0%) |
| 65 to 74 Years | 0 (0.0%) | 0 (0.0%) |
| 75 Years and over | 0 (0.0%) | 17 (11.6%) |
Disability Class: Ambulatory Difficulty
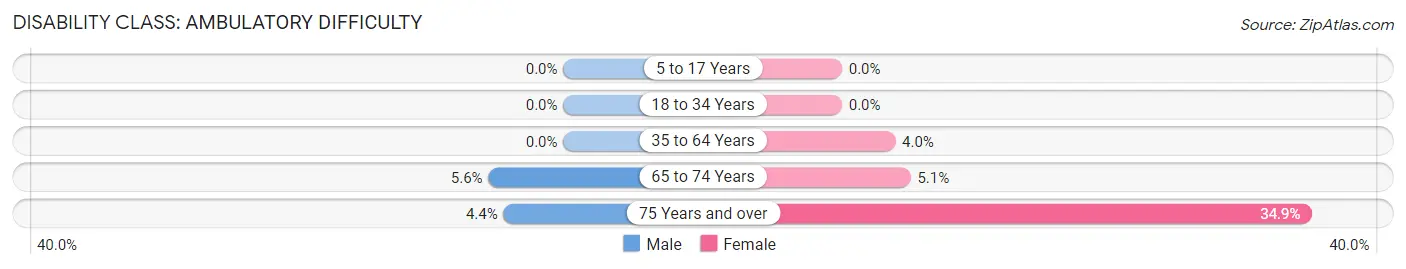
| Age Bracket | Male | Female |
| 5 to 17 Years | 0 (0.0%) | 0 (0.0%) |
| 18 to 34 Years | 0 (0.0%) | 0 (0.0%) |
| 35 to 64 Years | 0 (0.0%) | 39 (4.0%) |
| 65 to 74 Years | 10 (5.6%) | 8 (5.1%) |
| 75 Years and over | 4 (4.4%) | 51 (34.9%) |
Disability Class: Self-Care Difficulty
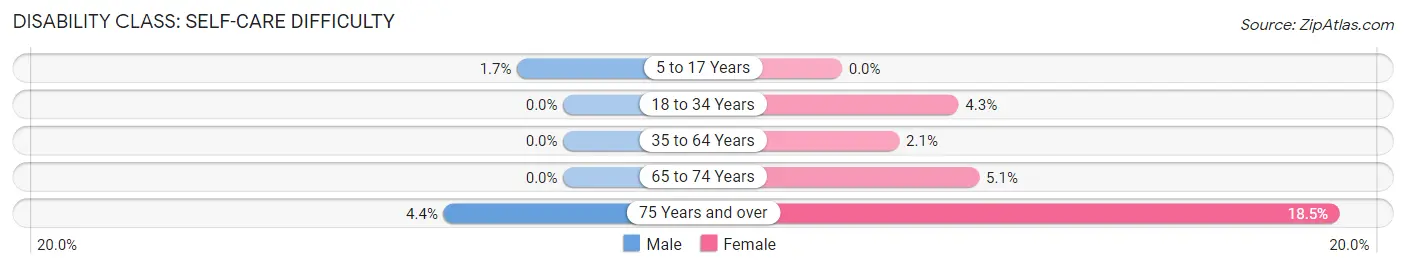
| Age Bracket | Male | Female |
| 5 to 17 Years | 9 (1.7%) | 0 (0.0%) |
| 18 to 34 Years | 0 (0.0%) | 12 (4.3%) |
| 35 to 64 Years | 0 (0.0%) | 21 (2.1%) |
| 65 to 74 Years | 0 (0.0%) | 8 (5.1%) |
| 75 Years and over | 4 (4.4%) | 27 (18.5%) |
Technology Access in Ho Ho Kus borough
Computing Device Access in Ho Ho Kus borough
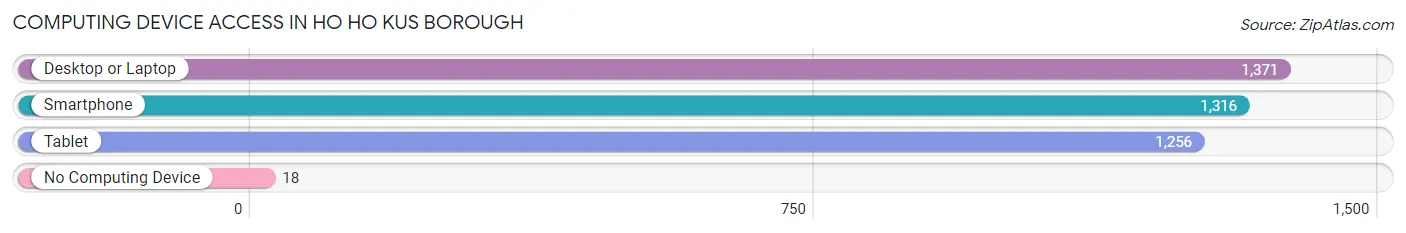
| Device Type | # Households | % Households |
| Desktop or Laptop | 1,371 | 97.3% |
| Smartphone | 1,316 | 93.4% |
| Tablet | 1,256 | 89.1% |
| No Computing Device | 18 | 1.3% |
| Total | 1,409 | 100.0% |
Internet Access in Ho Ho Kus borough
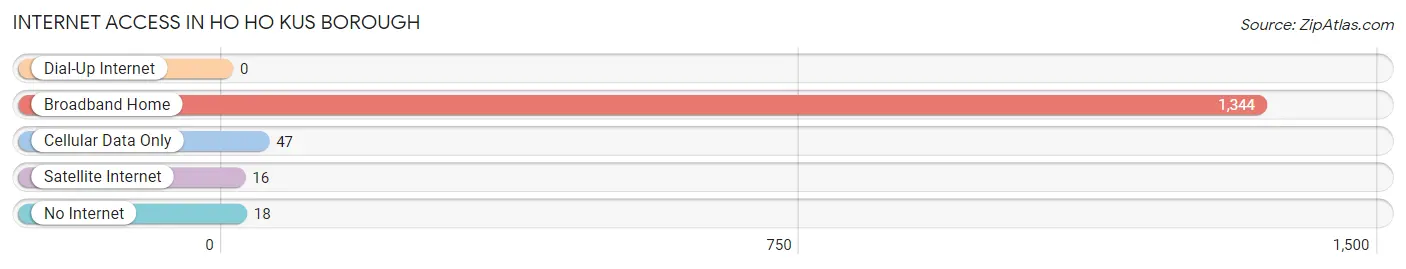
| Internet Type | # Households | % Households |
| Dial-Up Internet | 0 | 0.0% |
| Broadband Home | 1,344 | 95.4% |
| Cellular Data Only | 47 | 3.3% |
| Satellite Internet | 16 | 1.1% |
| No Internet | 18 | 1.3% |
| Total | 1,409 | 100.0% |
Ho Ho Kus borough Summary
Ho Ho Kus Borough is a small borough located in Bergen County, New Jersey. It is situated in the northeastern part of the state, about 20 miles northwest of New York City. The borough is bordered by the towns of Waldwick, Ridgewood, Saddle River, and Allendale. The population of Ho Ho Kus Borough was 4,078 as of the 2010 census.
Geography
Ho Ho Kus Borough is located at 40°59'N 74°09'W. It has a total area of 1.3 square miles, all of which is land. The borough is situated in the Ramapo Mountains, and is part of the Great Appalachian Valley. The borough is located in the Hackensack River watershed.
History
Ho Ho Kus Borough was originally inhabited by the Lenni Lenape Native Americans. The area was first settled by Europeans in the late 17th century. The borough was incorporated in 1904 from portions of Franklin Township and Orvil Township. The name of the borough is derived from the Lenni Lenape phrase "Ho-Ho-Kus," which means "red cedar."
Economy
The economy of Ho Ho Kus Borough is largely based on retail and services. The borough is home to several small businesses, including restaurants, shops, and professional services. The borough also has a number of corporate offices, including those of the pharmaceutical company Merck & Co. and the financial services firm Prudential Financial.
Demographics
As of the 2010 census, the population of Ho Ho Kus Borough was 4,078. The racial makeup of the borough was 87.3% White, 4.2% Asian, 3.2% African American, and 2.3% Hispanic or Latino. The median household income was $118,958, and the median family income was $133,958.
The largest age group in Ho Ho Kus Borough was 45-54, which made up 24.3% of the population. The median age was 44.7 years. The borough had a higher percentage of married couples (63.2%) than the national average (50.7%).
Education
Ho Ho Kus Borough is served by the Ho Ho Kus Public Schools, which includes two elementary schools, one middle school, and one high school. The borough is also home to several private schools, including the Ho Ho Kus Montessori School and the Ho Ho Kus Christian Academy.
Conclusion
Ho Ho Kus Borough is a small borough located in Bergen County, New Jersey. It is situated in the northeastern part of the state, about 20 miles northwest of New York City. The borough is bordered by the towns of Waldwick, Ridgewood, Saddle River, and Allendale. The population of Ho Ho Kus Borough was 4,078 as of the 2010 census. The economy of Ho Ho Kus Borough is largely based on retail and services, and the borough is home to several small businesses, corporate offices, and private schools. The racial makeup of the borough was 87.3% White, 4.2% Asian, 3.2% African American, and 2.3% Hispanic or Latino. The median household income was $118,958, and the median family income was $133,958. Ho Ho Kus Borough is served by the Ho Ho Kus Public Schools, which includes two elementary schools, one middle school, and one high school.
Common Questions
What is Per Capita Income in Ho Ho Kus borough?
Per Capita income in Ho Ho Kus borough is $127,820.
What is the Median Family Income in Ho Ho Kus borough?
Median Family Income in Ho Ho Kus borough is $250,001.
What is the Median Household income in Ho Ho Kus borough?
Median Household Income in Ho Ho Kus borough is $250,001.
What is Income or Wage Gap in Ho Ho Kus borough?
Income or Wage Gap in Ho Ho Kus borough is 59.2%.
Women in Ho Ho Kus borough earn 40.8 cents for every dollar earned by a man.
What is Inequality or Gini Index in Ho Ho Kus borough?
Inequality or Gini Index in Ho Ho Kus borough is 0.44.
What is the Total Population of Ho Ho Kus borough?
Total Population of Ho Ho Kus borough is 4,234.
What is the Total Male Population of Ho Ho Kus borough?
Total Male Population of Ho Ho Kus borough is 2,136.
What is the Total Female Population of Ho Ho Kus borough?
Total Female Population of Ho Ho Kus borough is 2,098.
What is the Ratio of Males per 100 Females in Ho Ho Kus borough?
There are 101.81 Males per 100 Females in Ho Ho Kus borough.
What is the Ratio of Females per 100 Males in Ho Ho Kus borough?
There are 98.22 Females per 100 Males in Ho Ho Kus borough.
What is the Median Population Age in Ho Ho Kus borough?
Median Population Age in Ho Ho Kus borough is 43.0 Years.
What is the Average Family Size in Ho Ho Kus borough
Average Family Size in Ho Ho Kus borough is 3.4 People.
What is the Average Household Size in Ho Ho Kus borough
Average Household Size in Ho Ho Kus borough is 3.0 People.
How Large is the Labor Force in Ho Ho Kus borough?
There are 2,146 People in the Labor Forcein in Ho Ho Kus borough.
What is the Percentage of People in the Labor Force in Ho Ho Kus borough?
69.4% of People are in the Labor Force in Ho Ho Kus borough.
What is the Unemployment Rate in Ho Ho Kus borough?
Unemployment Rate in Ho Ho Kus borough is 2.0%.