Mountain Lakes borough, NJ Map & Demographics
Mountain Lakes borough Overview
$104,161
PER CAPITA INCOME
$250,001
AVG FAMILY INCOME
$250,001
AVG HOUSEHOLD INCOME
57.3%
WAGE / INCOME GAP [ % ]
42.7¢/ $1
WAGE / INCOME GAP [ $ ]
0.39
INEQUALITY / GINI INDEX
4,499
TOTAL POPULATION
2,352
MALE POPULATION
2,147
FEMALE POPULATION
109.55
MALES / 100 FEMALES
91.28
FEMALES / 100 MALES
43.7
MEDIAN AGE
3.5
AVG FAMILY SIZE
3.1
AVG HOUSEHOLD SIZE
2,149
LABOR FORCE [ PEOPLE ]
67.1%
PERCENT IN LABOR FORCE
2.6%
UNEMPLOYMENT RATE
Income in Mountain Lakes borough
Income Overview in Mountain Lakes borough
Per Capita Income in Mountain Lakes borough is $104,161, while median incomes of families and households are $250,001 and $250,001 respectively.
| Characteristic | Number | Measure |
| Per Capita Income | 4,499 | $104,161 |
| Median Family Income | 1,218 | $250,001 |
| Mean Family Income | 1,218 | $353,074 |
| Median Household Income | 1,430 | $250,001 |
| Mean Household Income | 1,430 | $327,082 |
| Income Deficit | 1,218 | $0 |
| Wage / Income Gap (%) | 4,499 | 57.25% |
| Wage / Income Gap ($) | 4,499 | 42.75¢ per $1 |
| Gini / Inequality Index | 4,499 | 0.39 |
Earnings by Sex in Mountain Lakes borough
Average Earnings in Mountain Lakes borough are $127,630, $166,023 for men and $70,972 for women, a difference of 57.3%.
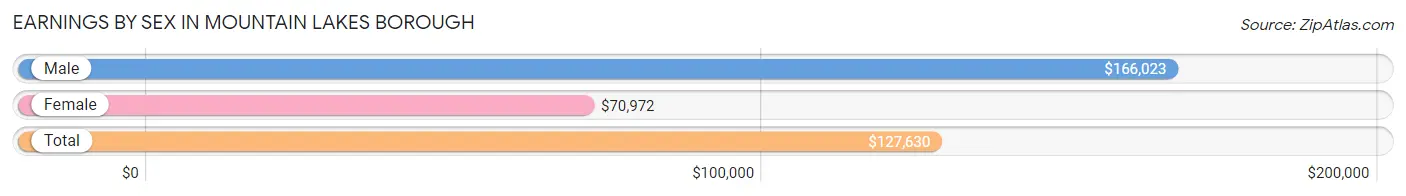
| Sex | Number | Average Earnings |
| Male | 1,227 (53.3%) | $166,023 |
| Female | 1,075 (46.7%) | $70,972 |
| Total | 2,302 (100.0%) | $127,630 |
Earnings by Sex by Income Bracket in Mountain Lakes borough
The most common earnings brackets in Mountain Lakes borough are $100,000+ for men (852 | 69.4%) and $100,000+ for women (436 | 40.6%).
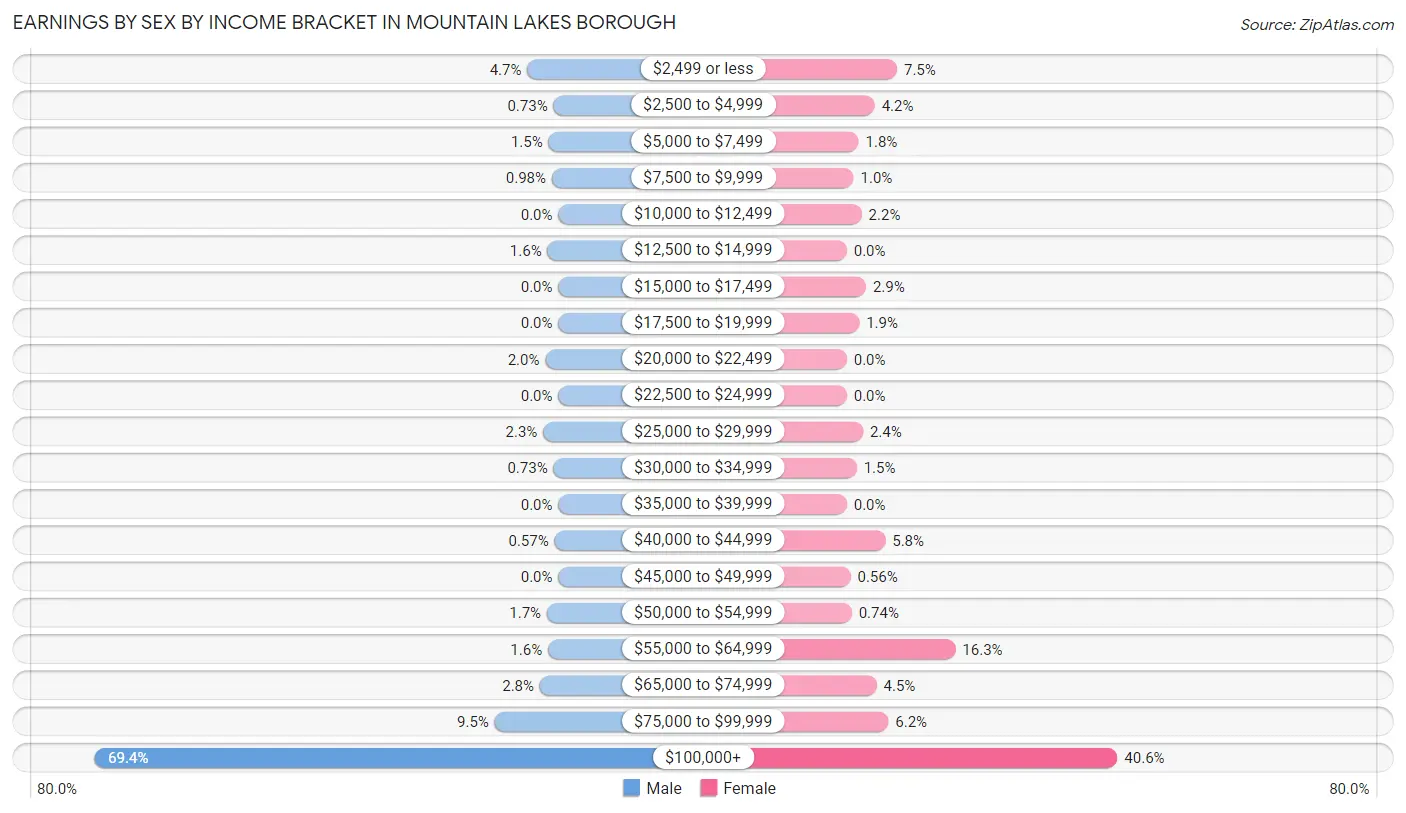
| Income | Male | Female |
| $2,499 or less | 57 (4.6%) | 81 (7.5%) |
| $2,500 to $4,999 | 9 (0.7%) | 45 (4.2%) |
| $5,000 to $7,499 | 18 (1.5%) | 19 (1.8%) |
| $7,500 to $9,999 | 12 (1.0%) | 11 (1.0%) |
| $10,000 to $12,499 | 0 (0.0%) | 24 (2.2%) |
| $12,500 to $14,999 | 20 (1.6%) | 0 (0.0%) |
| $15,000 to $17,499 | 0 (0.0%) | 31 (2.9%) |
| $17,500 to $19,999 | 0 (0.0%) | 20 (1.9%) |
| $20,000 to $22,499 | 24 (2.0%) | 0 (0.0%) |
| $22,500 to $24,999 | 0 (0.0%) | 0 (0.0%) |
| $25,000 to $29,999 | 28 (2.3%) | 26 (2.4%) |
| $30,000 to $34,999 | 9 (0.7%) | 16 (1.5%) |
| $35,000 to $39,999 | 0 (0.0%) | 0 (0.0%) |
| $40,000 to $44,999 | 7 (0.6%) | 62 (5.8%) |
| $45,000 to $49,999 | 0 (0.0%) | 6 (0.6%) |
| $50,000 to $54,999 | 21 (1.7%) | 8 (0.7%) |
| $55,000 to $64,999 | 19 (1.5%) | 175 (16.3%) |
| $65,000 to $74,999 | 34 (2.8%) | 48 (4.5%) |
| $75,000 to $99,999 | 117 (9.5%) | 67 (6.2%) |
| $100,000+ | 852 (69.4%) | 436 (40.6%) |
| Total | 1,227 (100.0%) | 1,075 (100.0%) |
Earnings by Sex by Educational Attainment in Mountain Lakes borough
Average earnings in Mountain Lakes borough are $192,625 for men and $91,250 for women, a difference of 52.6%. Men with an educational attainment of graduate degree enjoy the highest average annual earnings of $250,001, while those with bachelor's degree education earn the least with $235,250. Women with an educational attainment of graduate degree earn the most with the average annual earnings of $151,078, while those with bachelor's degree education have the smallest earnings of $57,293.
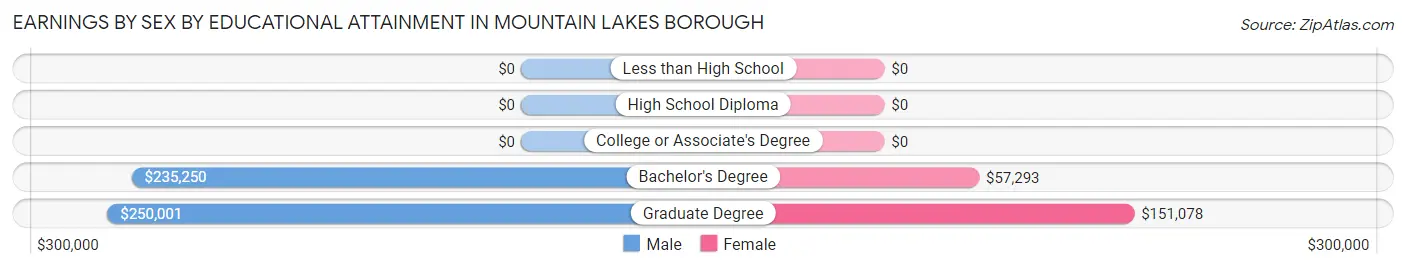
| Educational Attainment | Male Income | Female Income |
| Less than High School | - | - |
| High School Diploma | - | - |
| College or Associate's Degree | - | - |
| Bachelor's Degree | $235,250 | $57,293 |
| Graduate Degree | $250,001 | $151,078 |
| Total | $192,625 | $91,250 |
Family Income in Mountain Lakes borough
Family Income Brackets in Mountain Lakes borough
According to the Mountain Lakes borough family income data, there are 844 families falling into the $200,000+ income range, which is the most common income bracket and makes up 69.3% of all families.
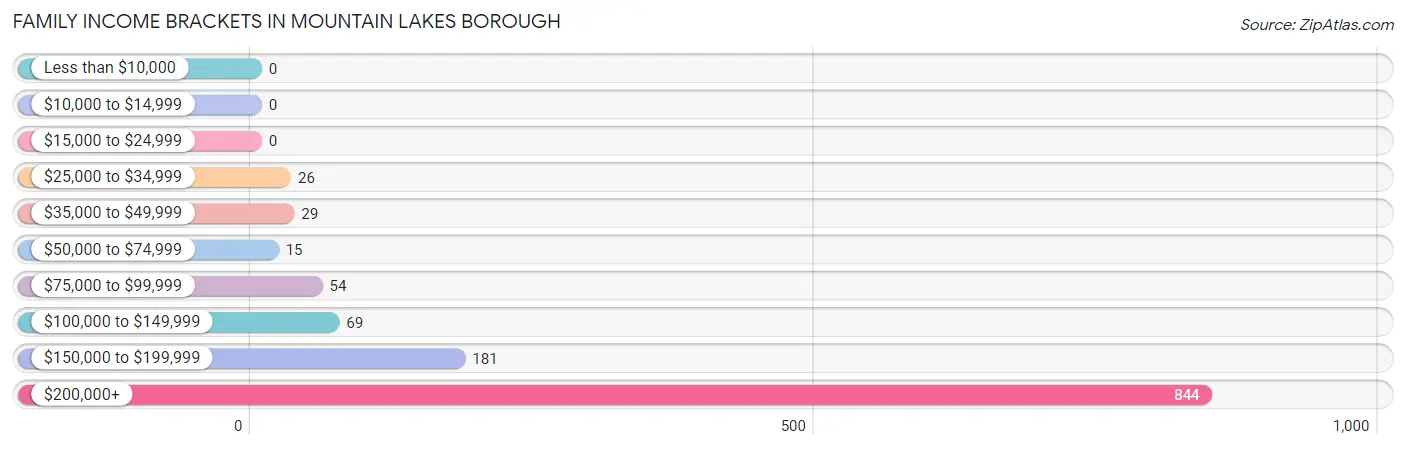
| Income Bracket | # Families | % Families |
| Less than $10,000 | 0 | 0.0% |
| $10,000 to $14,999 | 0 | 0.0% |
| $15,000 to $24,999 | 0 | 0.0% |
| $25,000 to $34,999 | 26 | 2.1% |
| $35,000 to $49,999 | 29 | 2.4% |
| $50,000 to $74,999 | 15 | 1.2% |
| $75,000 to $99,999 | 54 | 4.4% |
| $100,000 to $149,999 | 69 | 5.7% |
| $150,000 to $199,999 | 181 | 14.9% |
| $200,000+ | 844 | 69.3% |
Family Income by Famaliy Size in Mountain Lakes borough
2-person families (281 | 23.1%) account for the highest median family income in Mountain Lakes borough with $250,001 per family, while 2-person families (281 | 23.1%) have the highest median income of $125,000 per family member.
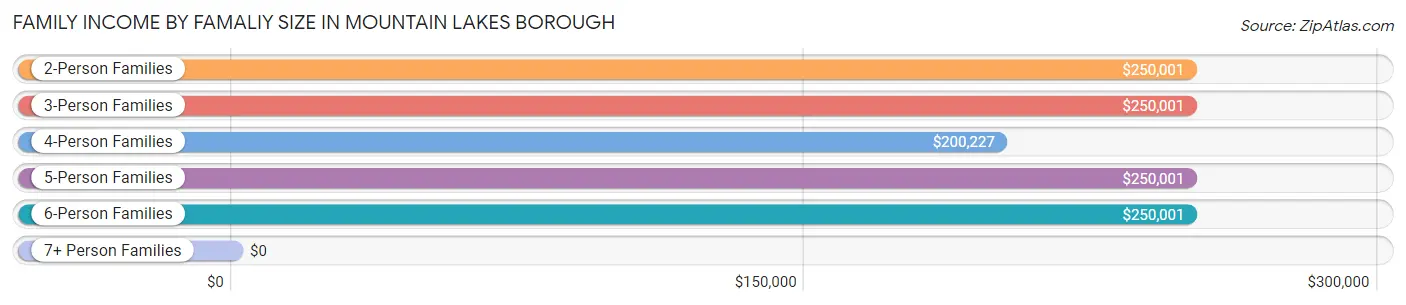
| Income Bracket | # Families | Median Income |
| 2-Person Families | 281 (23.1%) | $250,001 |
| 3-Person Families | 326 (26.8%) | $250,001 |
| 4-Person Families | 442 (36.3%) | $200,227 |
| 5-Person Families | 118 (9.7%) | $250,001 |
| 6-Person Families | 40 (3.3%) | $250,001 |
| 7+ Person Families | 11 (0.9%) | $0 |
| Total | 1,218 (100.0%) | $250,001 |
Family Income by Number of Earners in Mountain Lakes borough
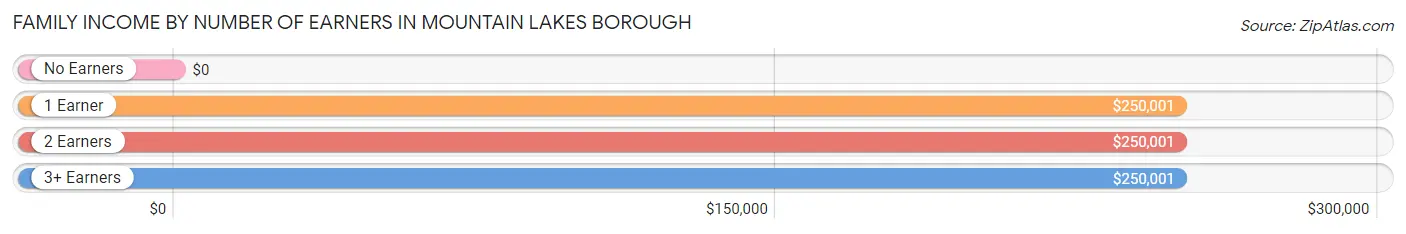
| Number of Earners | # Families | Median Income |
| No Earners | 56 (4.6%) | $0 |
| 1 Earner | 396 (32.5%) | $250,001 |
| 2 Earners | 636 (52.2%) | $250,001 |
| 3+ Earners | 130 (10.7%) | $250,001 |
| Total | 1,218 (100.0%) | $250,001 |
Household Income in Mountain Lakes borough
Household Income Brackets in Mountain Lakes borough
With 905 households falling in the category, the $200,000+ income range is the most frequent in Mountain Lakes borough, accounting for 63.3% of all households.
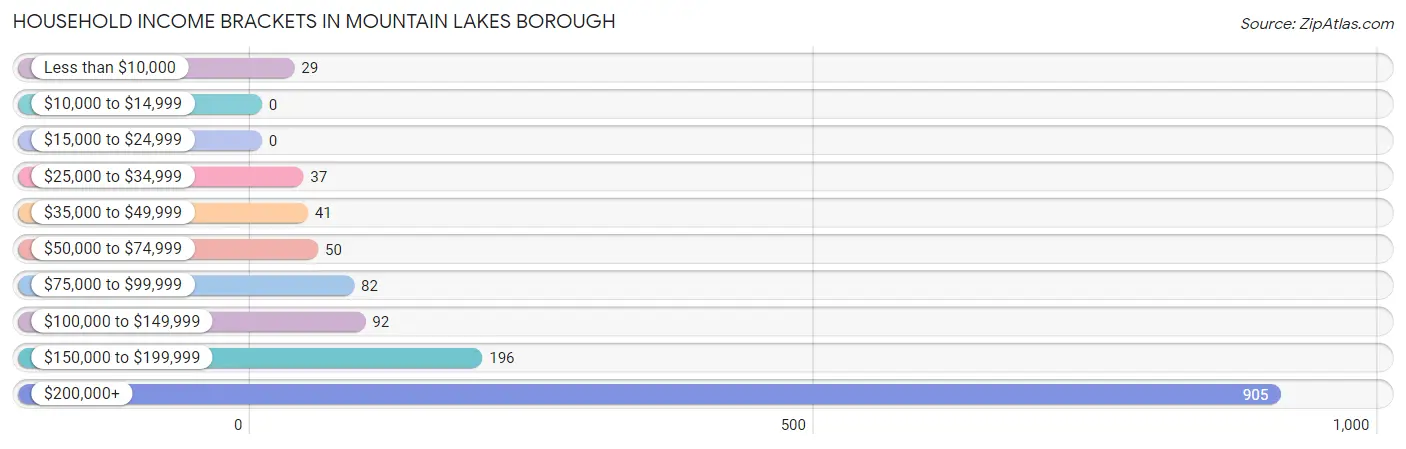
| Income Bracket | # Households | % Households |
| Less than $10,000 | 29 | 2.0% |
| $10,000 to $14,999 | 0 | 0.0% |
| $15,000 to $24,999 | 0 | 0.0% |
| $25,000 to $34,999 | 37 | 2.6% |
| $35,000 to $49,999 | 41 | 2.9% |
| $50,000 to $74,999 | 50 | 3.5% |
| $75,000 to $99,999 | 82 | 5.7% |
| $100,000 to $149,999 | 92 | 6.4% |
| $150,000 to $199,999 | 196 | 13.7% |
| $200,000+ | 905 | 63.3% |
Household Income by Householder Age in Mountain Lakes borough
The median household income in Mountain Lakes borough is $250,001, with the highest median household income of $250,001 found in the 25 to 44 years age bracket for the primary householder. A total of 264 households (18.5%) fall into this category.
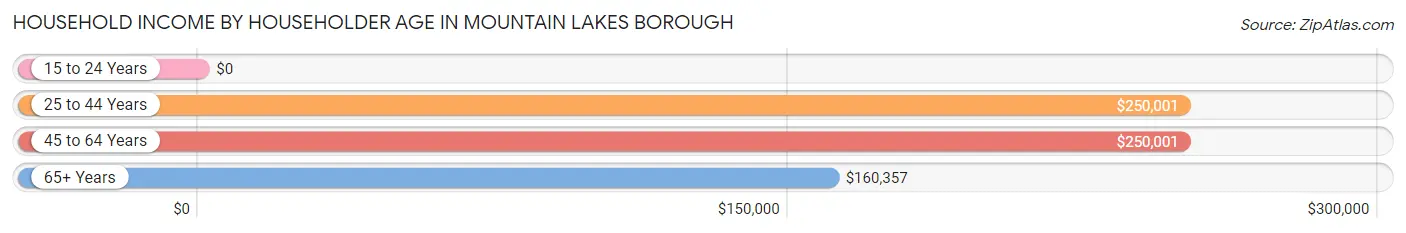
| Income Bracket | # Households | Median Income |
| 15 to 24 Years | 0 (0.0%) | $0 |
| 25 to 44 Years | 264 (18.5%) | $250,001 |
| 45 to 64 Years | 848 (59.3%) | $250,001 |
| 65+ Years | 318 (22.2%) | $160,357 |
| Total | 1,430 (100.0%) | $250,001 |
Poverty in Mountain Lakes borough
Income Below Poverty by Sex and Age in Mountain Lakes borough
With 0.3% poverty level for males and 2.4% for females among the residents of Mountain Lakes borough, 65 to 74 year old males and 25 to 34 year old females are the most vulnerable to poverty, with 8 males (5.7%) and 11 females (17.2%) in their respective age groups living below the poverty level.
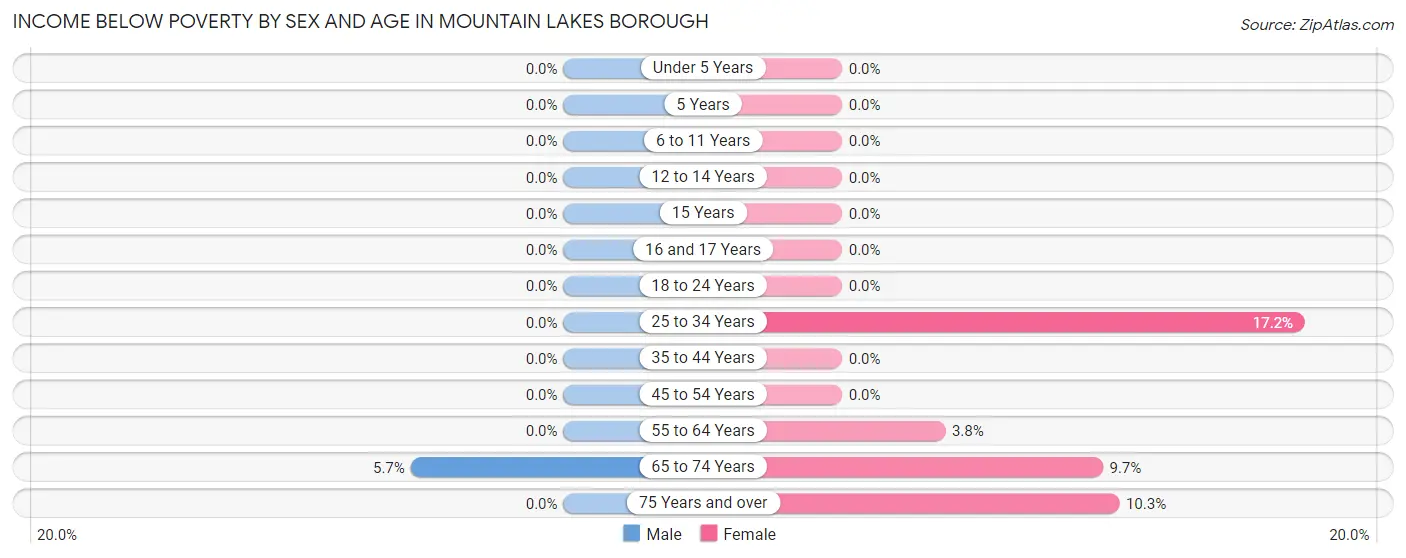
| Age Bracket | Male | Female |
| Under 5 Years | 0 (0.0%) | 0 (0.0%) |
| 5 Years | 0 (0.0%) | 0 (0.0%) |
| 6 to 11 Years | 0 (0.0%) | 0 (0.0%) |
| 12 to 14 Years | 0 (0.0%) | 0 (0.0%) |
| 15 Years | 0 (0.0%) | 0 (0.0%) |
| 16 and 17 Years | 0 (0.0%) | 0 (0.0%) |
| 18 to 24 Years | 0 (0.0%) | 0 (0.0%) |
| 25 to 34 Years | 0 (0.0%) | 11 (17.2%) |
| 35 to 44 Years | 0 (0.0%) | 0 (0.0%) |
| 45 to 54 Years | 0 (0.0%) | 0 (0.0%) |
| 55 to 64 Years | 0 (0.0%) | 11 (3.8%) |
| 65 to 74 Years | 8 (5.7%) | 15 (9.7%) |
| 75 Years and over | 0 (0.0%) | 14 (10.3%) |
| Total | 8 (0.3%) | 51 (2.4%) |
Income Above Poverty by Sex and Age in Mountain Lakes borough
According to the poverty statistics in Mountain Lakes borough, males aged under 5 years and females aged under 5 years are the age groups that are most secure financially, with 100.0% of males and 100.0% of females in these age groups living above the poverty line.
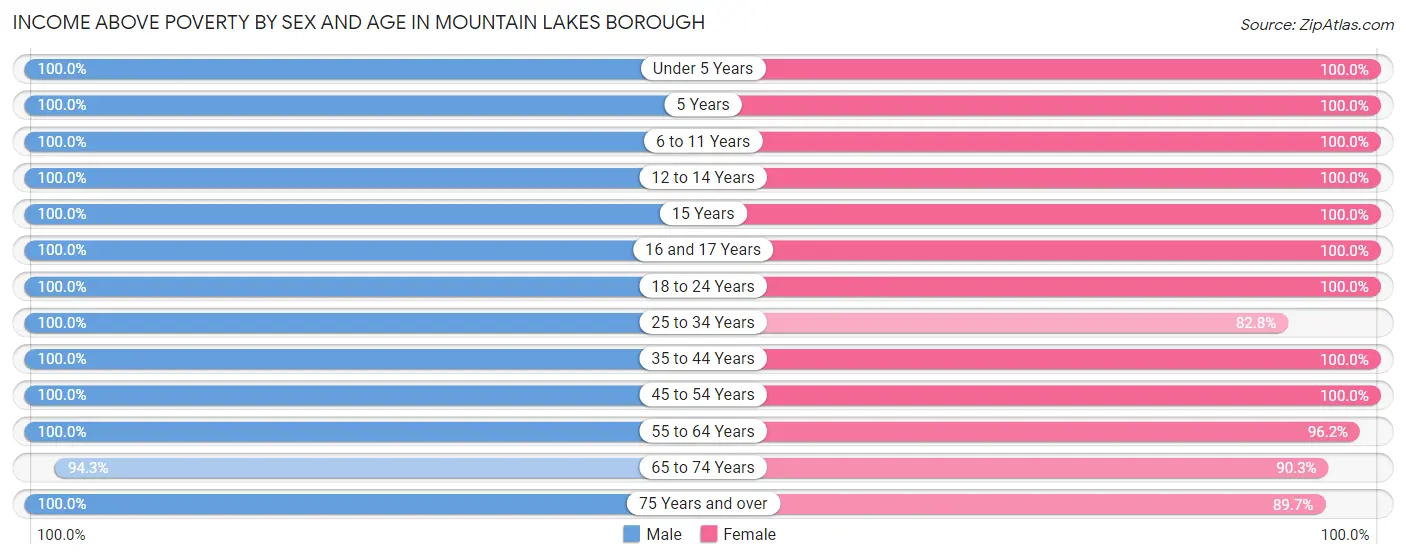
| Age Bracket | Male | Female |
| Under 5 Years | 78 (100.0%) | 82 (100.0%) |
| 5 Years | 22 (100.0%) | 32 (100.0%) |
| 6 to 11 Years | 442 (100.0%) | 197 (100.0%) |
| 12 to 14 Years | 221 (100.0%) | 111 (100.0%) |
| 15 Years | 72 (100.0%) | 40 (100.0%) |
| 16 and 17 Years | 138 (100.0%) | 90 (100.0%) |
| 18 to 24 Years | 135 (100.0%) | 147 (100.0%) |
| 25 to 34 Years | 39 (100.0%) | 53 (82.8%) |
| 35 to 44 Years | 177 (100.0%) | 313 (100.0%) |
| 45 to 54 Years | 560 (100.0%) | 493 (100.0%) |
| 55 to 64 Years | 257 (100.0%) | 276 (96.2%) |
| 65 to 74 Years | 133 (94.3%) | 140 (90.3%) |
| 75 Years and over | 70 (100.0%) | 122 (89.7%) |
| Total | 2,344 (99.7%) | 2,096 (97.6%) |
Income Below Poverty Among Married-Couple Families in Mountain Lakes borough
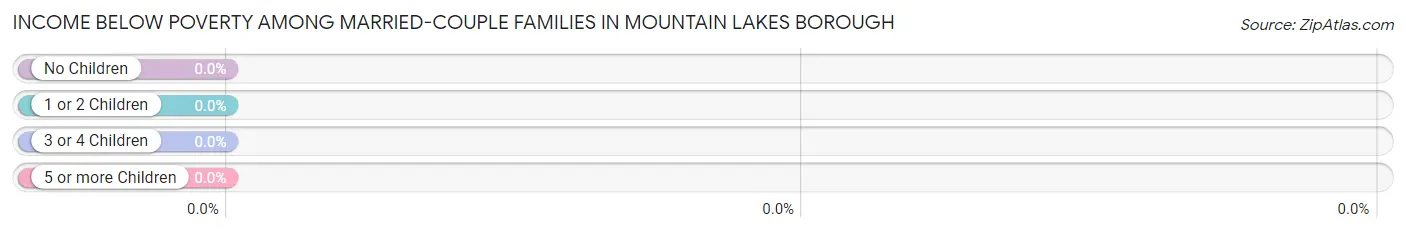
| Children | Above Poverty | Below Poverty |
| No Children | 343 (100.0%) | 0 (0.0%) |
| 1 or 2 Children | 560 (100.0%) | 0 (0.0%) |
| 3 or 4 Children | 143 (100.0%) | 0 (0.0%) |
| 5 or more Children | 11 (100.0%) | 0 (0.0%) |
| Total | 1,057 (100.0%) | 0 (0.0%) |
Income Below Poverty Among Single-Parent Households in Mountain Lakes borough
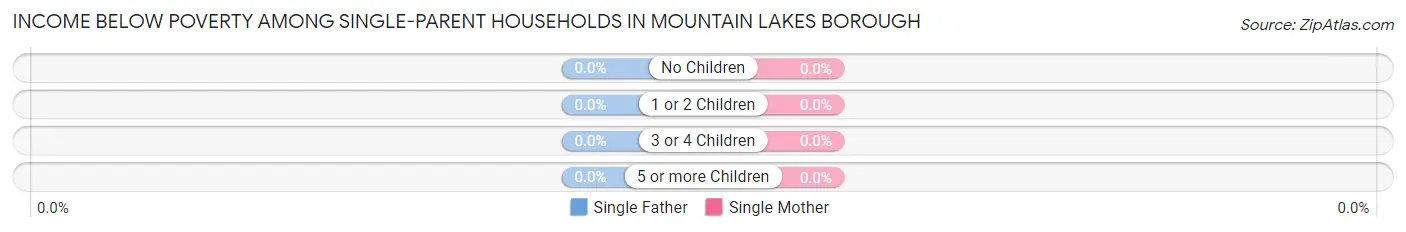
| Children | Single Father | Single Mother |
| No Children | 0 (0.0%) | 0 (0.0%) |
| 1 or 2 Children | 0 (0.0%) | 0 (0.0%) |
| 3 or 4 Children | 0 (0.0%) | 0 (0.0%) |
| 5 or more Children | 0 (0.0%) | 0 (0.0%) |
| Total | 0 (0.0%) | 0 (0.0%) |
Income Below Poverty Among Married-Couple vs Single-Parent Households in Mountain Lakes borough
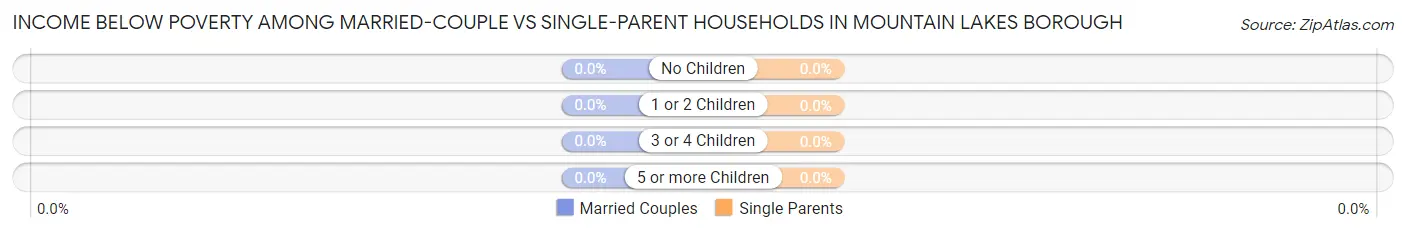
| Children | Married-Couple Families | Single-Parent Households |
| No Children | 0 (0.0%) | 0 (0.0%) |
| 1 or 2 Children | 0 (0.0%) | 0 (0.0%) |
| 3 or 4 Children | 0 (0.0%) | 0 (0.0%) |
| 5 or more Children | 0 (0.0%) | 0 (0.0%) |
| Total | 0 (0.0%) | 0 (0.0%) |
Race in Mountain Lakes borough
The most populous races in Mountain Lakes borough are White / Caucasian (3,717 | 82.6%), Asian (592 | 13.2%), and Hispanic or Latino (242 | 5.4%).
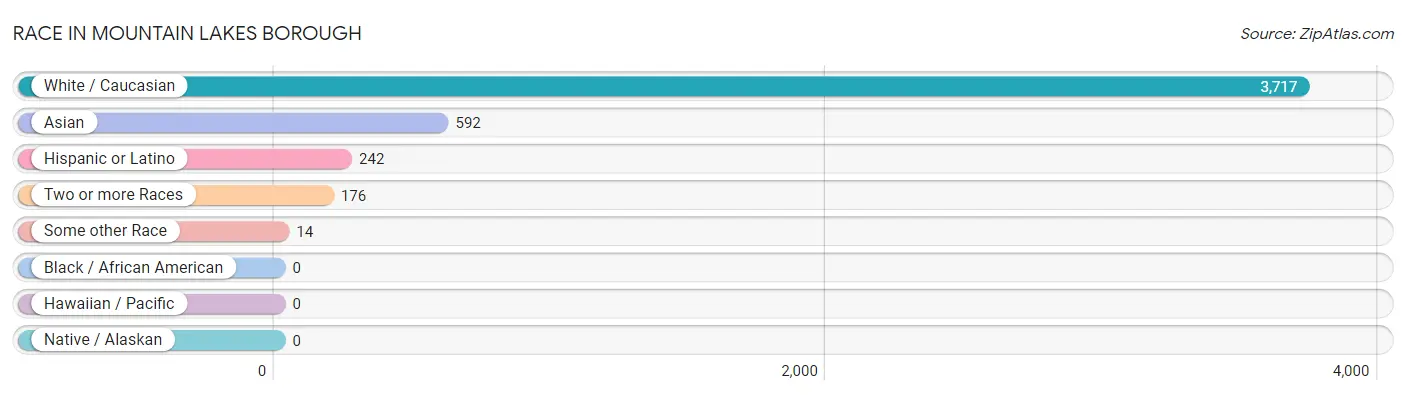
| Race | # Population | % Population |
| Asian | 592 | 13.2% |
| Black / African American | 0 | 0.0% |
| Hawaiian / Pacific | 0 | 0.0% |
| Hispanic or Latino | 242 | 5.4% |
| Native / Alaskan | 0 | 0.0% |
| White / Caucasian | 3,717 | 82.6% |
| Two or more Races | 176 | 3.9% |
| Some other Race | 14 | 0.3% |
| Total | 4,499 | 100.0% |
Ancestry in Mountain Lakes borough
The most populous ancestries reported in Mountain Lakes borough are Italian (1,371 | 30.5%), Irish (1,141 | 25.4%), German (610 | 13.6%), English (427 | 9.5%), and Indian (Asian) (397 | 8.8%), together accounting for 87.7% of all Mountain Lakes borough residents.
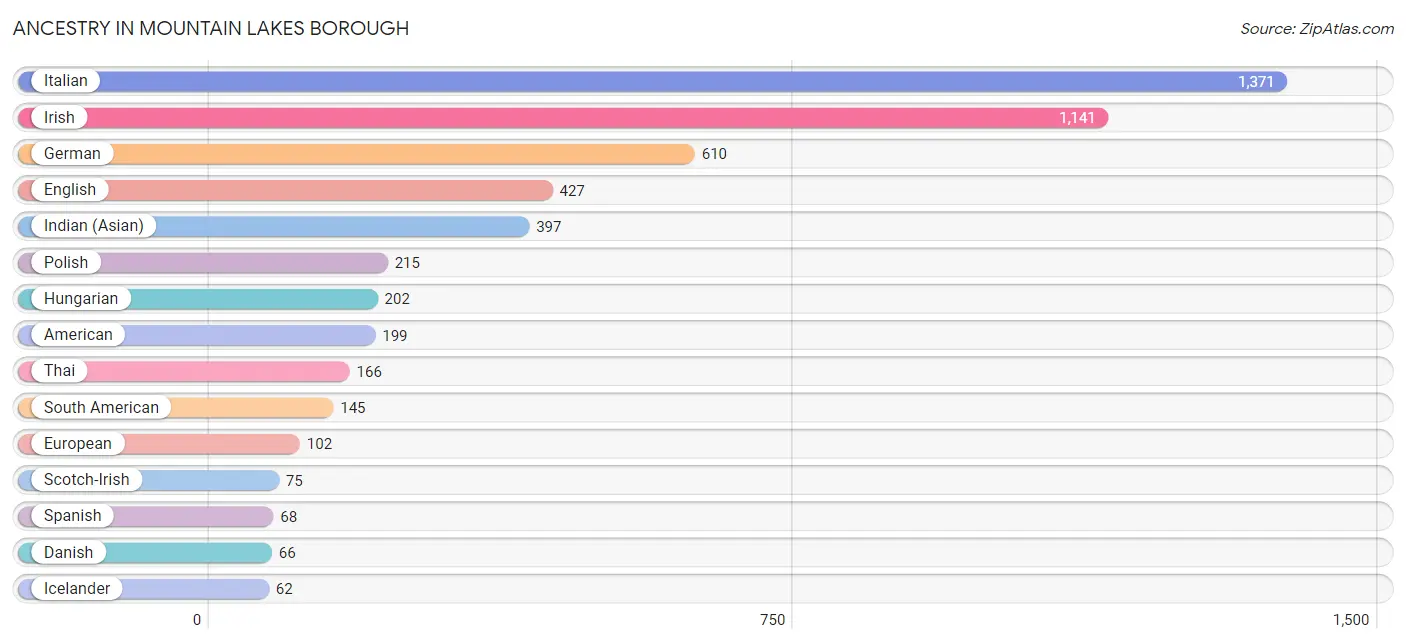
| Ancestry | # Population | % Population |
| American | 199 | 4.4% |
| Arab | 22 | 0.5% |
| Argentinean | 47 | 1.0% |
| Austrian | 8 | 0.2% |
| Belgian | 11 | 0.2% |
| Bolivian | 45 | 1.0% |
| British | 47 | 1.0% |
| Canadian | 46 | 1.0% |
| Carpatho Rusyn | 19 | 0.4% |
| Colombian | 35 | 0.8% |
| Cuban | 9 | 0.2% |
| Czech | 8 | 0.2% |
| Danish | 66 | 1.5% |
| Dutch | 52 | 1.2% |
| Eastern European | 22 | 0.5% |
| English | 427 | 9.5% |
| Estonian | 39 | 0.9% |
| European | 102 | 2.3% |
| Finnish | 11 | 0.2% |
| French | 56 | 1.2% |
| French Canadian | 12 | 0.3% |
| German | 610 | 13.6% |
| Greek | 31 | 0.7% |
| Hungarian | 202 | 4.5% |
| Icelander | 62 | 1.4% |
| Indian (Asian) | 397 | 8.8% |
| Irish | 1,141 | 25.4% |
| Italian | 1,371 | 30.5% |
| Korean | 38 | 0.8% |
| Peruvian | 9 | 0.2% |
| Polish | 215 | 4.8% |
| Romanian | 32 | 0.7% |
| Russian | 40 | 0.9% |
| Scotch-Irish | 75 | 1.7% |
| Scottish | 38 | 0.8% |
| Slovak | 5 | 0.1% |
| South African | 24 | 0.5% |
| South American | 145 | 3.2% |
| Spaniard | 20 | 0.4% |
| Spanish | 68 | 1.5% |
| Subsaharan African | 24 | 0.5% |
| Swedish | 42 | 0.9% |
| Swiss | 15 | 0.3% |
| Syrian | 22 | 0.5% |
| Thai | 166 | 3.7% |
| Ukrainian | 56 | 1.2% |
| Welsh | 20 | 0.4% | View All 47 Rows |
Immigrants in Mountain Lakes borough
The most numerous immigrant groups reported in Mountain Lakes borough came from Asia (345 | 7.7%), China (235 | 5.2%), Eastern Asia (235 | 5.2%), Europe (152 | 3.4%), and South Central Asia (102 | 2.3%), together accounting for 23.8% of all Mountain Lakes borough residents.
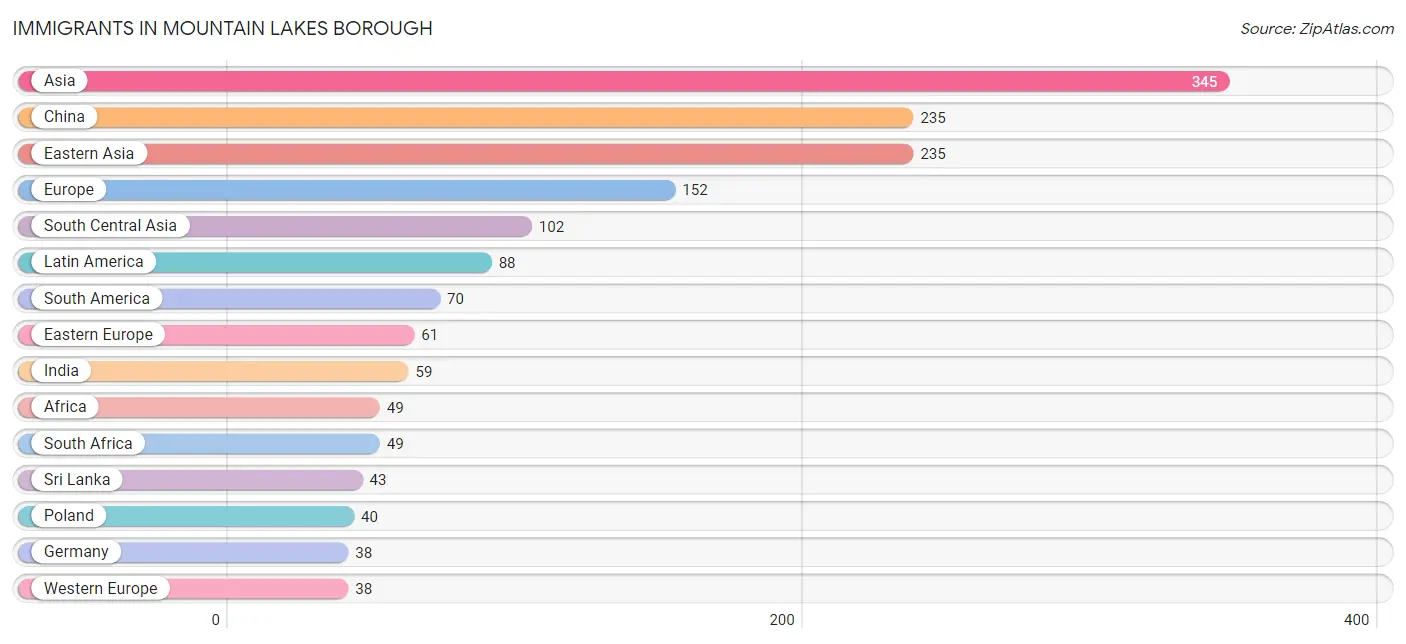
| Immigration Origin | # Population | % Population |
| Africa | 49 | 1.1% |
| Argentina | 35 | 0.8% |
| Asia | 345 | 7.7% |
| Canada | 21 | 0.5% |
| Caribbean | 18 | 0.4% |
| China | 235 | 5.2% |
| Colombia | 35 | 0.8% |
| Cuba | 9 | 0.2% |
| Dominican Republic | 9 | 0.2% |
| Eastern Asia | 235 | 5.2% |
| Eastern Europe | 61 | 1.4% |
| Europe | 152 | 3.4% |
| Germany | 38 | 0.8% |
| Hong Kong | 19 | 0.4% |
| India | 59 | 1.3% |
| Italy | 35 | 0.8% |
| Latin America | 88 | 2.0% |
| Moldova | 10 | 0.2% |
| Northern Europe | 18 | 0.4% |
| Oceania | 11 | 0.2% |
| Philippines | 8 | 0.2% |
| Poland | 40 | 0.9% |
| South Africa | 49 | 1.1% |
| South America | 70 | 1.6% |
| South Central Asia | 102 | 2.3% |
| South Eastern Asia | 8 | 0.2% |
| Southern Europe | 35 | 0.8% |
| Sri Lanka | 43 | 1.0% |
| Sweden | 7 | 0.2% |
| Taiwan | 35 | 0.8% |
| Ukraine | 11 | 0.2% |
| Western Europe | 38 | 0.8% | View All 32 Rows |
Sex and Age in Mountain Lakes borough
Sex and Age in Mountain Lakes borough
The most populous age groups in Mountain Lakes borough are 10 to 14 Years (407 | 17.3%) for men and 45 to 49 Years (309 | 14.4%) for women.
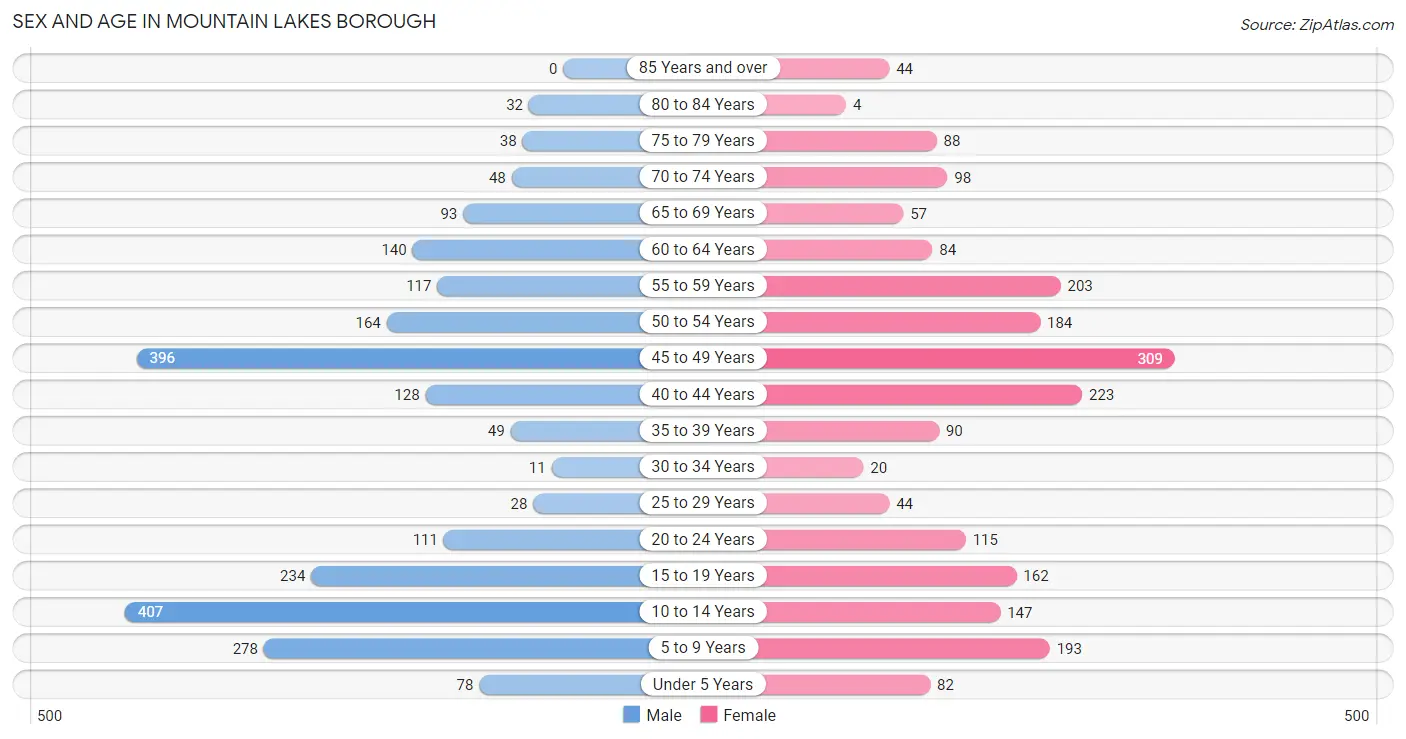
| Age Bracket | Male | Female |
| Under 5 Years | 78 (3.3%) | 82 (3.8%) |
| 5 to 9 Years | 278 (11.8%) | 193 (9.0%) |
| 10 to 14 Years | 407 (17.3%) | 147 (6.9%) |
| 15 to 19 Years | 234 (10.0%) | 162 (7.5%) |
| 20 to 24 Years | 111 (4.7%) | 115 (5.4%) |
| 25 to 29 Years | 28 (1.2%) | 44 (2.1%) |
| 30 to 34 Years | 11 (0.5%) | 20 (0.9%) |
| 35 to 39 Years | 49 (2.1%) | 90 (4.2%) |
| 40 to 44 Years | 128 (5.4%) | 223 (10.4%) |
| 45 to 49 Years | 396 (16.8%) | 309 (14.4%) |
| 50 to 54 Years | 164 (7.0%) | 184 (8.6%) |
| 55 to 59 Years | 117 (5.0%) | 203 (9.5%) |
| 60 to 64 Years | 140 (5.9%) | 84 (3.9%) |
| 65 to 69 Years | 93 (4.0%) | 57 (2.6%) |
| 70 to 74 Years | 48 (2.0%) | 98 (4.6%) |
| 75 to 79 Years | 38 (1.6%) | 88 (4.1%) |
| 80 to 84 Years | 32 (1.4%) | 4 (0.2%) |
| 85 Years and over | 0 (0.0%) | 44 (2.1%) |
| Total | 2,352 (100.0%) | 2,147 (100.0%) |
Families and Households in Mountain Lakes borough
Median Family Size in Mountain Lakes borough
The median family size in Mountain Lakes borough is 3.46 persons per family, with married-couple families (1,057 | 86.8%) accounting for the largest median family size of 3.52 persons per family. On the other hand, single male/father families (56 | 4.6%) represent the smallest median family size with 2.61 persons per family.
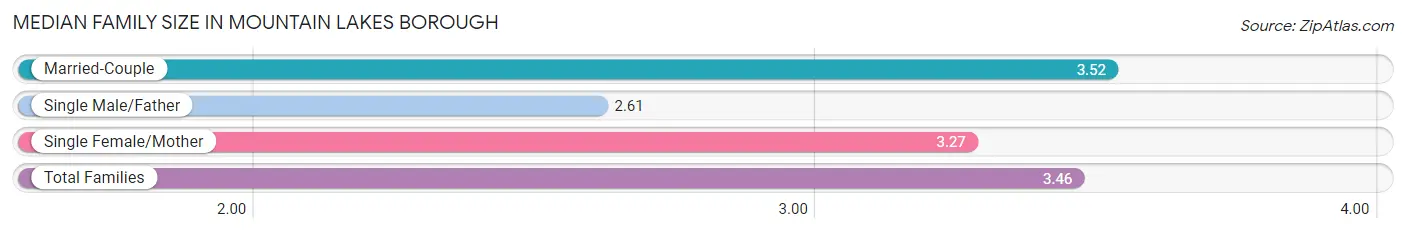
| Family Type | # Families | Family Size |
| Married-Couple | 1,057 (86.8%) | 3.52 |
| Single Male/Father | 56 (4.6%) | 2.61 |
| Single Female/Mother | 105 (8.6%) | 3.27 |
| Total Families | 1,218 (100.0%) | 3.46 |
Median Household Size in Mountain Lakes borough
The median household size in Mountain Lakes borough is 3.15 persons per household, with married-couple households (1,057 | 73.9%) accounting for the largest median household size of 3.53 persons per household. non-family households (212 | 14.8%) represent the smallest median household size with 1.18 persons per household.
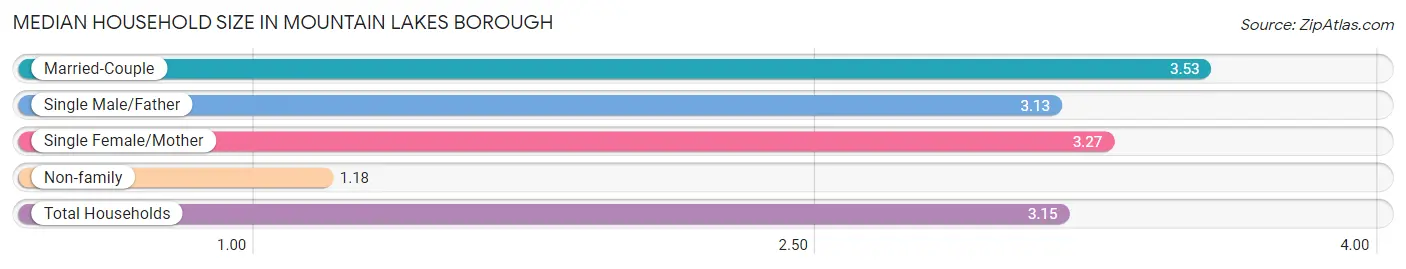
| Household Type | # Households | Household Size |
| Married-Couple | 1,057 (73.9%) | 3.53 |
| Single Male/Father | 56 (3.9%) | 3.13 |
| Single Female/Mother | 105 (7.3%) | 3.27 |
| Non-family | 212 (14.8%) | 1.18 |
| Total Households | 1,430 (100.0%) | 3.15 |
Household Size by Marriage Status in Mountain Lakes borough
Out of a total of 1,430 households in Mountain Lakes borough, 1,218 (85.2%) are family households, while 212 (14.8%) are nonfamily households. The most numerous type of family households are 4-person households, comprising 476, and the most common type of nonfamily households are 1-person households, comprising 173.
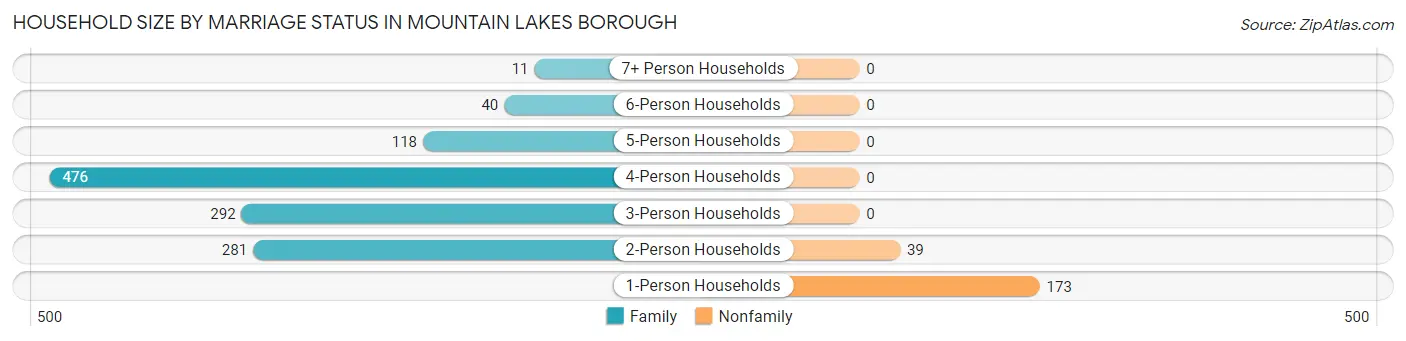
| Household Size | Family Households | Nonfamily Households |
| 1-Person Households | - | 173 (12.1%) |
| 2-Person Households | 281 (19.7%) | 39 (2.7%) |
| 3-Person Households | 292 (20.4%) | 0 (0.0%) |
| 4-Person Households | 476 (33.3%) | 0 (0.0%) |
| 5-Person Households | 118 (8.3%) | 0 (0.0%) |
| 6-Person Households | 40 (2.8%) | 0 (0.0%) |
| 7+ Person Households | 11 (0.8%) | 0 (0.0%) |
| Total | 1,218 (85.2%) | 212 (14.8%) |
Female Fertility in Mountain Lakes borough
Fertility by Age in Mountain Lakes borough
Average fertility rate in Mountain Lakes borough is 19.0 births per 1,000 women. Women in the age bracket of 20 to 34 years have the highest fertility rate with 56.0 births per 1,000 women. Women in the age bracket of 20 to 34 years acount for 52.6% of all women with births.
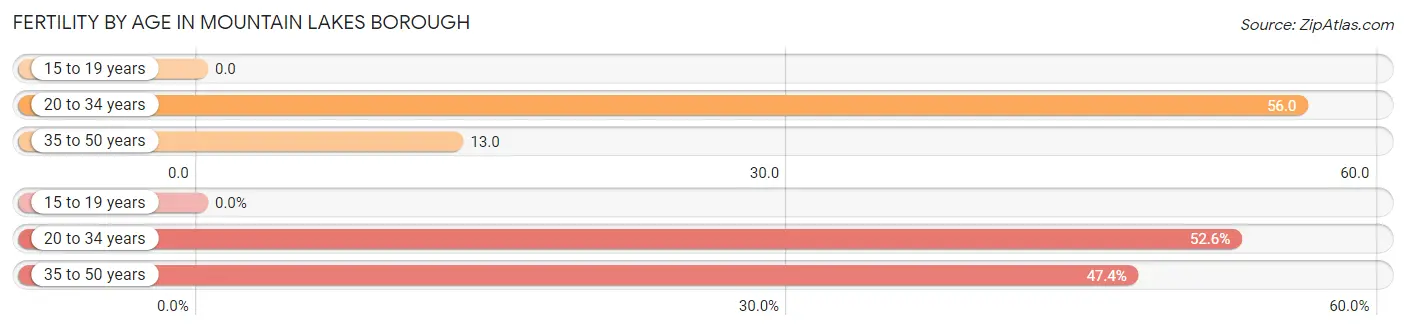
| Age Bracket | Women with Births | Births / 1,000 Women |
| 15 to 19 years | 0 (0.0%) | 0.0 |
| 20 to 34 years | 10 (52.6%) | 56.0 |
| 35 to 50 years | 9 (47.4%) | 13.0 |
| Total | 19 (100.0%) | 19.0 |
Fertility by Age by Marriage Status in Mountain Lakes borough
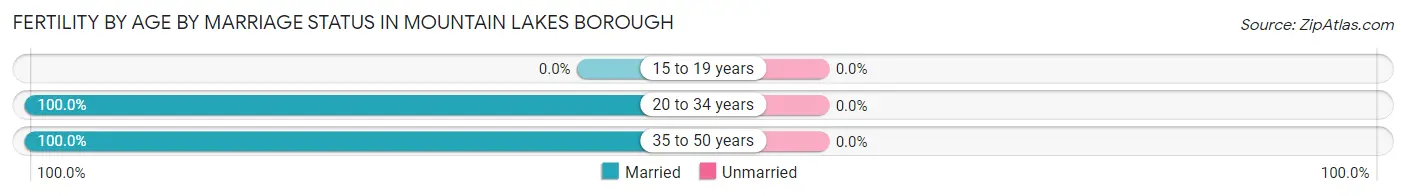
| Age Bracket | Married | Unmarried |
| 15 to 19 years | 0 (0.0%) | 0 (0.0%) |
| 20 to 34 years | 10 (100.0%) | 0 (0.0%) |
| 35 to 50 years | 9 (100.0%) | 0 (0.0%) |
| Total | 19 (100.0%) | 0 (0.0%) |
Fertility by Education in Mountain Lakes borough
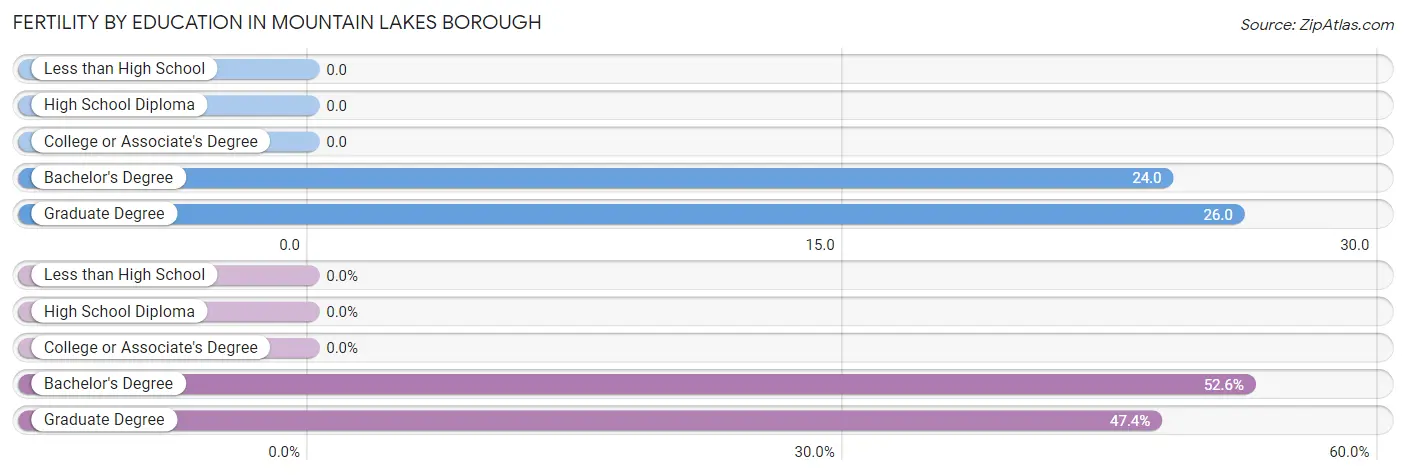
| Educational Attainment | Women with Births | Births / 1,000 Women |
| Less than High School | 0 (0.0%) | 0.0 |
| High School Diploma | 0 (0.0%) | 0.0 |
| College or Associate's Degree | 0 (0.0%) | 0.0 |
| Bachelor's Degree | 10 (52.6%) | 24.0 |
| Graduate Degree | 9 (47.4%) | 26.0 |
| Total | 19 (100.0%) | 19.0 |
Fertility by Education by Marriage Status in Mountain Lakes borough
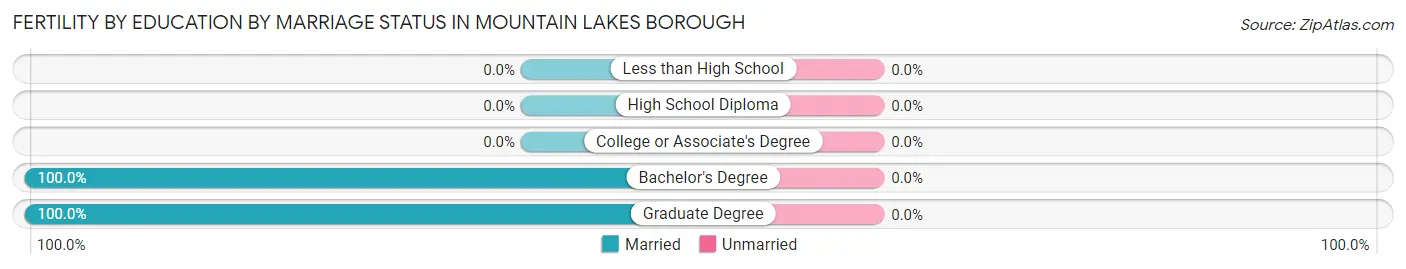
| Educational Attainment | Married | Unmarried |
| Less than High School | 0 (0.0%) | 0 (0.0%) |
| High School Diploma | 0 (0.0%) | 0 (0.0%) |
| College or Associate's Degree | 0 (0.0%) | 0 (0.0%) |
| Bachelor's Degree | 10 (100.0%) | 0 (0.0%) |
| Graduate Degree | 9 (100.0%) | 0 (0.0%) |
| Total | 19 (100.0%) | 0 (0.0%) |
Employment Characteristics in Mountain Lakes borough
Employment by Class of Employer in Mountain Lakes borough
Among the 2,012 employed individuals in Mountain Lakes borough, private company employees (1,332 | 66.2%), self-employed (incorporated) (245 | 12.2%), and self-employed (not incorporated) (159 | 7.9%) make up the most common classes of employment.
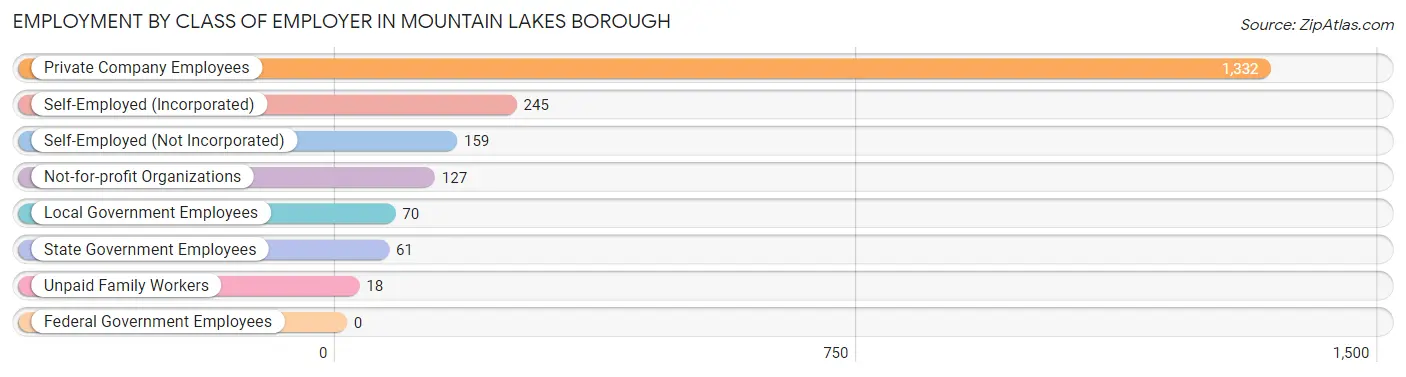
| Employer Class | # Employees | % Employees |
| Private Company Employees | 1,332 | 66.2% |
| Self-Employed (Incorporated) | 245 | 12.2% |
| Self-Employed (Not Incorporated) | 159 | 7.9% |
| Not-for-profit Organizations | 127 | 6.3% |
| Local Government Employees | 70 | 3.5% |
| State Government Employees | 61 | 3.0% |
| Federal Government Employees | 0 | 0.0% |
| Unpaid Family Workers | 18 | 0.9% |
| Total | 2,012 | 100.0% |
Employment Status by Age in Mountain Lakes borough
According to the labor force statistics for Mountain Lakes borough, out of the total population over 16 years of age (3,202), 67.1% or 2,149 individuals are in the labor force, with 2.6% or 56 of them unemployed. The age group with the highest labor force participation rate is 30 to 34 years, with 100.0% or 31 individuals in the labor force. Within the labor force, the 30 to 34 years age range has the highest percentage of unemployed individuals, with 25.8% or 8 of them being unemployed.
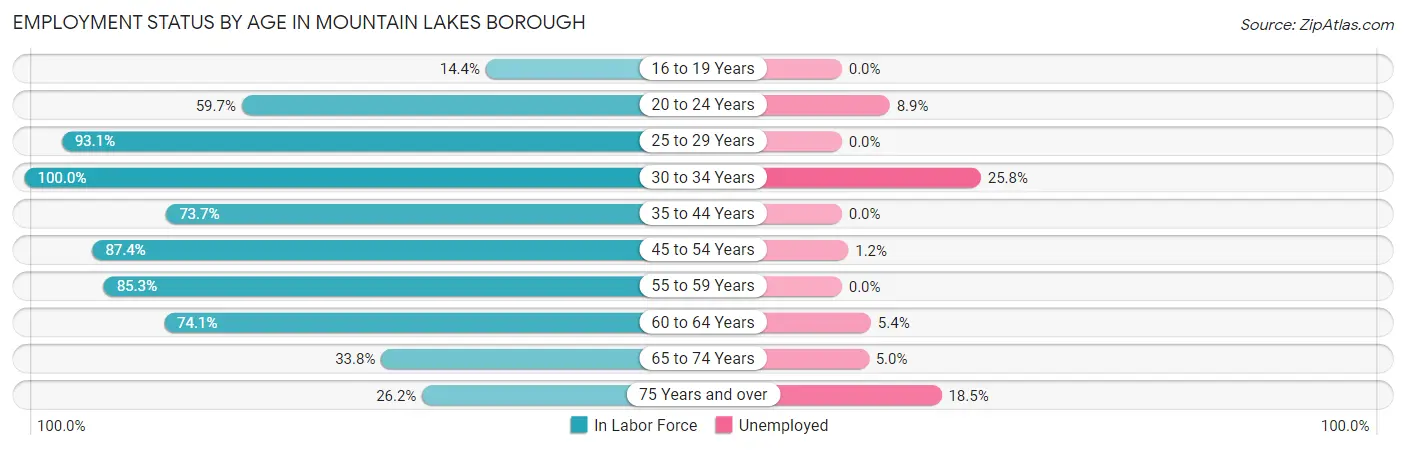
| Age Bracket | In Labor Force | Unemployed |
| 16 to 19 Years | 41 (14.4%) | 0 (0.0%) |
| 20 to 24 Years | 135 (59.7%) | 12 (8.9%) |
| 25 to 29 Years | 67 (93.1%) | 0 (0.0%) |
| 30 to 34 Years | 31 (100.0%) | 8 (25.8%) |
| 35 to 44 Years | 361 (73.7%) | 0 (0.0%) |
| 45 to 54 Years | 920 (87.4%) | 11 (1.2%) |
| 55 to 59 Years | 273 (85.3%) | 0 (0.0%) |
| 60 to 64 Years | 166 (74.1%) | 9 (5.4%) |
| 65 to 74 Years | 100 (33.8%) | 5 (5.0%) |
| 75 Years and over | 54 (26.2%) | 10 (18.5%) |
| Total | 2,149 (67.1%) | 56 (2.6%) |
Employment Status by Educational Attainment in Mountain Lakes borough
According to labor force statistics for Mountain Lakes borough, 83.0% of individuals (1,818) out of the total population between 25 and 64 years of age (2,190) are in the labor force, with 1.5% or 27 of them being unemployed. The group with the highest labor force participation rate are those with the educational attainment of less than high school, with 100.0% or 26 individuals in the labor force. Within the labor force, individuals with bachelor's degree or higher education have the highest percentage of unemployment, with 1.8% or 29 of them being unemployed.
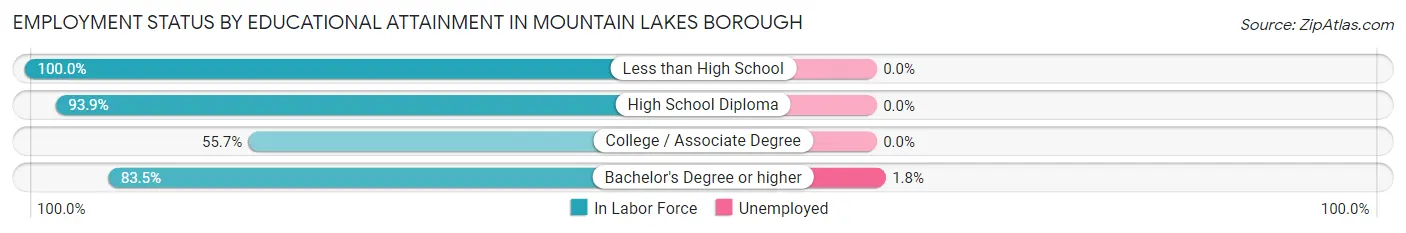
| Educational Attainment | In Labor Force | Unemployed |
| Less than High School | 26 (100.0%) | 0 (0.0%) |
| High School Diploma | 138 (93.9%) | 0 (0.0%) |
| College / Associate Degree | 59 (55.7%) | 0 (0.0%) |
| Bachelor's Degree or higher | 1,596 (83.5%) | 34 (1.8%) |
| Total | 1,818 (83.0%) | 33 (1.5%) |
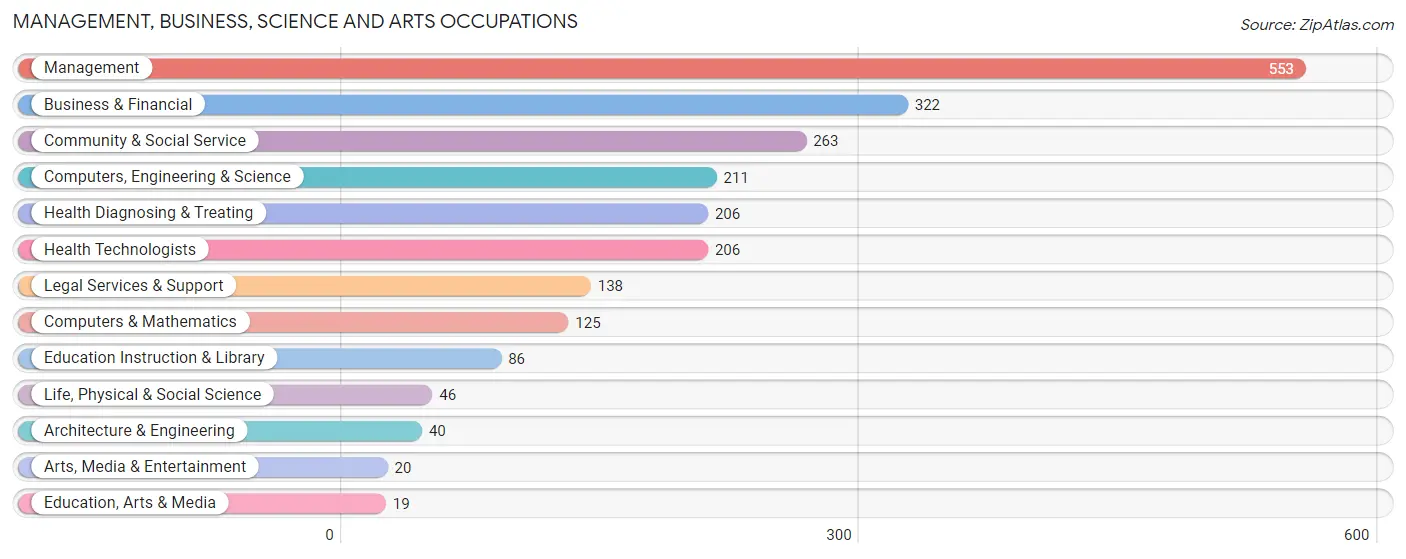
Employment Occupations by Sex in Mountain Lakes borough
Management, Business, Science and Arts Occupations
The most common Management, Business, Science and Arts occupations in Mountain Lakes borough are Management (553 | 26.4%), Business & Financial (322 | 15.4%), Community & Social Service (263 | 12.6%), Computers, Engineering & Science (211 | 10.1%), and Health Diagnosing & Treating (206 | 9.8%).
Management, Business, Science and Arts Occupations by Sex
Within the Management, Business, Science and Arts occupations in Mountain Lakes borough, the most male-oriented occupations are Computers & Mathematics (71.2%), Architecture & Engineering (70.0%), and Legal Services & Support (68.1%), while the most female-oriented occupations are Life, Physical & Social Science (100.0%), Education, Arts & Media (100.0%), and Health Diagnosing & Treating (82.0%).
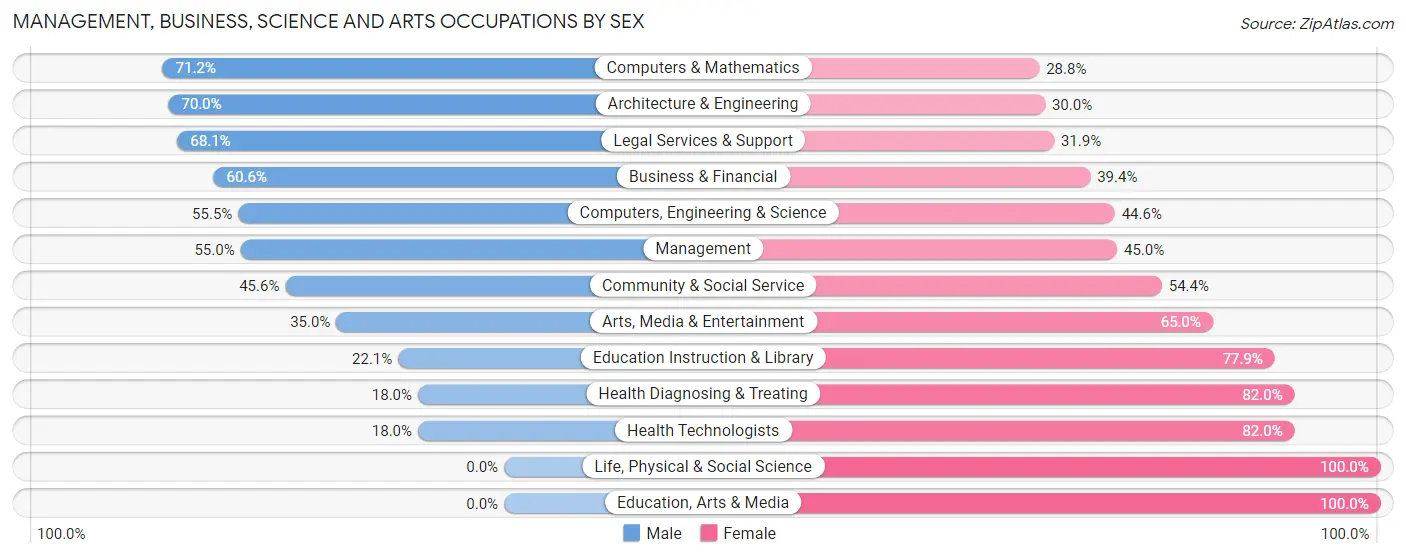
| Occupation | Male | Female |
| Management | 304 (55.0%) | 249 (45.0%) |
| Business & Financial | 195 (60.6%) | 127 (39.4%) |
| Computers, Engineering & Science | 117 (55.4%) | 94 (44.6%) |
| Computers & Mathematics | 89 (71.2%) | 36 (28.8%) |
| Architecture & Engineering | 28 (70.0%) | 12 (30.0%) |
| Life, Physical & Social Science | 0 (0.0%) | 46 (100.0%) |
| Community & Social Service | 120 (45.6%) | 143 (54.4%) |
| Education, Arts & Media | 0 (0.0%) | 19 (100.0%) |
| Legal Services & Support | 94 (68.1%) | 44 (31.9%) |
| Education Instruction & Library | 19 (22.1%) | 67 (77.9%) |
| Arts, Media & Entertainment | 7 (35.0%) | 13 (65.0%) |
| Health Diagnosing & Treating | 37 (18.0%) | 169 (82.0%) |
| Health Technologists | 37 (18.0%) | 169 (82.0%) |
| Total (Category) | 773 (49.7%) | 782 (50.3%) |
| Total (Overall) | 1,137 (54.3%) | 956 (45.7%) |
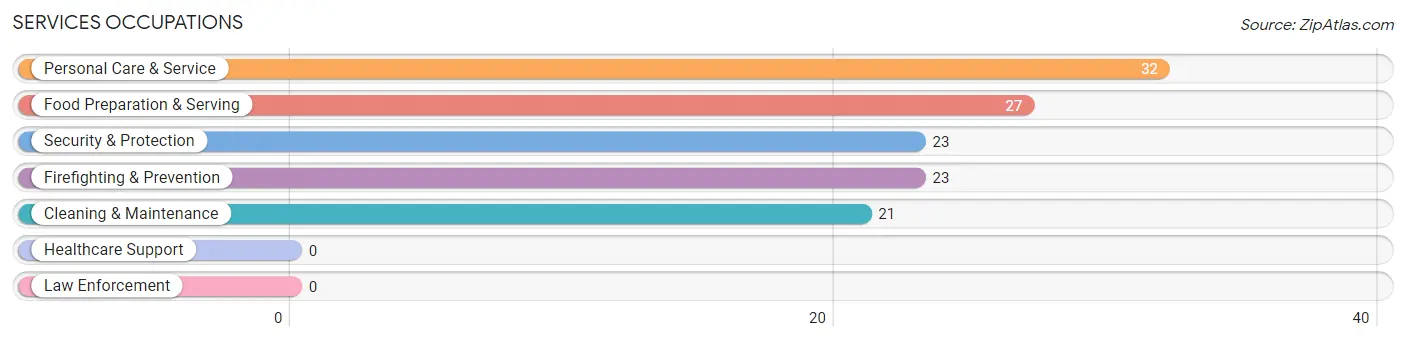
Services Occupations
The most common Services occupations in Mountain Lakes borough are Personal Care & Service (32 | 1.5%), Food Preparation & Serving (27 | 1.3%), Security & Protection (23 | 1.1%), Firefighting & Prevention (23 | 1.1%), and Cleaning & Maintenance (21 | 1.0%).
Services Occupations by Sex
Within the Services occupations in Mountain Lakes borough, the most male-oriented occupations are Food Preparation & Serving (100.0%), and Cleaning & Maintenance (100.0%), while the most female-oriented occupations are Security & Protection (100.0%), Firefighting & Prevention (100.0%), and Personal Care & Service (100.0%).
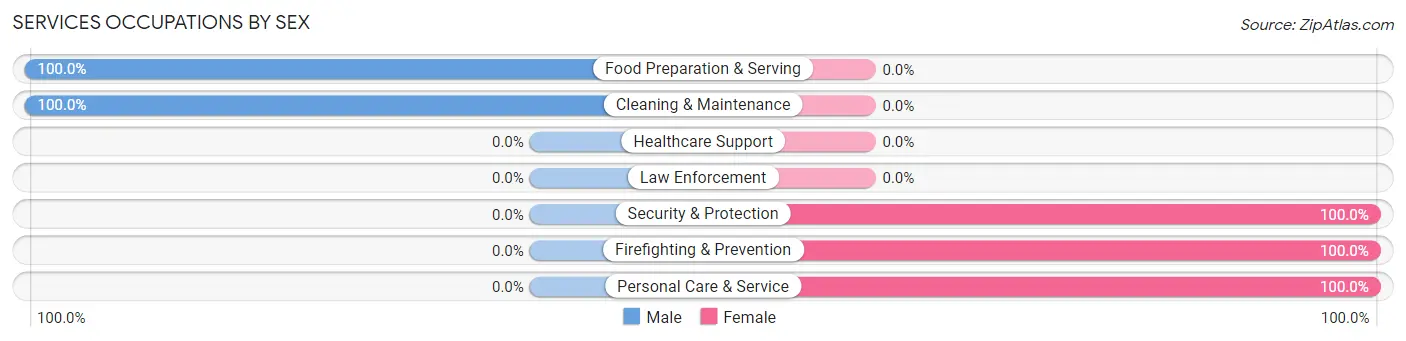
| Occupation | Male | Female |
| Healthcare Support | 0 (0.0%) | 0 (0.0%) |
| Security & Protection | 0 (0.0%) | 23 (100.0%) |
| Firefighting & Prevention | 0 (0.0%) | 23 (100.0%) |
| Law Enforcement | 0 (0.0%) | 0 (0.0%) |
| Food Preparation & Serving | 27 (100.0%) | 0 (0.0%) |
| Cleaning & Maintenance | 21 (100.0%) | 0 (0.0%) |
| Personal Care & Service | 0 (0.0%) | 32 (100.0%) |
| Total (Category) | 48 (46.6%) | 55 (53.4%) |
| Total (Overall) | 1,137 (54.3%) | 956 (45.7%) |
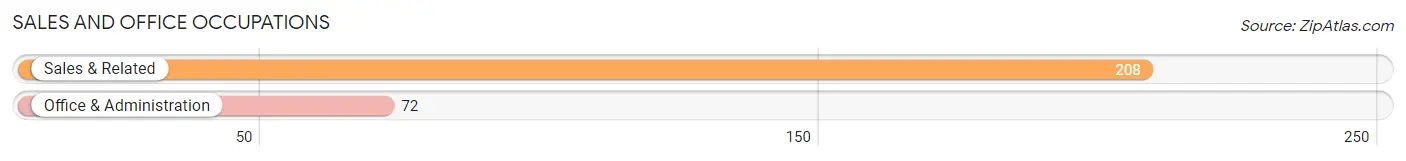
Sales and Office Occupations
The most common Sales and Office occupations in Mountain Lakes borough are Sales & Related (208 | 9.9%), and Office & Administration (72 | 3.4%).
Sales and Office Occupations by Sex
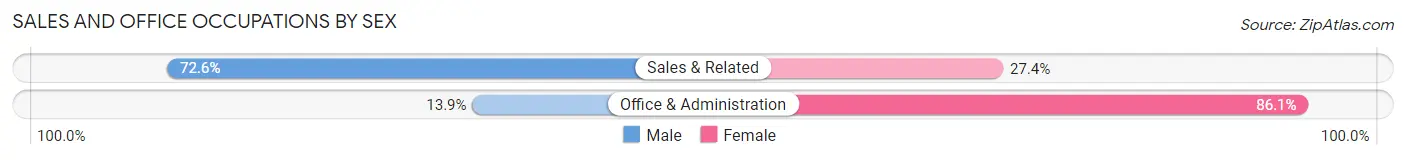
| Occupation | Male | Female |
| Sales & Related | 151 (72.6%) | 57 (27.4%) |
| Office & Administration | 10 (13.9%) | 62 (86.1%) |
| Total (Category) | 161 (57.5%) | 119 (42.5%) |
| Total (Overall) | 1,137 (54.3%) | 956 (45.7%) |
Natural Resources, Construction and Maintenance Occupations
The most common Natural Resources, Construction and Maintenance occupations in Mountain Lakes borough are Installation, Maintenance & Repair (96 | 4.6%), and Construction & Extraction (33 | 1.6%).
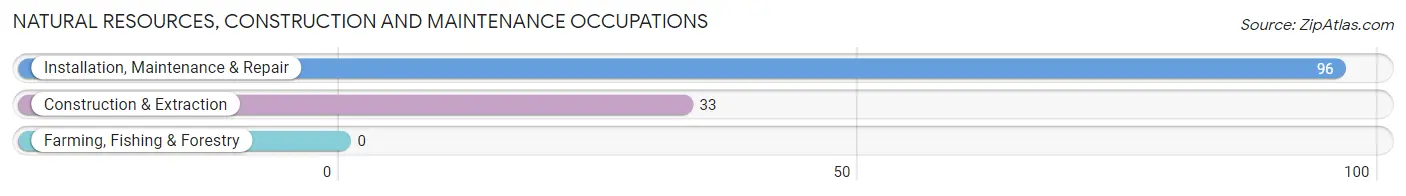
Natural Resources, Construction and Maintenance Occupations by Sex
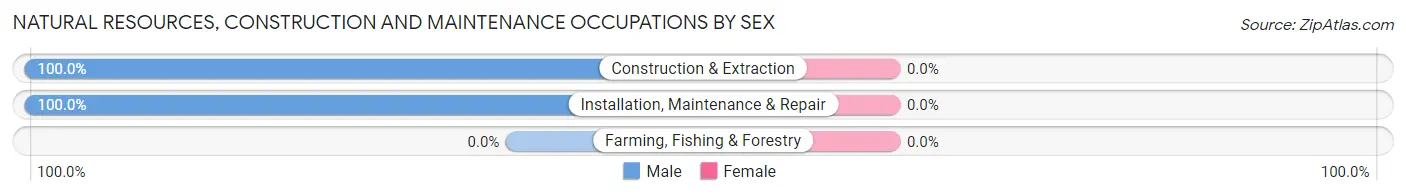
| Occupation | Male | Female |
| Farming, Fishing & Forestry | 0 (0.0%) | 0 (0.0%) |
| Construction & Extraction | 33 (100.0%) | 0 (0.0%) |
| Installation, Maintenance & Repair | 96 (100.0%) | 0 (0.0%) |
| Total (Category) | 129 (100.0%) | 0 (0.0%) |
| Total (Overall) | 1,137 (54.3%) | 956 (45.7%) |
Production, Transportation and Moving Occupations
The most common Production, Transportation and Moving occupations in Mountain Lakes borough are Production (14 | 0.7%), and Material Moving (12 | 0.6%).
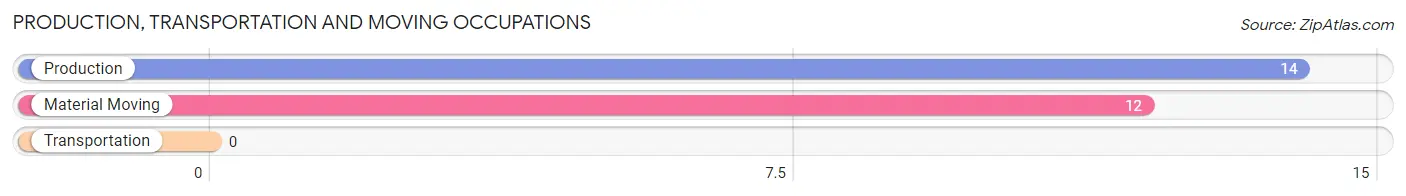
Production, Transportation and Moving Occupations by Sex
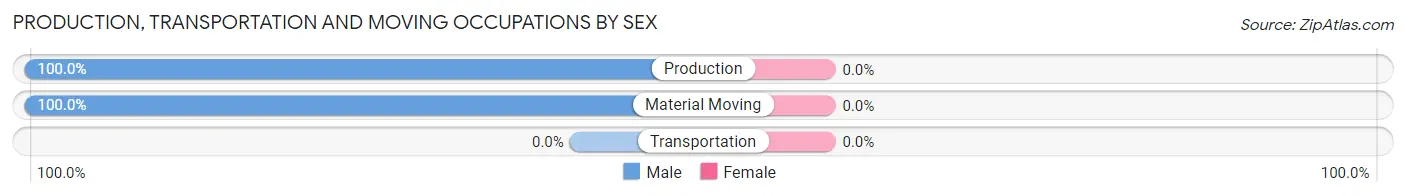
| Occupation | Male | Female |
| Production | 14 (100.0%) | 0 (0.0%) |
| Transportation | 0 (0.0%) | 0 (0.0%) |
| Material Moving | 12 (100.0%) | 0 (0.0%) |
| Total (Category) | 26 (100.0%) | 0 (0.0%) |
| Total (Overall) | 1,137 (54.3%) | 956 (45.7%) |
Employment Industries by Sex in Mountain Lakes borough
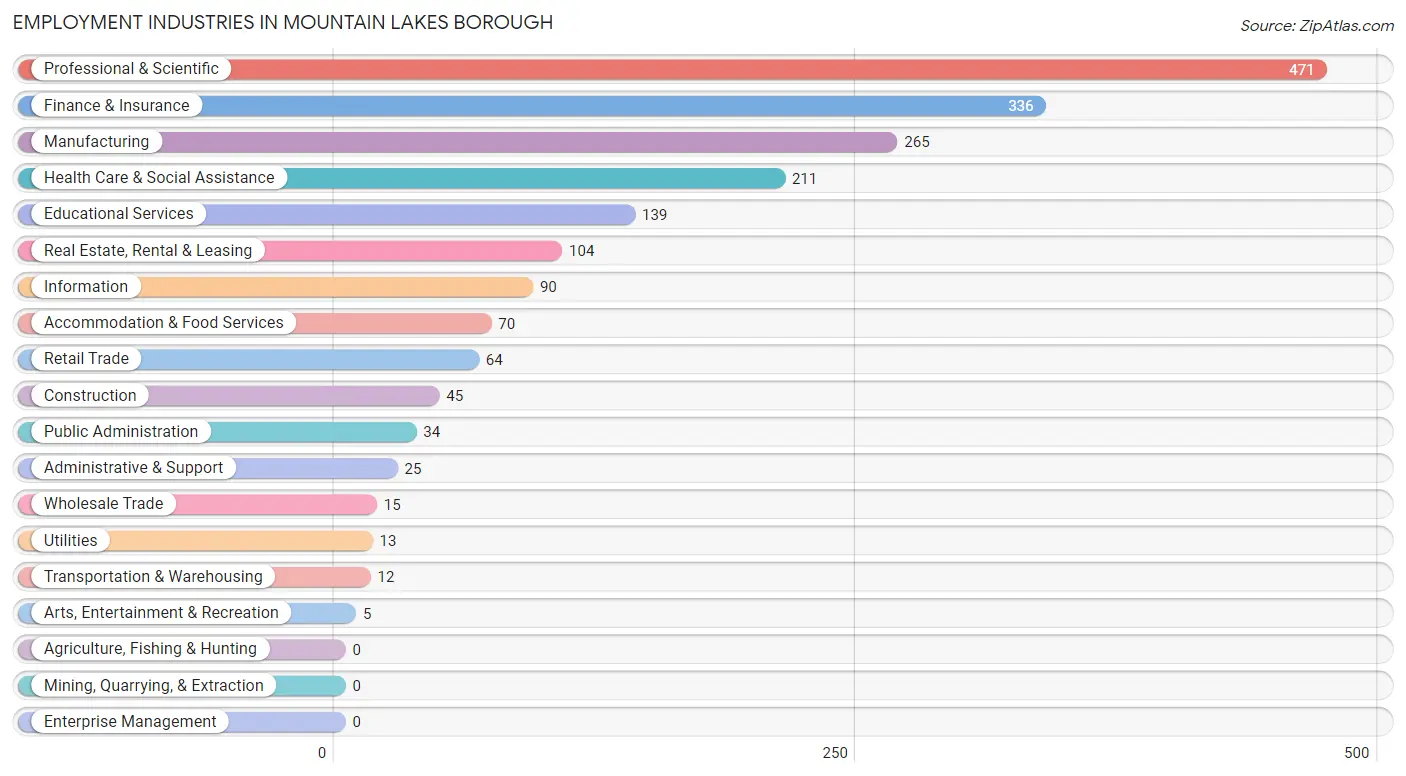
Employment Industries in Mountain Lakes borough
The major employment industries in Mountain Lakes borough include Professional & Scientific (471 | 22.5%), Finance & Insurance (336 | 16.1%), Manufacturing (265 | 12.7%), Health Care & Social Assistance (211 | 10.1%), and Educational Services (139 | 6.6%).
Employment Industries by Sex in Mountain Lakes borough
The Mountain Lakes borough industries that see more men than women are Construction (100.0%), Wholesale Trade (100.0%), and Transportation & Warehousing (100.0%), whereas the industries that tend to have a higher number of women are Administrative & Support (100.0%), Public Administration (100.0%), and Educational Services (81.3%).
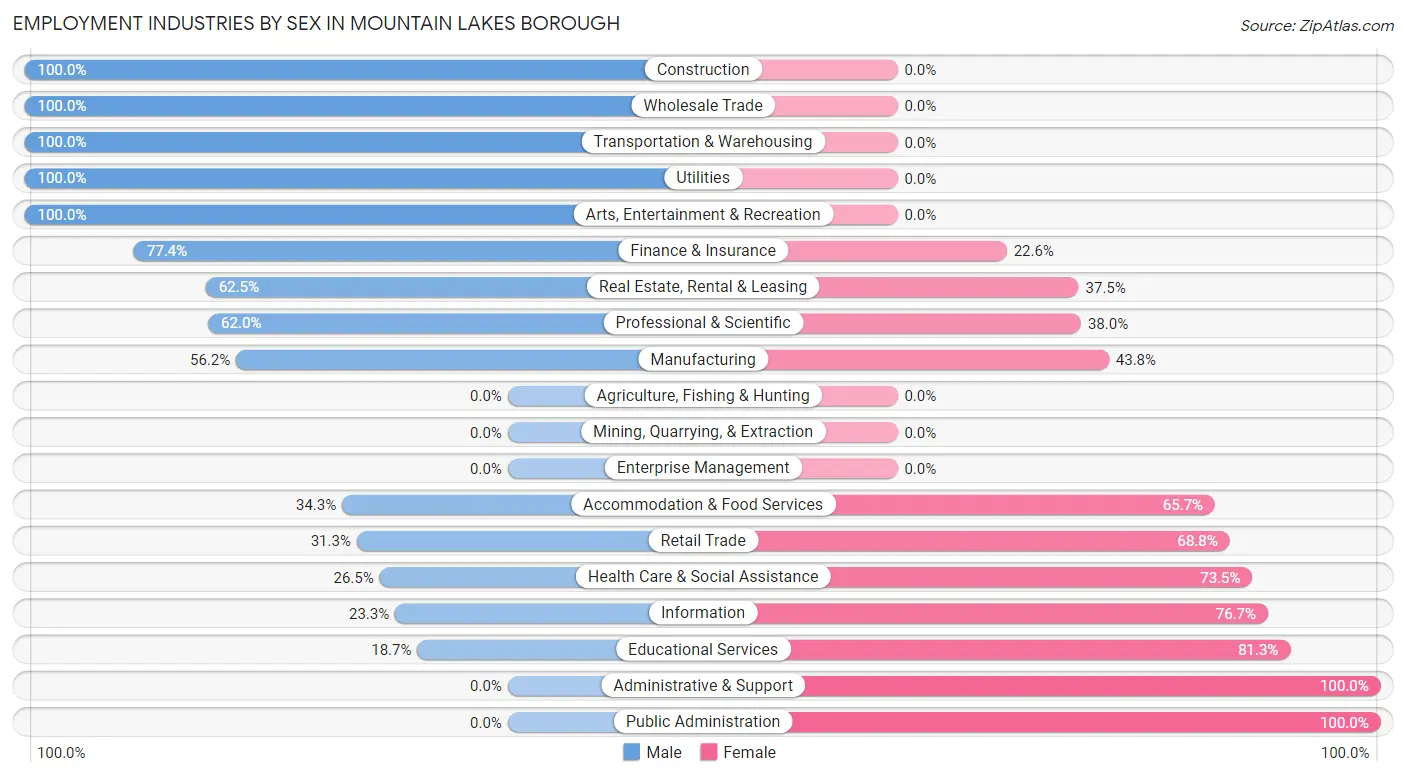
| Industry | Male | Female |
| Agriculture, Fishing & Hunting | 0 (0.0%) | 0 (0.0%) |
| Mining, Quarrying, & Extraction | 0 (0.0%) | 0 (0.0%) |
| Construction | 45 (100.0%) | 0 (0.0%) |
| Manufacturing | 149 (56.2%) | 116 (43.8%) |
| Wholesale Trade | 15 (100.0%) | 0 (0.0%) |
| Retail Trade | 20 (31.2%) | 44 (68.8%) |
| Transportation & Warehousing | 12 (100.0%) | 0 (0.0%) |
| Utilities | 13 (100.0%) | 0 (0.0%) |
| Information | 21 (23.3%) | 69 (76.7%) |
| Finance & Insurance | 260 (77.4%) | 76 (22.6%) |
| Real Estate, Rental & Leasing | 65 (62.5%) | 39 (37.5%) |
| Professional & Scientific | 292 (62.0%) | 179 (38.0%) |
| Enterprise Management | 0 (0.0%) | 0 (0.0%) |
| Administrative & Support | 0 (0.0%) | 25 (100.0%) |
| Educational Services | 26 (18.7%) | 113 (81.3%) |
| Health Care & Social Assistance | 56 (26.5%) | 155 (73.5%) |
| Arts, Entertainment & Recreation | 5 (100.0%) | 0 (0.0%) |
| Accommodation & Food Services | 24 (34.3%) | 46 (65.7%) |
| Public Administration | 0 (0.0%) | 34 (100.0%) |
| Total | 1,137 (54.3%) | 956 (45.7%) |
Education in Mountain Lakes borough
School Enrollment in Mountain Lakes borough
The most common levels of schooling among the 1,675 students in Mountain Lakes borough are middle school (509 | 30.4%), elementary school (421 | 25.1%), and high school (396 | 23.6%).
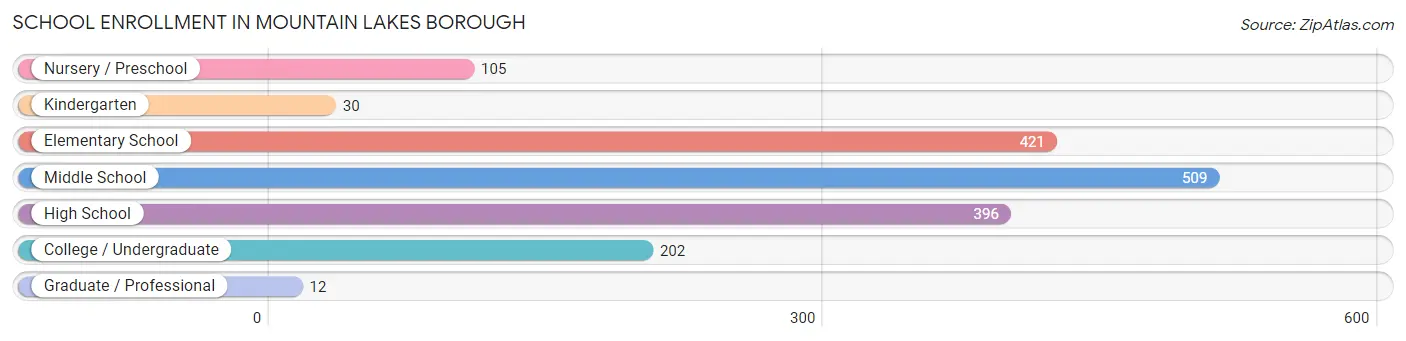
| School Level | # Students | % Students |
| Nursery / Preschool | 105 | 6.3% |
| Kindergarten | 30 | 1.8% |
| Elementary School | 421 | 25.1% |
| Middle School | 509 | 30.4% |
| High School | 396 | 23.6% |
| College / Undergraduate | 202 | 12.1% |
| Graduate / Professional | 12 | 0.7% |
| Total | 1,675 | 100.0% |
School Enrollment by Age by Funding Source in Mountain Lakes borough
Out of a total of 1,675 students who are enrolled in schools in Mountain Lakes borough, 208 (12.4%) attend a private institution, while the remaining 1,467 (87.6%) are enrolled in public schools. The age group of 3 to 4 year olds has the highest likelihood of being enrolled in private schools, with 53 (84.1% in the age bracket) enrolled. Conversely, the age group of 18 to 19 year olds has the lowest likelihood of being enrolled in a private school, with 56 (100.0% in the age bracket) attending a public institution.
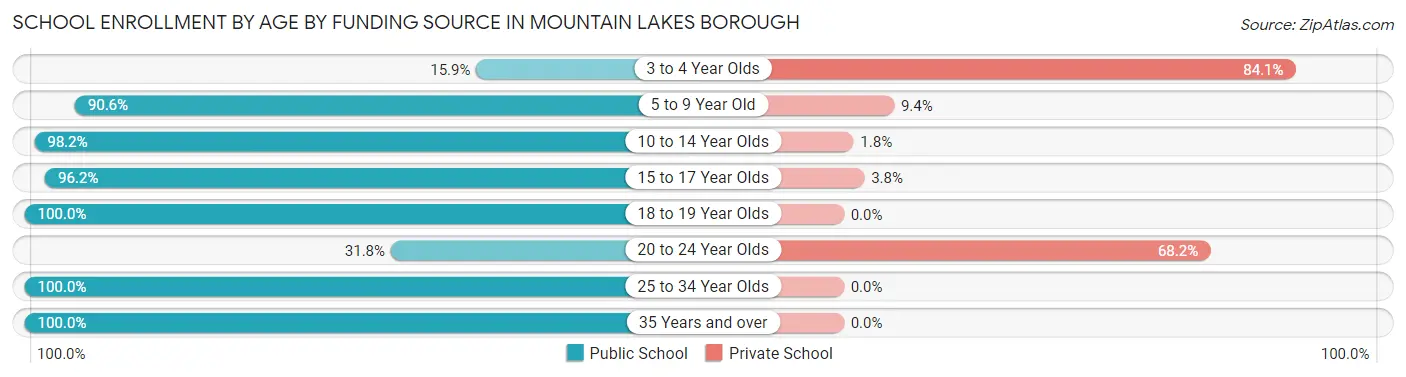
| Age Bracket | Public School | Private School |
| 3 to 4 Year Olds | 10 (15.9%) | 53 (84.1%) |
| 5 to 9 Year Old | 416 (90.6%) | 43 (9.4%) |
| 10 to 14 Year Olds | 544 (98.2%) | 10 (1.8%) |
| 15 to 17 Year Olds | 327 (96.2%) | 13 (3.8%) |
| 18 to 19 Year Olds | 56 (100.0%) | 0 (0.0%) |
| 20 to 24 Year Olds | 41 (31.8%) | 88 (68.2%) |
| 25 to 34 Year Olds | 33 (100.0%) | 0 (0.0%) |
| 35 Years and over | 41 (100.0%) | 0 (0.0%) |
| Total | 1,467 (87.6%) | 208 (12.4%) |
Educational Attainment by Field of Study in Mountain Lakes borough
Business (506 | 21.6%), social sciences (301 | 12.9%), communications (243 | 10.4%), science & technology (172 | 7.4%), and engineering (166 | 7.1%) are the most common fields of study among 2,337 individuals in Mountain Lakes borough who have obtained a bachelor's degree or higher.
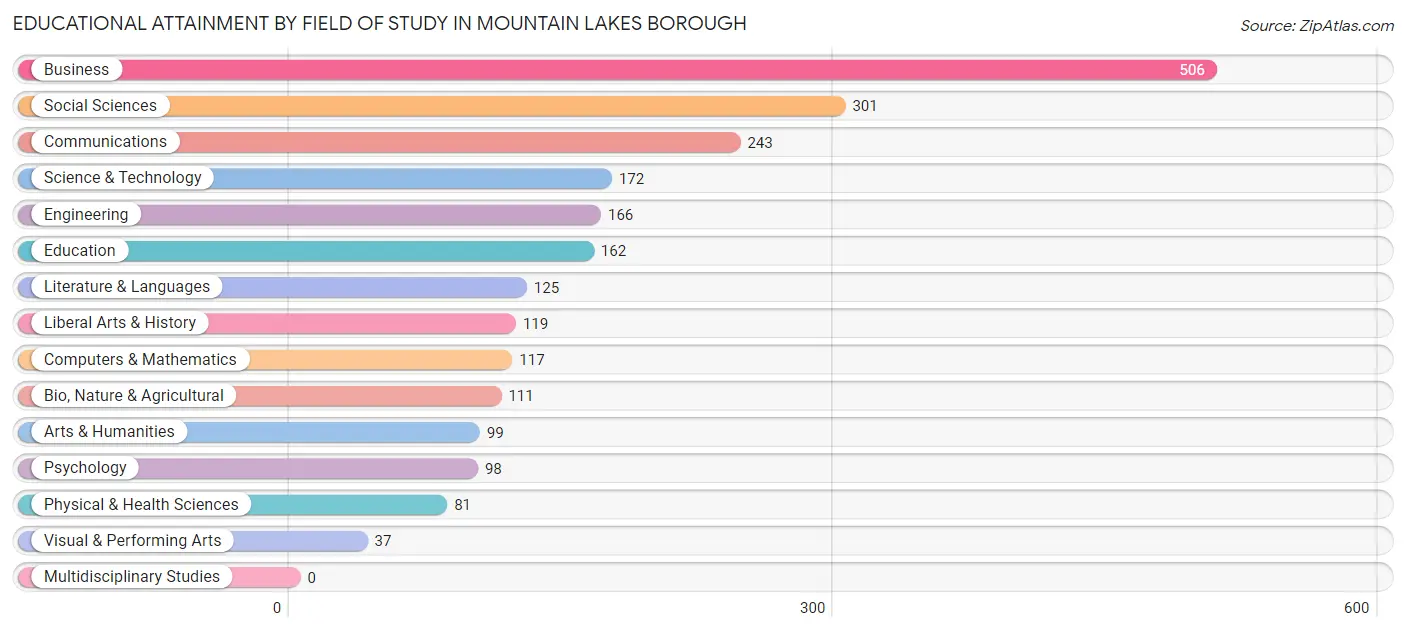
| Field of Study | # Graduates | % Graduates |
| Computers & Mathematics | 117 | 5.0% |
| Bio, Nature & Agricultural | 111 | 4.8% |
| Physical & Health Sciences | 81 | 3.5% |
| Psychology | 98 | 4.2% |
| Social Sciences | 301 | 12.9% |
| Engineering | 166 | 7.1% |
| Multidisciplinary Studies | 0 | 0.0% |
| Science & Technology | 172 | 7.4% |
| Business | 506 | 21.6% |
| Education | 162 | 6.9% |
| Literature & Languages | 125 | 5.3% |
| Liberal Arts & History | 119 | 5.1% |
| Visual & Performing Arts | 37 | 1.6% |
| Communications | 243 | 10.4% |
| Arts & Humanities | 99 | 4.2% |
| Total | 2,337 | 100.0% |
Transportation & Commute in Mountain Lakes borough
Vehicle Availability by Sex in Mountain Lakes borough
The most prevalent vehicle ownership categories in Mountain Lakes borough are males with 2 vehicles (591, accounting for 53.5%) and females with 2 vehicles (472, making up 65.1%).
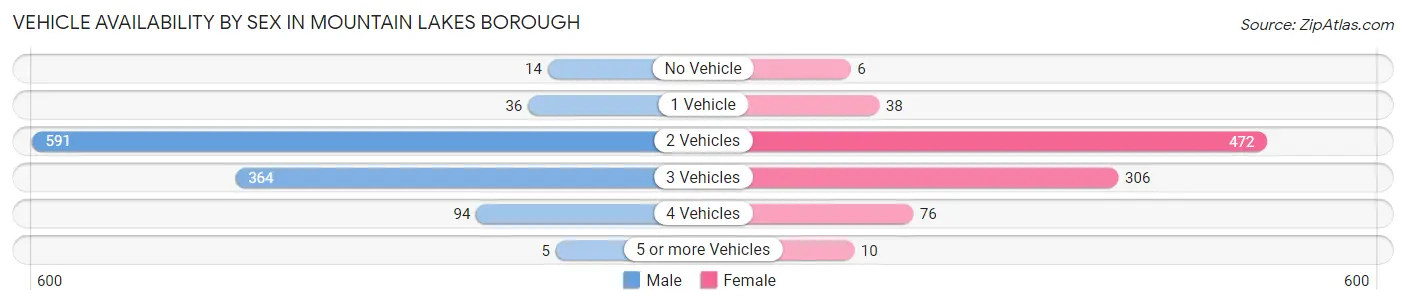
| Vehicles Available | Male | Female |
| No Vehicle | 14 (1.3%) | 6 (0.7%) |
| 1 Vehicle | 36 (3.3%) | 38 (4.2%) |
| 2 Vehicles | 591 (53.5%) | 472 (52.0%) |
| 3 Vehicles | 364 (33.0%) | 306 (33.7%) |
| 4 Vehicles | 94 (8.5%) | 76 (8.4%) |
| 5 or more Vehicles | 5 (0.4%) | 10 (1.1%) |
| Total | 1,104 (100.0%) | 908 (100.0%) |
Commute Time in Mountain Lakes borough
The most frequently occuring commute durations in Mountain Lakes borough are 5 to 9 minutes (244 commuters, 17.3%), 20 to 24 minutes (142 commuters, 10.1%), and 40 to 44 minutes (142 commuters, 10.1%).
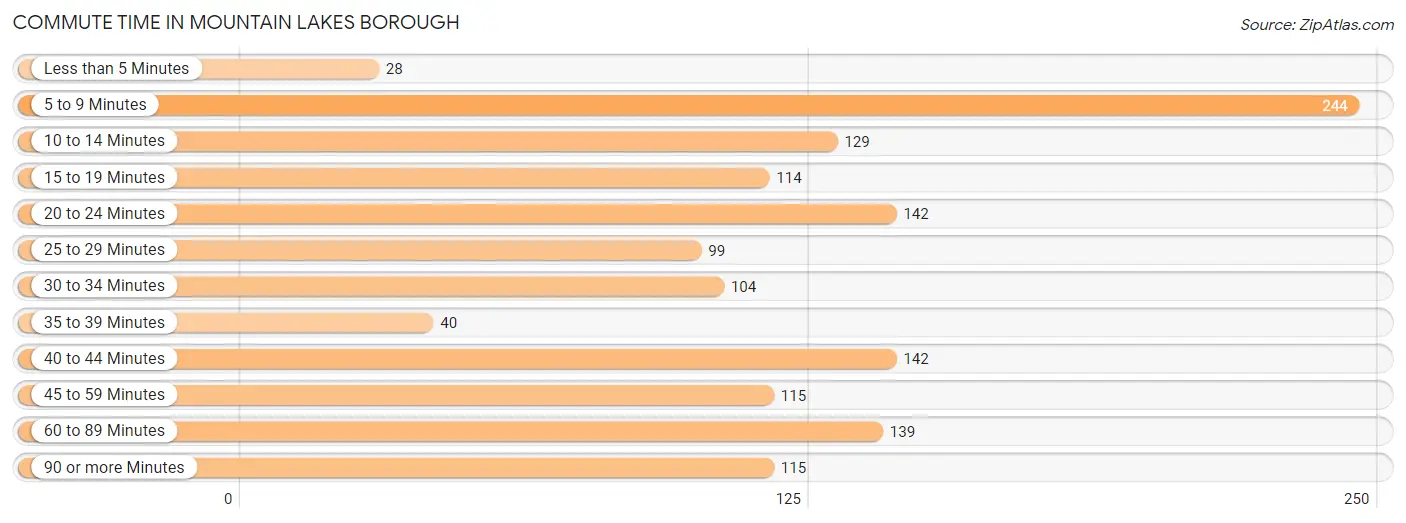
| Commute Time | # Commuters | % Commuters |
| Less than 5 Minutes | 28 | 2.0% |
| 5 to 9 Minutes | 244 | 17.3% |
| 10 to 14 Minutes | 129 | 9.1% |
| 15 to 19 Minutes | 114 | 8.1% |
| 20 to 24 Minutes | 142 | 10.1% |
| 25 to 29 Minutes | 99 | 7.0% |
| 30 to 34 Minutes | 104 | 7.4% |
| 35 to 39 Minutes | 40 | 2.8% |
| 40 to 44 Minutes | 142 | 10.1% |
| 45 to 59 Minutes | 115 | 8.2% |
| 60 to 89 Minutes | 139 | 9.9% |
| 90 or more Minutes | 115 | 8.2% |
Commute Time by Sex in Mountain Lakes borough
The most common commute times in Mountain Lakes borough are 5 to 9 minutes (152 commuters, 18.2%) for males and 5 to 9 minutes (92 commuters, 15.9%) for females.
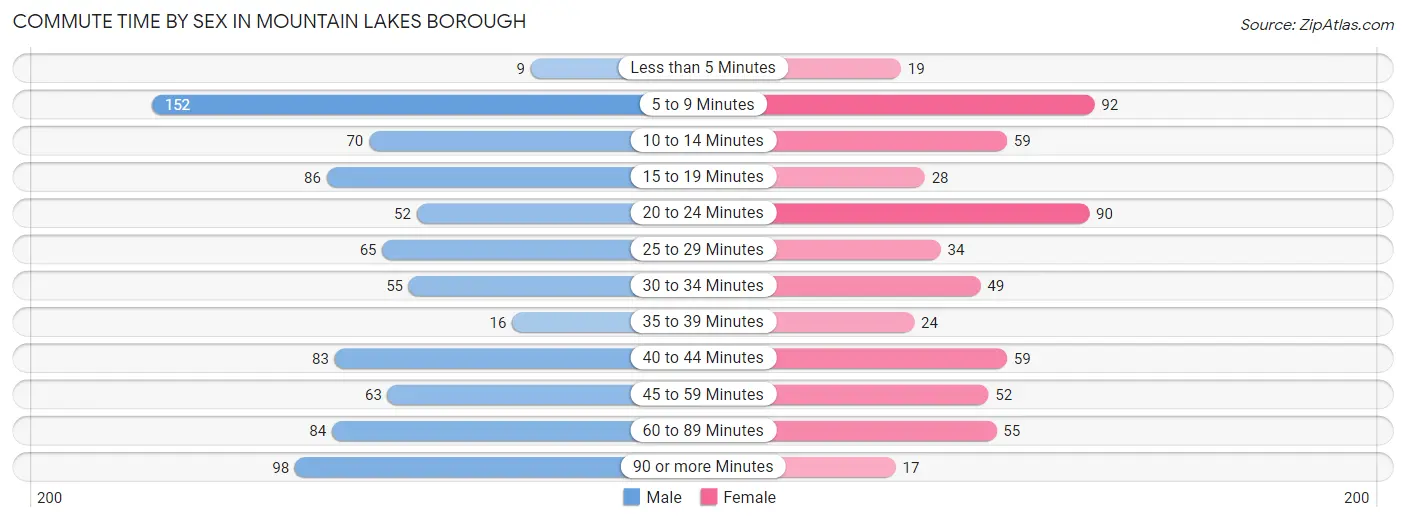
| Commute Time | Male | Female |
| Less than 5 Minutes | 9 (1.1%) | 19 (3.3%) |
| 5 to 9 Minutes | 152 (18.2%) | 92 (15.9%) |
| 10 to 14 Minutes | 70 (8.4%) | 59 (10.2%) |
| 15 to 19 Minutes | 86 (10.3%) | 28 (4.8%) |
| 20 to 24 Minutes | 52 (6.2%) | 90 (15.6%) |
| 25 to 29 Minutes | 65 (7.8%) | 34 (5.9%) |
| 30 to 34 Minutes | 55 (6.6%) | 49 (8.5%) |
| 35 to 39 Minutes | 16 (1.9%) | 24 (4.2%) |
| 40 to 44 Minutes | 83 (10.0%) | 59 (10.2%) |
| 45 to 59 Minutes | 63 (7.6%) | 52 (9.0%) |
| 60 to 89 Minutes | 84 (10.1%) | 55 (9.5%) |
| 90 or more Minutes | 98 (11.8%) | 17 (2.9%) |
Time of Departure to Work by Sex in Mountain Lakes borough
The most frequent times of departure to work in Mountain Lakes borough are 7:30 AM to 7:59 AM (152, 18.2%) for males and 8:00 AM to 8:29 AM (101, 17.5%) for females.
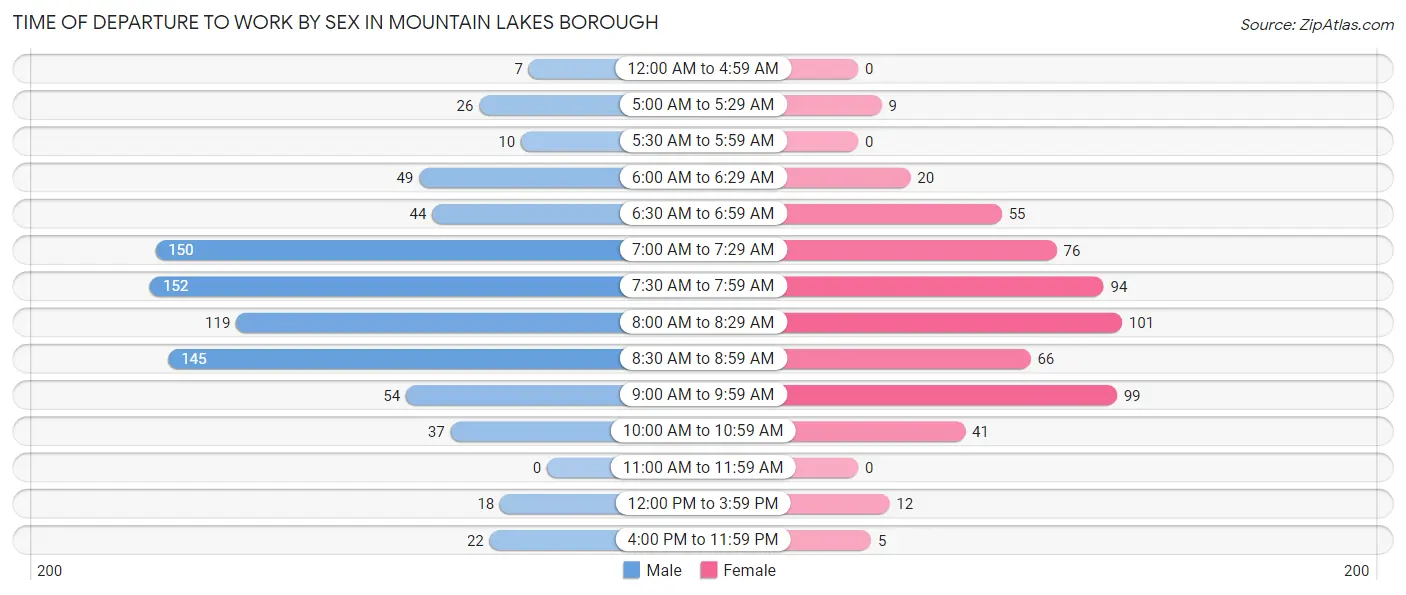
| Time of Departure | Male | Female |
| 12:00 AM to 4:59 AM | 7 (0.8%) | 0 (0.0%) |
| 5:00 AM to 5:29 AM | 26 (3.1%) | 9 (1.6%) |
| 5:30 AM to 5:59 AM | 10 (1.2%) | 0 (0.0%) |
| 6:00 AM to 6:29 AM | 49 (5.9%) | 20 (3.5%) |
| 6:30 AM to 6:59 AM | 44 (5.3%) | 55 (9.5%) |
| 7:00 AM to 7:29 AM | 150 (18.0%) | 76 (13.2%) |
| 7:30 AM to 7:59 AM | 152 (18.2%) | 94 (16.3%) |
| 8:00 AM to 8:29 AM | 119 (14.3%) | 101 (17.5%) |
| 8:30 AM to 8:59 AM | 145 (17.4%) | 66 (11.4%) |
| 9:00 AM to 9:59 AM | 54 (6.5%) | 99 (17.1%) |
| 10:00 AM to 10:59 AM | 37 (4.4%) | 41 (7.1%) |
| 11:00 AM to 11:59 AM | 0 (0.0%) | 0 (0.0%) |
| 12:00 PM to 3:59 PM | 18 (2.2%) | 12 (2.1%) |
| 4:00 PM to 11:59 PM | 22 (2.6%) | 5 (0.9%) |
| Total | 833 (100.0%) | 578 (100.0%) |
Housing Occupancy in Mountain Lakes borough
Occupancy by Ownership in Mountain Lakes borough
Of the total 1,430 dwellings in Mountain Lakes borough, owner-occupied units account for 1,376 (96.2%), while renter-occupied units make up 54 (3.8%).
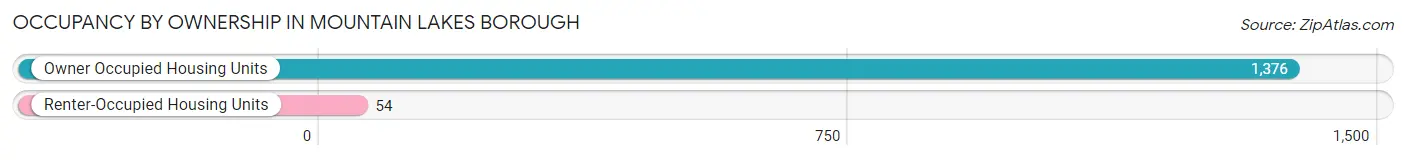
| Occupancy | # Housing Units | % Housing Units |
| Owner Occupied Housing Units | 1,376 | 96.2% |
| Renter-Occupied Housing Units | 54 | 3.8% |
| Total Occupied Housing Units | 1,430 | 100.0% |
Occupancy by Household Size in Mountain Lakes borough
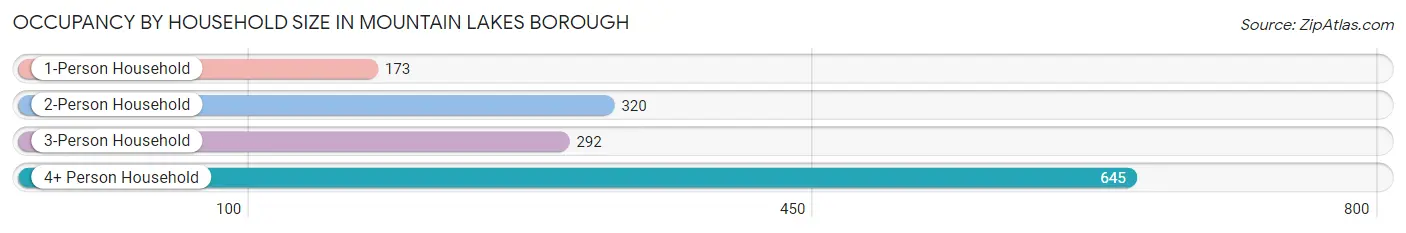
| Household Size | # Housing Units | % Housing Units |
| 1-Person Household | 173 | 12.1% |
| 2-Person Household | 320 | 22.4% |
| 3-Person Household | 292 | 20.4% |
| 4+ Person Household | 645 | 45.1% |
| Total Housing Units | 1,430 | 100.0% |
Occupancy by Ownership by Household Size in Mountain Lakes borough
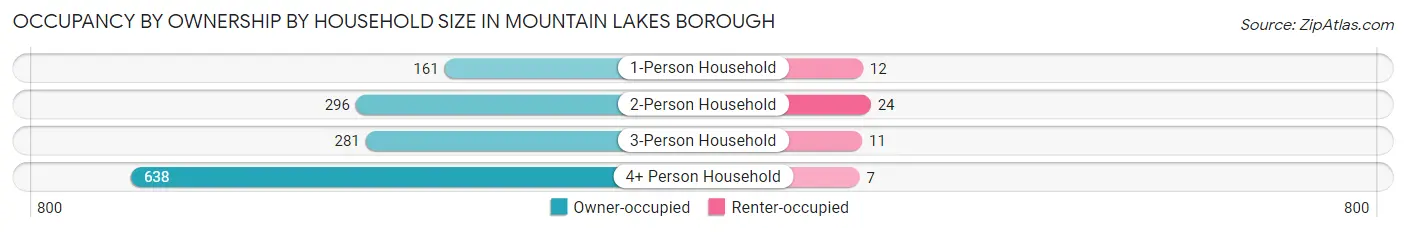
| Household Size | Owner-occupied | Renter-occupied |
| 1-Person Household | 161 (93.1%) | 12 (6.9%) |
| 2-Person Household | 296 (92.5%) | 24 (7.5%) |
| 3-Person Household | 281 (96.2%) | 11 (3.8%) |
| 4+ Person Household | 638 (98.9%) | 7 (1.1%) |
| Total Housing Units | 1,376 (96.2%) | 54 (3.8%) |
Occupancy by Educational Attainment in Mountain Lakes borough
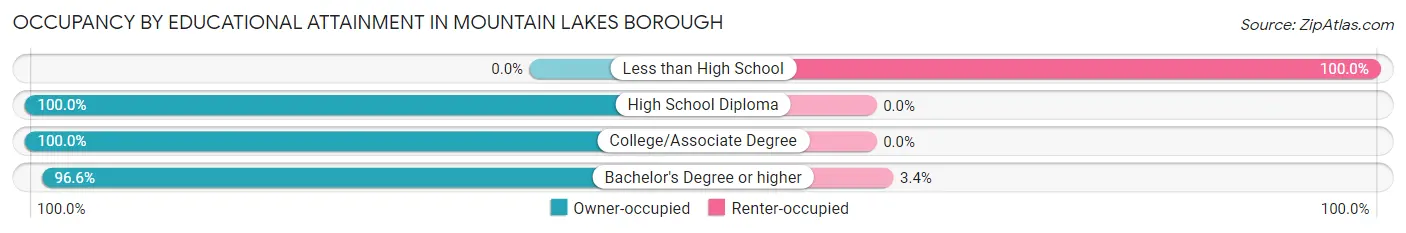
| Household Size | Owner-occupied | Renter-occupied |
| Less than High School | 0 (0.0%) | 12 (100.0%) |
| High School Diploma | 69 (100.0%) | 0 (0.0%) |
| College/Associate Degree | 98 (100.0%) | 0 (0.0%) |
| Bachelor's Degree or higher | 1,209 (96.6%) | 42 (3.4%) |
Occupancy by Age of Householder in Mountain Lakes borough
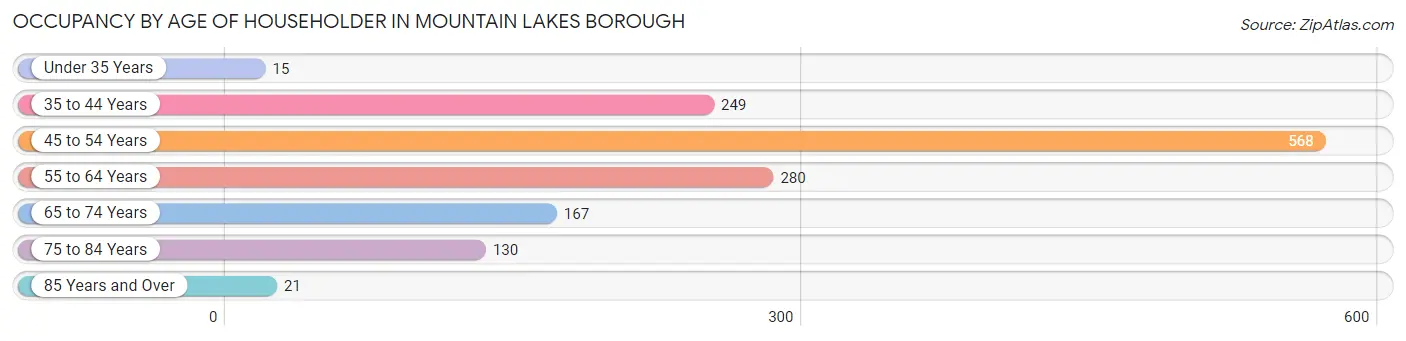
| Age Bracket | # Households | % Households |
| Under 35 Years | 15 | 1.1% |
| 35 to 44 Years | 249 | 17.4% |
| 45 to 54 Years | 568 | 39.7% |
| 55 to 64 Years | 280 | 19.6% |
| 65 to 74 Years | 167 | 11.7% |
| 75 to 84 Years | 130 | 9.1% |
| 85 Years and Over | 21 | 1.5% |
| Total | 1,430 | 100.0% |
Housing Finances in Mountain Lakes borough
Median Income by Occupancy in Mountain Lakes borough
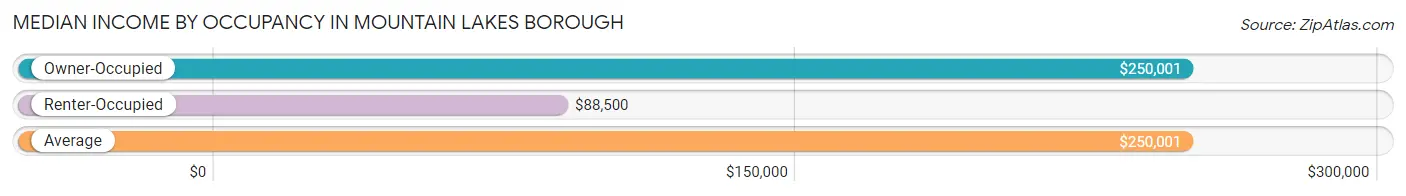
| Occupancy Type | # Households | Median Income |
| Owner-Occupied | 1,376 (96.2%) | $250,001 |
| Renter-Occupied | 54 (3.8%) | $88,500 |
| Average | 1,430 (100.0%) | $250,001 |
Occupancy by Householder Income Bracket in Mountain Lakes borough
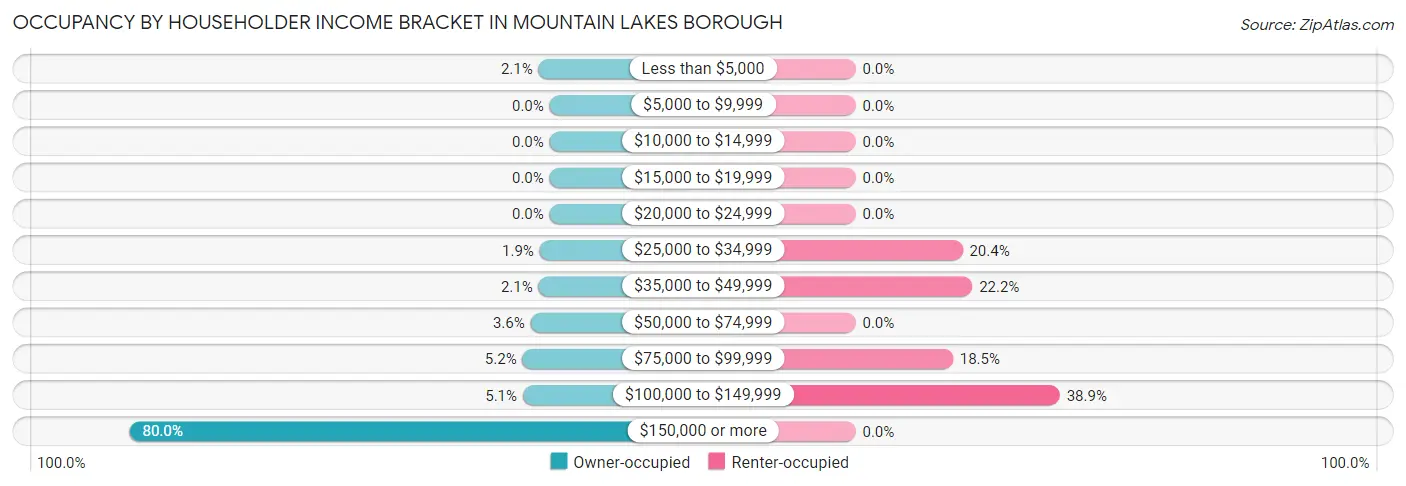
| Income Bracket | Owner-occupied | Renter-occupied |
| Less than $5,000 | 29 (2.1%) | 0 (0.0%) |
| $5,000 to $9,999 | 0 (0.0%) | 0 (0.0%) |
| $10,000 to $14,999 | 0 (0.0%) | 0 (0.0%) |
| $15,000 to $19,999 | 0 (0.0%) | 0 (0.0%) |
| $20,000 to $24,999 | 0 (0.0%) | 0 (0.0%) |
| $25,000 to $34,999 | 26 (1.9%) | 11 (20.4%) |
| $35,000 to $49,999 | 29 (2.1%) | 12 (22.2%) |
| $50,000 to $74,999 | 50 (3.6%) | 0 (0.0%) |
| $75,000 to $99,999 | 71 (5.2%) | 10 (18.5%) |
| $100,000 to $149,999 | 70 (5.1%) | 21 (38.9%) |
| $150,000 or more | 1,101 (80.0%) | 0 (0.0%) |
| Total | 1,376 (100.0%) | 54 (100.0%) |
Monthly Housing Cost Tiers in Mountain Lakes borough
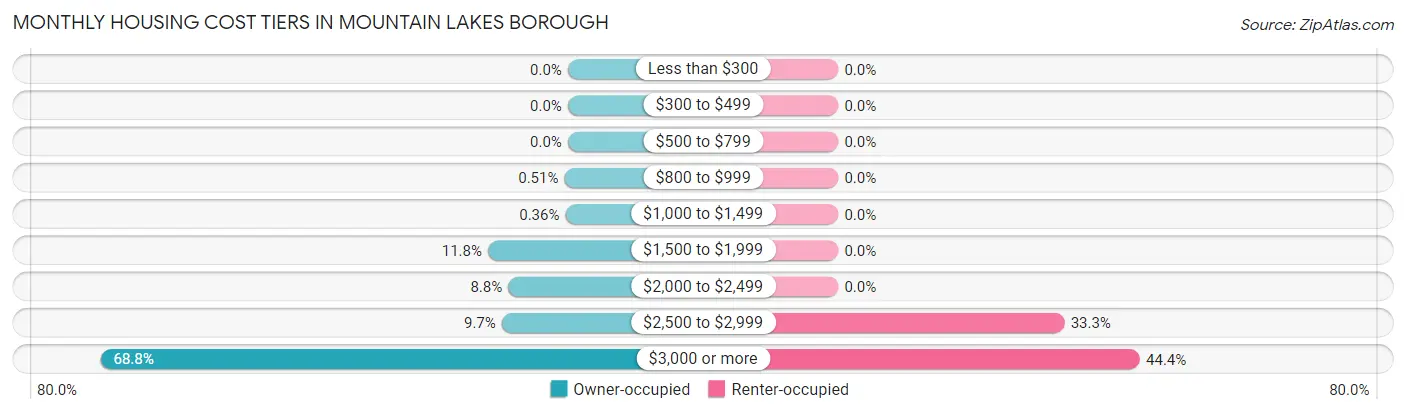
| Monthly Cost | Owner-occupied | Renter-occupied |
| Less than $300 | 0 (0.0%) | 0 (0.0%) |
| $300 to $499 | 0 (0.0%) | 0 (0.0%) |
| $500 to $799 | 0 (0.0%) | 0 (0.0%) |
| $800 to $999 | 7 (0.5%) | 0 (0.0%) |
| $1,000 to $1,499 | 5 (0.4%) | 0 (0.0%) |
| $1,500 to $1,999 | 162 (11.8%) | 0 (0.0%) |
| $2,000 to $2,499 | 121 (8.8%) | 0 (0.0%) |
| $2,500 to $2,999 | 134 (9.7%) | 18 (33.3%) |
| $3,000 or more | 947 (68.8%) | 24 (44.4%) |
| Total | 1,376 (100.0%) | 54 (100.0%) |
Physical Housing Characteristics in Mountain Lakes borough
Housing Structures in Mountain Lakes borough
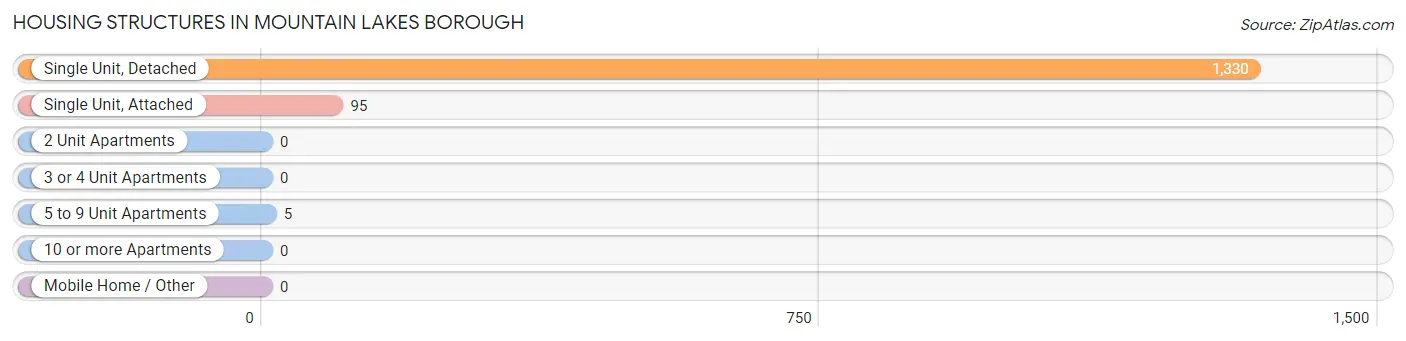
| Structure Type | # Housing Units | % Housing Units |
| Single Unit, Detached | 1,330 | 93.0% |
| Single Unit, Attached | 95 | 6.6% |
| 2 Unit Apartments | 0 | 0.0% |
| 3 or 4 Unit Apartments | 0 | 0.0% |
| 5 to 9 Unit Apartments | 5 | 0.4% |
| 10 or more Apartments | 0 | 0.0% |
| Mobile Home / Other | 0 | 0.0% |
| Total | 1,430 | 100.0% |
Housing Structures by Occupancy in Mountain Lakes borough
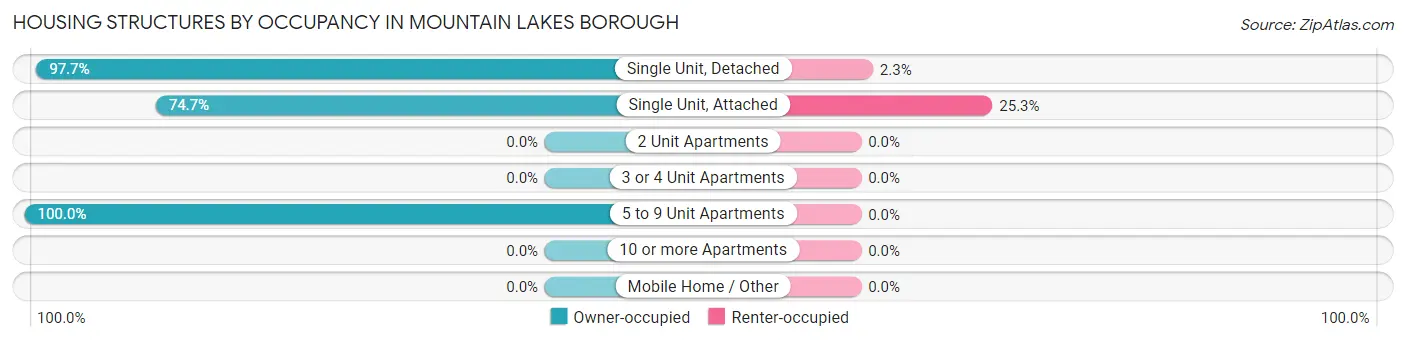
| Structure Type | Owner-occupied | Renter-occupied |
| Single Unit, Detached | 1,300 (97.7%) | 30 (2.3%) |
| Single Unit, Attached | 71 (74.7%) | 24 (25.3%) |
| 2 Unit Apartments | 0 (0.0%) | 0 (0.0%) |
| 3 or 4 Unit Apartments | 0 (0.0%) | 0 (0.0%) |
| 5 to 9 Unit Apartments | 5 (100.0%) | 0 (0.0%) |
| 10 or more Apartments | 0 (0.0%) | 0 (0.0%) |
| Mobile Home / Other | 0 (0.0%) | 0 (0.0%) |
| Total | 1,376 (96.2%) | 54 (3.8%) |
Housing Structures by Number of Rooms in Mountain Lakes borough
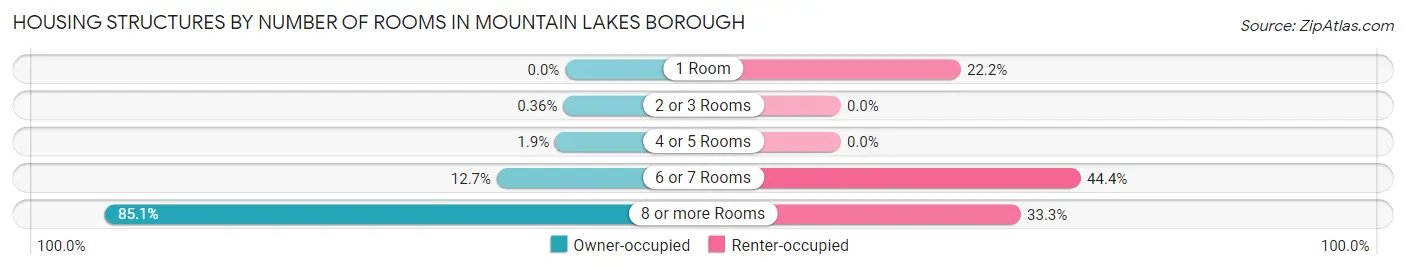
| Number of Rooms | Owner-occupied | Renter-occupied |
| 1 Room | 0 (0.0%) | 12 (22.2%) |
| 2 or 3 Rooms | 5 (0.4%) | 0 (0.0%) |
| 4 or 5 Rooms | 26 (1.9%) | 0 (0.0%) |
| 6 or 7 Rooms | 174 (12.7%) | 24 (44.4%) |
| 8 or more Rooms | 1,171 (85.1%) | 18 (33.3%) |
| Total | 1,376 (100.0%) | 54 (100.0%) |
Housing Structure by Heating Type in Mountain Lakes borough
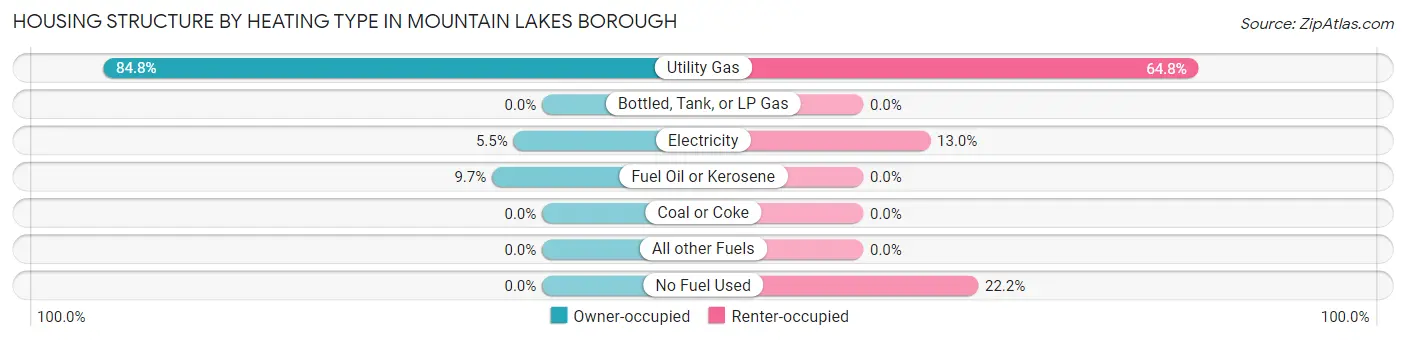
| Heating Type | Owner-occupied | Renter-occupied |
| Utility Gas | 1,167 (84.8%) | 35 (64.8%) |
| Bottled, Tank, or LP Gas | 0 (0.0%) | 0 (0.0%) |
| Electricity | 76 (5.5%) | 7 (13.0%) |
| Fuel Oil or Kerosene | 133 (9.7%) | 0 (0.0%) |
| Coal or Coke | 0 (0.0%) | 0 (0.0%) |
| All other Fuels | 0 (0.0%) | 0 (0.0%) |
| No Fuel Used | 0 (0.0%) | 12 (22.2%) |
| Total | 1,376 (100.0%) | 54 (100.0%) |
Household Vehicle Usage in Mountain Lakes borough
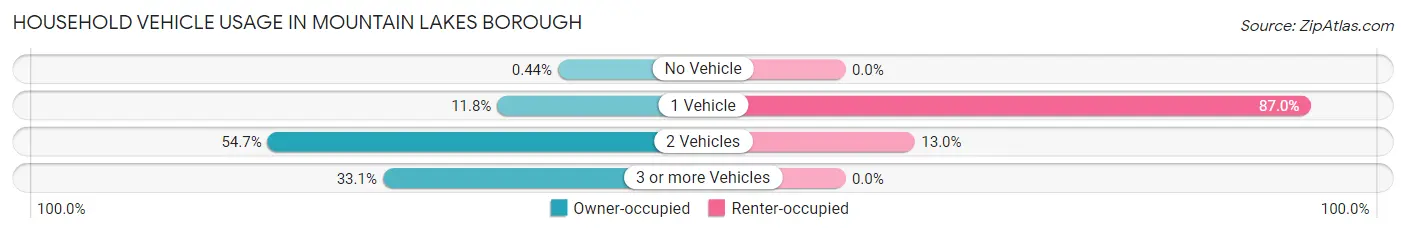
| Vehicles per Household | Owner-occupied | Renter-occupied |
| No Vehicle | 6 (0.4%) | 0 (0.0%) |
| 1 Vehicle | 162 (11.8%) | 47 (87.0%) |
| 2 Vehicles | 752 (54.6%) | 7 (13.0%) |
| 3 or more Vehicles | 456 (33.1%) | 0 (0.0%) |
| Total | 1,376 (100.0%) | 54 (100.0%) |
Real Estate & Mortgages in Mountain Lakes borough
Real Estate and Mortgage Overview in Mountain Lakes borough
| Characteristic | Without Mortgage | With Mortgage |
| Housing Units | 450 | 926 |
| Median Property Value | $948,100 | $829,700 |
| Median Household Income | $250,001 | $783 |
| Monthly Housing Costs | $1,501 | $836 |
| Real Estate Taxes | $10,001 | $0 |
Property Value by Mortgage Status in Mountain Lakes borough
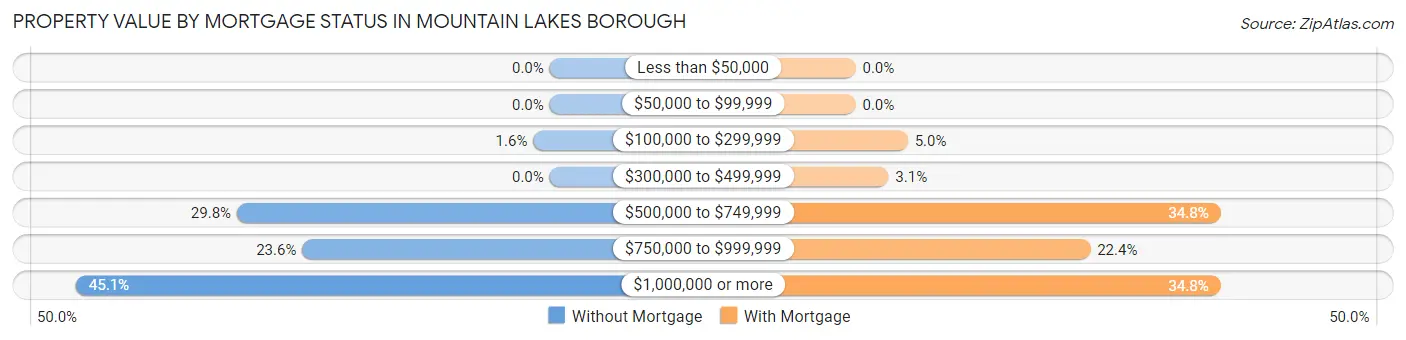
| Property Value | Without Mortgage | With Mortgage |
| Less than $50,000 | 0 (0.0%) | 0 (0.0%) |
| $50,000 to $99,999 | 0 (0.0%) | 0 (0.0%) |
| $100,000 to $299,999 | 7 (1.6%) | 46 (5.0%) |
| $300,000 to $499,999 | 0 (0.0%) | 29 (3.1%) |
| $500,000 to $749,999 | 134 (29.8%) | 322 (34.8%) |
| $750,000 to $999,999 | 106 (23.6%) | 207 (22.4%) |
| $1,000,000 or more | 203 (45.1%) | 322 (34.8%) |
| Total | 450 (100.0%) | 926 (100.0%) |
Household Income by Mortgage Status in Mountain Lakes borough
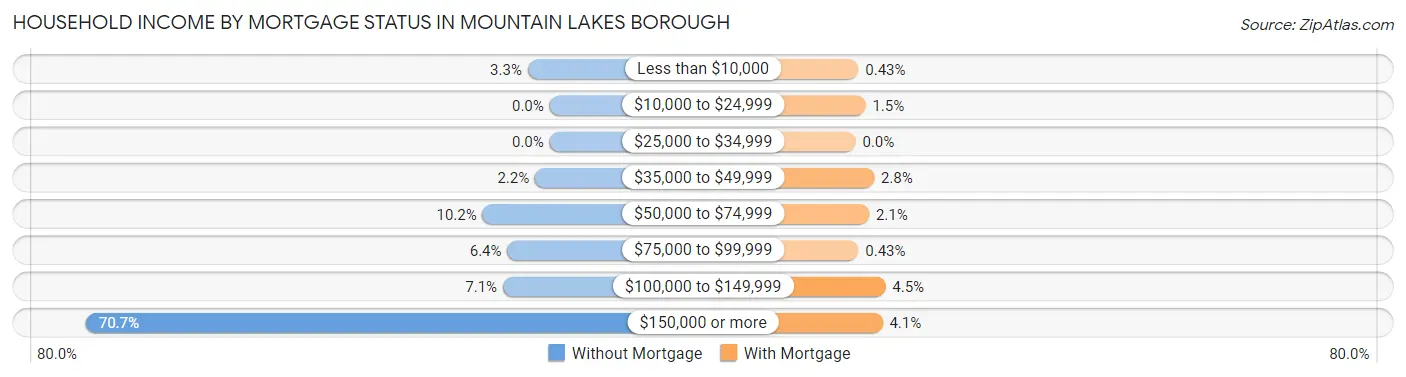
| Household Income | Without Mortgage | With Mortgage |
| Less than $10,000 | 15 (3.3%) | 4 (0.4%) |
| $10,000 to $24,999 | 0 (0.0%) | 14 (1.5%) |
| $25,000 to $34,999 | 0 (0.0%) | 0 (0.0%) |
| $35,000 to $49,999 | 10 (2.2%) | 26 (2.8%) |
| $50,000 to $74,999 | 46 (10.2%) | 19 (2.1%) |
| $75,000 to $99,999 | 29 (6.4%) | 4 (0.4%) |
| $100,000 to $149,999 | 32 (7.1%) | 42 (4.5%) |
| $150,000 or more | 318 (70.7%) | 38 (4.1%) |
| Total | 450 (100.0%) | 926 (100.0%) |
Property Value to Household Income Ratio in Mountain Lakes borough
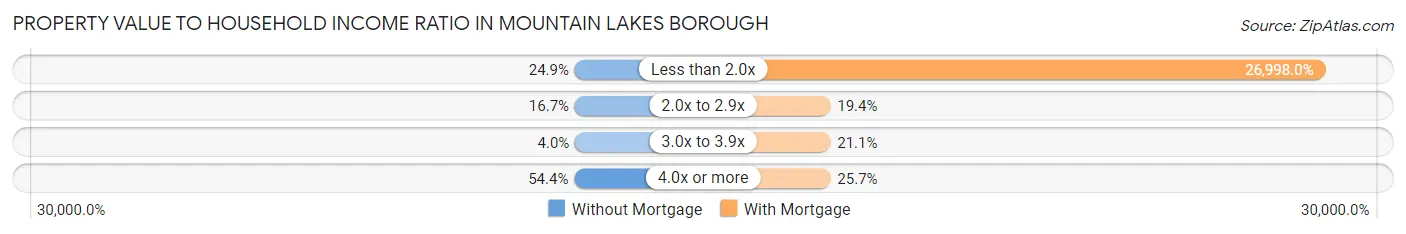
| Value-to-Income Ratio | Without Mortgage | With Mortgage |
| Less than 2.0x | 112 (24.9%) | 250,001 (26,997.9%) |
| 2.0x to 2.9x | 75 (16.7%) | 180 (19.4%) |
| 3.0x to 3.9x | 18 (4.0%) | 195 (21.1%) |
| 4.0x or more | 245 (54.4%) | 238 (25.7%) |
| Total | 450 (100.0%) | 926 (100.0%) |
Real Estate Taxes by Mortgage Status in Mountain Lakes borough
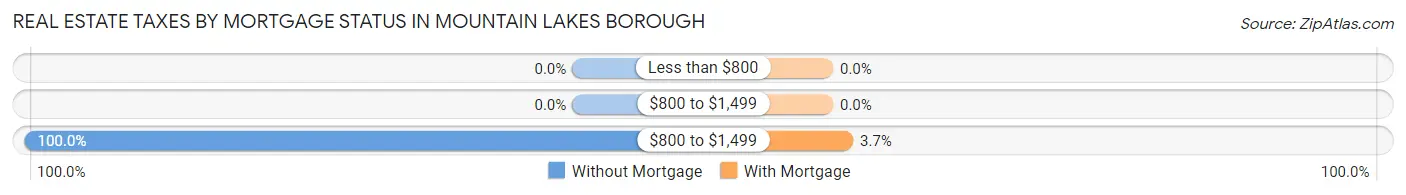
| Property Taxes | Without Mortgage | With Mortgage |
| Less than $800 | 0 (0.0%) | 0 (0.0%) |
| $800 to $1,499 | 0 (0.0%) | 0 (0.0%) |
| $800 to $1,499 | 450 (100.0%) | 34 (3.7%) |
| Total | 450 (100.0%) | 926 (100.0%) |
Health & Disability in Mountain Lakes borough
Health Insurance Coverage by Age in Mountain Lakes borough
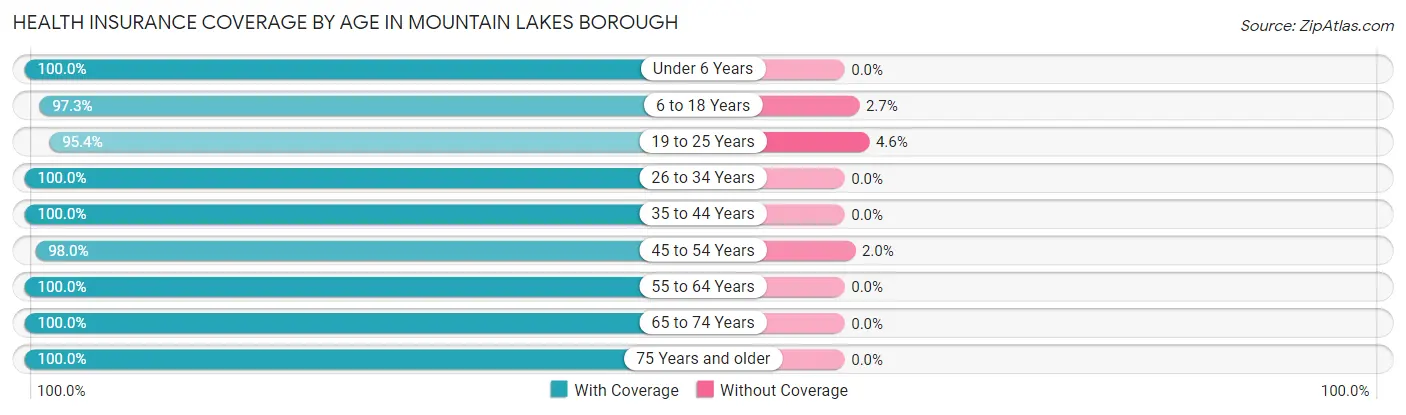
| Age Bracket | With Coverage | Without Coverage |
| Under 6 Years | 214 (100.0%) | 0 (0.0%) |
| 6 to 18 Years | 1,319 (97.3%) | 37 (2.7%) |
| 19 to 25 Years | 249 (95.4%) | 12 (4.6%) |
| 26 to 34 Years | 79 (100.0%) | 0 (0.0%) |
| 35 to 44 Years | 490 (100.0%) | 0 (0.0%) |
| 45 to 54 Years | 1,032 (98.0%) | 21 (2.0%) |
| 55 to 64 Years | 544 (100.0%) | 0 (0.0%) |
| 65 to 74 Years | 296 (100.0%) | 0 (0.0%) |
| 75 Years and older | 206 (100.0%) | 0 (0.0%) |
| Total | 4,429 (98.4%) | 70 (1.6%) |
Health Insurance Coverage by Citizenship Status in Mountain Lakes borough
| Citizenship Status | With Coverage | Without Coverage |
| Native Born | 214 (100.0%) | 0 (0.0%) |
| Foreign Born, Citizen | 1,319 (97.3%) | 37 (2.7%) |
| Foreign Born, not a Citizen | 249 (95.4%) | 12 (4.6%) |
Health Insurance Coverage by Household Income in Mountain Lakes borough
| Household Income | With Coverage | Without Coverage |
| Under $25,000 | 29 (100.0%) | 0 (0.0%) |
| $25,000 to $49,999 | 193 (92.8%) | 15 (7.2%) |
| $50,000 to $74,999 | 90 (100.0%) | 0 (0.0%) |
| $75,000 to $99,999 | 214 (100.0%) | 0 (0.0%) |
| $100,000 and over | 3,903 (98.6%) | 55 (1.4%) |
Public vs Private Health Insurance Coverage by Age in Mountain Lakes borough
| Age Bracket | Public Insurance | Private Insurance |
| Under 6 | 0 (0.0%) | 214 (100.0%) |
| 6 to 18 Years | 20 (1.5%) | 1,316 (97.1%) |
| 19 to 25 Years | 0 (0.0%) | 249 (95.4%) |
| 25 to 34 Years | 0 (0.0%) | 79 (100.0%) |
| 35 to 44 Years | 0 (0.0%) | 490 (100.0%) |
| 45 to 54 Years | 0 (0.0%) | 1,032 (98.0%) |
| 55 to 64 Years | 10 (1.8%) | 534 (98.2%) |
| 65 to 74 Years | 284 (96.0%) | 167 (56.4%) |
| 75 Years and over | 206 (100.0%) | 144 (69.9%) |
| Total | 520 (11.6%) | 4,225 (93.9%) |
Disability Status by Sex by Age in Mountain Lakes borough
| Age Bracket | Male | Female |
| Under 5 Years | 0 (0.0%) | 0 (0.0%) |
| 5 to 17 Years | 38 (4.3%) | 0 (0.0%) |
| 18 to 34 Years | 13 (7.5%) | 0 (0.0%) |
| 35 to 64 Years | 25 (2.5%) | 36 (3.3%) |
| 65 to 74 Years | 8 (5.7%) | 29 (18.7%) |
| 75 Years and over | 33 (47.1%) | 65 (47.8%) |
Disability Class by Sex by Age in Mountain Lakes borough
Disability Class: Hearing Difficulty
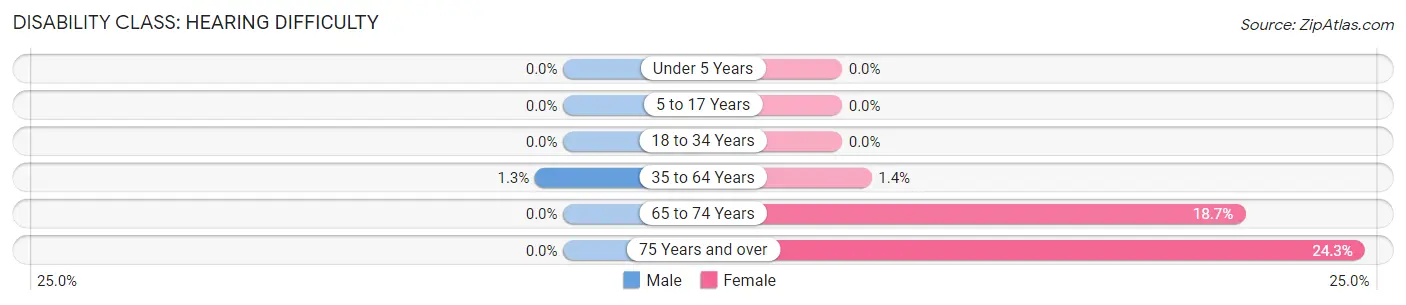
| Age Bracket | Male | Female |
| Under 5 Years | 0 (0.0%) | 0 (0.0%) |
| 5 to 17 Years | 0 (0.0%) | 0 (0.0%) |
| 18 to 34 Years | 0 (0.0%) | 0 (0.0%) |
| 35 to 64 Years | 13 (1.3%) | 15 (1.4%) |
| 65 to 74 Years | 0 (0.0%) | 29 (18.7%) |
| 75 Years and over | 0 (0.0%) | 33 (24.3%) |
Disability Class: Vision Difficulty
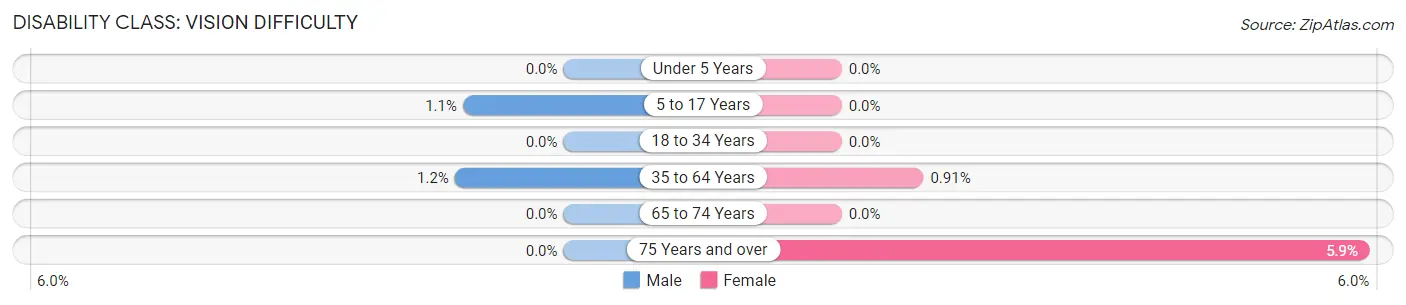
| Age Bracket | Male | Female |
| Under 5 Years | 0 (0.0%) | 0 (0.0%) |
| 5 to 17 Years | 10 (1.1%) | 0 (0.0%) |
| 18 to 34 Years | 0 (0.0%) | 0 (0.0%) |
| 35 to 64 Years | 12 (1.2%) | 10 (0.9%) |
| 65 to 74 Years | 0 (0.0%) | 0 (0.0%) |
| 75 Years and over | 0 (0.0%) | 8 (5.9%) |
Disability Class: Cognitive Difficulty
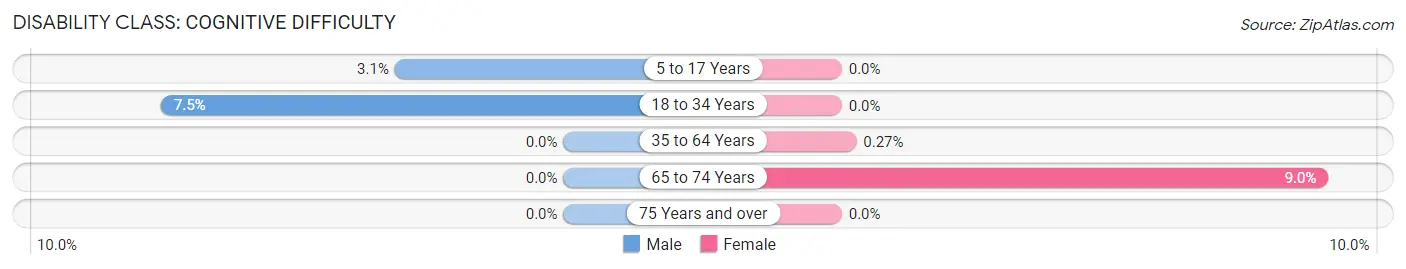
| Age Bracket | Male | Female |
| 5 to 17 Years | 28 (3.1%) | 0 (0.0%) |
| 18 to 34 Years | 13 (7.5%) | 0 (0.0%) |
| 35 to 64 Years | 0 (0.0%) | 3 (0.3%) |
| 65 to 74 Years | 0 (0.0%) | 14 (9.0%) |
| 75 Years and over | 0 (0.0%) | 0 (0.0%) |
Disability Class: Ambulatory Difficulty
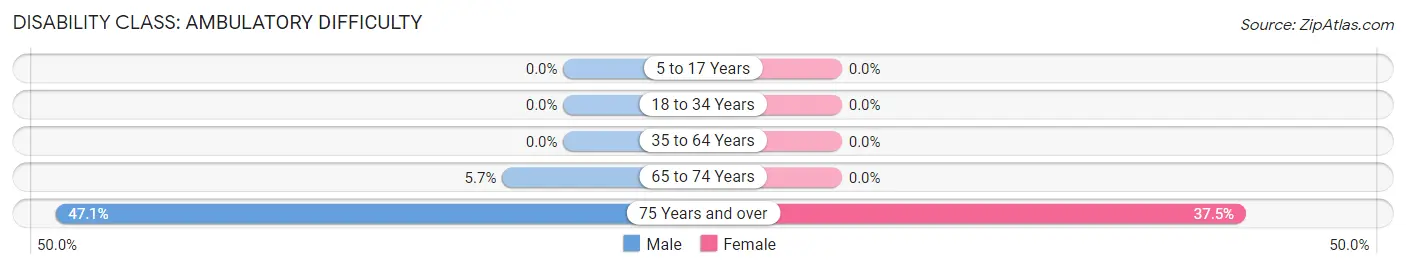
| Age Bracket | Male | Female |
| 5 to 17 Years | 0 (0.0%) | 0 (0.0%) |
| 18 to 34 Years | 0 (0.0%) | 0 (0.0%) |
| 35 to 64 Years | 0 (0.0%) | 0 (0.0%) |
| 65 to 74 Years | 8 (5.7%) | 0 (0.0%) |
| 75 Years and over | 33 (47.1%) | 51 (37.5%) |
Disability Class: Self-Care Difficulty
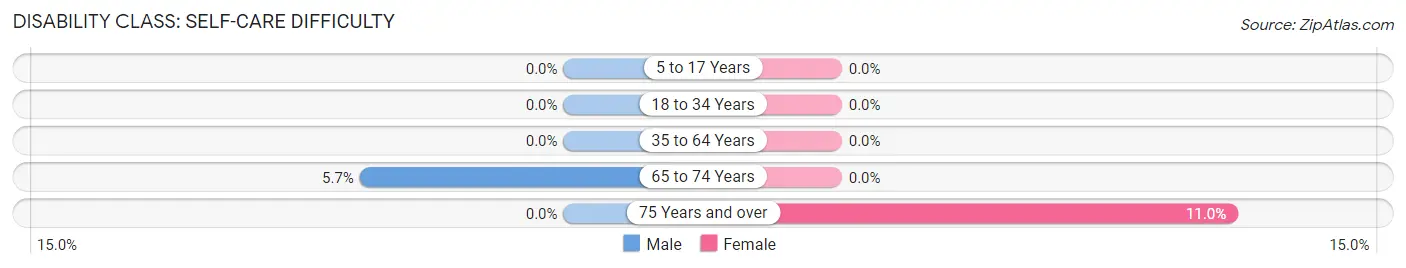
| Age Bracket | Male | Female |
| 5 to 17 Years | 0 (0.0%) | 0 (0.0%) |
| 18 to 34 Years | 0 (0.0%) | 0 (0.0%) |
| 35 to 64 Years | 0 (0.0%) | 0 (0.0%) |
| 65 to 74 Years | 8 (5.7%) | 0 (0.0%) |
| 75 Years and over | 0 (0.0%) | 15 (11.0%) |
Technology Access in Mountain Lakes borough
Computing Device Access in Mountain Lakes borough
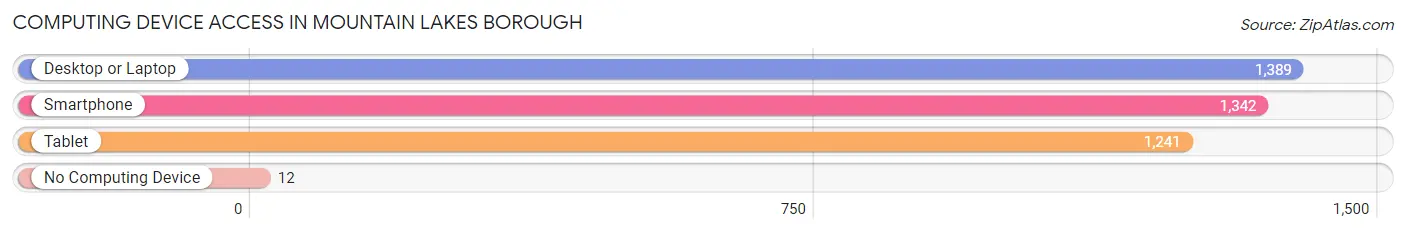
| Device Type | # Households | % Households |
| Desktop or Laptop | 1,389 | 97.1% |
| Smartphone | 1,342 | 93.9% |
| Tablet | 1,241 | 86.8% |
| No Computing Device | 12 | 0.8% |
| Total | 1,430 | 100.0% |
Internet Access in Mountain Lakes borough
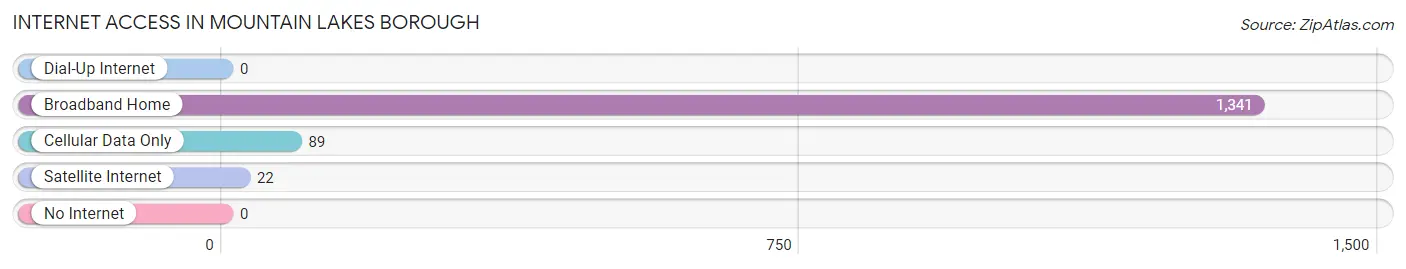
| Internet Type | # Households | % Households |
| Dial-Up Internet | 0 | 0.0% |
| Broadband Home | 1,341 | 93.8% |
| Cellular Data Only | 89 | 6.2% |
| Satellite Internet | 22 | 1.5% |
| No Internet | 0 | 0.0% |
| Total | 1,430 | 100.0% |
Mountain Lakes borough Summary
Mountain Lakes Borough is a small borough located in Morris County, New Jersey. It is situated in the northern part of the state, about 25 miles west of New York City. The borough is home to approximately 4,000 people and covers an area of 2.2 square miles.
History
Mountain Lakes Borough was incorporated in 1924, making it one of the oldest boroughs in Morris County. The area was originally inhabited by the Lenni Lenape Native Americans, who called the area “Mountain Lakes” due to the numerous lakes and ponds in the area. The first European settlers arrived in the area in the late 1700s and early 1800s, and the area was officially incorporated as a borough in 1924.
The borough was originally a summer resort town, and many of the original homes were built as summer homes for wealthy New Yorkers. The town was known for its picturesque lakes and wooded hills, and it quickly became a popular destination for vacationers. In the early 1900s, the town began to develop into a residential community, and many of the summer homes were converted into year-round residences.
Geography
Mountain Lakes Borough is located in the northern part of Morris County, about 25 miles west of New York City. The borough covers an area of 2.2 square miles and is bordered by Boonton Township to the north, Parsippany-Troy Hills Township to the east, Denville Township to the south, and Rockaway Township to the west.
The borough is situated in the foothills of the Appalachian Mountains, and the terrain is mostly hilly and wooded. The highest point in the borough is the summit of Mount Lakes, which rises to an elevation of 1,068 feet. The borough is home to several lakes and ponds, including Mountain Lake, Crystal Lake, and Lake Parsippany.
Economy
Mountain Lakes Borough has a strong economy that is largely based on the service industry. The borough is home to several large companies, including the pharmaceutical giant Merck & Co., which has its headquarters in the borough. Other major employers in the borough include the law firm of Lowenstein Sandler, the engineering firm of Langan Engineering, and the financial services firm of UBS.
The borough also has a thriving retail sector, with several shopping centers and malls located in the area. The borough is home to several restaurants, bars, and cafes, as well as a variety of other businesses.
Demographics
As of the 2010 census, the population of Mountain Lakes Borough was 4,160. The racial makeup of the borough was 87.3% White, 4.2% Asian, 3.2% African American, and 2.3% Hispanic or Latino. The median household income in the borough was $125,000, and the median home value was $717,000.
The borough is home to a large number of families, with nearly half of the population under the age of 18. The borough is also home to a large number of college-educated residents, with nearly 60% of the population having a bachelor’s degree or higher.
Conclusion
Mountain Lakes Borough is a small borough located in Morris County, New Jersey. It is situated in the northern part of the state, about 25 miles west of New York City. The borough is home to approximately 4,000 people and covers an area of 2.2 square miles. The borough was originally a summer resort town, and many of the original homes were built as summer homes for wealthy New Yorkers. The borough has a strong economy that is largely based on the service industry, and the population of the borough is largely white, with a median household income of $125,000 and a median home value of $717,000.
Common Questions
What is Per Capita Income in Mountain Lakes borough?
Per Capita income in Mountain Lakes borough is $104,161.
What is the Median Family Income in Mountain Lakes borough?
Median Family Income in Mountain Lakes borough is $250,001.
What is the Median Household income in Mountain Lakes borough?
Median Household Income in Mountain Lakes borough is $250,001.
What is Income or Wage Gap in Mountain Lakes borough?
Income or Wage Gap in Mountain Lakes borough is 57.3%.
Women in Mountain Lakes borough earn 42.7 cents for every dollar earned by a man.
What is Inequality or Gini Index in Mountain Lakes borough?
Inequality or Gini Index in Mountain Lakes borough is 0.39.
What is the Total Population of Mountain Lakes borough?
Total Population of Mountain Lakes borough is 4,499.
What is the Total Male Population of Mountain Lakes borough?
Total Male Population of Mountain Lakes borough is 2,352.
What is the Total Female Population of Mountain Lakes borough?
Total Female Population of Mountain Lakes borough is 2,147.
What is the Ratio of Males per 100 Females in Mountain Lakes borough?
There are 109.55 Males per 100 Females in Mountain Lakes borough.
What is the Ratio of Females per 100 Males in Mountain Lakes borough?
There are 91.28 Females per 100 Males in Mountain Lakes borough.
What is the Median Population Age in Mountain Lakes borough?
Median Population Age in Mountain Lakes borough is 43.7 Years.
What is the Average Family Size in Mountain Lakes borough
Average Family Size in Mountain Lakes borough is 3.5 People.
What is the Average Household Size in Mountain Lakes borough
Average Household Size in Mountain Lakes borough is 3.1 People.
How Large is the Labor Force in Mountain Lakes borough?
There are 2,149 People in the Labor Forcein in Mountain Lakes borough.
What is the Percentage of People in the Labor Force in Mountain Lakes borough?
67.1% of People are in the Labor Force in Mountain Lakes borough.
What is the Unemployment Rate in Mountain Lakes borough?
Unemployment Rate in Mountain Lakes borough is 2.6%.