Lakewood, NJ Map & Demographics
Lakewood Map
Lakewood Overview
$17,817
PER CAPITA INCOME
$58,396
AVG FAMILY INCOME
$54,826
AVG HOUSEHOLD INCOME
39.4%
WAGE / INCOME GAP [ % ]
60.6¢/ $1
WAGE / INCOME GAP [ $ ]
$11,936
FAMILY INCOME DEFICIT
0.49
INEQUALITY / GINI INDEX
68,555
TOTAL POPULATION
35,355
MALE POPULATION
33,200
FEMALE POPULATION
106.49
MALES / 100 FEMALES
93.90
FEMALES / 100 MALES
17.5
MEDIAN AGE
5.3
AVG FAMILY SIZE
4.9
AVG HOUSEHOLD SIZE
19,611
LABOR FORCE [ PEOPLE ]
53.6%
PERCENT IN LABOR FORCE
6.4%
UNEMPLOYMENT RATE
Lakewood Zip Codes
Income in Lakewood
Income Overview in Lakewood
Per Capita Income in Lakewood is $17,817, while median incomes of families and households are $58,396 and $54,826 respectively.
| Characteristic | Number | Measure |
| Per Capita Income | 68,555 | $17,817 |
| Median Family Income | 11,936 | $58,396 |
| Mean Family Income | 11,936 | $93,064 |
| Median Household Income | 13,518 | $54,826 |
| Mean Household Income | 13,518 | $89,177 |
| Income Deficit | 11,936 | $11,936 |
| Wage / Income Gap (%) | 68,555 | 39.42% |
| Wage / Income Gap ($) | 68,555 | 60.58¢ per $1 |
| Gini / Inequality Index | 68,555 | 0.49 |
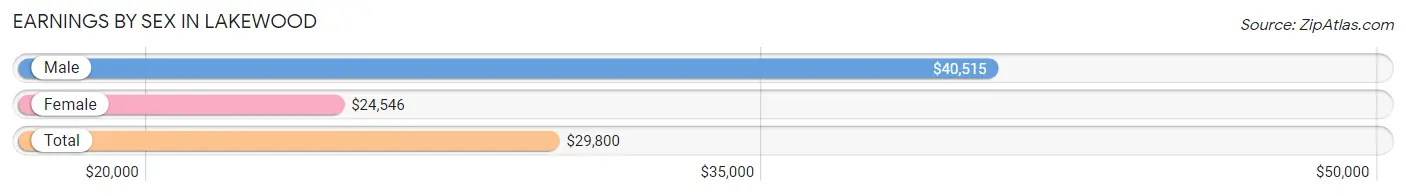
Earnings by Sex in Lakewood
Average Earnings in Lakewood are $29,800, $40,515 for men and $24,546 for women, a difference of 39.4%.
| Sex | Number | Average Earnings |
| Male | 10,010 (47.6%) | $40,515 |
| Female | 11,025 (52.4%) | $24,546 |
| Total | 21,035 (100.0%) | $29,800 |
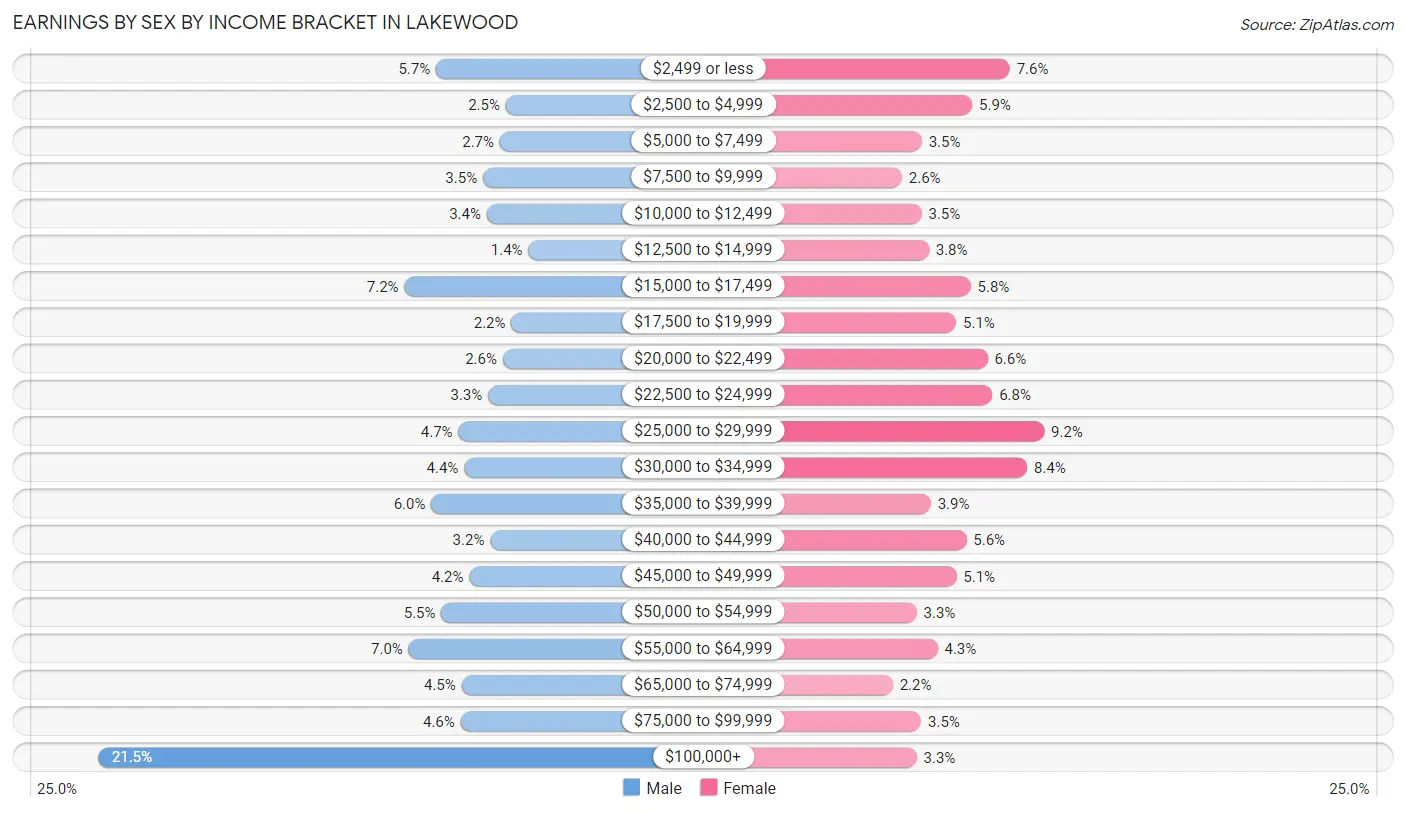
Earnings by Sex by Income Bracket in Lakewood
The most common earnings brackets in Lakewood are $100,000+ for men (2,154 | 21.5%) and $25,000 to $29,999 for women (1,019 | 9.2%).
| Income | Male | Female |
| $2,499 or less | 574 (5.7%) | 841 (7.6%) |
| $2,500 to $4,999 | 246 (2.5%) | 647 (5.9%) |
| $5,000 to $7,499 | 274 (2.7%) | 387 (3.5%) |
| $7,500 to $9,999 | 353 (3.5%) | 284 (2.6%) |
| $10,000 to $12,499 | 335 (3.4%) | 386 (3.5%) |
| $12,500 to $14,999 | 140 (1.4%) | 423 (3.8%) |
| $15,000 to $17,499 | 722 (7.2%) | 639 (5.8%) |
| $17,500 to $19,999 | 220 (2.2%) | 564 (5.1%) |
| $20,000 to $22,499 | 260 (2.6%) | 727 (6.6%) |
| $22,500 to $24,999 | 329 (3.3%) | 751 (6.8%) |
| $25,000 to $29,999 | 468 (4.7%) | 1,019 (9.2%) |
| $30,000 to $34,999 | 441 (4.4%) | 930 (8.4%) |
| $35,000 to $39,999 | 596 (5.9%) | 433 (3.9%) |
| $40,000 to $44,999 | 319 (3.2%) | 617 (5.6%) |
| $45,000 to $49,999 | 417 (4.2%) | 566 (5.1%) |
| $50,000 to $54,999 | 549 (5.5%) | 361 (3.3%) |
| $55,000 to $64,999 | 702 (7.0%) | 469 (4.3%) |
| $65,000 to $74,999 | 453 (4.5%) | 237 (2.1%) |
| $75,000 to $99,999 | 458 (4.6%) | 384 (3.5%) |
| $100,000+ | 2,154 (21.5%) | 360 (3.3%) |
| Total | 10,010 (100.0%) | 11,025 (100.0%) |
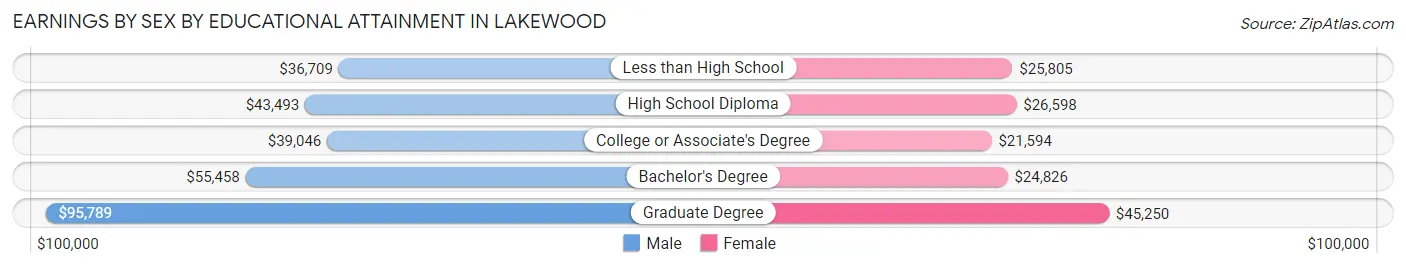
Earnings by Sex by Educational Attainment in Lakewood
Average earnings in Lakewood are $48,844 for men and $27,152 for women, a difference of 44.4%. Men with an educational attainment of graduate degree enjoy the highest average annual earnings of $95,789, while those with less than high school education earn the least with $36,709. Women with an educational attainment of graduate degree earn the most with the average annual earnings of $45,250, while those with college or associate's degree education have the smallest earnings of $21,594.
| Educational Attainment | Male Income | Female Income |
| Less than High School | $36,709 | $25,805 |
| High School Diploma | $43,493 | $26,598 |
| College or Associate's Degree | $39,046 | $21,594 |
| Bachelor's Degree | $55,458 | $24,826 |
| Graduate Degree | $95,789 | $45,250 |
| Total | $48,844 | $27,152 |
Family Income in Lakewood
Family Income Brackets in Lakewood
According to the Lakewood family income data, there are 1,993 families falling into the $35,000 to $49,999 income range, which is the most common income bracket and makes up 16.7% of all families. Conversely, the $10,000 to $14,999 income bracket is the least frequent group with only 203 families (1.7%) belonging to this category.
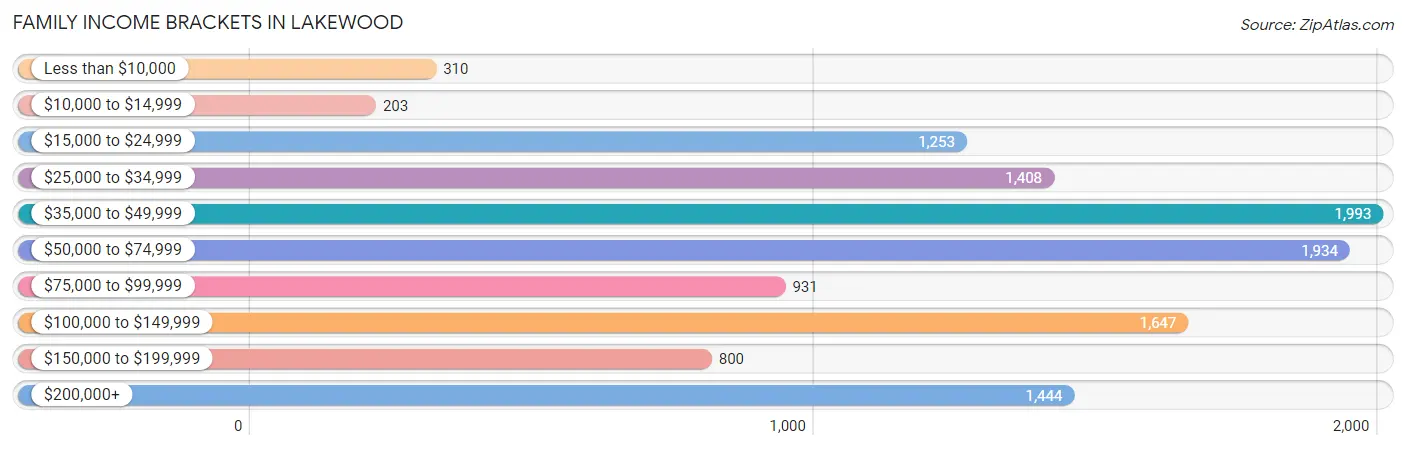
| Income Bracket | # Families | % Families |
| Less than $10,000 | 310 | 2.6% |
| $10,000 to $14,999 | 203 | 1.7% |
| $15,000 to $24,999 | 1,253 | 10.5% |
| $25,000 to $34,999 | 1,408 | 11.8% |
| $35,000 to $49,999 | 1,993 | 16.7% |
| $50,000 to $74,999 | 1,934 | 16.2% |
| $75,000 to $99,999 | 931 | 7.8% |
| $100,000 to $149,999 | 1,647 | 13.8% |
| $150,000 to $199,999 | 800 | 6.7% |
| $200,000+ | 1,444 | 12.1% |
Family Income by Famaliy Size in Lakewood
2-person families (1,913 | 16.0%) account for the highest median family income in Lakewood with $81,341 per family, while 2-person families (1,913 | 16.0%) have the highest median income of $40,670 per family member.
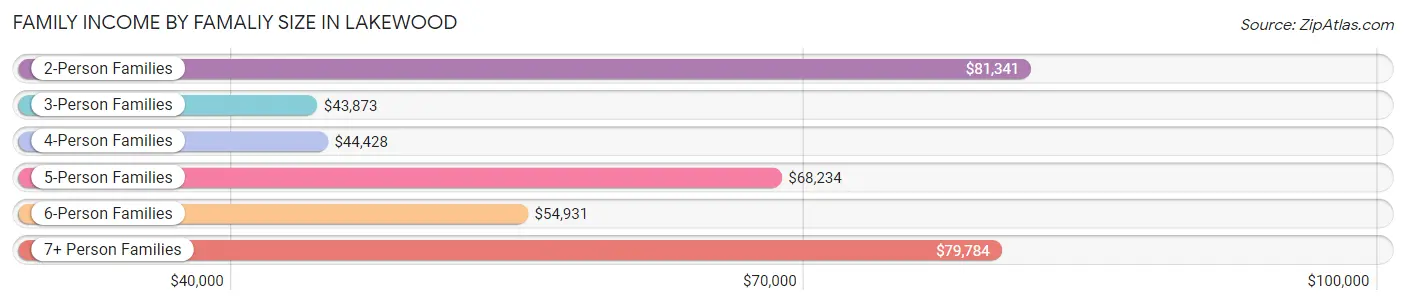
| Income Bracket | # Families | Median Income |
| 2-Person Families | 1,913 (16.0%) | $81,341 |
| 3-Person Families | 2,118 (17.7%) | $43,873 |
| 4-Person Families | 1,862 (15.6%) | $44,428 |
| 5-Person Families | 1,452 (12.2%) | $68,234 |
| 6-Person Families | 738 (6.2%) | $54,931 |
| 7+ Person Families | 3,853 (32.3%) | $79,784 |
| Total | 11,936 (100.0%) | $58,396 |
Family Income by Number of Earners in Lakewood
The median family income in Lakewood is $58,396, with families comprising 3+ earners (1,257) having the highest median family income of $168,036, while families with 1 earner (5,725) have the lowest median family income of $37,654, accounting for 10.5% and 48.0% of families, respectively.
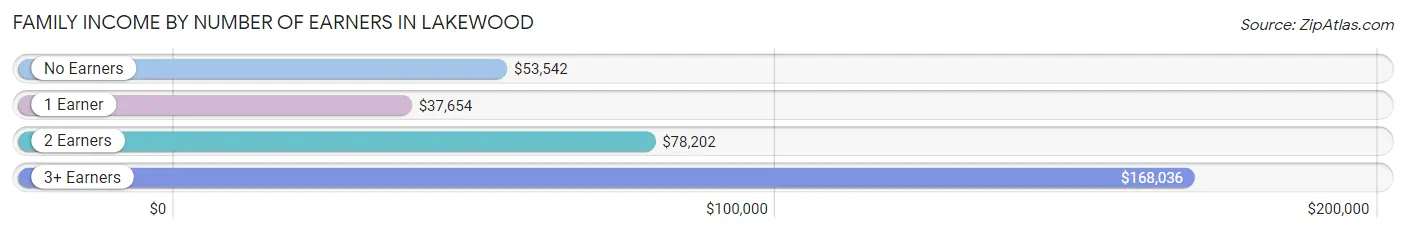
| Number of Earners | # Families | Median Income |
| No Earners | 569 (4.8%) | $53,542 |
| 1 Earner | 5,725 (48.0%) | $37,654 |
| 2 Earners | 4,385 (36.7%) | $78,202 |
| 3+ Earners | 1,257 (10.5%) | $168,036 |
| Total | 11,936 (100.0%) | $58,396 |
Household Income in Lakewood
Household Income Brackets in Lakewood
With 2,244 households falling in the category, the $35,000 to $49,999 income range is the most frequent in Lakewood, accounting for 16.6% of all households. In contrast, only 351 households (2.6%) fall into the $10,000 to $14,999 income bracket, making it the least populous group.
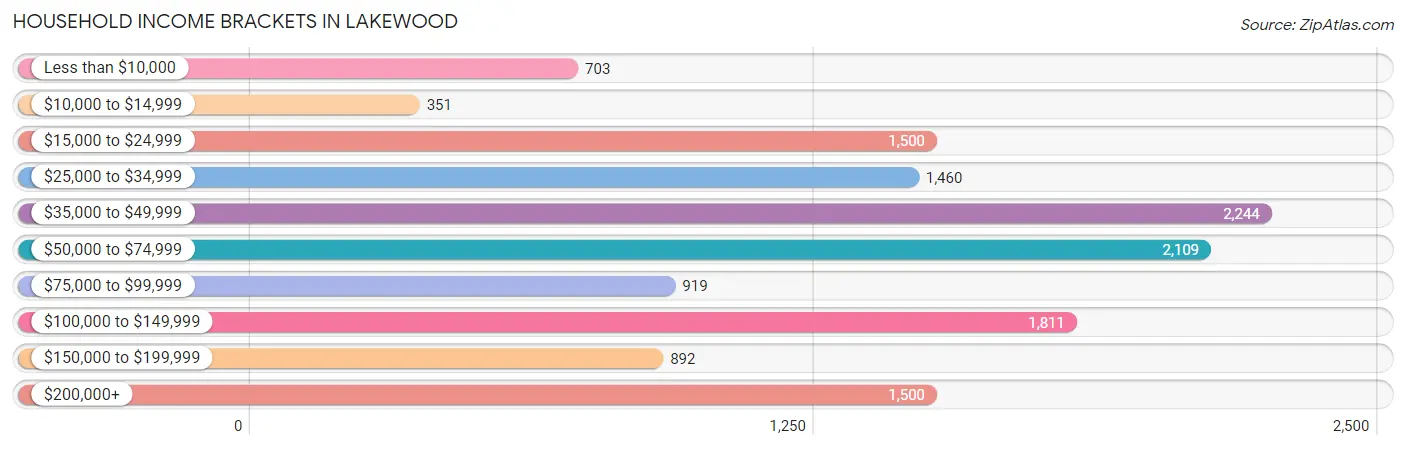
| Income Bracket | # Households | % Households |
| Less than $10,000 | 703 | 5.2% |
| $10,000 to $14,999 | 351 | 2.6% |
| $15,000 to $24,999 | 1,500 | 11.1% |
| $25,000 to $34,999 | 1,460 | 10.8% |
| $35,000 to $49,999 | 2,244 | 16.6% |
| $50,000 to $74,999 | 2,109 | 15.6% |
| $75,000 to $99,999 | 919 | 6.8% |
| $100,000 to $149,999 | 1,811 | 13.4% |
| $150,000 to $199,999 | 892 | 6.6% |
| $200,000+ | 1,500 | 11.1% |
Household Income by Householder Age in Lakewood
The median household income in Lakewood is $54,826, with the highest median household income of $84,236 found in the 45 to 64 years age bracket for the primary householder. A total of 3,492 households (25.8%) fall into this category. Meanwhile, the 15 to 24 years age bracket for the primary householder has the lowest median household income of $24,828, with 1,015 households (7.5%) in this group.
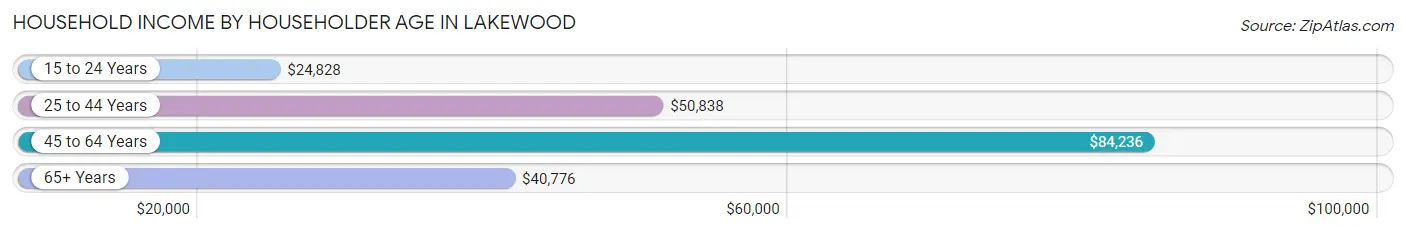
| Income Bracket | # Households | Median Income |
| 15 to 24 Years | 1,015 (7.5%) | $24,828 |
| 25 to 44 Years | 7,021 (51.9%) | $50,838 |
| 45 to 64 Years | 3,492 (25.8%) | $84,236 |
| 65+ Years | 1,990 (14.7%) | $40,776 |
| Total | 13,518 (100.0%) | $54,826 |
Poverty in Lakewood
Income Below Poverty by Sex and Age in Lakewood
With 30.9% poverty level for males and 29.4% for females among the residents of Lakewood, 5 year old males and 75 year old and over females are the most vulnerable to poverty, with 608 males (48.6%) and 341 females (42.0%) in their respective age groups living below the poverty level.
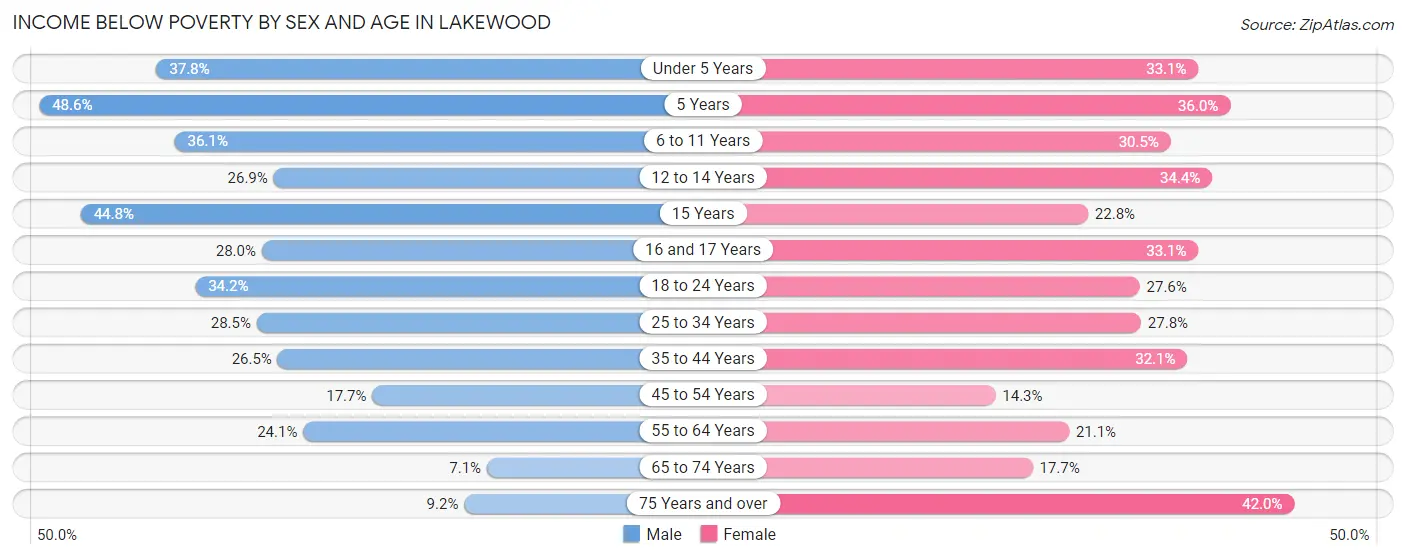
| Age Bracket | Male | Female |
| Under 5 Years | 2,332 (37.8%) | 1,694 (33.1%) |
| 5 Years | 608 (48.6%) | 244 (36.0%) |
| 6 to 11 Years | 2,020 (36.1%) | 1,942 (30.5%) |
| 12 to 14 Years | 583 (26.9%) | 877 (34.4%) |
| 15 Years | 434 (44.8%) | 196 (22.8%) |
| 16 and 17 Years | 524 (28.0%) | 460 (33.1%) |
| 18 to 24 Years | 1,008 (34.2%) | 1,137 (27.6%) |
| 25 to 34 Years | 1,219 (28.4%) | 939 (27.8%) |
| 35 to 44 Years | 963 (26.5%) | 1,045 (32.1%) |
| 45 to 54 Years | 480 (17.7%) | 265 (14.2%) |
| 55 to 64 Years | 294 (24.1%) | 245 (21.1%) |
| 65 to 74 Years | 58 (7.1%) | 186 (17.7%) |
| 75 Years and over | 56 (9.2%) | 341 (42.0%) |
| Total | 10,579 (30.9%) | 9,571 (29.4%) |
Income Above Poverty by Sex and Age in Lakewood
According to the poverty statistics in Lakewood, males aged 65 to 74 years and females aged 45 to 54 years are the age groups that are most secure financially, with 92.9% of males and 85.8% of females in these age groups living above the poverty line.
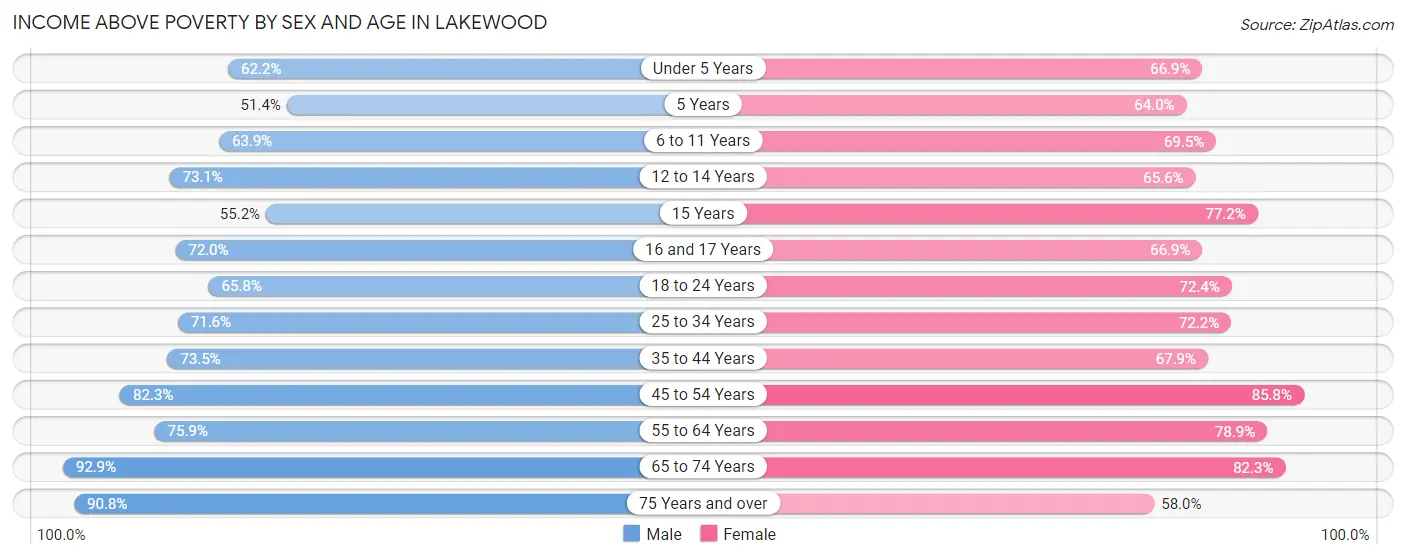
| Age Bracket | Male | Female |
| Under 5 Years | 3,843 (62.2%) | 3,427 (66.9%) |
| 5 Years | 642 (51.4%) | 433 (64.0%) |
| 6 to 11 Years | 3,579 (63.9%) | 4,420 (69.5%) |
| 12 to 14 Years | 1,585 (73.1%) | 1,675 (65.6%) |
| 15 Years | 535 (55.2%) | 662 (77.2%) |
| 16 and 17 Years | 1,348 (72.0%) | 930 (66.9%) |
| 18 to 24 Years | 1,943 (65.8%) | 2,976 (72.4%) |
| 25 to 34 Years | 3,066 (71.6%) | 2,443 (72.2%) |
| 35 to 44 Years | 2,670 (73.5%) | 2,215 (67.9%) |
| 45 to 54 Years | 2,228 (82.3%) | 1,594 (85.8%) |
| 55 to 64 Years | 924 (75.9%) | 917 (78.9%) |
| 65 to 74 Years | 760 (92.9%) | 865 (82.3%) |
| 75 Years and over | 553 (90.8%) | 471 (58.0%) |
| Total | 23,676 (69.1%) | 23,028 (70.6%) |
Income Below Poverty Among Married-Couple Families in Lakewood
The poverty statistics for married-couple families in Lakewood show that 24.1% or 2,637 of the total 10,933 families live below the poverty line. Families with 5 or more children have the highest poverty rate of 38.9%, comprising of 1,211 families. On the other hand, families with no children have the lowest poverty rate of 10.7%, which includes 226 families.
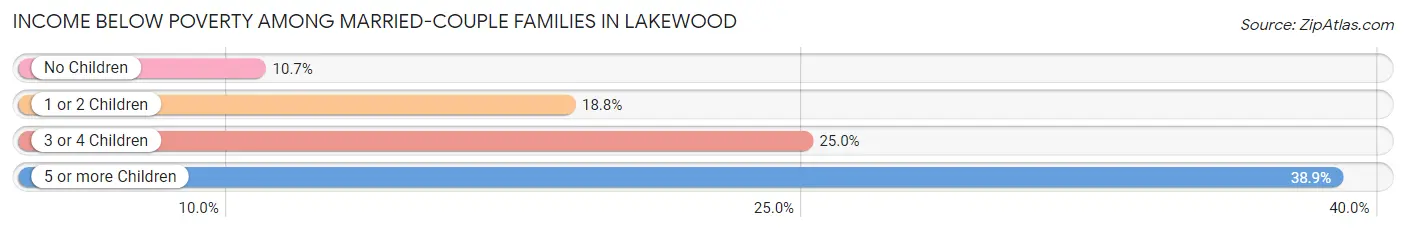
| Children | Above Poverty | Below Poverty |
| No Children | 1,883 (89.3%) | 226 (10.7%) |
| 1 or 2 Children | 2,968 (81.2%) | 687 (18.8%) |
| 3 or 4 Children | 1,539 (75.0%) | 513 (25.0%) |
| 5 or more Children | 1,906 (61.2%) | 1,211 (38.9%) |
| Total | 8,296 (75.9%) | 2,637 (24.1%) |
Income Below Poverty Among Single-Parent Households in Lakewood
According to the poverty data in Lakewood, 42.1% or 220 single-father households and 50.7% or 244 single-mother households are living below the poverty line. Among single-father households, those with 5 or more children have the highest poverty rate, with 80 households (100.0%) experiencing poverty. Likewise, among single-mother households, those with 5 or more children have the highest poverty rate, with 33 households (100.0%) falling below the poverty line.
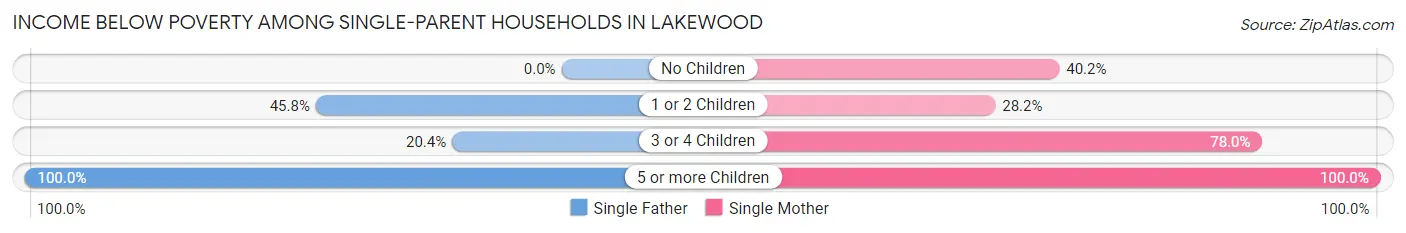
| Children | Single Father | Single Mother |
| No Children | 0 (0.0%) | 102 (40.2%) |
| 1 or 2 Children | 119 (45.8%) | 24 (28.2%) |
| 3 or 4 Children | 21 (20.4%) | 85 (78.0%) |
| 5 or more Children | 80 (100.0%) | 33 (100.0%) |
| Total | 220 (42.1%) | 244 (50.7%) |
Income Below Poverty Among Married-Couple vs Single-Parent Households in Lakewood
The poverty data for Lakewood shows that 2,637 of the married-couple family households (24.1%) and 464 of the single-parent households (46.3%) are living below the poverty level. Within the married-couple family households, those with 5 or more children have the highest poverty rate, with 1,211 households (38.9%) falling below the poverty line. Among the single-parent households, those with 5 or more children have the highest poverty rate, with 113 household (100.0%) living below poverty.
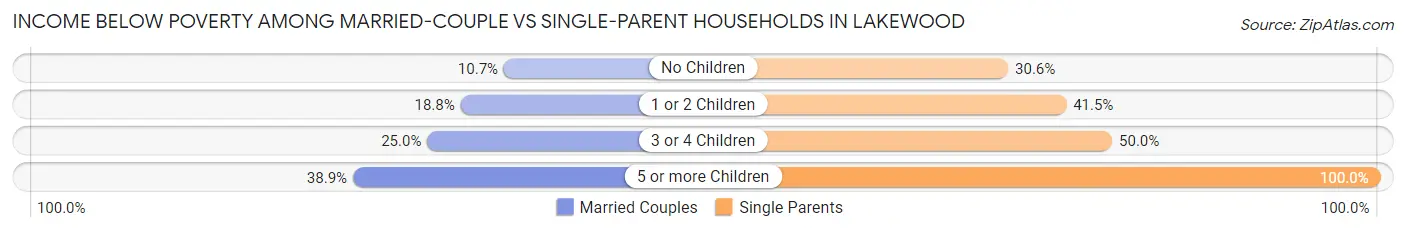
| Children | Married-Couple Families | Single-Parent Households |
| No Children | 226 (10.7%) | 102 (30.6%) |
| 1 or 2 Children | 687 (18.8%) | 143 (41.4%) |
| 3 or 4 Children | 513 (25.0%) | 106 (50.0%) |
| 5 or more Children | 1,211 (38.9%) | 113 (100.0%) |
| Total | 2,637 (24.1%) | 464 (46.3%) |
Race in Lakewood
The most populous races in Lakewood are White / Caucasian (60,216 | 87.8%), Hispanic or Latino (8,010 | 11.7%), and Some other Race (3,682 | 5.4%).
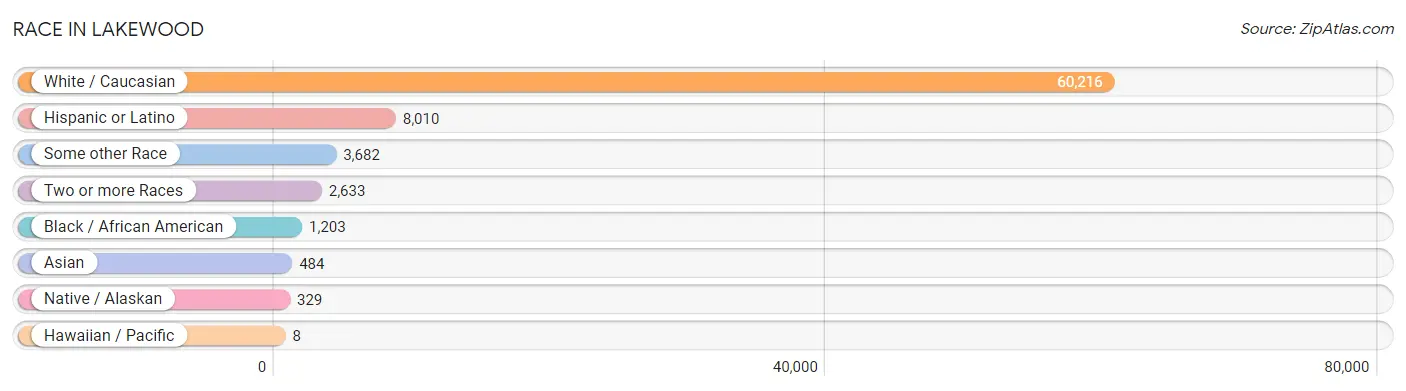
| Race | # Population | % Population |
| Asian | 484 | 0.7% |
| Black / African American | 1,203 | 1.8% |
| Hawaiian / Pacific | 8 | 0.0% |
| Hispanic or Latino | 8,010 | 11.7% |
| Native / Alaskan | 329 | 0.5% |
| White / Caucasian | 60,216 | 87.8% |
| Two or more Races | 2,633 | 3.8% |
| Some other Race | 3,682 | 5.4% |
| Total | 68,555 | 100.0% |
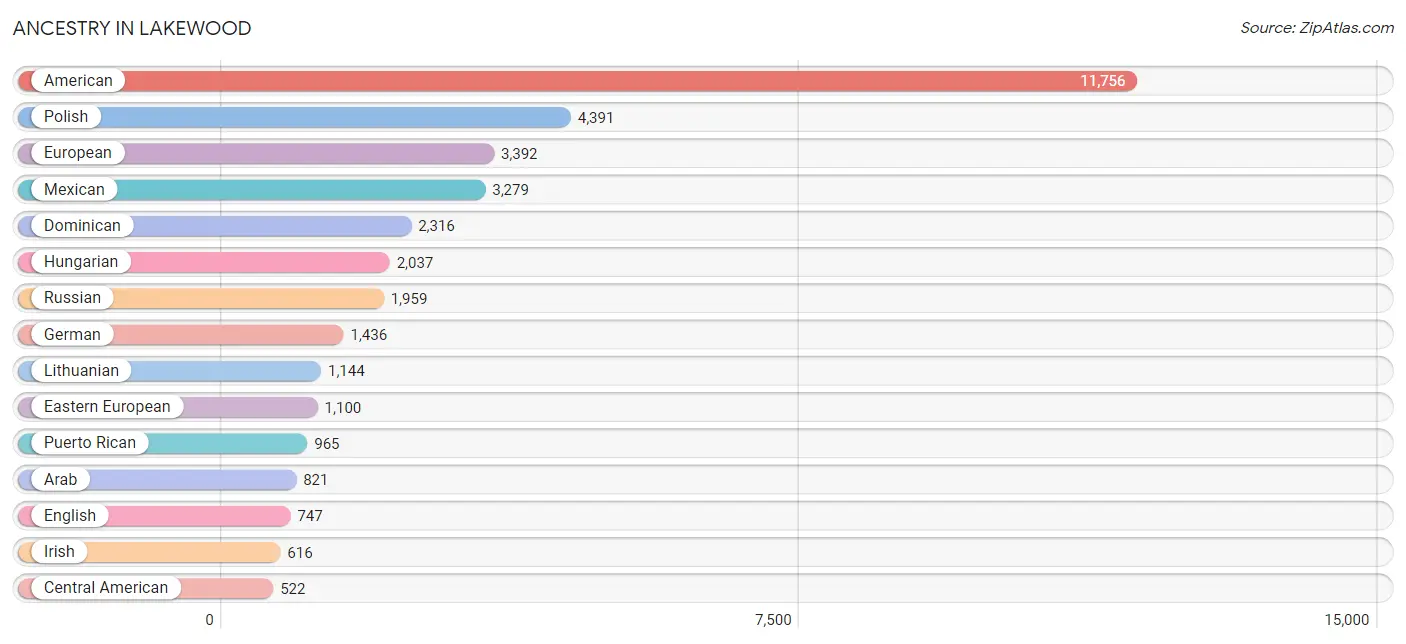
Ancestry in Lakewood
The most populous ancestries reported in Lakewood are American (11,756 | 17.2%), Polish (4,391 | 6.4%), European (3,392 | 5.0%), Mexican (3,279 | 4.8%), and Dominican (2,316 | 3.4%), together accounting for 36.7% of all Lakewood residents.
| Ancestry | # Population | % Population |
| African | 2 | 0.0% |
| American | 11,756 | 17.2% |
| Arab | 821 | 1.2% |
| Argentinean | 31 | 0.1% |
| Austrian | 345 | 0.5% |
| Barbadian | 15 | 0.0% |
| Belgian | 68 | 0.1% |
| Bhutanese | 29 | 0.0% |
| Brazilian | 91 | 0.1% |
| British | 81 | 0.1% |
| Burmese | 15 | 0.0% |
| Canadian | 266 | 0.4% |
| Central American | 522 | 0.8% |
| Central American Indian | 29 | 0.0% |
| Colombian | 57 | 0.1% |
| Costa Rican | 13 | 0.0% |
| Cuban | 48 | 0.1% |
| Czech | 462 | 0.7% |
| Czechoslovakian | 62 | 0.1% |
| Danish | 5 | 0.0% |
| Dominican | 2,316 | 3.4% |
| Dutch | 17 | 0.0% |
| Eastern European | 1,100 | 1.6% |
| Ecuadorian | 130 | 0.2% |
| Egyptian | 30 | 0.0% |
| English | 747 | 1.1% |
| Ethiopian | 43 | 0.1% |
| European | 3,392 | 5.0% |
| French | 122 | 0.2% |
| German | 1,436 | 2.1% |
| Guatemalan | 91 | 0.1% |
| Guyanese | 23 | 0.0% |
| Haitian | 40 | 0.1% |
| Hungarian | 2,037 | 3.0% |
| Iranian | 15 | 0.0% |
| Iraqi | 15 | 0.0% |
| Irish | 616 | 0.9% |
| Israeli | 145 | 0.2% |
| Italian | 386 | 0.6% |
| Jamaican | 108 | 0.2% |
| Kenyan | 20 | 0.0% |
| Korean | 100 | 0.2% |
| Latvian | 26 | 0.0% |
| Lebanese | 44 | 0.1% |
| Lithuanian | 1,144 | 1.7% |
| Mexican | 3,279 | 4.8% |
| Mexican American Indian | 329 | 0.5% |
| Moroccan | 113 | 0.2% |
| Native Hawaiian | 41 | 0.1% |
| Norwegian | 31 | 0.1% |
| Pakistani | 7 | 0.0% |
| Peruvian | 188 | 0.3% |
| Polish | 4,391 | 6.4% |
| Portuguese | 65 | 0.1% |
| Puerto Rican | 965 | 1.4% |
| Romanian | 283 | 0.4% |
| Russian | 1,959 | 2.9% |
| Salvadoran | 418 | 0.6% |
| Scotch-Irish | 95 | 0.1% |
| Scottish | 12 | 0.0% |
| Slovak | 38 | 0.1% |
| South African | 156 | 0.2% |
| South American | 406 | 0.6% |
| Spaniard | 39 | 0.1% |
| Spanish | 33 | 0.1% |
| Sri Lankan | 32 | 0.1% |
| Subsaharan African | 221 | 0.3% |
| Swiss | 68 | 0.1% |
| Syrian | 500 | 0.7% |
| Thai | 190 | 0.3% |
| Turkish | 15 | 0.0% |
| Ukrainian | 436 | 0.6% | View All 72 Rows |
Immigrants in Lakewood
The most numerous immigrant groups reported in Lakewood came from Latin America (3,093 | 4.5%), Central America (1,828 | 2.7%), Mexico (1,709 | 2.5%), Europe (1,247 | 1.8%), and Caribbean (909 | 1.3%), together accounting for 12.8% of all Lakewood residents.
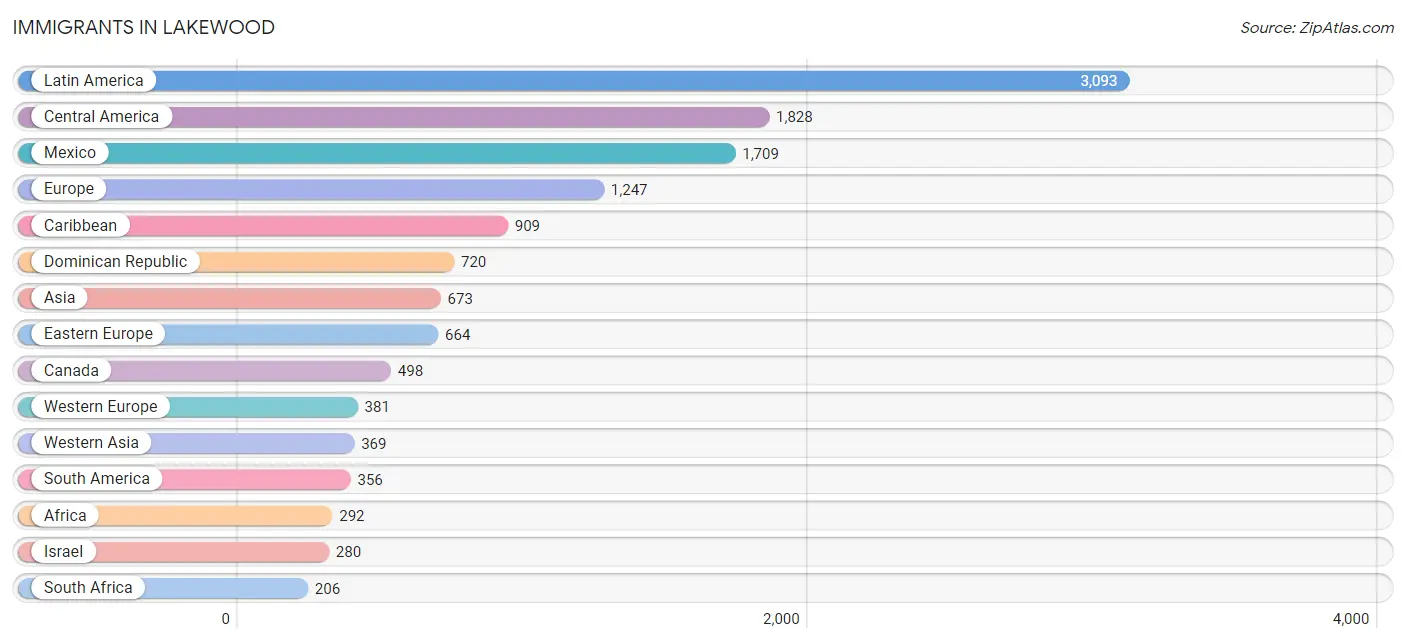
| Immigration Origin | # Population | % Population |
| Africa | 292 | 0.4% |
| Argentina | 31 | 0.1% |
| Asia | 673 | 1.0% |
| Australia | 100 | 0.2% |
| Austria | 115 | 0.2% |
| Belarus | 25 | 0.0% |
| Belgium | 11 | 0.0% |
| Brazil | 83 | 0.1% |
| Canada | 498 | 0.7% |
| Caribbean | 909 | 1.3% |
| Central America | 1,828 | 2.7% |
| Chile | 14 | 0.0% |
| China | 29 | 0.0% |
| Colombia | 11 | 0.0% |
| Czechoslovakia | 47 | 0.1% |
| Denmark | 5 | 0.0% |
| Dominican Republic | 720 | 1.1% |
| Eastern Africa | 34 | 0.1% |
| Eastern Asia | 81 | 0.1% |
| Eastern Europe | 664 | 1.0% |
| Ecuador | 94 | 0.1% |
| El Salvador | 28 | 0.0% |
| England | 116 | 0.2% |
| Ethiopia | 14 | 0.0% |
| Europe | 1,247 | 1.8% |
| France | 135 | 0.2% |
| Germany | 66 | 0.1% |
| Ghana | 2 | 0.0% |
| Greece | 3 | 0.0% |
| Guatemala | 91 | 0.1% |
| Guyana | 23 | 0.0% |
| Haiti | 24 | 0.0% |
| Hungary | 86 | 0.1% |
| India | 35 | 0.1% |
| Iraq | 28 | 0.0% |
| Israel | 280 | 0.4% |
| Italy | 28 | 0.0% |
| Jamaica | 108 | 0.2% |
| Japan | 29 | 0.0% |
| Kenya | 20 | 0.0% |
| Korea | 23 | 0.0% |
| Latin America | 3,093 | 4.5% |
| Latvia | 40 | 0.1% |
| Mexico | 1,709 | 2.5% |
| Moldova | 23 | 0.0% |
| Morocco | 19 | 0.0% |
| Nigeria | 31 | 0.1% |
| Northern Africa | 19 | 0.0% |
| Northern Europe | 164 | 0.2% |
| Oceania | 100 | 0.2% |
| Pakistan | 39 | 0.1% |
| Peru | 100 | 0.2% |
| Philippines | 76 | 0.1% |
| Poland | 161 | 0.2% |
| Portugal | 7 | 0.0% |
| Russia | 92 | 0.1% |
| South Africa | 206 | 0.3% |
| South America | 356 | 0.5% |
| South Central Asia | 122 | 0.2% |
| South Eastern Asia | 87 | 0.1% |
| Southern Europe | 38 | 0.1% |
| Switzerland | 54 | 0.1% |
| Syria | 61 | 0.1% |
| Trinidad and Tobago | 27 | 0.0% |
| Ukraine | 190 | 0.3% |
| Vietnam | 11 | 0.0% |
| Western Africa | 33 | 0.1% |
| Western Asia | 369 | 0.5% |
| Western Europe | 381 | 0.6% | View All 69 Rows |
Sex and Age in Lakewood
Sex and Age in Lakewood
The most populous age groups in Lakewood are Under 5 Years (6,261 | 17.7%) for men and Under 5 Years (5,250 | 15.8%) for women.
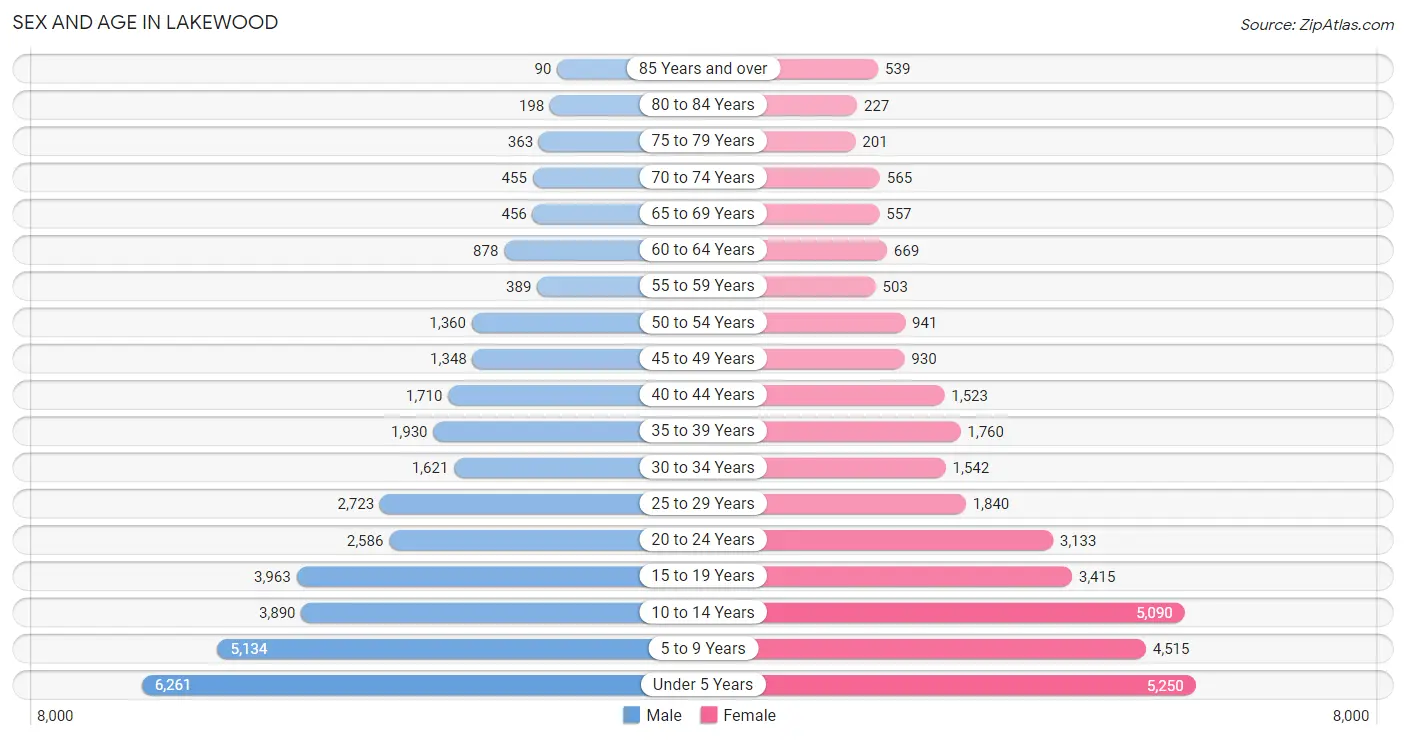
| Age Bracket | Male | Female |
| Under 5 Years | 6,261 (17.7%) | 5,250 (15.8%) |
| 5 to 9 Years | 5,134 (14.5%) | 4,515 (13.6%) |
| 10 to 14 Years | 3,890 (11.0%) | 5,090 (15.3%) |
| 15 to 19 Years | 3,963 (11.2%) | 3,415 (10.3%) |
| 20 to 24 Years | 2,586 (7.3%) | 3,133 (9.4%) |
| 25 to 29 Years | 2,723 (7.7%) | 1,840 (5.5%) |
| 30 to 34 Years | 1,621 (4.6%) | 1,542 (4.6%) |
| 35 to 39 Years | 1,930 (5.5%) | 1,760 (5.3%) |
| 40 to 44 Years | 1,710 (4.8%) | 1,523 (4.6%) |
| 45 to 49 Years | 1,348 (3.8%) | 930 (2.8%) |
| 50 to 54 Years | 1,360 (3.8%) | 941 (2.8%) |
| 55 to 59 Years | 389 (1.1%) | 503 (1.5%) |
| 60 to 64 Years | 878 (2.5%) | 669 (2.0%) |
| 65 to 69 Years | 456 (1.3%) | 557 (1.7%) |
| 70 to 74 Years | 455 (1.3%) | 565 (1.7%) |
| 75 to 79 Years | 363 (1.0%) | 201 (0.6%) |
| 80 to 84 Years | 198 (0.6%) | 227 (0.7%) |
| 85 Years and over | 90 (0.3%) | 539 (1.6%) |
| Total | 35,355 (100.0%) | 33,200 (100.0%) |
Families and Households in Lakewood
Median Family Size in Lakewood
The median family size in Lakewood is 5.32 persons per family, with single male/father families (522 | 4.4%) accounting for the largest median family size of 5.57 persons per family. On the other hand, single female/mother families (481 | 4.0%) represent the smallest median family size with 3.70 persons per family.
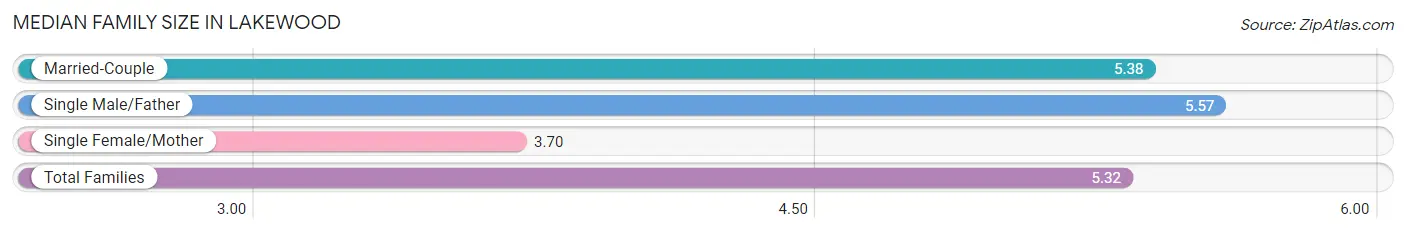
| Family Type | # Families | Family Size |
| Married-Couple | 10,933 (91.6%) | 5.38 |
| Single Male/Father | 522 (4.4%) | 5.57 |
| Single Female/Mother | 481 (4.0%) | 3.70 |
| Total Families | 11,936 (100.0%) | 5.32 |
Median Household Size in Lakewood
The median household size in Lakewood is 4.94 persons per household, with single male/father households (522 | 3.9%) accounting for the largest median household size of 6.16 persons per household. non-family households (1,582 | 11.7%) represent the smallest median household size with 1.27 persons per household.
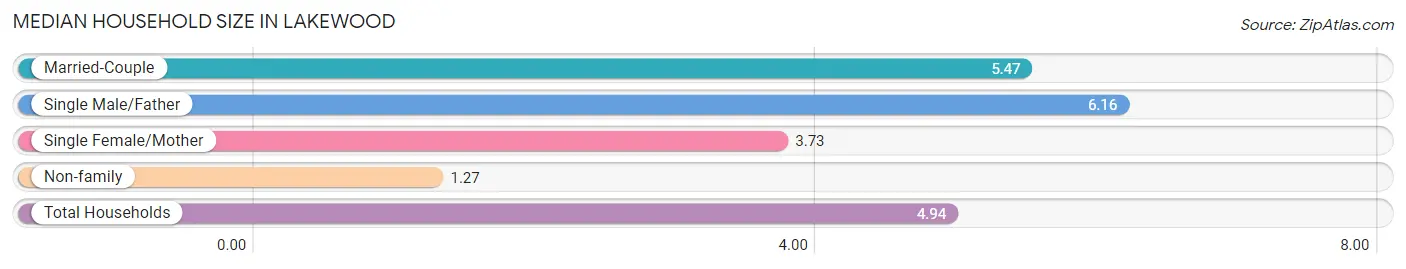
| Household Type | # Households | Household Size |
| Married-Couple | 10,933 (80.9%) | 5.47 |
| Single Male/Father | 522 (3.9%) | 6.16 |
| Single Female/Mother | 481 (3.6%) | 3.73 |
| Non-family | 1,582 (11.7%) | 1.27 |
| Total Households | 13,518 (100.0%) | 4.94 |
Household Size by Marriage Status in Lakewood
Out of a total of 13,518 households in Lakewood, 11,936 (88.3%) are family households, while 1,582 (11.7%) are nonfamily households. The most numerous type of family households are 7+ person households, comprising 4,029, and the most common type of nonfamily households are 1-person households, comprising 1,326.
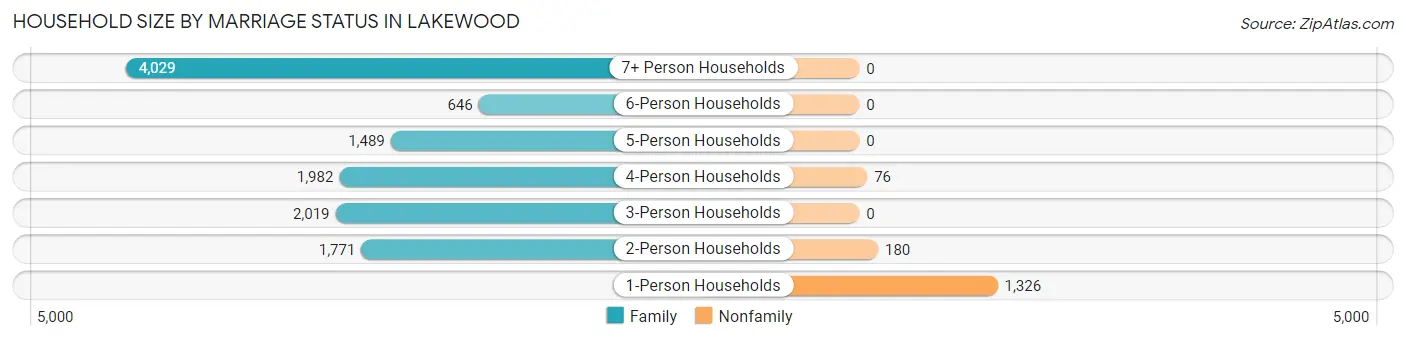
| Household Size | Family Households | Nonfamily Households |
| 1-Person Households | - | 1,326 (9.8%) |
| 2-Person Households | 1,771 (13.1%) | 180 (1.3%) |
| 3-Person Households | 2,019 (14.9%) | 0 (0.0%) |
| 4-Person Households | 1,982 (14.7%) | 76 (0.6%) |
| 5-Person Households | 1,489 (11.0%) | 0 (0.0%) |
| 6-Person Households | 646 (4.8%) | 0 (0.0%) |
| 7+ Person Households | 4,029 (29.8%) | 0 (0.0%) |
| Total | 11,936 (88.3%) | 1,582 (11.7%) |
Female Fertility in Lakewood
Fertility by Age in Lakewood
Average fertility rate in Lakewood is 191.0 births per 1,000 women. Women in the age bracket of 20 to 34 years have the highest fertility rate with 311.0 births per 1,000 women. Women in the age bracket of 20 to 34 years acount for 73.7% of all women with births.
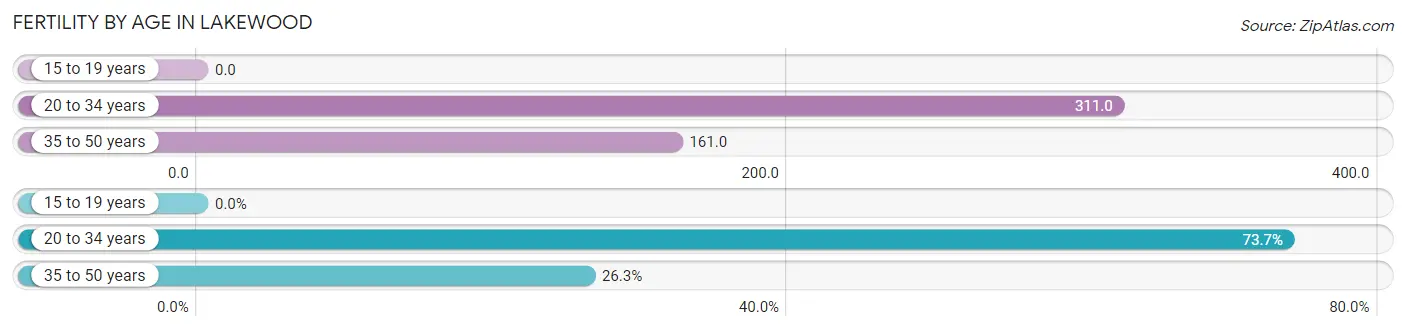
| Age Bracket | Women with Births | Births / 1,000 Women |
| 15 to 19 years | 0 (0.0%) | 0.0 |
| 20 to 34 years | 2,027 (73.7%) | 311.0 |
| 35 to 50 years | 722 (26.3%) | 161.0 |
| Total | 2,749 (100.0%) | 191.0 |
Fertility by Age by Marriage Status in Lakewood
98.6% of women with births (2,749) in Lakewood are married. The highest percentage of unmarried women with births falls into 20 to 34 years age bracket with 1.9% of them unmarried at the time of birth, while the lowest percentage of unmarried women with births belong to 35 to 50 years age bracket with 0.0% of them unmarried.
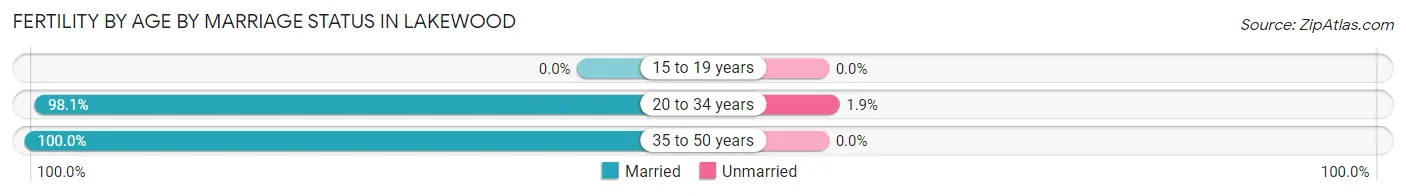
| Age Bracket | Married | Unmarried |
| 15 to 19 years | 0 (0.0%) | 0 (0.0%) |
| 20 to 34 years | 1,988 (98.1%) | 39 (1.9%) |
| 35 to 50 years | 722 (100.0%) | 0 (0.0%) |
| Total | 2,711 (98.6%) | 38 (1.4%) |
Fertility by Education in Lakewood
Average fertility rate in Lakewood is 191.0 births per 1,000 women. Women with the education attainment of graduate degree have the highest fertility rate of 384.0 births per 1,000 women, while women with the education attainment of less than high school have the lowest fertility at 40.0 births per 1,000 women. Women with the education attainment of high school diploma represent 39.0% of all women with births.
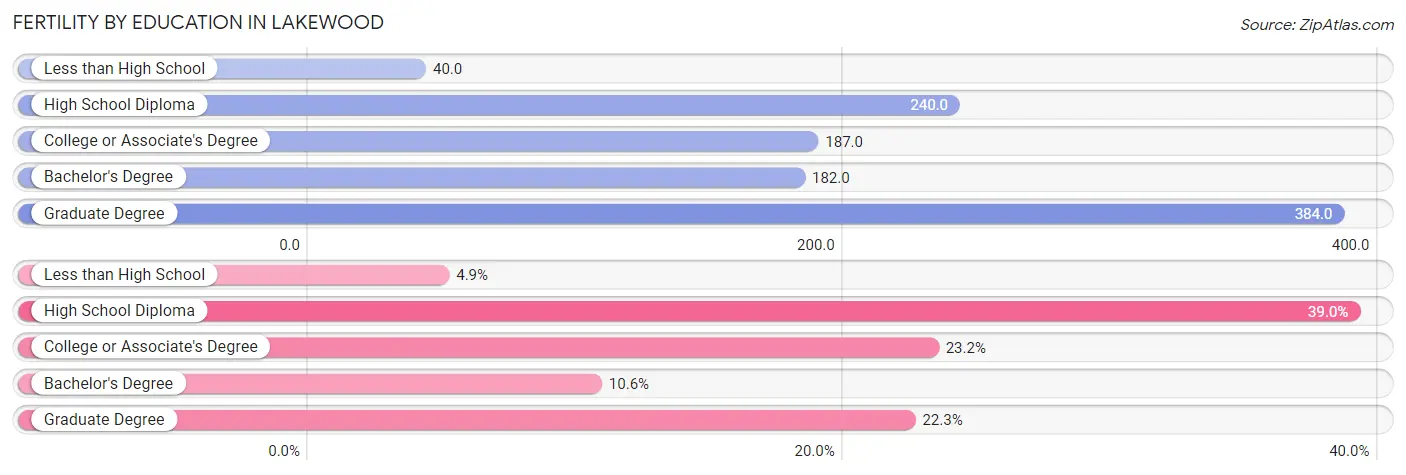
| Educational Attainment | Women with Births | Births / 1,000 Women |
| Less than High School | 134 (4.9%) | 40.0 |
| High School Diploma | 1,072 (39.0%) | 240.0 |
| College or Associate's Degree | 638 (23.2%) | 187.0 |
| Bachelor's Degree | 291 (10.6%) | 182.0 |
| Graduate Degree | 614 (22.3%) | 384.0 |
| Total | 2,749 (100.0%) | 191.0 |
Fertility by Education by Marriage Status in Lakewood
1.4% of women with births in Lakewood are unmarried. Women with the educational attainment of less than high school are most likely to be married with 100.0% of them married at childbirth, while women with the educational attainment of college or associate's degree are least likely to be married with 6.0% of them unmarried at childbirth.
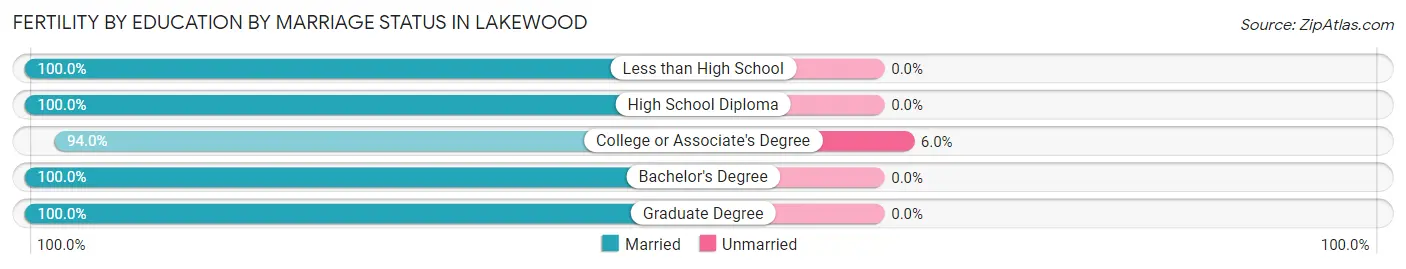
| Educational Attainment | Married | Unmarried |
| Less than High School | 134 (100.0%) | 0 (0.0%) |
| High School Diploma | 1,072 (100.0%) | 0 (0.0%) |
| College or Associate's Degree | 600 (94.0%) | 38 (6.0%) |
| Bachelor's Degree | 291 (100.0%) | 0 (0.0%) |
| Graduate Degree | 614 (100.0%) | 0 (0.0%) |
| Total | 2,711 (98.6%) | 38 (1.4%) |
Employment Characteristics in Lakewood
Employment by Class of Employer in Lakewood
Among the 17,348 employed individuals in Lakewood, private company employees (10,386 | 59.9%), not-for-profit organizations (3,994 | 23.0%), and self-employed (not incorporated) (1,433 | 8.3%) make up the most common classes of employment.
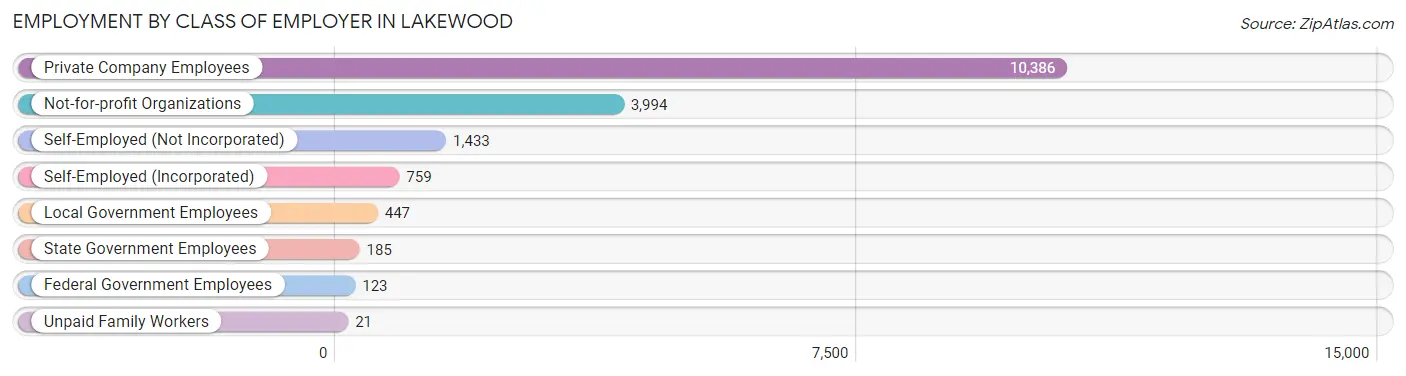
| Employer Class | # Employees | % Employees |
| Private Company Employees | 10,386 | 59.9% |
| Self-Employed (Incorporated) | 759 | 4.4% |
| Self-Employed (Not Incorporated) | 1,433 | 8.3% |
| Not-for-profit Organizations | 3,994 | 23.0% |
| Local Government Employees | 447 | 2.6% |
| State Government Employees | 185 | 1.1% |
| Federal Government Employees | 123 | 0.7% |
| Unpaid Family Workers | 21 | 0.1% |
| Total | 17,348 | 100.0% |
Employment Status by Age in Lakewood
According to the labor force statistics for Lakewood, out of the total population over 16 years of age (36,588), 53.6% or 19,611 individuals are in the labor force, with 6.4% or 1,255 of them unemployed. The age group with the highest labor force participation rate is 45 to 54 years, with 76.6% or 3,508 individuals in the labor force. Within the labor force, the 16 to 19 years age range has the highest percentage of unemployed individuals, with 19.7% or 187 of them being unemployed.
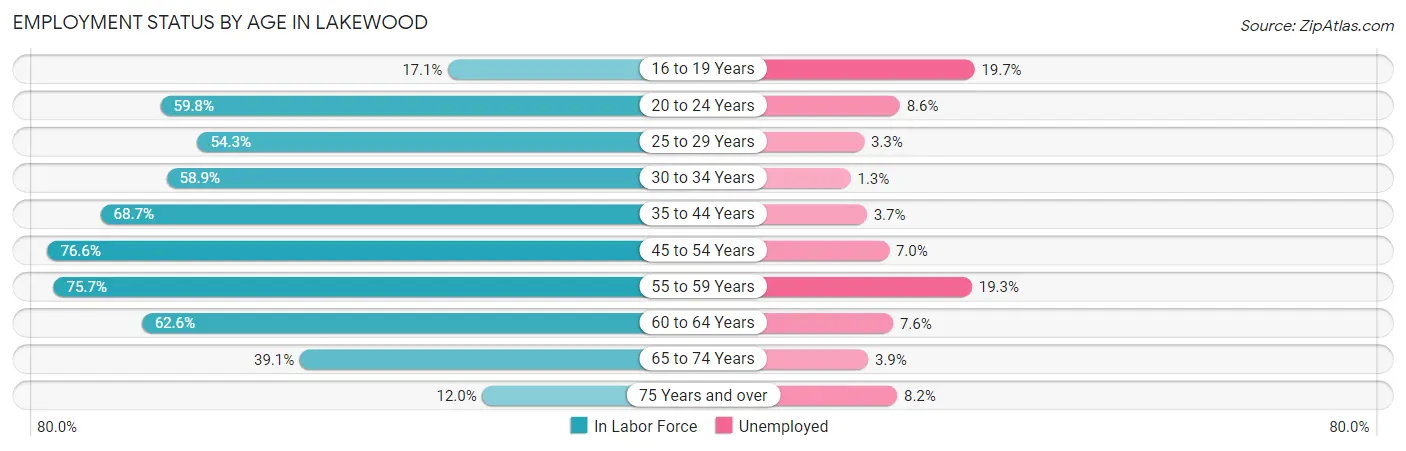
| Age Bracket | In Labor Force | Unemployed |
| 16 to 19 Years | 949 (17.1%) | 187 (19.7%) |
| 20 to 24 Years | 3,420 (59.8%) | 294 (8.6%) |
| 25 to 29 Years | 2,478 (54.3%) | 82 (3.3%) |
| 30 to 34 Years | 1,863 (58.9%) | 24 (1.3%) |
| 35 to 44 Years | 4,756 (68.7%) | 176 (3.7%) |
| 45 to 54 Years | 3,508 (76.6%) | 246 (7.0%) |
| 55 to 59 Years | 675 (75.7%) | 130 (19.3%) |
| 60 to 64 Years | 968 (62.6%) | 74 (7.6%) |
| 65 to 74 Years | 795 (39.1%) | 31 (3.9%) |
| 75 Years and over | 194 (12.0%) | 16 (8.2%) |
| Total | 19,611 (53.6%) | 1,255 (6.4%) |
Employment Status by Educational Attainment in Lakewood
According to labor force statistics for Lakewood, 65.7% of individuals (14,235) out of the total population between 25 and 64 years of age (21,667) are in the labor force, with 5.1% or 726 of them being unemployed. The group with the highest labor force participation rate are those with the educational attainment of bachelor's degree or higher, with 67.3% or 4,915 individuals in the labor force. Within the labor force, individuals with less than high school education have the highest percentage of unemployment, with 7.4% or 96 of them being unemployed.
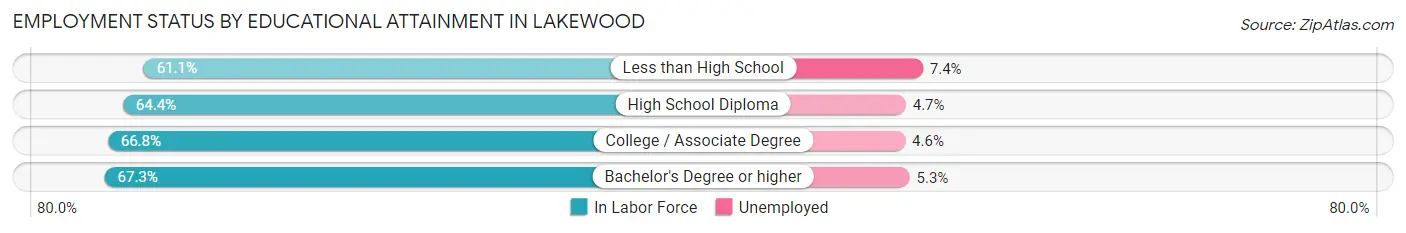
| Educational Attainment | In Labor Force | Unemployed |
| Less than High School | 1,291 (61.1%) | 156 (7.4%) |
| High School Diploma | 3,864 (64.4%) | 282 (4.7%) |
| College / Associate Degree | 4,176 (66.8%) | 288 (4.6%) |
| Bachelor's Degree or higher | 4,915 (67.3%) | 387 (5.3%) |
| Total | 14,235 (65.7%) | 1,105 (5.1%) |
Employment Occupations by Sex in Lakewood
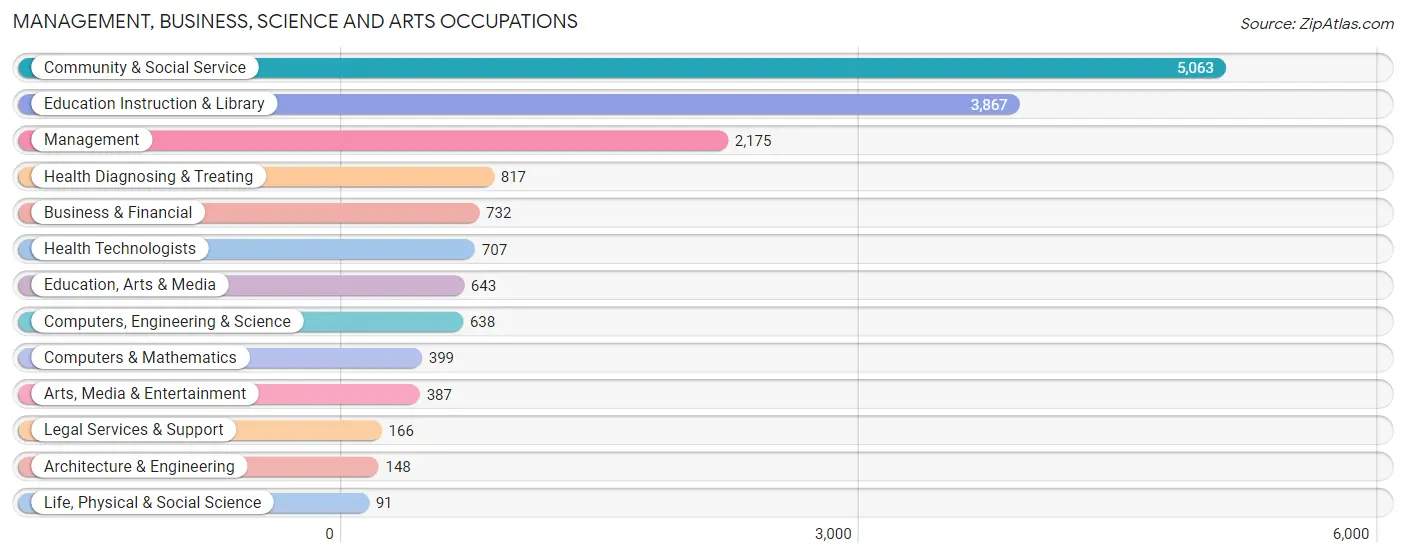
Management, Business, Science and Arts Occupations
The most common Management, Business, Science and Arts occupations in Lakewood are Community & Social Service (5,063 | 27.6%), Education Instruction & Library (3,867 | 21.1%), Management (2,175 | 11.9%), Health Diagnosing & Treating (817 | 4.5%), and Business & Financial (732 | 4.0%).
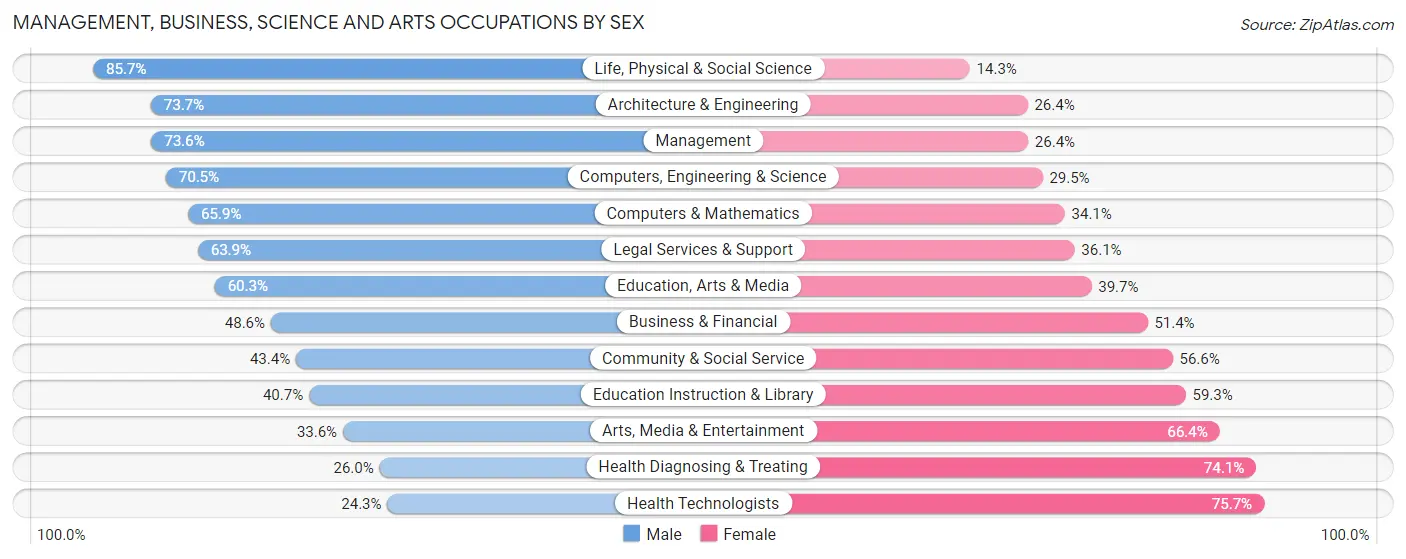
Management, Business, Science and Arts Occupations by Sex
Within the Management, Business, Science and Arts occupations in Lakewood, the most male-oriented occupations are Life, Physical & Social Science (85.7%), Architecture & Engineering (73.7%), and Management (73.6%), while the most female-oriented occupations are Health Technologists (75.7%), Health Diagnosing & Treating (74.1%), and Arts, Media & Entertainment (66.4%).
| Occupation | Male | Female |
| Management | 1,600 (73.6%) | 575 (26.4%) |
| Business & Financial | 356 (48.6%) | 376 (51.4%) |
| Computers, Engineering & Science | 450 (70.5%) | 188 (29.5%) |
| Computers & Mathematics | 263 (65.9%) | 136 (34.1%) |
| Architecture & Engineering | 109 (73.7%) | 39 (26.4%) |
| Life, Physical & Social Science | 78 (85.7%) | 13 (14.3%) |
| Community & Social Service | 2,197 (43.4%) | 2,866 (56.6%) |
| Education, Arts & Media | 388 (60.3%) | 255 (39.7%) |
| Legal Services & Support | 106 (63.9%) | 60 (36.1%) |
| Education Instruction & Library | 1,573 (40.7%) | 2,294 (59.3%) |
| Arts, Media & Entertainment | 130 (33.6%) | 257 (66.4%) |
| Health Diagnosing & Treating | 212 (26.0%) | 605 (74.1%) |
| Health Technologists | 172 (24.3%) | 535 (75.7%) |
| Total (Category) | 4,815 (51.1%) | 4,610 (48.9%) |
| Total (Overall) | 9,211 (50.2%) | 9,120 (49.7%) |
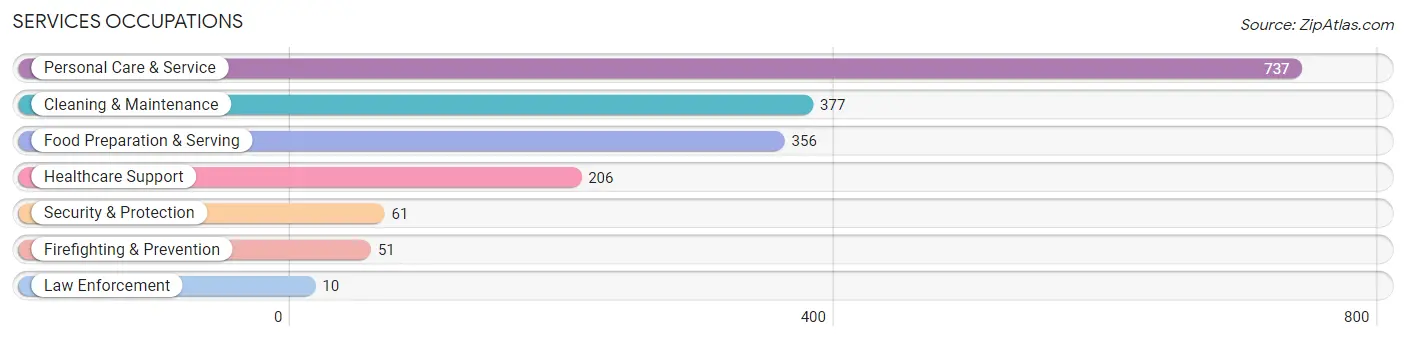
Services Occupations
The most common Services occupations in Lakewood are Personal Care & Service (737 | 4.0%), Cleaning & Maintenance (377 | 2.1%), Food Preparation & Serving (356 | 1.9%), Healthcare Support (206 | 1.1%), and Security & Protection (61 | 0.3%).
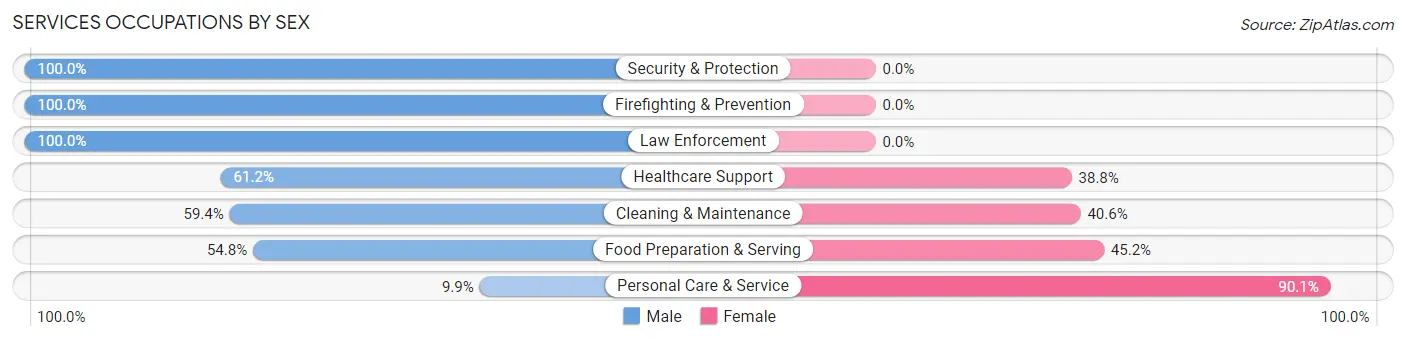
Services Occupations by Sex
Within the Services occupations in Lakewood, the most male-oriented occupations are Security & Protection (100.0%), Firefighting & Prevention (100.0%), and Law Enforcement (100.0%), while the most female-oriented occupations are Personal Care & Service (90.1%), Food Preparation & Serving (45.2%), and Cleaning & Maintenance (40.6%).
| Occupation | Male | Female |
| Healthcare Support | 126 (61.2%) | 80 (38.8%) |
| Security & Protection | 61 (100.0%) | 0 (0.0%) |
| Firefighting & Prevention | 51 (100.0%) | 0 (0.0%) |
| Law Enforcement | 10 (100.0%) | 0 (0.0%) |
| Food Preparation & Serving | 195 (54.8%) | 161 (45.2%) |
| Cleaning & Maintenance | 224 (59.4%) | 153 (40.6%) |
| Personal Care & Service | 73 (9.9%) | 664 (90.1%) |
| Total (Category) | 679 (39.1%) | 1,058 (60.9%) |
| Total (Overall) | 9,211 (50.2%) | 9,120 (49.7%) |
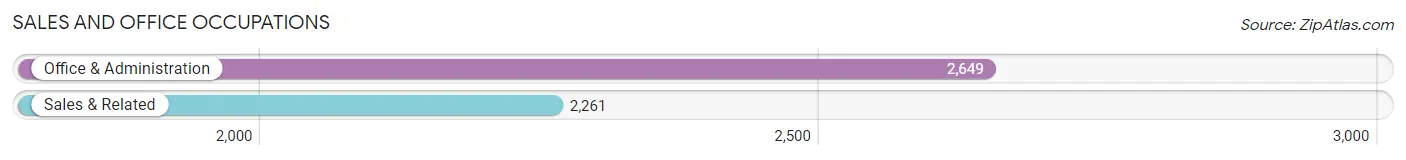
Sales and Office Occupations
The most common Sales and Office occupations in Lakewood are Office & Administration (2,649 | 14.4%), and Sales & Related (2,261 | 12.3%).
Sales and Office Occupations by Sex
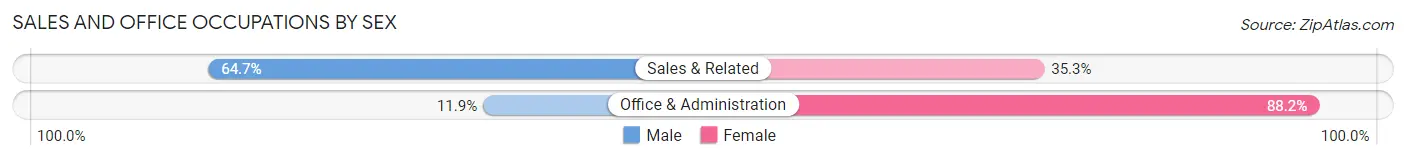
| Occupation | Male | Female |
| Sales & Related | 1,462 (64.7%) | 799 (35.3%) |
| Office & Administration | 314 (11.8%) | 2,335 (88.1%) |
| Total (Category) | 1,776 (36.2%) | 3,134 (63.8%) |
| Total (Overall) | 9,211 (50.2%) | 9,120 (49.7%) |
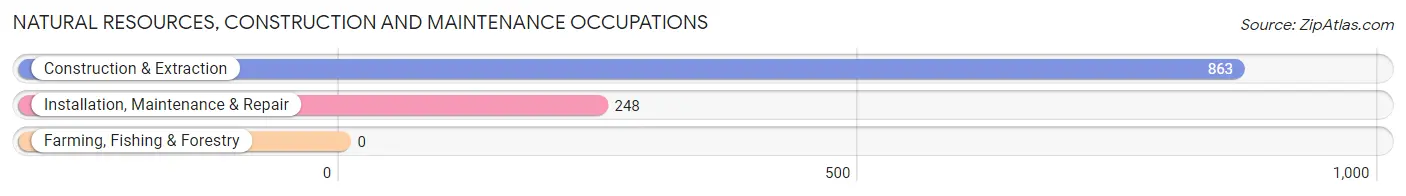
Natural Resources, Construction and Maintenance Occupations
The most common Natural Resources, Construction and Maintenance occupations in Lakewood are Construction & Extraction (863 | 4.7%), and Installation, Maintenance & Repair (248 | 1.3%).
Natural Resources, Construction and Maintenance Occupations by Sex
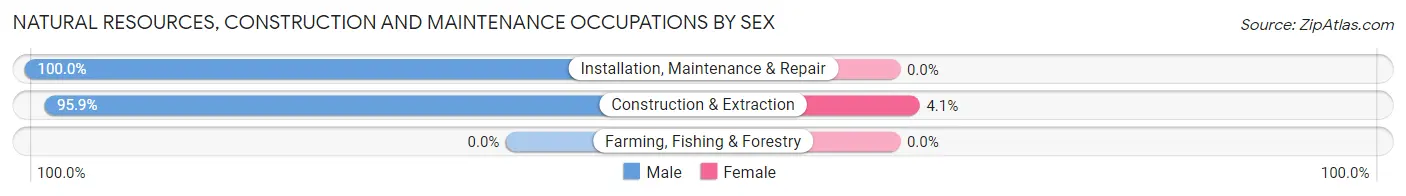
| Occupation | Male | Female |
| Farming, Fishing & Forestry | 0 (0.0%) | 0 (0.0%) |
| Construction & Extraction | 828 (95.9%) | 35 (4.1%) |
| Installation, Maintenance & Repair | 248 (100.0%) | 0 (0.0%) |
| Total (Category) | 1,076 (96.9%) | 35 (3.2%) |
| Total (Overall) | 9,211 (50.2%) | 9,120 (49.7%) |
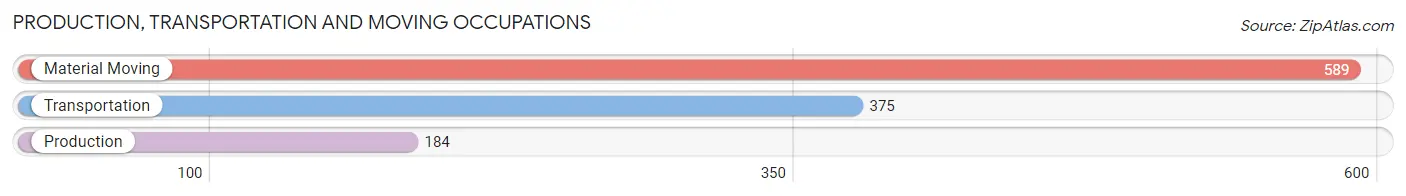
Production, Transportation and Moving Occupations
The most common Production, Transportation and Moving occupations in Lakewood are Material Moving (589 | 3.2%), Transportation (375 | 2.1%), and Production (184 | 1.0%).
Production, Transportation and Moving Occupations by Sex
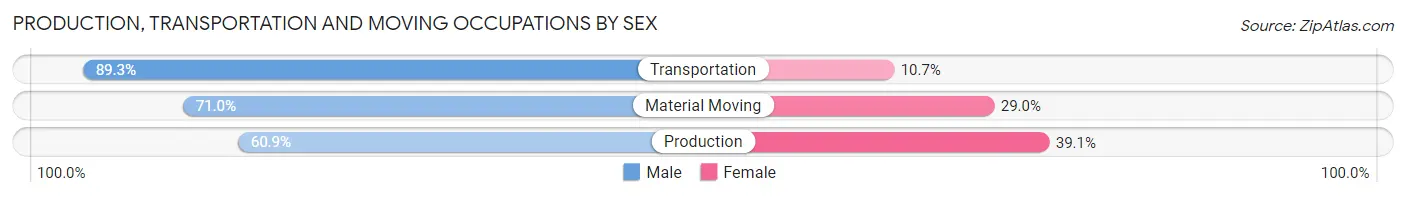
| Occupation | Male | Female |
| Production | 112 (60.9%) | 72 (39.1%) |
| Transportation | 335 (89.3%) | 40 (10.7%) |
| Material Moving | 418 (71.0%) | 171 (29.0%) |
| Total (Category) | 865 (75.3%) | 283 (24.6%) |
| Total (Overall) | 9,211 (50.2%) | 9,120 (49.7%) |
Employment Industries by Sex in Lakewood
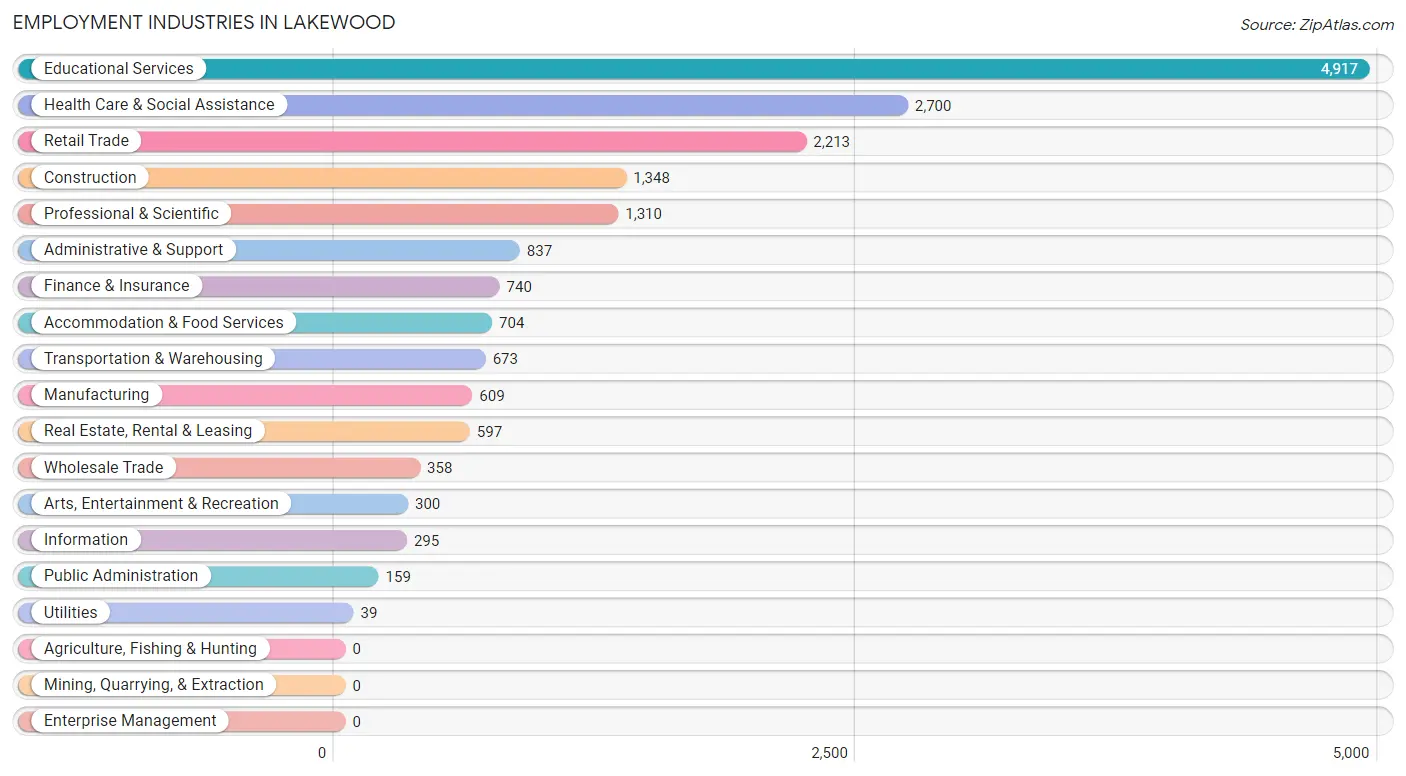
Employment Industries in Lakewood
The major employment industries in Lakewood include Educational Services (4,917 | 26.8%), Health Care & Social Assistance (2,700 | 14.7%), Retail Trade (2,213 | 12.1%), Construction (1,348 | 7.3%), and Professional & Scientific (1,310 | 7.1%).
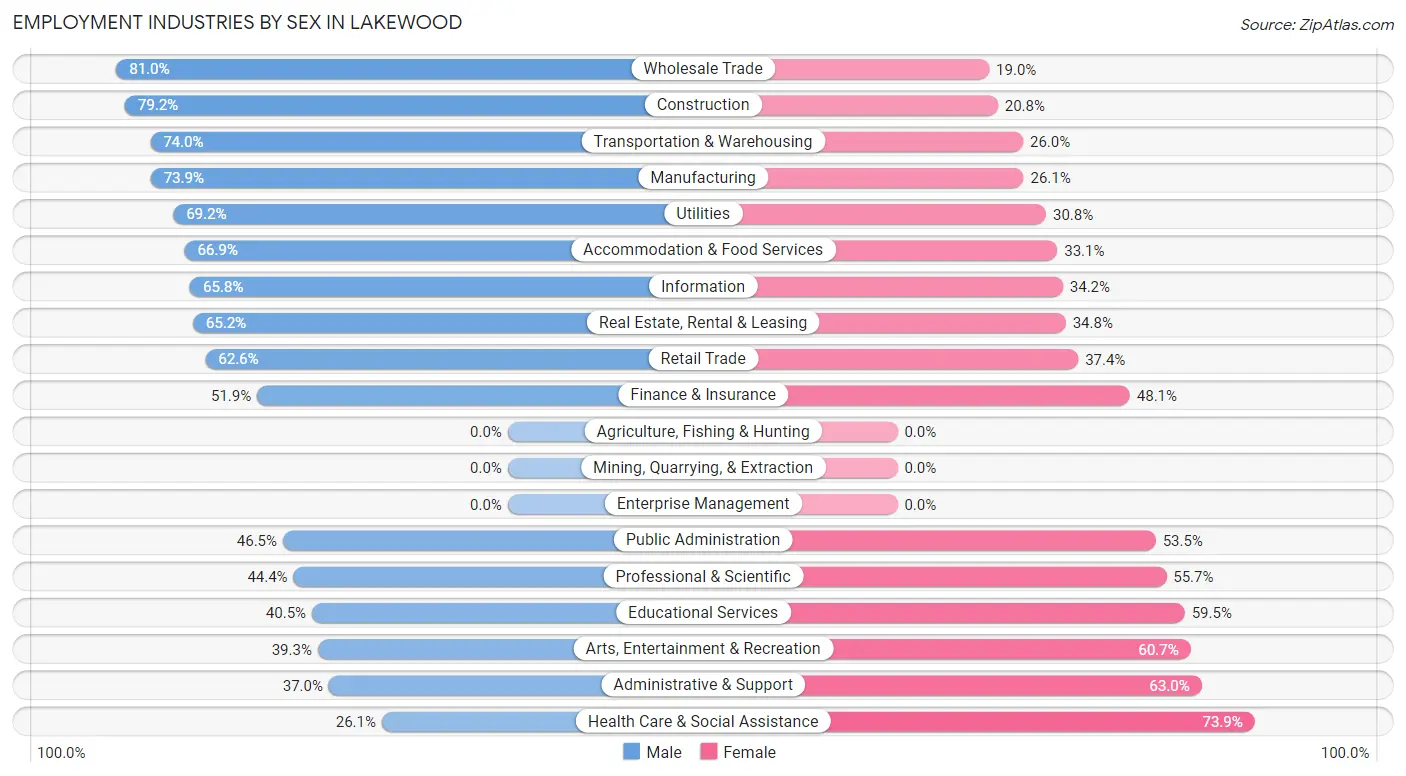
Employment Industries by Sex in Lakewood
The Lakewood industries that see more men than women are Wholesale Trade (81.0%), Construction (79.2%), and Transportation & Warehousing (74.0%), whereas the industries that tend to have a higher number of women are Health Care & Social Assistance (73.9%), Administrative & Support (63.0%), and Arts, Entertainment & Recreation (60.7%).
| Industry | Male | Female |
| Agriculture, Fishing & Hunting | 0 (0.0%) | 0 (0.0%) |
| Mining, Quarrying, & Extraction | 0 (0.0%) | 0 (0.0%) |
| Construction | 1,068 (79.2%) | 280 (20.8%) |
| Manufacturing | 450 (73.9%) | 159 (26.1%) |
| Wholesale Trade | 290 (81.0%) | 68 (19.0%) |
| Retail Trade | 1,385 (62.6%) | 828 (37.4%) |
| Transportation & Warehousing | 498 (74.0%) | 175 (26.0%) |
| Utilities | 27 (69.2%) | 12 (30.8%) |
| Information | 194 (65.8%) | 101 (34.2%) |
| Finance & Insurance | 384 (51.9%) | 356 (48.1%) |
| Real Estate, Rental & Leasing | 389 (65.2%) | 208 (34.8%) |
| Professional & Scientific | 581 (44.4%) | 729 (55.6%) |
| Enterprise Management | 0 (0.0%) | 0 (0.0%) |
| Administrative & Support | 310 (37.0%) | 527 (63.0%) |
| Educational Services | 1,993 (40.5%) | 2,924 (59.5%) |
| Health Care & Social Assistance | 704 (26.1%) | 1,996 (73.9%) |
| Arts, Entertainment & Recreation | 118 (39.3%) | 182 (60.7%) |
| Accommodation & Food Services | 471 (66.9%) | 233 (33.1%) |
| Public Administration | 74 (46.5%) | 85 (53.5%) |
| Total | 9,211 (50.2%) | 9,120 (49.7%) |
Education in Lakewood
School Enrollment in Lakewood
The most common levels of schooling among the 32,978 students in Lakewood are elementary school (7,833 | 23.7%), middle school (7,498 | 22.7%), and high school (6,260 | 19.0%).
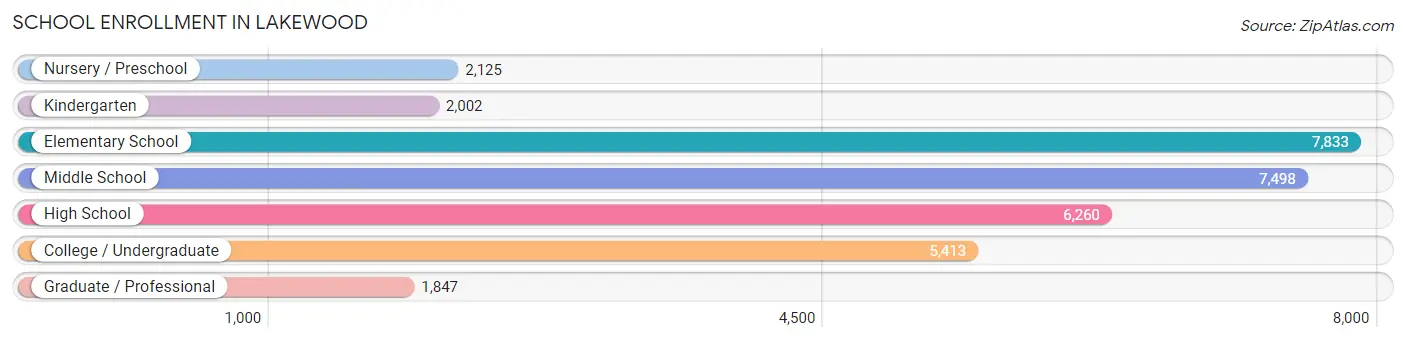
| School Level | # Students | % Students |
| Nursery / Preschool | 2,125 | 6.4% |
| Kindergarten | 2,002 | 6.1% |
| Elementary School | 7,833 | 23.7% |
| Middle School | 7,498 | 22.7% |
| High School | 6,260 | 19.0% |
| College / Undergraduate | 5,413 | 16.4% |
| Graduate / Professional | 1,847 | 5.6% |
| Total | 32,978 | 100.0% |
School Enrollment by Age by Funding Source in Lakewood
Out of a total of 32,978 students who are enrolled in schools in Lakewood, 28,889 (87.6%) attend a private institution, while the remaining 4,089 (12.4%) are enrolled in public schools. The age group of 35 years and over has the highest likelihood of being enrolled in private schools, with 851 (96.9% in the age bracket) enrolled. Conversely, the age group of 10 to 14 year olds has the lowest likelihood of being enrolled in a private school, with 1,431 (16.2% in the age bracket) attending a public institution.
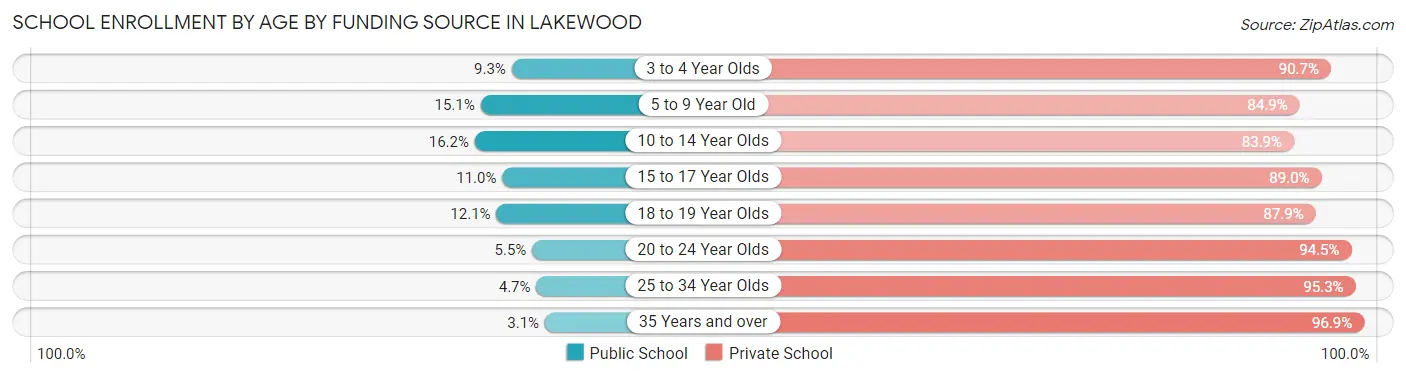
| Age Bracket | Public School | Private School |
| 3 to 4 Year Olds | 199 (9.3%) | 1,948 (90.7%) |
| 5 to 9 Year Old | 1,409 (15.1%) | 7,935 (84.9%) |
| 10 to 14 Year Olds | 1,431 (16.2%) | 7,428 (83.9%) |
| 15 to 17 Year Olds | 551 (11.0%) | 4,450 (89.0%) |
| 18 to 19 Year Olds | 217 (12.1%) | 1,573 (87.9%) |
| 20 to 24 Year Olds | 133 (5.5%) | 2,305 (94.5%) |
| 25 to 34 Year Olds | 118 (4.7%) | 2,403 (95.3%) |
| 35 Years and over | 27 (3.1%) | 851 (96.9%) |
| Total | 4,089 (12.4%) | 28,889 (87.6%) |
Educational Attainment by Field of Study in Lakewood
Liberal arts & history (3,050 | 34.9%), education (1,471 | 16.8%), business (903 | 10.3%), science & technology (599 | 6.9%), and social sciences (535 | 6.1%) are the most common fields of study among 8,748 individuals in Lakewood who have obtained a bachelor's degree or higher.
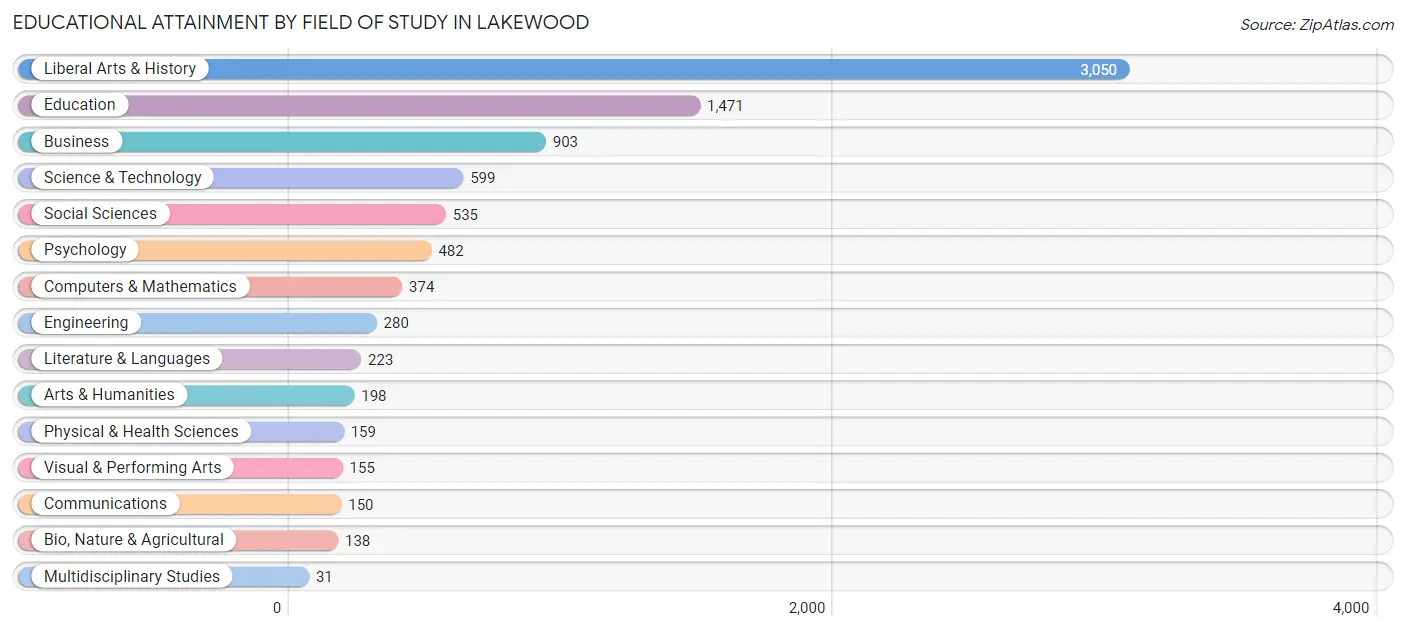
| Field of Study | # Graduates | % Graduates |
| Computers & Mathematics | 374 | 4.3% |
| Bio, Nature & Agricultural | 138 | 1.6% |
| Physical & Health Sciences | 159 | 1.8% |
| Psychology | 482 | 5.5% |
| Social Sciences | 535 | 6.1% |
| Engineering | 280 | 3.2% |
| Multidisciplinary Studies | 31 | 0.4% |
| Science & Technology | 599 | 6.9% |
| Business | 903 | 10.3% |
| Education | 1,471 | 16.8% |
| Literature & Languages | 223 | 2.5% |
| Liberal Arts & History | 3,050 | 34.9% |
| Visual & Performing Arts | 155 | 1.8% |
| Communications | 150 | 1.7% |
| Arts & Humanities | 198 | 2.3% |
| Total | 8,748 | 100.0% |
Transportation & Commute in Lakewood
Vehicle Availability by Sex in Lakewood
The most prevalent vehicle ownership categories in Lakewood are males with 2 vehicles (4,334, accounting for 49.8%) and females with 2 vehicles (4,071, making up 51.7%).
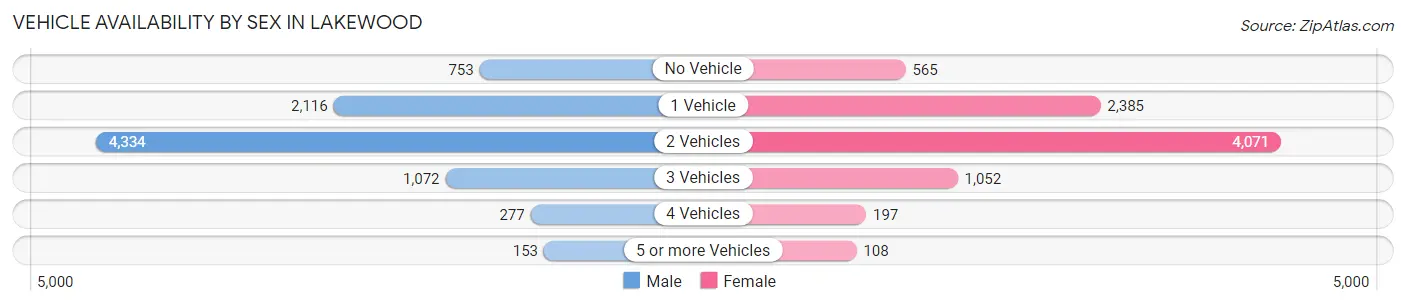
| Vehicles Available | Male | Female |
| No Vehicle | 753 (8.6%) | 565 (6.7%) |
| 1 Vehicle | 2,116 (24.3%) | 2,385 (28.5%) |
| 2 Vehicles | 4,334 (49.8%) | 4,071 (48.6%) |
| 3 Vehicles | 1,072 (12.3%) | 1,052 (12.6%) |
| 4 Vehicles | 277 (3.2%) | 197 (2.4%) |
| 5 or more Vehicles | 153 (1.8%) | 108 (1.3%) |
| Total | 8,705 (100.0%) | 8,378 (100.0%) |
Commute Time in Lakewood
The most frequently occuring commute durations in Lakewood are 10 to 14 minutes (3,918 commuters, 25.9%), 15 to 19 minutes (3,342 commuters, 22.1%), and 5 to 9 minutes (2,565 commuters, 17.0%).
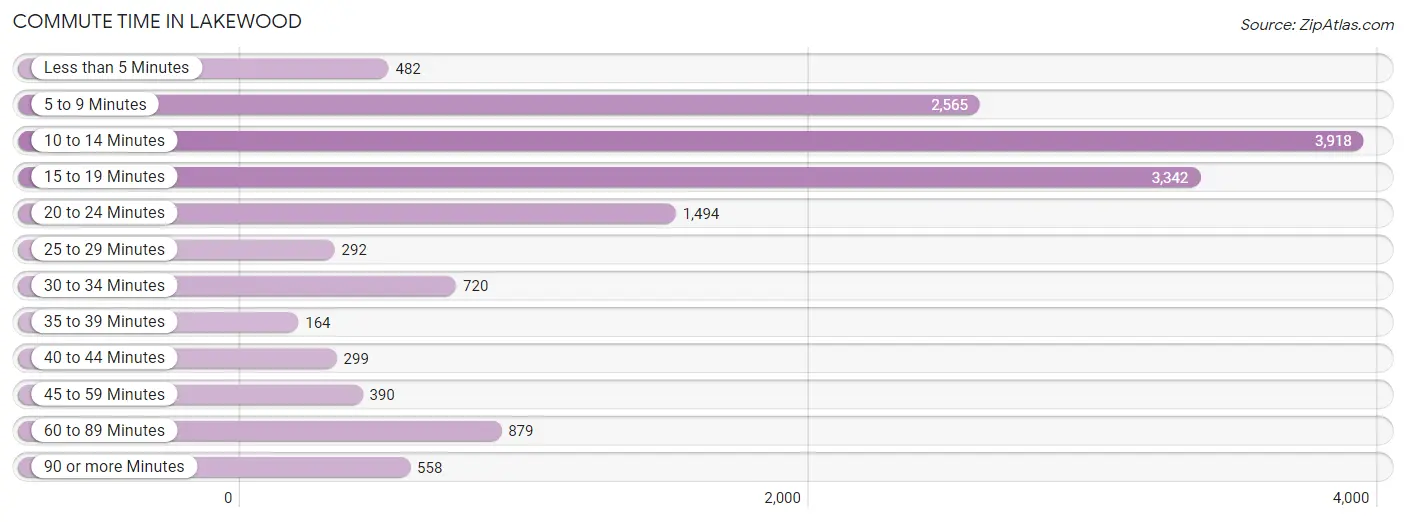
| Commute Time | # Commuters | % Commuters |
| Less than 5 Minutes | 482 | 3.2% |
| 5 to 9 Minutes | 2,565 | 17.0% |
| 10 to 14 Minutes | 3,918 | 25.9% |
| 15 to 19 Minutes | 3,342 | 22.1% |
| 20 to 24 Minutes | 1,494 | 9.9% |
| 25 to 29 Minutes | 292 | 1.9% |
| 30 to 34 Minutes | 720 | 4.8% |
| 35 to 39 Minutes | 164 | 1.1% |
| 40 to 44 Minutes | 299 | 2.0% |
| 45 to 59 Minutes | 390 | 2.6% |
| 60 to 89 Minutes | 879 | 5.8% |
| 90 or more Minutes | 558 | 3.7% |
Commute Time by Sex in Lakewood
The most common commute times in Lakewood are 15 to 19 minutes (2,021 commuters, 24.9%) for males and 10 to 14 minutes (2,280 commuters, 32.6%) for females.
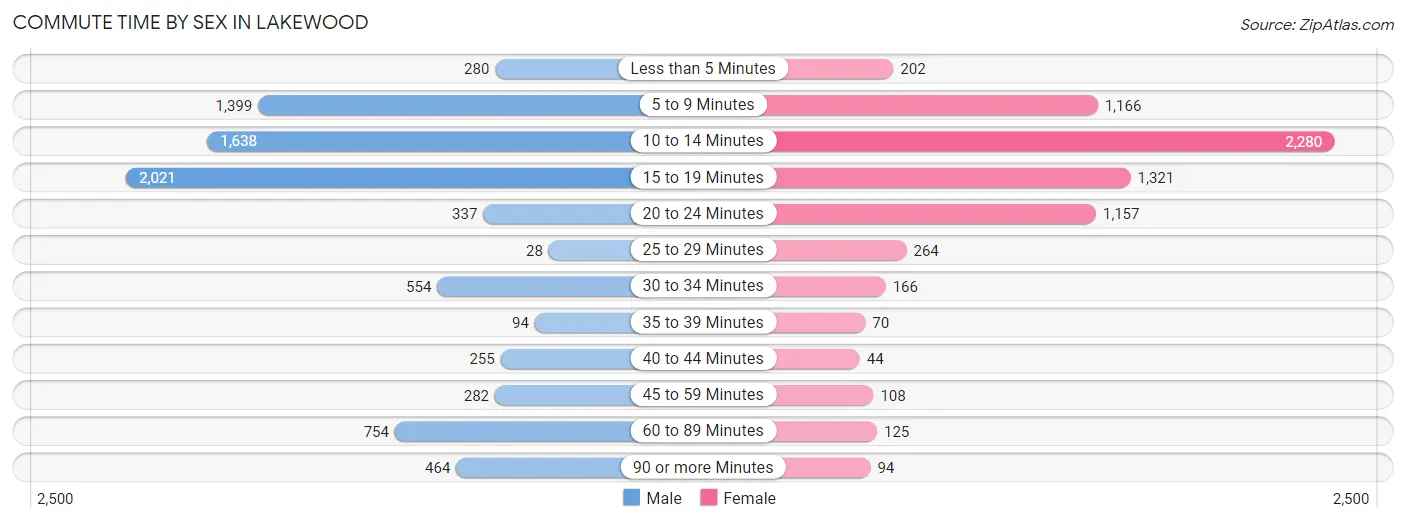
| Commute Time | Male | Female |
| Less than 5 Minutes | 280 (3.5%) | 202 (2.9%) |
| 5 to 9 Minutes | 1,399 (17.3%) | 1,166 (16.7%) |
| 10 to 14 Minutes | 1,638 (20.2%) | 2,280 (32.6%) |
| 15 to 19 Minutes | 2,021 (24.9%) | 1,321 (18.9%) |
| 20 to 24 Minutes | 337 (4.2%) | 1,157 (16.5%) |
| 25 to 29 Minutes | 28 (0.4%) | 264 (3.8%) |
| 30 to 34 Minutes | 554 (6.8%) | 166 (2.4%) |
| 35 to 39 Minutes | 94 (1.2%) | 70 (1.0%) |
| 40 to 44 Minutes | 255 (3.2%) | 44 (0.6%) |
| 45 to 59 Minutes | 282 (3.5%) | 108 (1.5%) |
| 60 to 89 Minutes | 754 (9.3%) | 125 (1.8%) |
| 90 or more Minutes | 464 (5.7%) | 94 (1.3%) |
Time of Departure to Work by Sex in Lakewood
The most frequent times of departure to work in Lakewood are 9:00 AM to 9:59 AM (1,724, 21.3%) for males and 8:30 AM to 8:59 AM (2,266, 32.4%) for females.
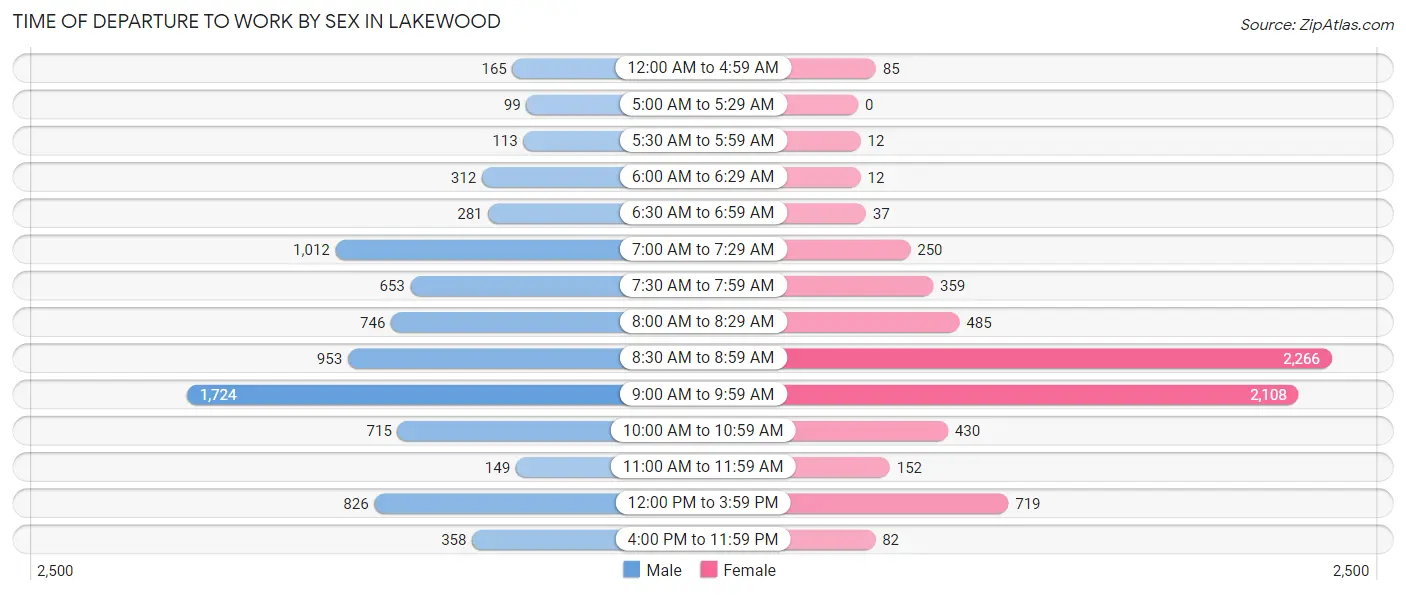
| Time of Departure | Male | Female |
| 12:00 AM to 4:59 AM | 165 (2.0%) | 85 (1.2%) |
| 5:00 AM to 5:29 AM | 99 (1.2%) | 0 (0.0%) |
| 5:30 AM to 5:59 AM | 113 (1.4%) | 12 (0.2%) |
| 6:00 AM to 6:29 AM | 312 (3.8%) | 12 (0.2%) |
| 6:30 AM to 6:59 AM | 281 (3.5%) | 37 (0.5%) |
| 7:00 AM to 7:29 AM | 1,012 (12.5%) | 250 (3.6%) |
| 7:30 AM to 7:59 AM | 653 (8.1%) | 359 (5.1%) |
| 8:00 AM to 8:29 AM | 746 (9.2%) | 485 (6.9%) |
| 8:30 AM to 8:59 AM | 953 (11.8%) | 2,266 (32.4%) |
| 9:00 AM to 9:59 AM | 1,724 (21.3%) | 2,108 (30.1%) |
| 10:00 AM to 10:59 AM | 715 (8.8%) | 430 (6.1%) |
| 11:00 AM to 11:59 AM | 149 (1.8%) | 152 (2.2%) |
| 12:00 PM to 3:59 PM | 826 (10.2%) | 719 (10.3%) |
| 4:00 PM to 11:59 PM | 358 (4.4%) | 82 (1.2%) |
| Total | 8,106 (100.0%) | 6,997 (100.0%) |
Housing Occupancy in Lakewood
Occupancy by Ownership in Lakewood
Of the total 13,518 dwellings in Lakewood, owner-occupied units account for 5,222 (38.6%), while renter-occupied units make up 8,296 (61.4%).
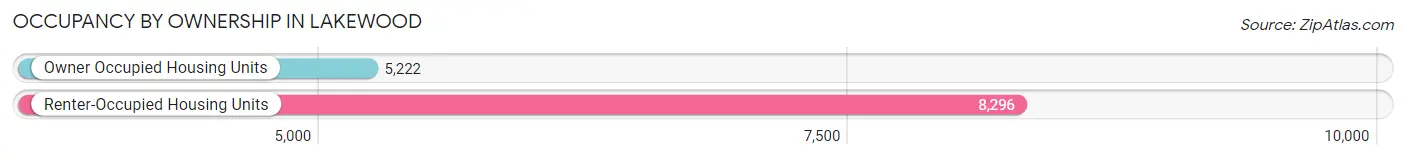
| Occupancy | # Housing Units | % Housing Units |
| Owner Occupied Housing Units | 5,222 | 38.6% |
| Renter-Occupied Housing Units | 8,296 | 61.4% |
| Total Occupied Housing Units | 13,518 | 100.0% |
Occupancy by Household Size in Lakewood
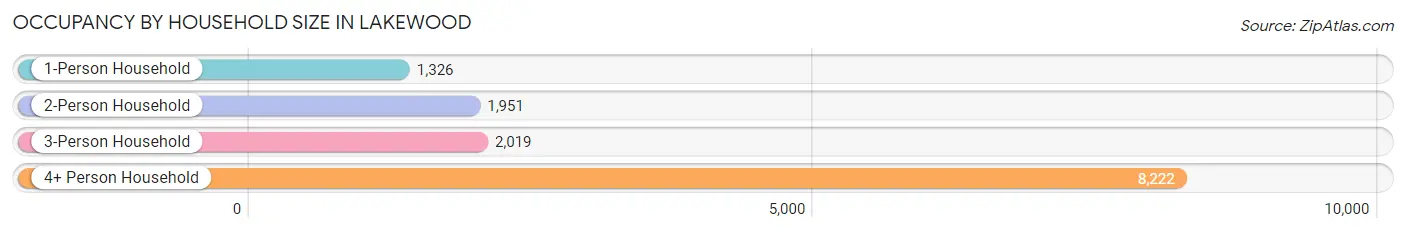
| Household Size | # Housing Units | % Housing Units |
| 1-Person Household | 1,326 | 9.8% |
| 2-Person Household | 1,951 | 14.4% |
| 3-Person Household | 2,019 | 14.9% |
| 4+ Person Household | 8,222 | 60.8% |
| Total Housing Units | 13,518 | 100.0% |
Occupancy by Ownership by Household Size in Lakewood
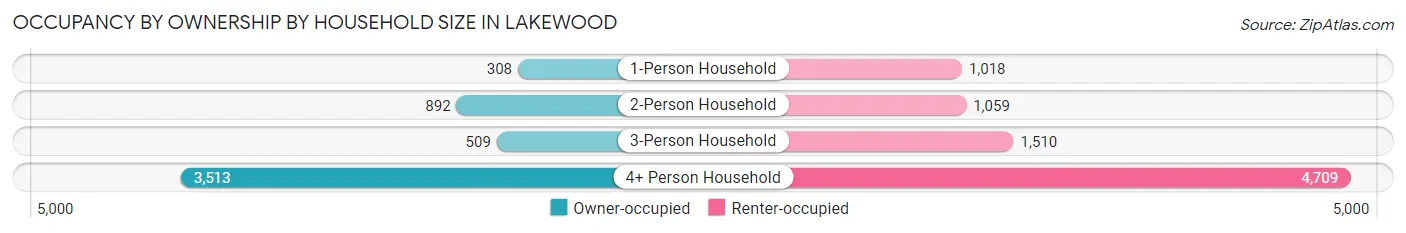
| Household Size | Owner-occupied | Renter-occupied |
| 1-Person Household | 308 (23.2%) | 1,018 (76.8%) |
| 2-Person Household | 892 (45.7%) | 1,059 (54.3%) |
| 3-Person Household | 509 (25.2%) | 1,510 (74.8%) |
| 4+ Person Household | 3,513 (42.7%) | 4,709 (57.3%) |
| Total Housing Units | 5,222 (38.6%) | 8,296 (61.4%) |
Occupancy by Educational Attainment in Lakewood
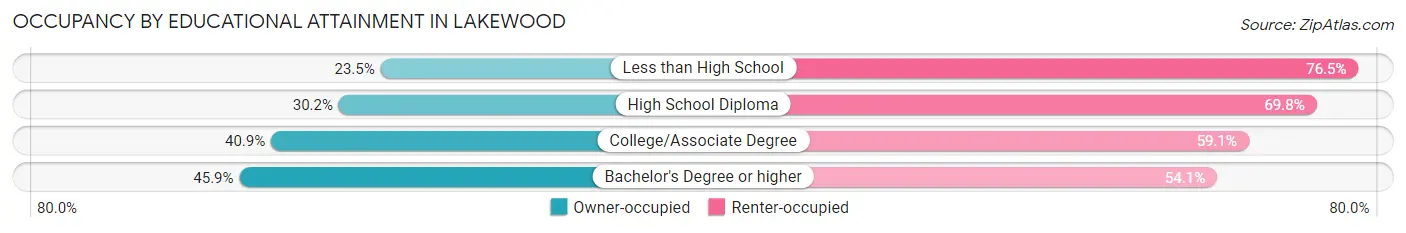
| Household Size | Owner-occupied | Renter-occupied |
| Less than High School | 302 (23.5%) | 981 (76.5%) |
| High School Diploma | 934 (30.2%) | 2,162 (69.8%) |
| College/Associate Degree | 1,725 (40.9%) | 2,492 (59.1%) |
| Bachelor's Degree or higher | 2,261 (45.9%) | 2,661 (54.1%) |
Occupancy by Age of Householder in Lakewood
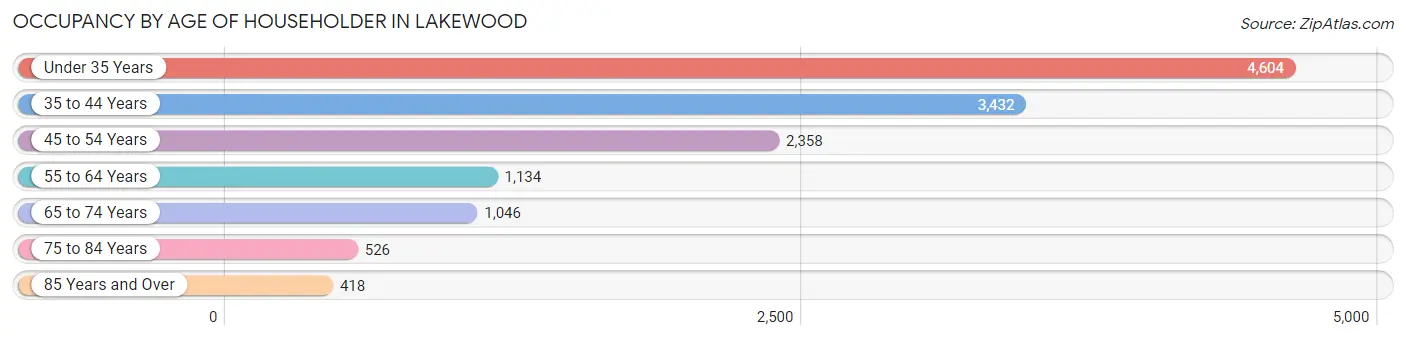
| Age Bracket | # Households | % Households |
| Under 35 Years | 4,604 | 34.1% |
| 35 to 44 Years | 3,432 | 25.4% |
| 45 to 54 Years | 2,358 | 17.4% |
| 55 to 64 Years | 1,134 | 8.4% |
| 65 to 74 Years | 1,046 | 7.7% |
| 75 to 84 Years | 526 | 3.9% |
| 85 Years and Over | 418 | 3.1% |
| Total | 13,518 | 100.0% |
Housing Finances in Lakewood
Median Income by Occupancy in Lakewood
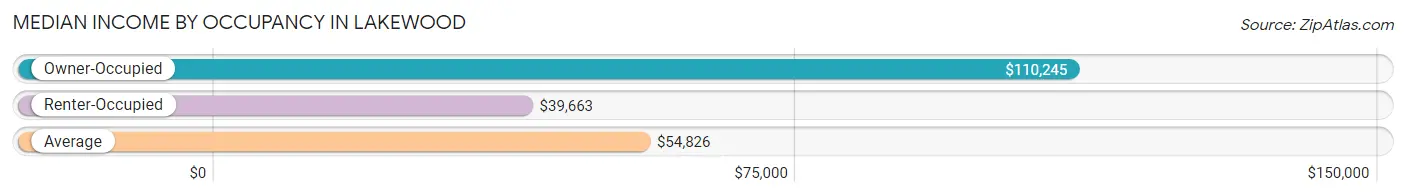
| Occupancy Type | # Households | Median Income |
| Owner-Occupied | 5,222 (38.6%) | $110,245 |
| Renter-Occupied | 8,296 (61.4%) | $39,663 |
| Average | 13,518 (100.0%) | $54,826 |
Occupancy by Householder Income Bracket in Lakewood
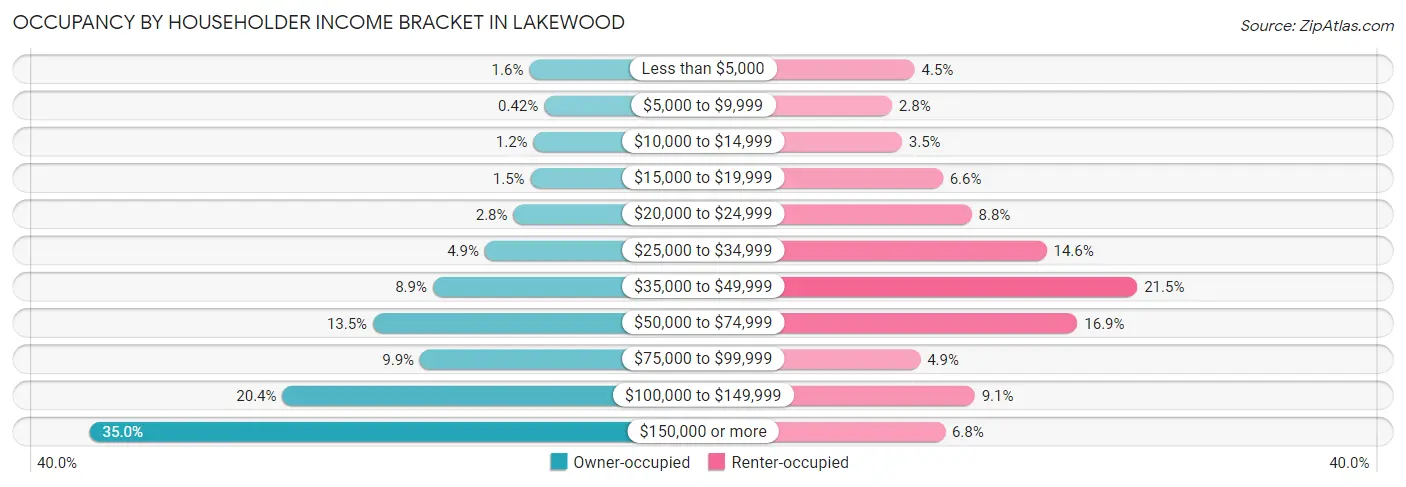
| Income Bracket | Owner-occupied | Renter-occupied |
| Less than $5,000 | 81 (1.5%) | 373 (4.5%) |
| $5,000 to $9,999 | 22 (0.4%) | 230 (2.8%) |
| $10,000 to $14,999 | 64 (1.2%) | 293 (3.5%) |
| $15,000 to $19,999 | 76 (1.5%) | 551 (6.6%) |
| $20,000 to $24,999 | 144 (2.8%) | 733 (8.8%) |
| $25,000 to $34,999 | 258 (4.9%) | 1,207 (14.5%) |
| $35,000 to $49,999 | 465 (8.9%) | 1,780 (21.5%) |
| $50,000 to $74,999 | 703 (13.5%) | 1,402 (16.9%) |
| $75,000 to $99,999 | 516 (9.9%) | 409 (4.9%) |
| $100,000 to $149,999 | 1,063 (20.4%) | 753 (9.1%) |
| $150,000 or more | 1,830 (35.0%) | 565 (6.8%) |
| Total | 5,222 (100.0%) | 8,296 (100.0%) |
Monthly Housing Cost Tiers in Lakewood
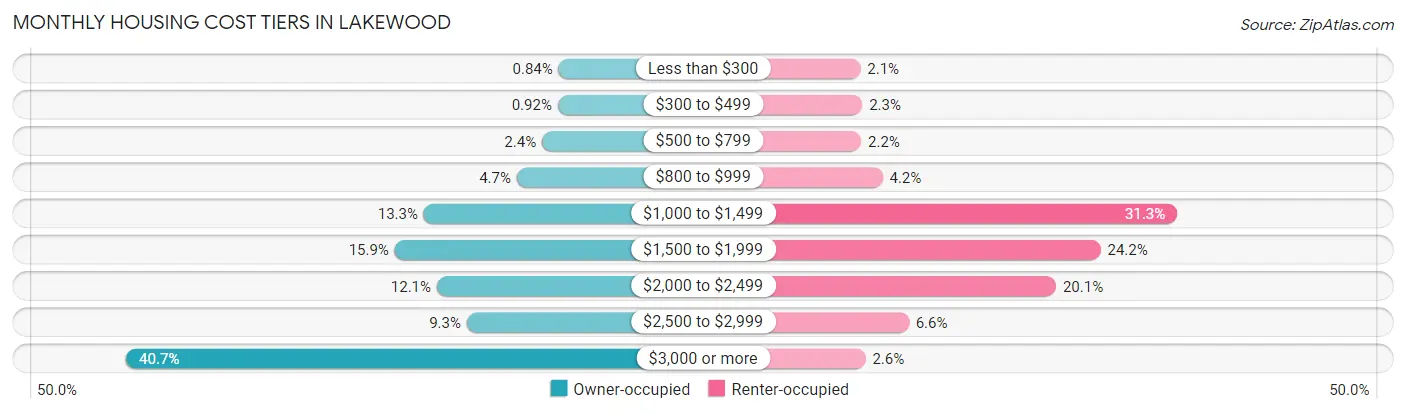
| Monthly Cost | Owner-occupied | Renter-occupied |
| Less than $300 | 44 (0.8%) | 175 (2.1%) |
| $300 to $499 | 48 (0.9%) | 189 (2.3%) |
| $500 to $799 | 124 (2.4%) | 181 (2.2%) |
| $800 to $999 | 245 (4.7%) | 344 (4.2%) |
| $1,000 to $1,499 | 692 (13.3%) | 2,594 (31.3%) |
| $1,500 to $1,999 | 832 (15.9%) | 2,009 (24.2%) |
| $2,000 to $2,499 | 629 (12.0%) | 1,669 (20.1%) |
| $2,500 to $2,999 | 485 (9.3%) | 544 (6.6%) |
| $3,000 or more | 2,123 (40.6%) | 214 (2.6%) |
| Total | 5,222 (100.0%) | 8,296 (100.0%) |
Physical Housing Characteristics in Lakewood
Housing Structures in Lakewood
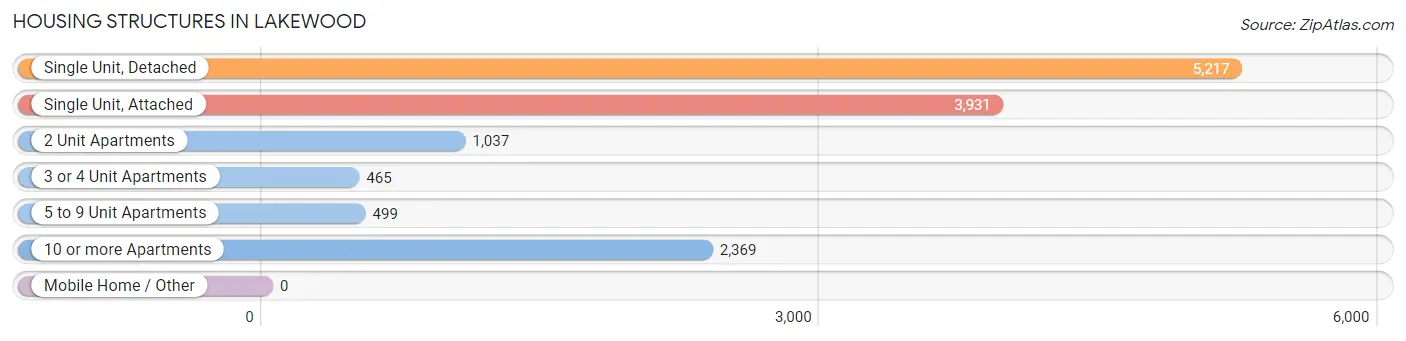
| Structure Type | # Housing Units | % Housing Units |
| Single Unit, Detached | 5,217 | 38.6% |
| Single Unit, Attached | 3,931 | 29.1% |
| 2 Unit Apartments | 1,037 | 7.7% |
| 3 or 4 Unit Apartments | 465 | 3.4% |
| 5 to 9 Unit Apartments | 499 | 3.7% |
| 10 or more Apartments | 2,369 | 17.5% |
| Mobile Home / Other | 0 | 0.0% |
| Total | 13,518 | 100.0% |
Housing Structures by Occupancy in Lakewood
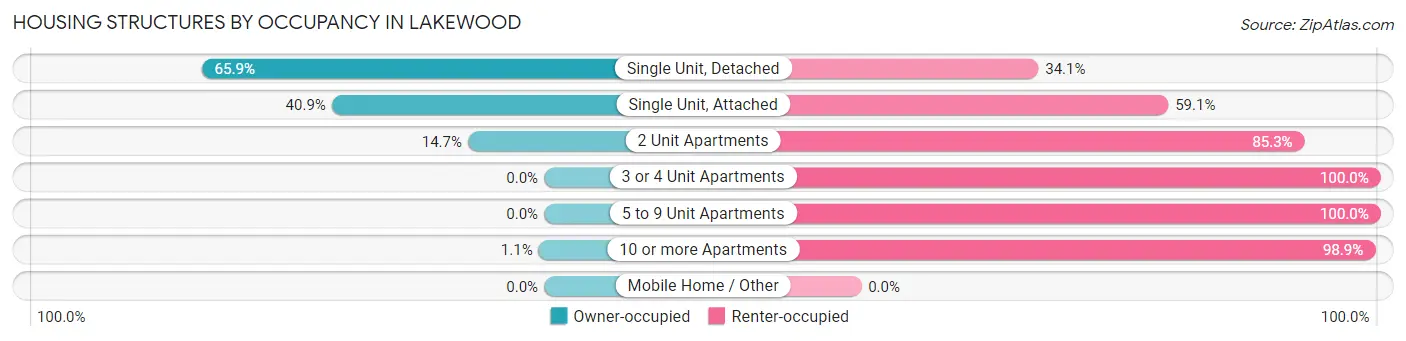
| Structure Type | Owner-occupied | Renter-occupied |
| Single Unit, Detached | 3,438 (65.9%) | 1,779 (34.1%) |
| Single Unit, Attached | 1,607 (40.9%) | 2,324 (59.1%) |
| 2 Unit Apartments | 152 (14.7%) | 885 (85.3%) |
| 3 or 4 Unit Apartments | 0 (0.0%) | 465 (100.0%) |
| 5 to 9 Unit Apartments | 0 (0.0%) | 499 (100.0%) |
| 10 or more Apartments | 25 (1.1%) | 2,344 (98.9%) |
| Mobile Home / Other | 0 (0.0%) | 0 (0.0%) |
| Total | 5,222 (38.6%) | 8,296 (61.4%) |
Housing Structures by Number of Rooms in Lakewood
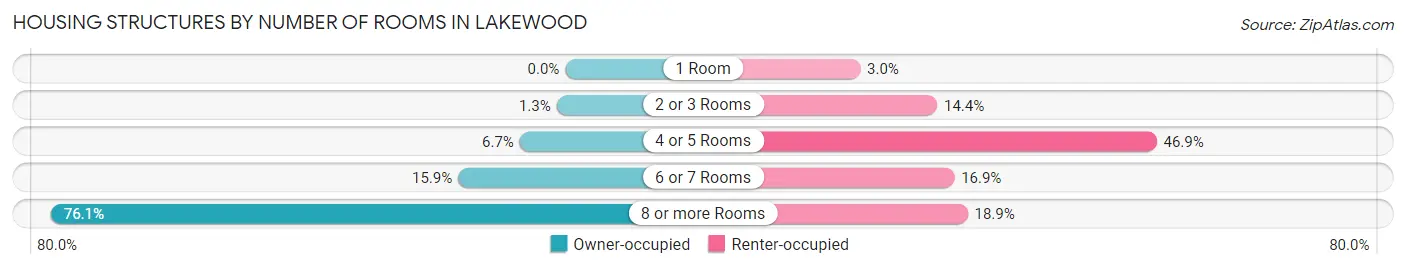
| Number of Rooms | Owner-occupied | Renter-occupied |
| 1 Room | 0 (0.0%) | 247 (3.0%) |
| 2 or 3 Rooms | 67 (1.3%) | 1,192 (14.4%) |
| 4 or 5 Rooms | 352 (6.7%) | 3,887 (46.9%) |
| 6 or 7 Rooms | 828 (15.9%) | 1,403 (16.9%) |
| 8 or more Rooms | 3,975 (76.1%) | 1,567 (18.9%) |
| Total | 5,222 (100.0%) | 8,296 (100.0%) |
Housing Structure by Heating Type in Lakewood
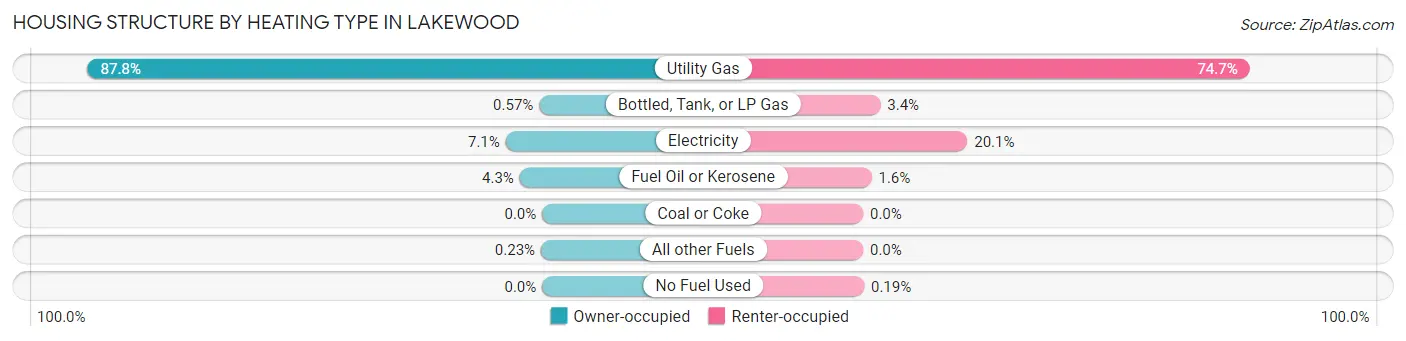
| Heating Type | Owner-occupied | Renter-occupied |
| Utility Gas | 4,586 (87.8%) | 6,195 (74.7%) |
| Bottled, Tank, or LP Gas | 30 (0.6%) | 278 (3.4%) |
| Electricity | 368 (7.0%) | 1,671 (20.1%) |
| Fuel Oil or Kerosene | 226 (4.3%) | 136 (1.6%) |
| Coal or Coke | 0 (0.0%) | 0 (0.0%) |
| All other Fuels | 12 (0.2%) | 0 (0.0%) |
| No Fuel Used | 0 (0.0%) | 16 (0.2%) |
| Total | 5,222 (100.0%) | 8,296 (100.0%) |
Household Vehicle Usage in Lakewood
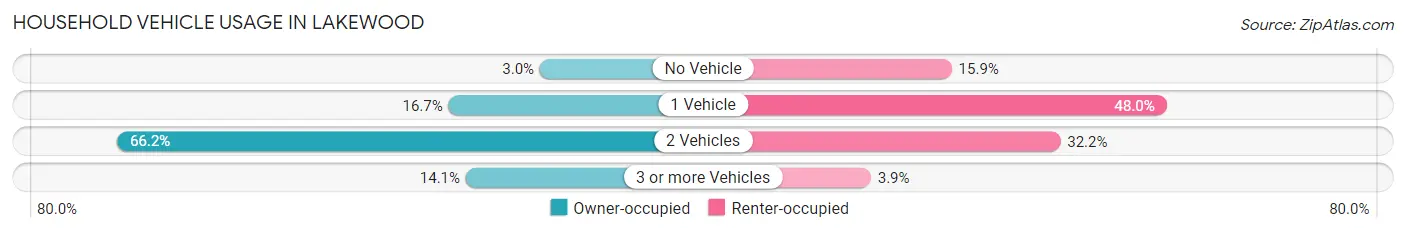
| Vehicles per Household | Owner-occupied | Renter-occupied |
| No Vehicle | 158 (3.0%) | 1,322 (15.9%) |
| 1 Vehicle | 871 (16.7%) | 3,985 (48.0%) |
| 2 Vehicles | 3,457 (66.2%) | 2,669 (32.2%) |
| 3 or more Vehicles | 736 (14.1%) | 320 (3.9%) |
| Total | 5,222 (100.0%) | 8,296 (100.0%) |
Real Estate & Mortgages in Lakewood
Real Estate and Mortgage Overview in Lakewood
| Characteristic | Without Mortgage | With Mortgage |
| Housing Units | 1,826 | 3,396 |
| Median Property Value | $582,100 | $625,800 |
| Median Household Income | $91,014 | $1,374 |
| Monthly Housing Costs | $1,393 | $2,123 |
| Real Estate Taxes | $10,001 | $101 |
Property Value by Mortgage Status in Lakewood
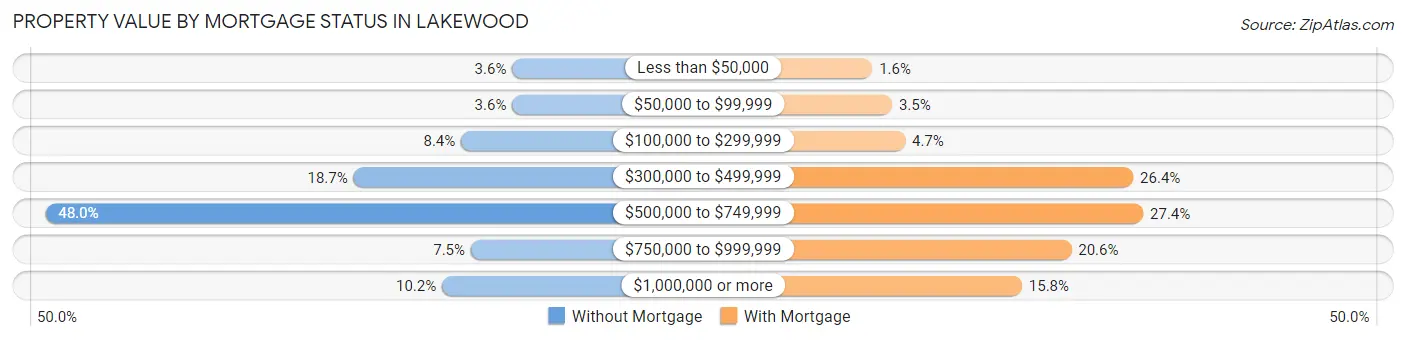
| Property Value | Without Mortgage | With Mortgage |
| Less than $50,000 | 65 (3.6%) | 54 (1.6%) |
| $50,000 to $99,999 | 65 (3.6%) | 118 (3.5%) |
| $100,000 to $299,999 | 154 (8.4%) | 160 (4.7%) |
| $300,000 to $499,999 | 341 (18.7%) | 898 (26.4%) |
| $500,000 to $749,999 | 877 (48.0%) | 930 (27.4%) |
| $750,000 to $999,999 | 137 (7.5%) | 698 (20.5%) |
| $1,000,000 or more | 187 (10.2%) | 538 (15.8%) |
| Total | 1,826 (100.0%) | 3,396 (100.0%) |
Household Income by Mortgage Status in Lakewood
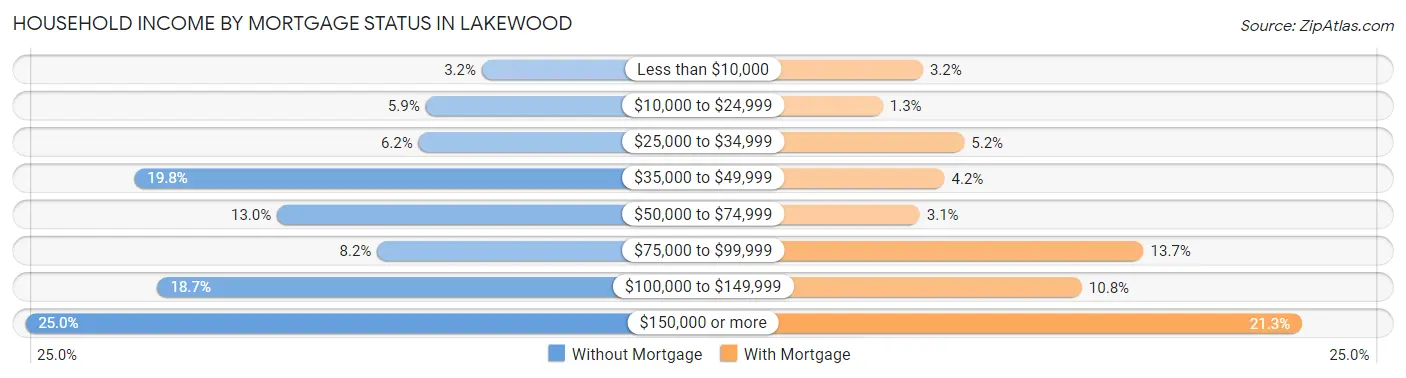
| Household Income | Without Mortgage | With Mortgage |
| Less than $10,000 | 59 (3.2%) | 109 (3.2%) |
| $10,000 to $24,999 | 108 (5.9%) | 44 (1.3%) |
| $25,000 to $34,999 | 114 (6.2%) | 176 (5.2%) |
| $35,000 to $49,999 | 361 (19.8%) | 144 (4.2%) |
| $50,000 to $74,999 | 237 (13.0%) | 104 (3.1%) |
| $75,000 to $99,999 | 150 (8.2%) | 466 (13.7%) |
| $100,000 to $149,999 | 341 (18.7%) | 366 (10.8%) |
| $150,000 or more | 456 (25.0%) | 722 (21.3%) |
| Total | 1,826 (100.0%) | 3,396 (100.0%) |
Property Value to Household Income Ratio in Lakewood
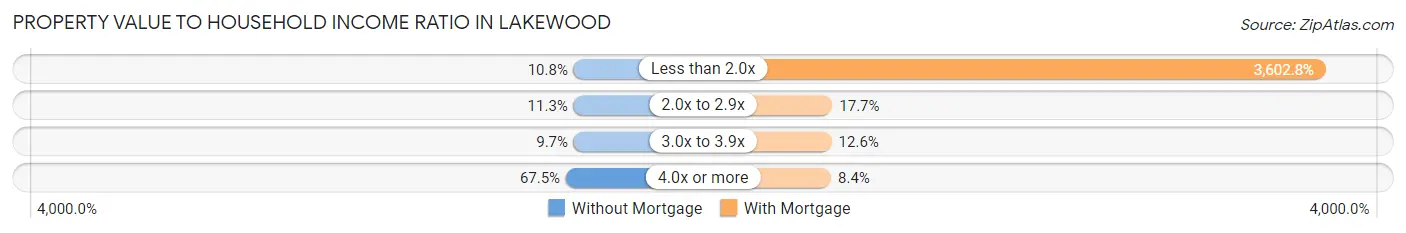
| Value-to-Income Ratio | Without Mortgage | With Mortgage |
| Less than 2.0x | 198 (10.8%) | 122,351 (3,602.8%) |
| 2.0x to 2.9x | 207 (11.3%) | 602 (17.7%) |
| 3.0x to 3.9x | 177 (9.7%) | 429 (12.6%) |
| 4.0x or more | 1,232 (67.5%) | 286 (8.4%) |
| Total | 1,826 (100.0%) | 3,396 (100.0%) |
Real Estate Taxes by Mortgage Status in Lakewood
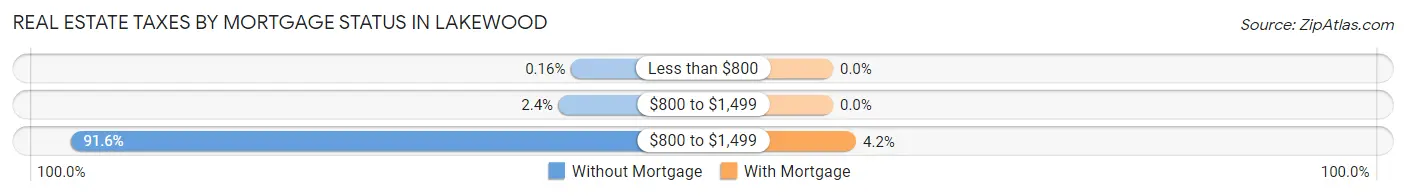
| Property Taxes | Without Mortgage | With Mortgage |
| Less than $800 | 3 (0.2%) | 0 (0.0%) |
| $800 to $1,499 | 44 (2.4%) | 0 (0.0%) |
| $800 to $1,499 | 1,673 (91.6%) | 143 (4.2%) |
| Total | 1,826 (100.0%) | 3,396 (100.0%) |
Health & Disability in Lakewood
Health Insurance Coverage by Age in Lakewood
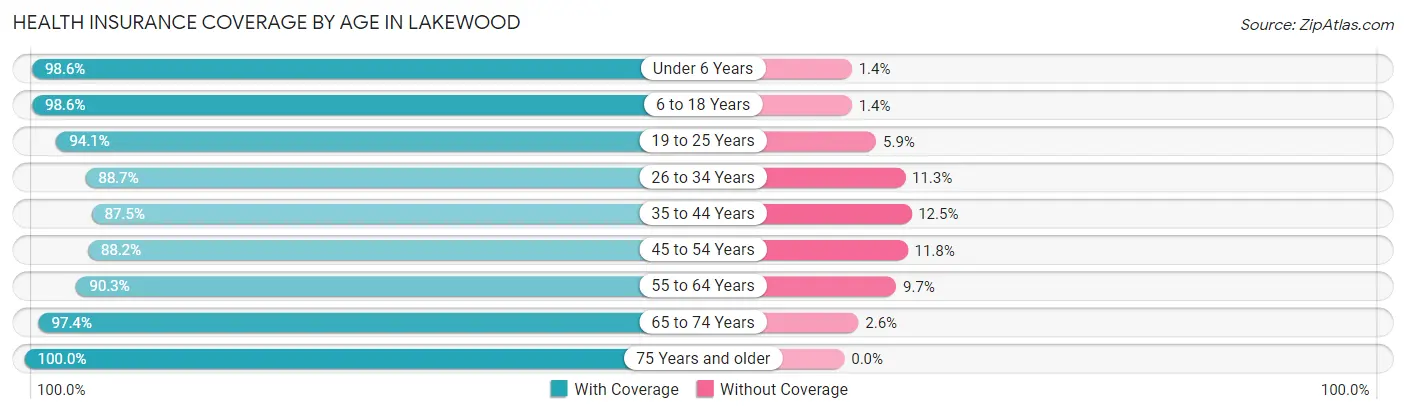
| Age Bracket | With Coverage | Without Coverage |
| Under 6 Years | 13,266 (98.6%) | 186 (1.4%) |
| 6 to 18 Years | 22,347 (98.6%) | 316 (1.4%) |
| 19 to 25 Years | 7,568 (94.1%) | 477 (5.9%) |
| 26 to 34 Years | 6,020 (88.7%) | 769 (11.3%) |
| 35 to 44 Years | 6,050 (87.5%) | 863 (12.5%) |
| 45 to 54 Years | 4,028 (88.2%) | 539 (11.8%) |
| 55 to 64 Years | 2,150 (90.3%) | 230 (9.7%) |
| 65 to 74 Years | 1,820 (97.4%) | 49 (2.6%) |
| 75 Years and older | 1,421 (100.0%) | 0 (0.0%) |
| Total | 64,670 (95.0%) | 3,429 (5.0%) |
Health Insurance Coverage by Citizenship Status in Lakewood
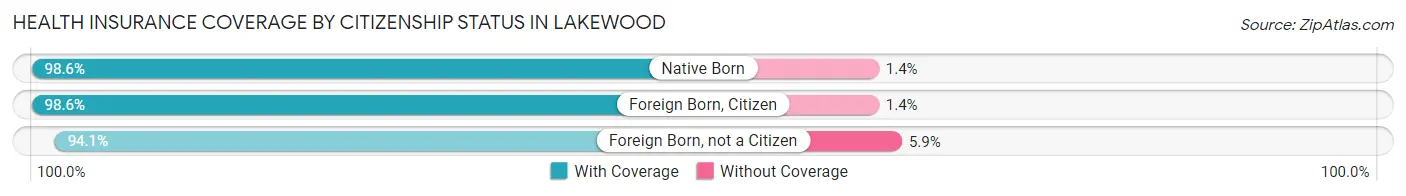
| Citizenship Status | With Coverage | Without Coverage |
| Native Born | 13,266 (98.6%) | 186 (1.4%) |
| Foreign Born, Citizen | 22,347 (98.6%) | 316 (1.4%) |
| Foreign Born, not a Citizen | 7,568 (94.1%) | 477 (5.9%) |
Health Insurance Coverage by Household Income in Lakewood
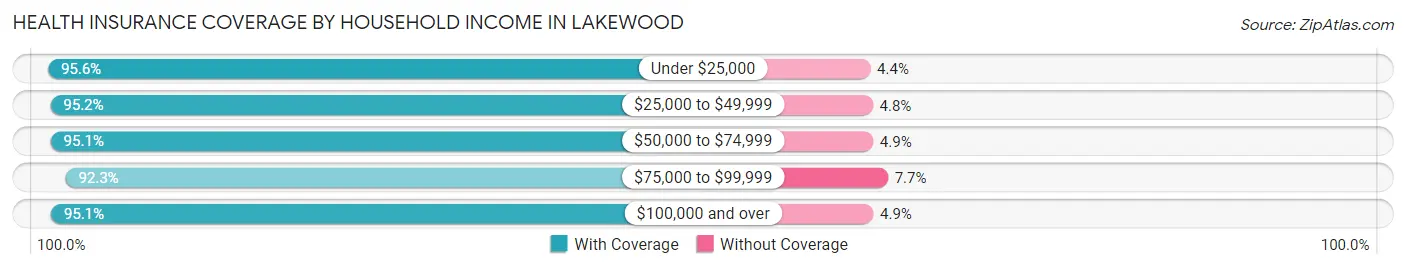
| Household Income | With Coverage | Without Coverage |
| Under $25,000 | 8,315 (95.6%) | 381 (4.4%) |
| $25,000 to $49,999 | 16,245 (95.2%) | 824 (4.8%) |
| $50,000 to $74,999 | 10,400 (95.1%) | 535 (4.9%) |
| $75,000 to $99,999 | 5,144 (92.3%) | 427 (7.7%) |
| $100,000 and over | 23,345 (95.1%) | 1,210 (4.9%) |
Public vs Private Health Insurance Coverage by Age in Lakewood
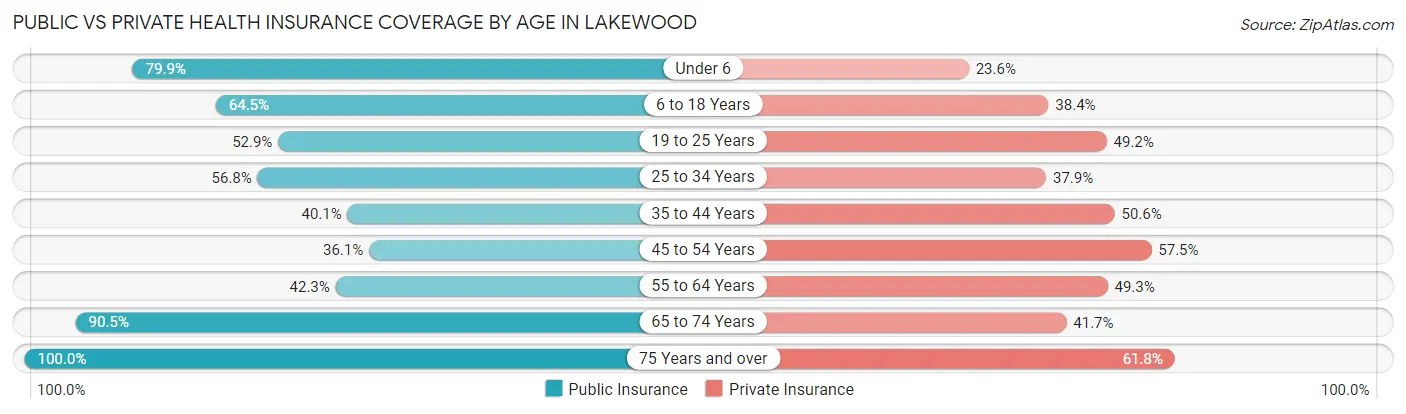
| Age Bracket | Public Insurance | Private Insurance |
| Under 6 | 10,753 (79.9%) | 3,169 (23.6%) |
| 6 to 18 Years | 14,616 (64.5%) | 8,691 (38.4%) |
| 19 to 25 Years | 4,258 (52.9%) | 3,954 (49.1%) |
| 25 to 34 Years | 3,853 (56.8%) | 2,574 (37.9%) |
| 35 to 44 Years | 2,769 (40.1%) | 3,500 (50.6%) |
| 45 to 54 Years | 1,647 (36.1%) | 2,624 (57.5%) |
| 55 to 64 Years | 1,006 (42.3%) | 1,174 (49.3%) |
| 65 to 74 Years | 1,692 (90.5%) | 779 (41.7%) |
| 75 Years and over | 1,421 (100.0%) | 878 (61.8%) |
| Total | 42,015 (61.7%) | 27,343 (40.2%) |
Disability Status by Sex by Age in Lakewood
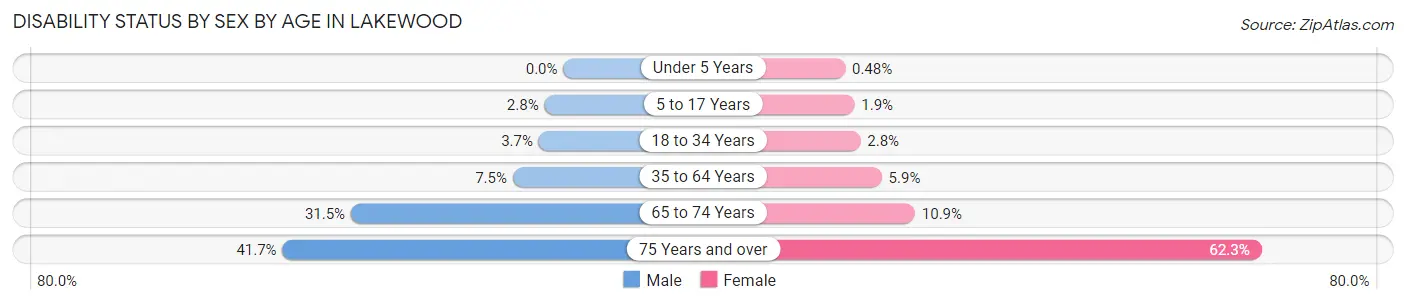
| Age Bracket | Male | Female |
| Under 5 Years | 0 (0.0%) | 25 (0.5%) |
| 5 to 17 Years | 332 (2.8%) | 221 (1.9%) |
| 18 to 34 Years | 293 (3.6%) | 212 (2.8%) |
| 35 to 64 Years | 567 (7.5%) | 373 (5.9%) |
| 65 to 74 Years | 258 (31.5%) | 114 (10.8%) |
| 75 Years and over | 254 (41.7%) | 506 (62.3%) |
Disability Class by Sex by Age in Lakewood
Disability Class: Hearing Difficulty
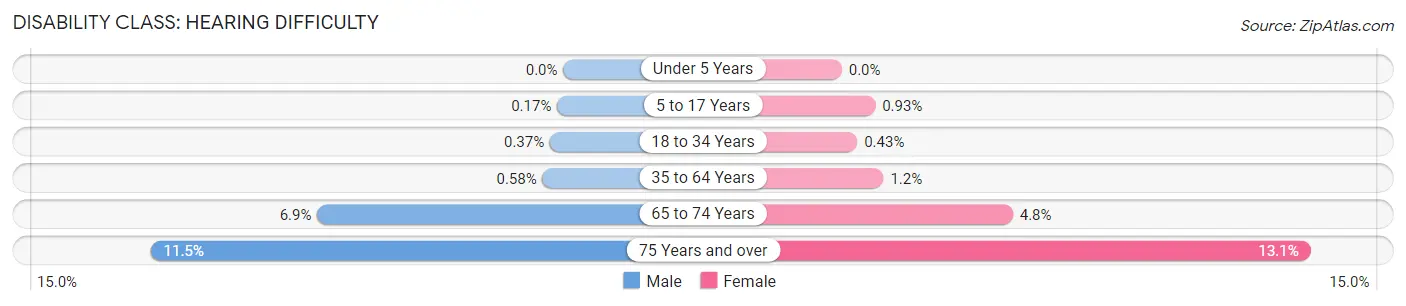
| Age Bracket | Male | Female |
| Under 5 Years | 0 (0.0%) | 0 (0.0%) |
| 5 to 17 Years | 20 (0.2%) | 110 (0.9%) |
| 18 to 34 Years | 30 (0.4%) | 33 (0.4%) |
| 35 to 64 Years | 44 (0.6%) | 73 (1.2%) |
| 65 to 74 Years | 56 (6.9%) | 50 (4.8%) |
| 75 Years and over | 70 (11.5%) | 106 (13.1%) |
Disability Class: Vision Difficulty
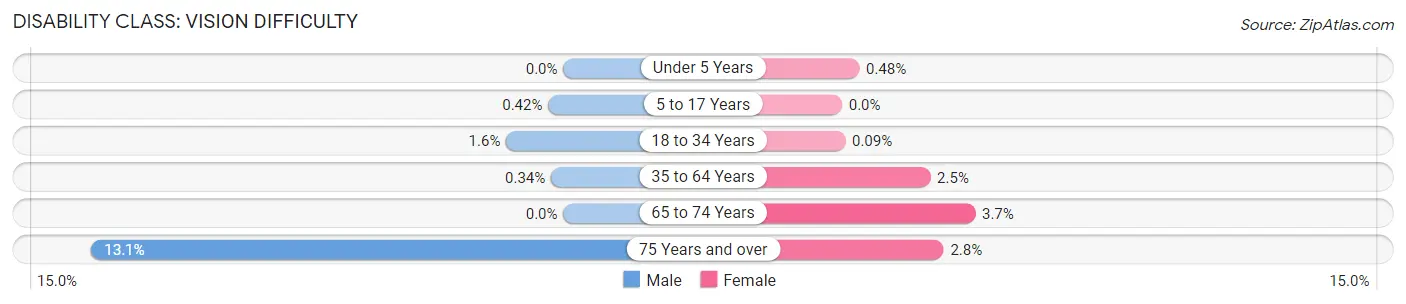
| Age Bracket | Male | Female |
| Under 5 Years | 0 (0.0%) | 25 (0.5%) |
| 5 to 17 Years | 50 (0.4%) | 0 (0.0%) |
| 18 to 34 Years | 128 (1.6%) | 7 (0.1%) |
| 35 to 64 Years | 26 (0.3%) | 155 (2.5%) |
| 65 to 74 Years | 0 (0.0%) | 39 (3.7%) |
| 75 Years and over | 80 (13.1%) | 23 (2.8%) |
Disability Class: Cognitive Difficulty
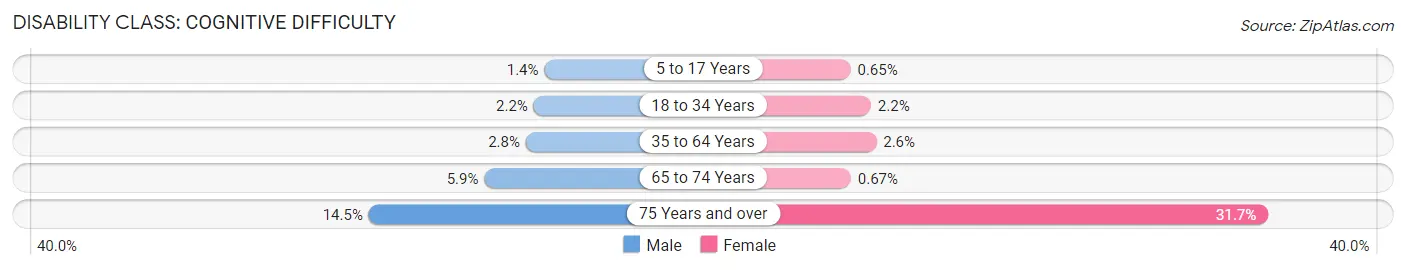
| Age Bracket | Male | Female |
| 5 to 17 Years | 167 (1.4%) | 77 (0.6%) |
| 18 to 34 Years | 177 (2.2%) | 166 (2.2%) |
| 35 to 64 Years | 211 (2.8%) | 161 (2.6%) |
| 65 to 74 Years | 48 (5.9%) | 7 (0.7%) |
| 75 Years and over | 88 (14.4%) | 257 (31.7%) |
Disability Class: Ambulatory Difficulty
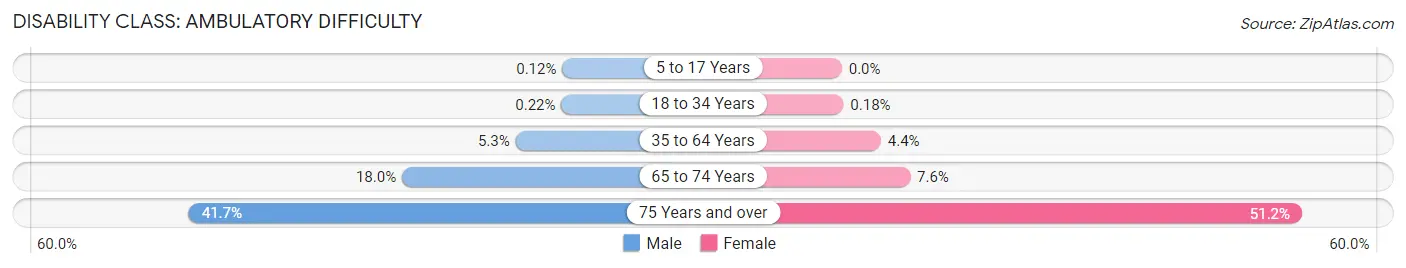
| Age Bracket | Male | Female |
| 5 to 17 Years | 14 (0.1%) | 0 (0.0%) |
| 18 to 34 Years | 18 (0.2%) | 14 (0.2%) |
| 35 to 64 Years | 402 (5.3%) | 274 (4.3%) |
| 65 to 74 Years | 147 (18.0%) | 80 (7.6%) |
| 75 Years and over | 254 (41.7%) | 416 (51.2%) |
Disability Class: Self-Care Difficulty
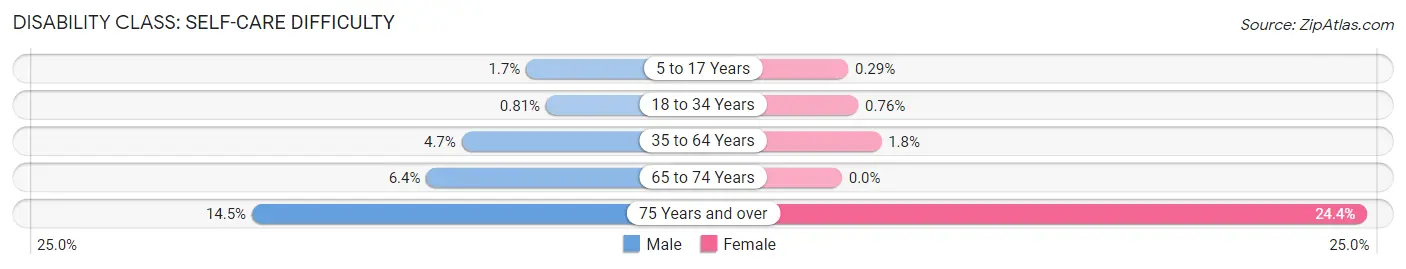
| Age Bracket | Male | Female |
| 5 to 17 Years | 205 (1.7%) | 34 (0.3%) |
| 18 to 34 Years | 65 (0.8%) | 58 (0.8%) |
| 35 to 64 Years | 357 (4.7%) | 115 (1.8%) |
| 65 to 74 Years | 52 (6.4%) | 0 (0.0%) |
| 75 Years and over | 88 (14.4%) | 198 (24.4%) |
Technology Access in Lakewood
Computing Device Access in Lakewood
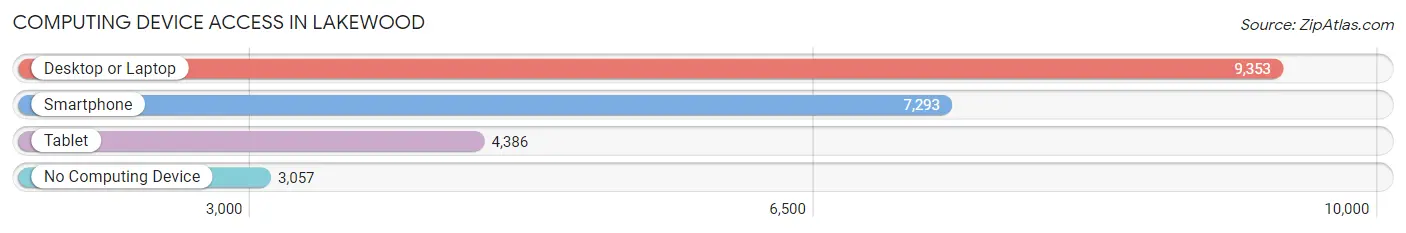
| Device Type | # Households | % Households |
| Desktop or Laptop | 9,353 | 69.2% |
| Smartphone | 7,293 | 53.9% |
| Tablet | 4,386 | 32.5% |
| No Computing Device | 3,057 | 22.6% |
| Total | 13,518 | 100.0% |
Internet Access in Lakewood
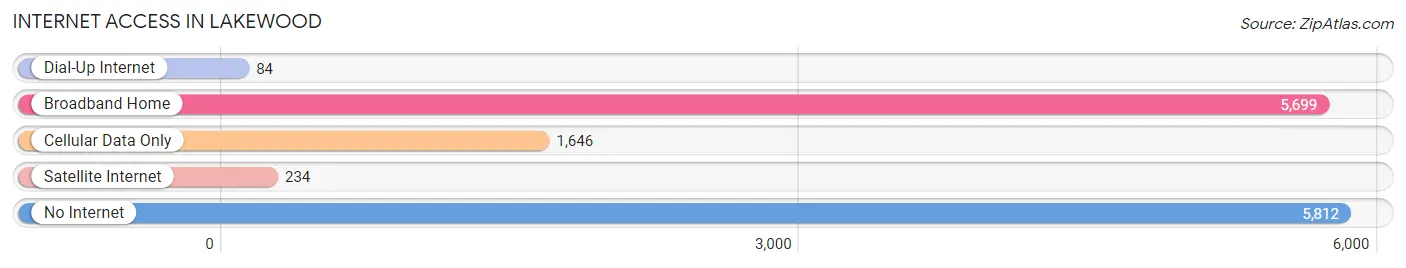
| Internet Type | # Households | % Households |
| Dial-Up Internet | 84 | 0.6% |
| Broadband Home | 5,699 | 42.2% |
| Cellular Data Only | 1,646 | 12.2% |
| Satellite Internet | 234 | 1.7% |
| No Internet | 5,812 | 43.0% |
| Total | 13,518 | 100.0% |
Lakewood Summary
Introduction
Lakewood is a township located in Ocean County, New Jersey. It is situated in the heart of the Jersey Shore and is home to a population of approximately 100,000 people. The township is known for its diverse population, its vibrant economy, and its rich history. This paper will explore the history, geography, economy, and demographics of Lakewood in 2000 words.
History
The area that is now Lakewood was first settled in the late 1700s by a group of Quakers from Pennsylvania. The Quakers named the area “Brick” after the red clay that was found in the area. The area was later renamed “Lakewood” in 1892 when the first post office was established.
The area was largely agricultural until the early 1900s when the first railroad line was built. This allowed for the development of the area and the growth of the population. The population of Lakewood grew rapidly in the early 1900s and by the 1950s, the population had reached over 30,000.
The population of Lakewood continued to grow throughout the 20th century and by the 2000s, the population had reached over 100,000. The population growth was largely due to the influx of immigrants from Latin America and the Middle East.
Geography
Lakewood is located in Ocean County, New Jersey. It is situated in the heart of the Jersey Shore and is bordered by the towns of Brick, Toms River, and Manchester. The township covers an area of approximately 24 square miles and is home to a population of over 100,000 people.
The township is located on the Atlantic Coastal Plain and is characterized by flat terrain. The area is largely covered by pine forests and wetlands. The township is also home to several lakes, including Lake Carasaljo, Lake Shenandoah, and Lake Shenandoah.
Economy
The economy of Lakewood is largely driven by the tourism industry. The township is home to several popular beaches, including Point Pleasant Beach and Seaside Heights. The area is also home to several popular attractions, including Jenkinson’s Boardwalk and the Lakewood BlueClaws baseball team.
The township is also home to several large employers, including Ocean County College, the Lakewood Board of Education, and the Lakewood Township Municipal Government. The township is also home to several retail stores, restaurants, and other businesses.
Demographics
As of the 2010 census, the population of Lakewood was 100,758. The population is largely composed of white (64.3%), Hispanic (20.2%), and African American (9.2%) individuals. The median household income in the township is $50,945 and the median age is 37.
Conclusion
Lakewood is a township located in Ocean County, New Jersey. It is situated in the heart of the Jersey Shore and is home to a population of over 100,000 people. The township is known for its diverse population, its vibrant economy, and its rich history. This paper has explored the history, geography, economy, and demographics of Lakewood in 2000 words.
Common Questions
What is Per Capita Income in Lakewood?
Per Capita income in Lakewood is $17,817.
What is the Median Family Income in Lakewood?
Median Family Income in Lakewood is $58,396.
What is the Median Household income in Lakewood?
Median Household Income in Lakewood is $54,826.
What is Income or Wage Gap in Lakewood?
Income or Wage Gap in Lakewood is 39.4%.
Women in Lakewood earn 60.6 cents for every dollar earned by a man.
What is Family Income Deficit in Lakewood?
Family Income Deficit in Lakewood is $11,936.
Families that are below poverty line in Lakewood earn $11,936 less on average than the poverty threshold level.
What is Inequality or Gini Index in Lakewood?
Inequality or Gini Index in Lakewood is 0.49.
What is the Total Population of Lakewood?
Total Population of Lakewood is 68,555.
What is the Total Male Population of Lakewood?
Total Male Population of Lakewood is 35,355.
What is the Total Female Population of Lakewood?
Total Female Population of Lakewood is 33,200.
What is the Ratio of Males per 100 Females in Lakewood?
There are 106.49 Males per 100 Females in Lakewood.
What is the Ratio of Females per 100 Males in Lakewood?
There are 93.90 Females per 100 Males in Lakewood.
What is the Median Population Age in Lakewood?
Median Population Age in Lakewood is 17.5 Years.
What is the Average Family Size in Lakewood
Average Family Size in Lakewood is 5.3 People.
What is the Average Household Size in Lakewood
Average Household Size in Lakewood is 4.9 People.
How Large is the Labor Force in Lakewood?
There are 19,611 People in the Labor Forcein in Lakewood.
What is the Percentage of People in the Labor Force in Lakewood?
53.6% of People are in the Labor Force in Lakewood.
What is the Unemployment Rate in Lakewood?
Unemployment Rate in Lakewood is 6.4%.