Neptune City borough, NJ Map & Demographics
Neptune City borough Overview
$45,178
PER CAPITA INCOME
$99,894
AVG FAMILY INCOME
$82,009
AVG HOUSEHOLD INCOME
43.6%
WAGE / INCOME GAP [ % ]
56.4¢/ $1
WAGE / INCOME GAP [ $ ]
0.44
INEQUALITY / GINI INDEX
4,619
TOTAL POPULATION
2,366
MALE POPULATION
2,253
FEMALE POPULATION
105.02
MALES / 100 FEMALES
95.22
FEMALES / 100 MALES
41.3
MEDIAN AGE
2.6
AVG FAMILY SIZE
2.0
AVG HOUSEHOLD SIZE
3,051
LABOR FORCE [ PEOPLE ]
76.6%
PERCENT IN LABOR FORCE
6.8%
UNEMPLOYMENT RATE
Income in Neptune City borough
Income Overview in Neptune City borough
Per Capita Income in Neptune City borough is $45,178, while median incomes of families and households are $99,894 and $82,009 respectively.
| Characteristic | Number | Measure |
| Per Capita Income | 4,619 | $45,178 |
| Median Family Income | 1,226 | $99,894 |
| Mean Family Income | 1,226 | $113,007 |
| Median Household Income | 2,219 | $82,009 |
| Mean Household Income | 2,219 | $94,618 |
| Income Deficit | 1,226 | $0 |
| Wage / Income Gap (%) | 4,619 | 43.65% |
| Wage / Income Gap ($) | 4,619 | 56.35¢ per $1 |
| Gini / Inequality Index | 4,619 | 0.44 |
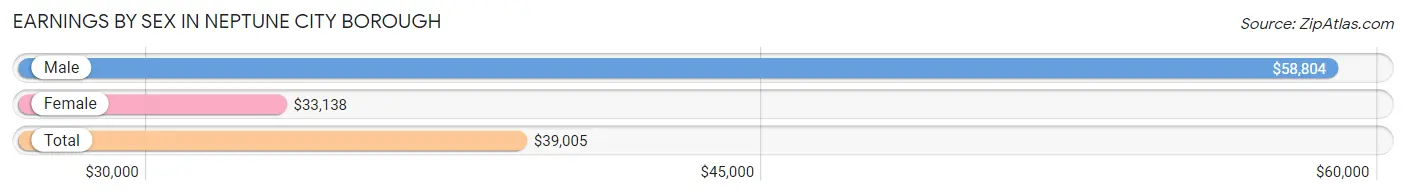
Earnings by Sex in Neptune City borough
Average Earnings in Neptune City borough are $39,005, $58,804 for men and $33,138 for women, a difference of 43.6%.
| Sex | Number | Average Earnings |
| Male | 1,308 (43.0%) | $58,804 |
| Female | 1,737 (57.0%) | $33,138 |
| Total | 3,045 (100.0%) | $39,005 |
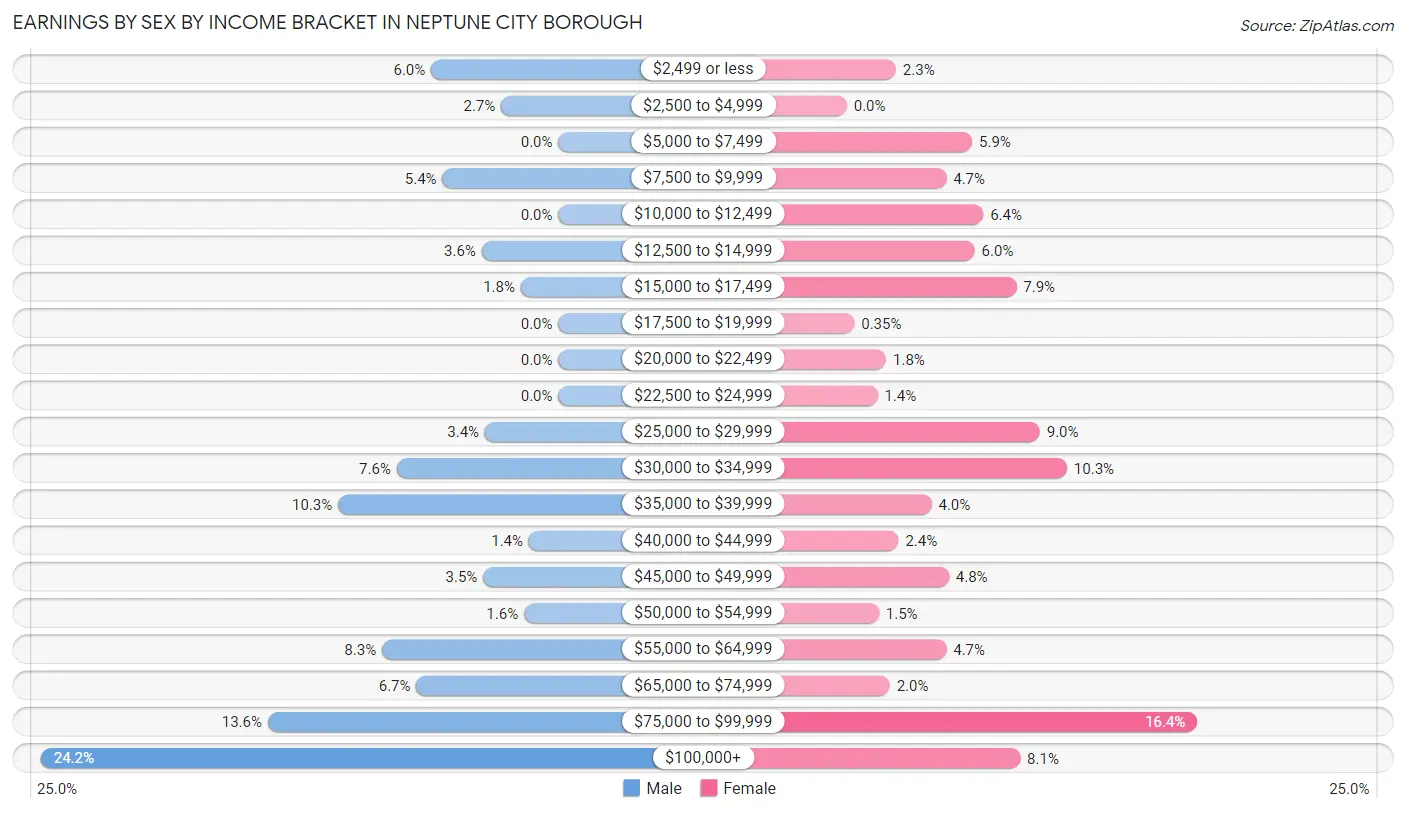
Earnings by Sex by Income Bracket in Neptune City borough
The most common earnings brackets in Neptune City borough are $100,000+ for men (317 | 24.2%) and $75,000 to $99,999 for women (285 | 16.4%).
| Income | Male | Female |
| $2,499 or less | 78 (6.0%) | 40 (2.3%) |
| $2,500 to $4,999 | 35 (2.7%) | 0 (0.0%) |
| $5,000 to $7,499 | 0 (0.0%) | 102 (5.9%) |
| $7,500 to $9,999 | 71 (5.4%) | 81 (4.7%) |
| $10,000 to $12,499 | 0 (0.0%) | 111 (6.4%) |
| $12,500 to $14,999 | 47 (3.6%) | 104 (6.0%) |
| $15,000 to $17,499 | 23 (1.8%) | 138 (7.9%) |
| $17,500 to $19,999 | 0 (0.0%) | 6 (0.4%) |
| $20,000 to $22,499 | 0 (0.0%) | 32 (1.8%) |
| $22,500 to $24,999 | 0 (0.0%) | 25 (1.4%) |
| $25,000 to $29,999 | 45 (3.4%) | 157 (9.0%) |
| $30,000 to $34,999 | 99 (7.6%) | 179 (10.3%) |
| $35,000 to $39,999 | 135 (10.3%) | 69 (4.0%) |
| $40,000 to $44,999 | 18 (1.4%) | 42 (2.4%) |
| $45,000 to $49,999 | 46 (3.5%) | 83 (4.8%) |
| $50,000 to $54,999 | 21 (1.6%) | 26 (1.5%) |
| $55,000 to $64,999 | 108 (8.3%) | 81 (4.7%) |
| $65,000 to $74,999 | 87 (6.7%) | 35 (2.0%) |
| $75,000 to $99,999 | 178 (13.6%) | 285 (16.4%) |
| $100,000+ | 317 (24.2%) | 141 (8.1%) |
| Total | 1,308 (100.0%) | 1,737 (100.0%) |
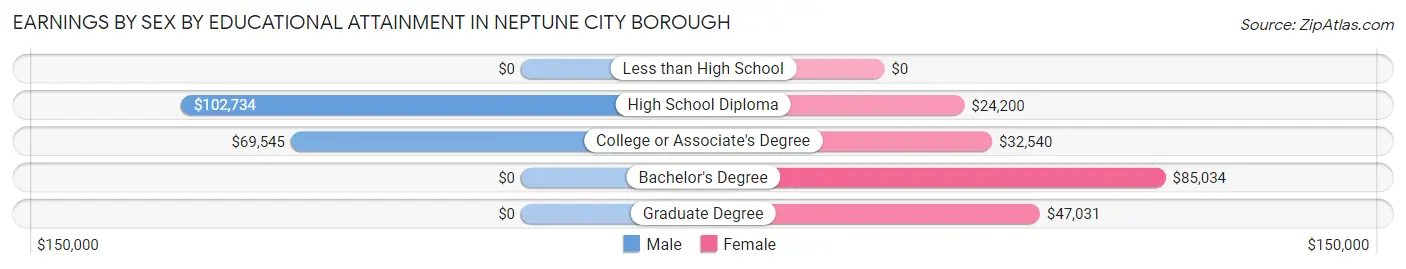
Earnings by Sex by Educational Attainment in Neptune City borough
Average earnings in Neptune City borough are $71,542 for men and $37,464 for women, a difference of 47.6%. Men with an educational attainment of high school diploma enjoy the highest average annual earnings of $102,734, while those with college or associate's degree education earn the least with $69,545. Women with an educational attainment of bachelor's degree earn the most with the average annual earnings of $85,034, while those with high school diploma education have the smallest earnings of $24,200.
| Educational Attainment | Male Income | Female Income |
| Less than High School | - | - |
| High School Diploma | $102,734 | $24,200 |
| College or Associate's Degree | $69,545 | $32,540 |
| Bachelor's Degree | - | - |
| Graduate Degree | - | - |
| Total | $71,542 | $37,464 |
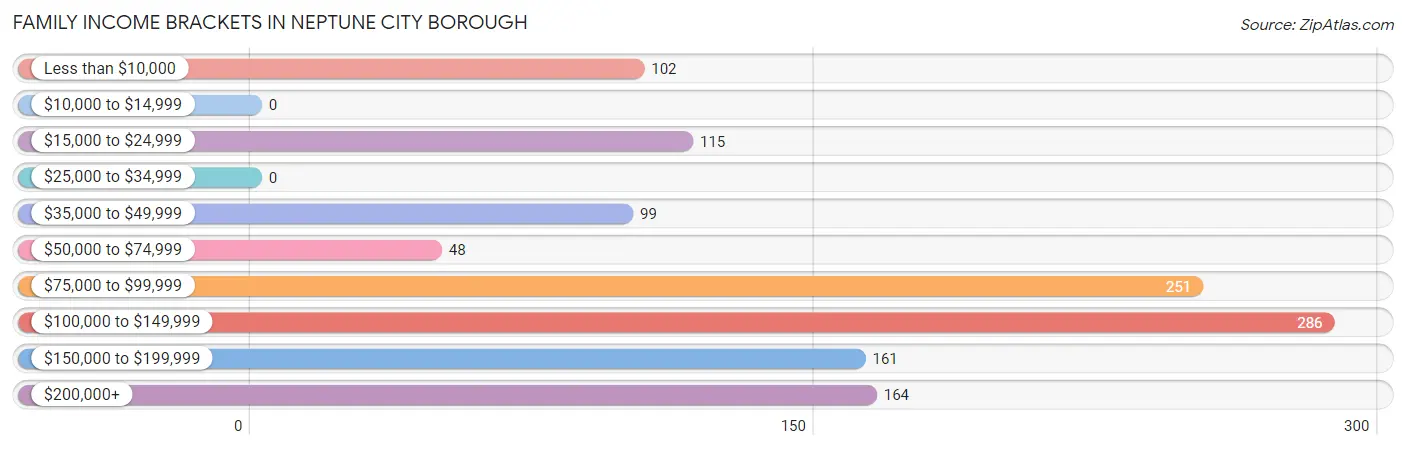
Family Income in Neptune City borough
Family Income Brackets in Neptune City borough
According to the Neptune City borough family income data, there are 286 families falling into the $100,000 to $149,999 income range, which is the most common income bracket and makes up 23.3% of all families.
| Income Bracket | # Families | % Families |
| Less than $10,000 | 102 | 8.3% |
| $10,000 to $14,999 | 0 | 0.0% |
| $15,000 to $24,999 | 115 | 9.4% |
| $25,000 to $34,999 | 0 | 0.0% |
| $35,000 to $49,999 | 99 | 8.1% |
| $50,000 to $74,999 | 48 | 3.9% |
| $75,000 to $99,999 | 251 | 20.5% |
| $100,000 to $149,999 | 286 | 23.3% |
| $150,000 to $199,999 | 161 | 13.1% |
| $200,000+ | 164 | 13.4% |
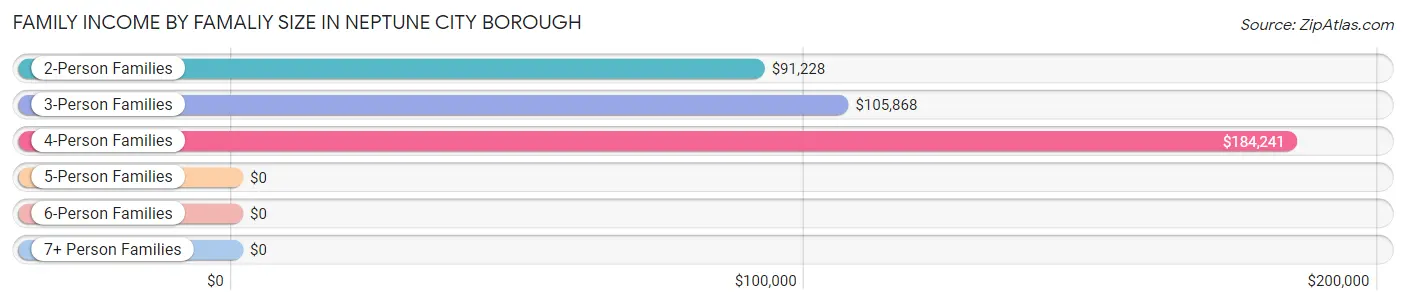
Family Income by Famaliy Size in Neptune City borough
4-person families (167 | 13.6%) account for the highest median family income in Neptune City borough with $184,241 per family, while 4-person families (167 | 13.6%) have the highest median income of $46,060 per family member.
| Income Bracket | # Families | Median Income |
| 2-Person Families | 758 (61.8%) | $91,228 |
| 3-Person Families | 273 (22.3%) | $105,868 |
| 4-Person Families | 167 (13.6%) | $184,241 |
| 5-Person Families | 28 (2.3%) | $0 |
| 6-Person Families | 0 (0.0%) | $0 |
| 7+ Person Families | 0 (0.0%) | $0 |
| Total | 1,226 (100.0%) | $99,894 |
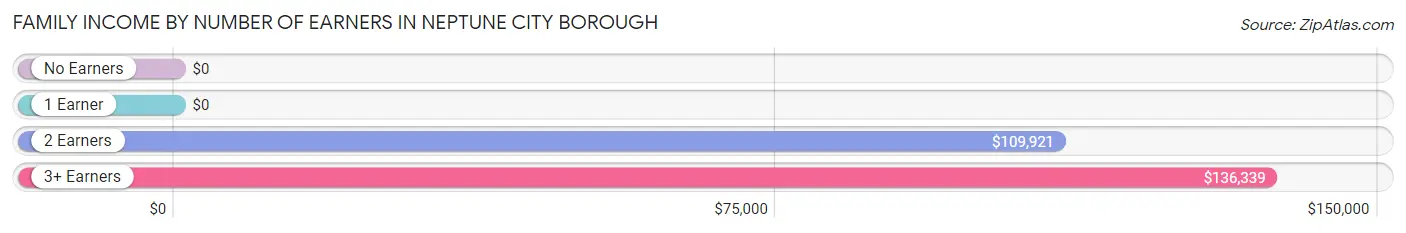
Family Income by Number of Earners in Neptune City borough
| Number of Earners | # Families | Median Income |
| No Earners | 84 (6.9%) | $0 |
| 1 Earner | 298 (24.3%) | $0 |
| 2 Earners | 698 (56.9%) | $109,921 |
| 3+ Earners | 146 (11.9%) | $136,339 |
| Total | 1,226 (100.0%) | $99,894 |
Household Income in Neptune City borough
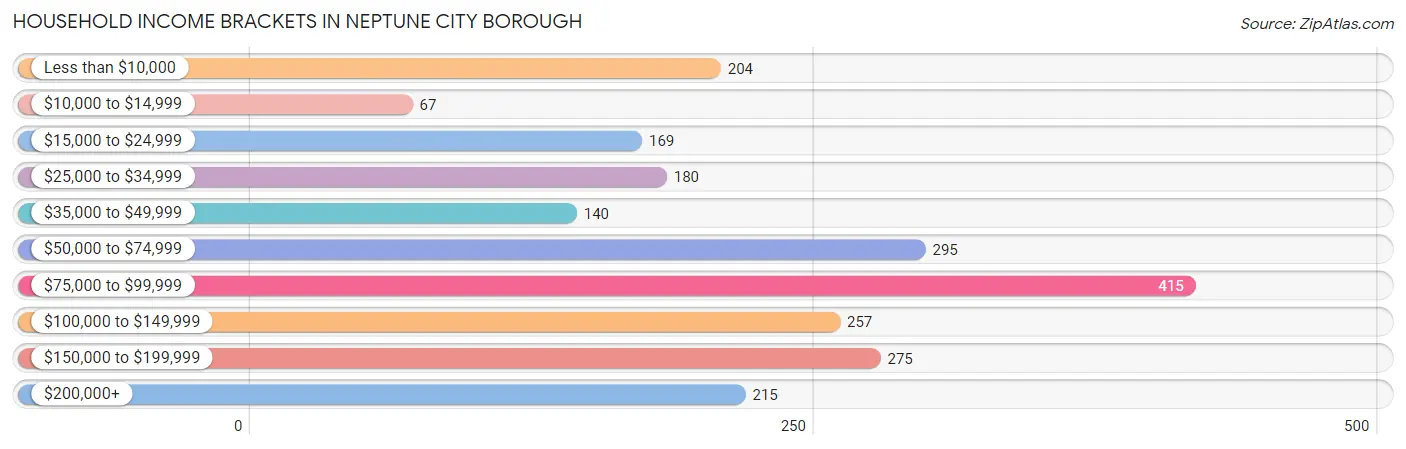
Household Income Brackets in Neptune City borough
With 415 households falling in the category, the $75,000 to $99,999 income range is the most frequent in Neptune City borough, accounting for 18.7% of all households. In contrast, only 67 households (3.0%) fall into the $10,000 to $14,999 income bracket, making it the least populous group.
| Income Bracket | # Households | % Households |
| Less than $10,000 | 204 | 9.2% |
| $10,000 to $14,999 | 67 | 3.0% |
| $15,000 to $24,999 | 169 | 7.6% |
| $25,000 to $34,999 | 180 | 8.1% |
| $35,000 to $49,999 | 140 | 6.3% |
| $50,000 to $74,999 | 295 | 13.3% |
| $75,000 to $99,999 | 415 | 18.7% |
| $100,000 to $149,999 | 257 | 11.6% |
| $150,000 to $199,999 | 275 | 12.4% |
| $200,000+ | 215 | 9.7% |
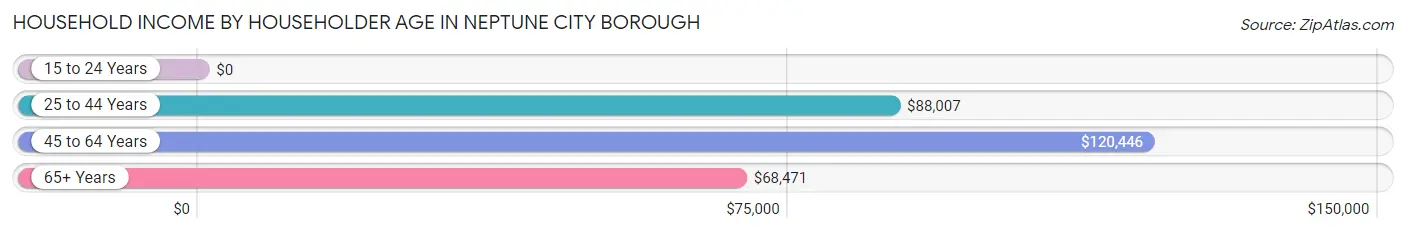
Household Income by Householder Age in Neptune City borough
The median household income in Neptune City borough is $82,009, with the highest median household income of $120,446 found in the 45 to 64 years age bracket for the primary householder. A total of 745 households (33.6%) fall into this category. Meanwhile, the 15 to 24 years age bracket for the primary householder has the lowest median household income of $0, with 160 households (7.2%) in this group.
| Income Bracket | # Households | Median Income |
| 15 to 24 Years | 160 (7.2%) | $0 |
| 25 to 44 Years | 845 (38.1%) | $88,007 |
| 45 to 64 Years | 745 (33.6%) | $120,446 |
| 65+ Years | 469 (21.1%) | $68,471 |
| Total | 2,219 (100.0%) | $82,009 |
Poverty in Neptune City borough
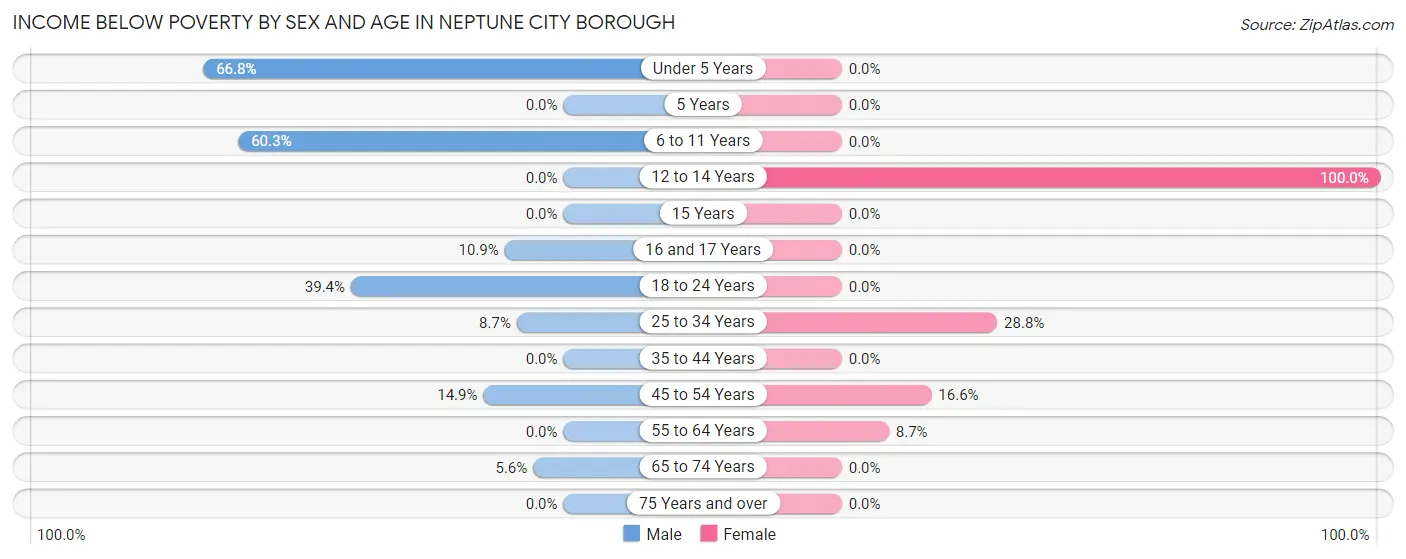
Income Below Poverty by Sex and Age in Neptune City borough
With 16.7% poverty level for males and 14.0% for females among the residents of Neptune City borough, under 5 year old males and 12 to 14 year old females are the most vulnerable to poverty, with 131 males (66.8%) and 70 females (100.0%) in their respective age groups living below the poverty level.
| Age Bracket | Male | Female |
| Under 5 Years | 131 (66.8%) | 0 (0.0%) |
| 5 Years | 0 (0.0%) | 0 (0.0%) |
| 6 to 11 Years | 70 (60.3%) | 0 (0.0%) |
| 12 to 14 Years | 0 (0.0%) | 70 (100.0%) |
| 15 Years | 0 (0.0%) | 0 (0.0%) |
| 16 and 17 Years | 18 (10.9%) | 0 (0.0%) |
| 18 to 24 Years | 71 (39.4%) | 0 (0.0%) |
| 25 to 34 Years | 27 (8.6%) | 137 (28.8%) |
| 35 to 44 Years | 0 (0.0%) | 0 (0.0%) |
| 45 to 54 Years | 48 (14.9%) | 67 (16.6%) |
| 55 to 64 Years | 0 (0.0%) | 31 (8.7%) |
| 65 to 74 Years | 18 (5.6%) | 0 (0.0%) |
| 75 Years and over | 0 (0.0%) | 0 (0.0%) |
| Total | 383 (16.7%) | 305 (14.0%) |
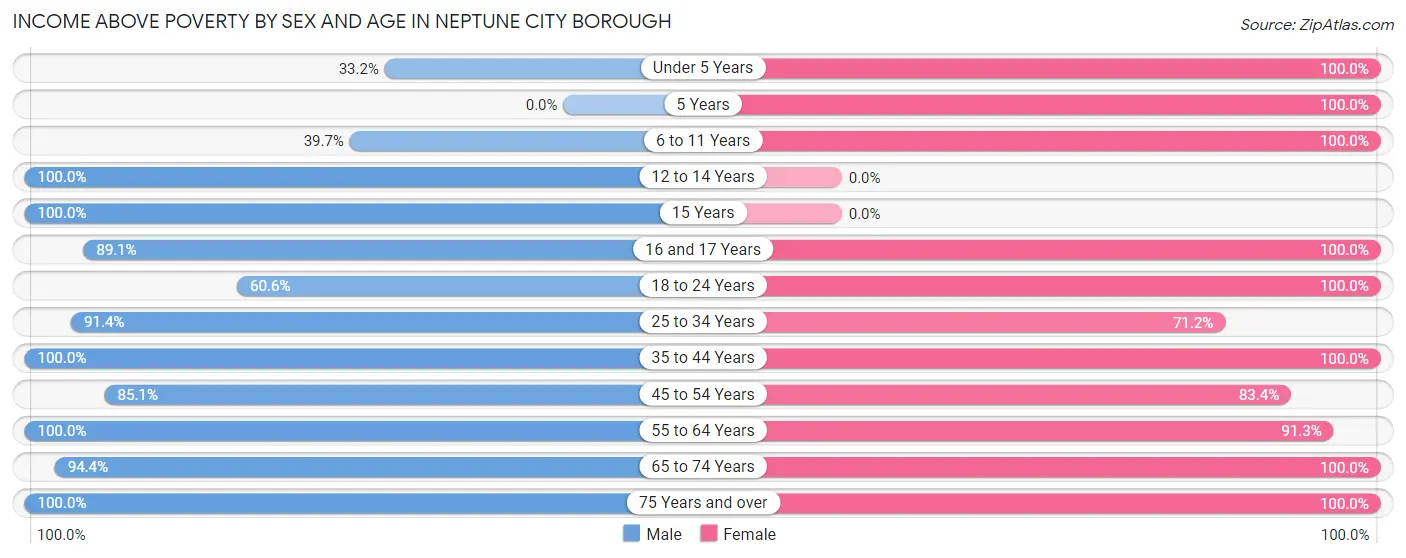
Income Above Poverty by Sex and Age in Neptune City borough
According to the poverty statistics in Neptune City borough, males aged 12 to 14 years and females aged under 5 years are the age groups that are most secure financially, with 100.0% of males and 100.0% of females in these age groups living above the poverty line.
| Age Bracket | Male | Female |
| Under 5 Years | 65 (33.2%) | 32 (100.0%) |
| 5 Years | 0 (0.0%) | 42 (100.0%) |
| 6 to 11 Years | 46 (39.7%) | 49 (100.0%) |
| 12 to 14 Years | 57 (100.0%) | 0 (0.0%) |
| 15 Years | 21 (100.0%) | 0 (0.0%) |
| 16 and 17 Years | 147 (89.1%) | 23 (100.0%) |
| 18 to 24 Years | 109 (60.6%) | 259 (100.0%) |
| 25 to 34 Years | 285 (91.3%) | 338 (71.2%) |
| 35 to 44 Years | 184 (100.0%) | 295 (100.0%) |
| 45 to 54 Years | 275 (85.1%) | 336 (83.4%) |
| 55 to 64 Years | 374 (100.0%) | 324 (91.3%) |
| 65 to 74 Years | 303 (94.4%) | 99 (100.0%) |
| 75 Years and over | 47 (100.0%) | 85 (100.0%) |
| Total | 1,913 (83.3%) | 1,882 (86.1%) |
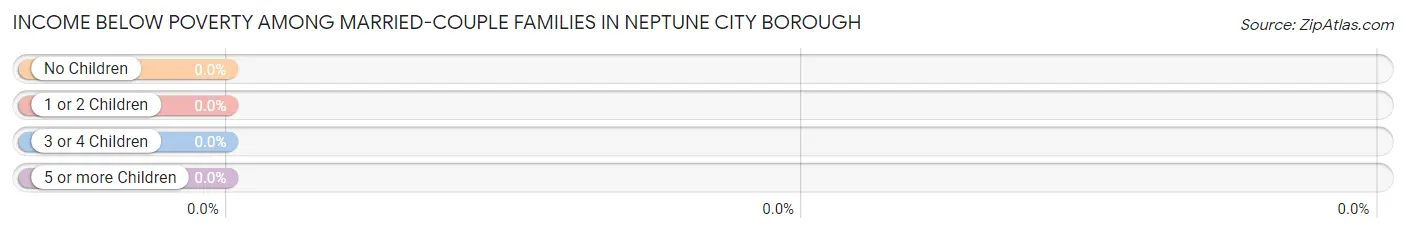
Income Below Poverty Among Married-Couple Families in Neptune City borough
| Children | Above Poverty | Below Poverty |
| No Children | 578 (100.0%) | 0 (0.0%) |
| 1 or 2 Children | 191 (100.0%) | 0 (0.0%) |
| 3 or 4 Children | 0 (0.0%) | 0 (0.0%) |
| 5 or more Children | 0 (0.0%) | 0 (0.0%) |
| Total | 769 (100.0%) | 0 (0.0%) |
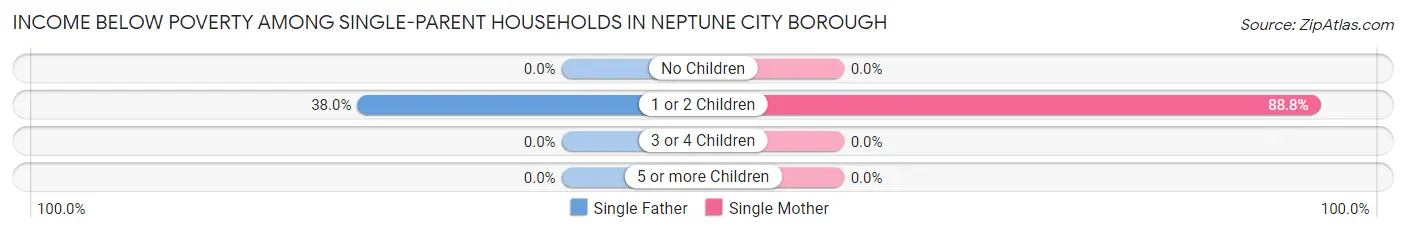
Income Below Poverty Among Single-Parent Households in Neptune City borough
According to the poverty data in Neptune City borough, 16.7% or 35 single-father households and 73.7% or 182 single-mother households are living below the poverty line. Among single-father households, those with 1 or 2 children have the highest poverty rate, with 35 households (38.0%) experiencing poverty. Likewise, among single-mother households, those with 1 or 2 children have the highest poverty rate, with 182 households (88.8%) falling below the poverty line.
| Children | Single Father | Single Mother |
| No Children | 0 (0.0%) | 0 (0.0%) |
| 1 or 2 Children | 35 (38.0%) | 182 (88.8%) |
| 3 or 4 Children | 0 (0.0%) | 0 (0.0%) |
| 5 or more Children | 0 (0.0%) | 0 (0.0%) |
| Total | 35 (16.7%) | 182 (73.7%) |
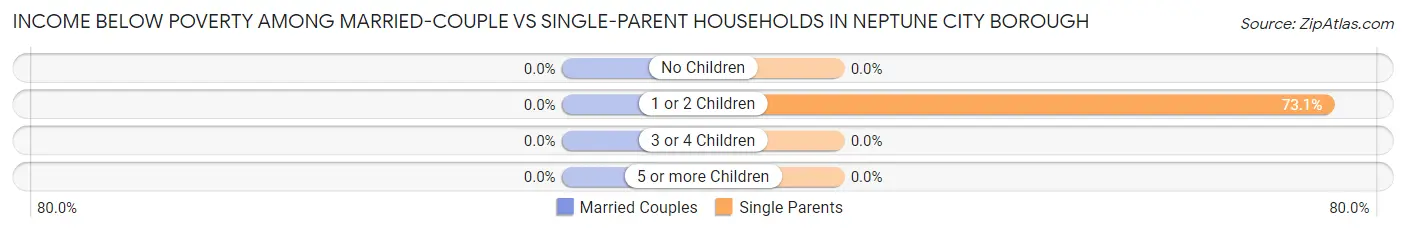
Income Below Poverty Among Married-Couple vs Single-Parent Households in Neptune City borough
| Children | Married-Couple Families | Single-Parent Households |
| No Children | 0 (0.0%) | 0 (0.0%) |
| 1 or 2 Children | 0 (0.0%) | 217 (73.1%) |
| 3 or 4 Children | 0 (0.0%) | 0 (0.0%) |
| 5 or more Children | 0 (0.0%) | 0 (0.0%) |
| Total | 0 (0.0%) | 217 (47.5%) |
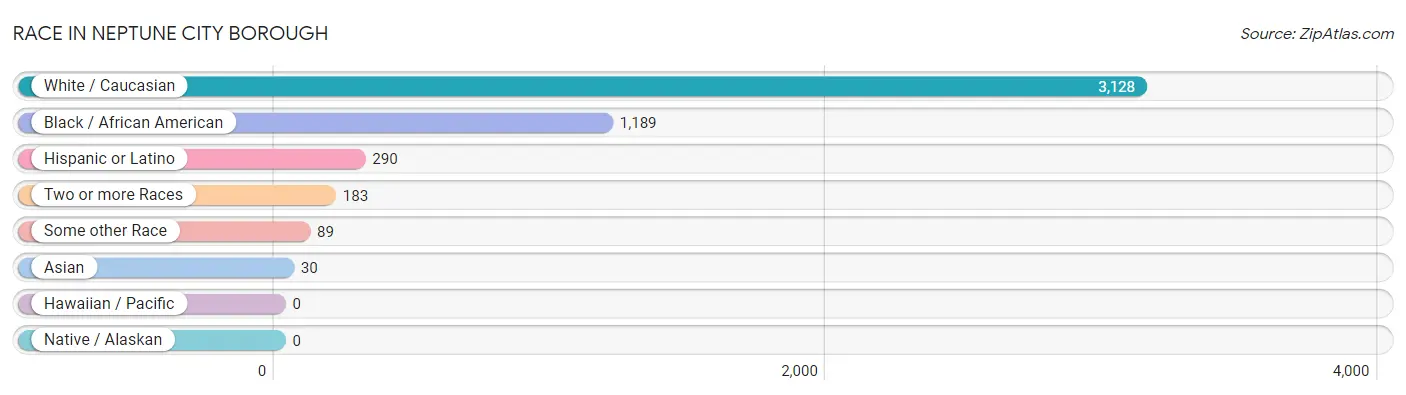
Race in Neptune City borough
The most populous races in Neptune City borough are White / Caucasian (3,128 | 67.7%), Black / African American (1,189 | 25.7%), and Hispanic or Latino (290 | 6.3%).
| Race | # Population | % Population |
| Asian | 30 | 0.6% |
| Black / African American | 1,189 | 25.7% |
| Hawaiian / Pacific | 0 | 0.0% |
| Hispanic or Latino | 290 | 6.3% |
| Native / Alaskan | 0 | 0.0% |
| White / Caucasian | 3,128 | 67.7% |
| Two or more Races | 183 | 4.0% |
| Some other Race | 89 | 1.9% |
| Total | 4,619 | 100.0% |
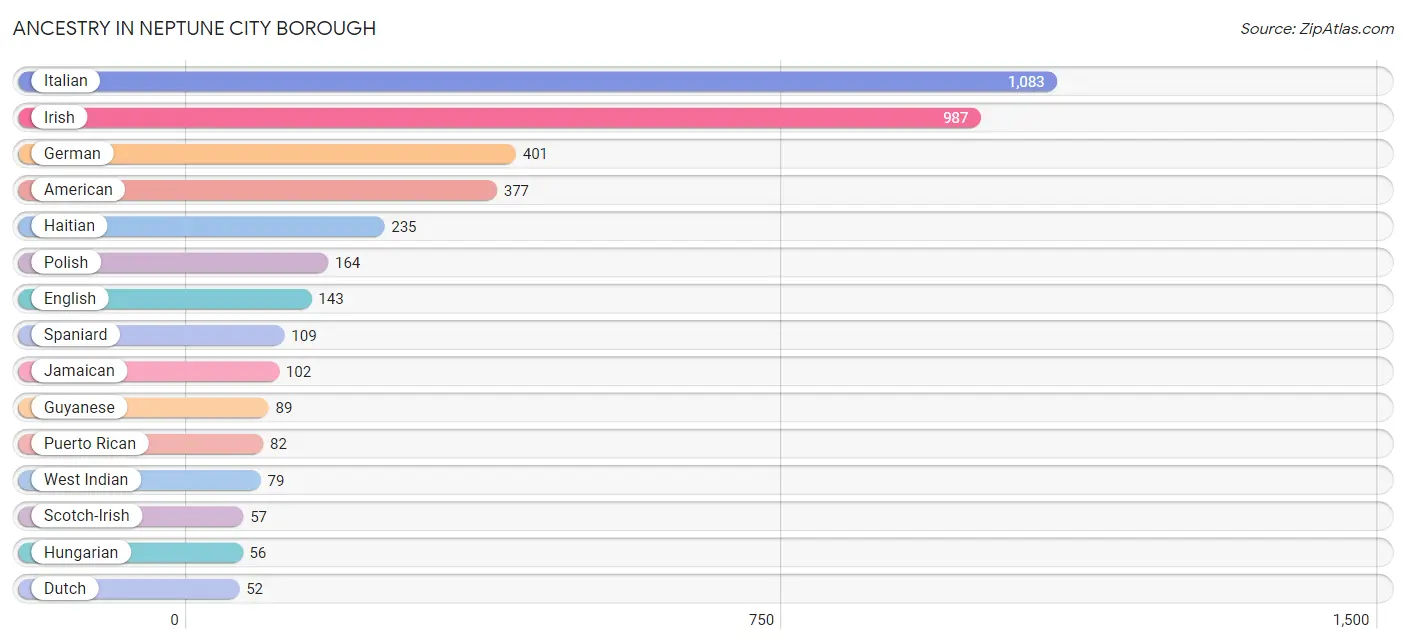
Ancestry in Neptune City borough
The most populous ancestries reported in Neptune City borough are Italian (1,083 | 23.4%), Irish (987 | 21.4%), German (401 | 8.7%), American (377 | 8.2%), and Haitian (235 | 5.1%), together accounting for 66.7% of all Neptune City borough residents.
| Ancestry | # Population | % Population |
| Albanian | 6 | 0.1% |
| American | 377 | 8.2% |
| Austrian | 17 | 0.4% |
| Bhutanese | 3 | 0.1% |
| British | 19 | 0.4% |
| Burmese | 27 | 0.6% |
| Czech | 17 | 0.4% |
| Dutch | 52 | 1.1% |
| English | 143 | 3.1% |
| European | 36 | 0.8% |
| French | 48 | 1.0% |
| French Canadian | 16 | 0.4% |
| German | 401 | 8.7% |
| Guyanese | 89 | 1.9% |
| Haitian | 235 | 5.1% |
| Hungarian | 56 | 1.2% |
| Irish | 987 | 21.4% |
| Italian | 1,083 | 23.4% |
| Jamaican | 102 | 2.2% |
| Lithuanian | 18 | 0.4% |
| Mexican | 19 | 0.4% |
| Polish | 164 | 3.5% |
| Puerto Rican | 82 | 1.8% |
| Russian | 39 | 0.8% |
| Scotch-Irish | 57 | 1.2% |
| Scottish | 21 | 0.4% |
| Slovak | 34 | 0.7% |
| Spaniard | 109 | 2.4% |
| Swedish | 32 | 0.7% |
| Turkish | 3 | 0.1% |
| Welsh | 13 | 0.3% |
| West Indian | 79 | 1.7% | View All 32 Rows |
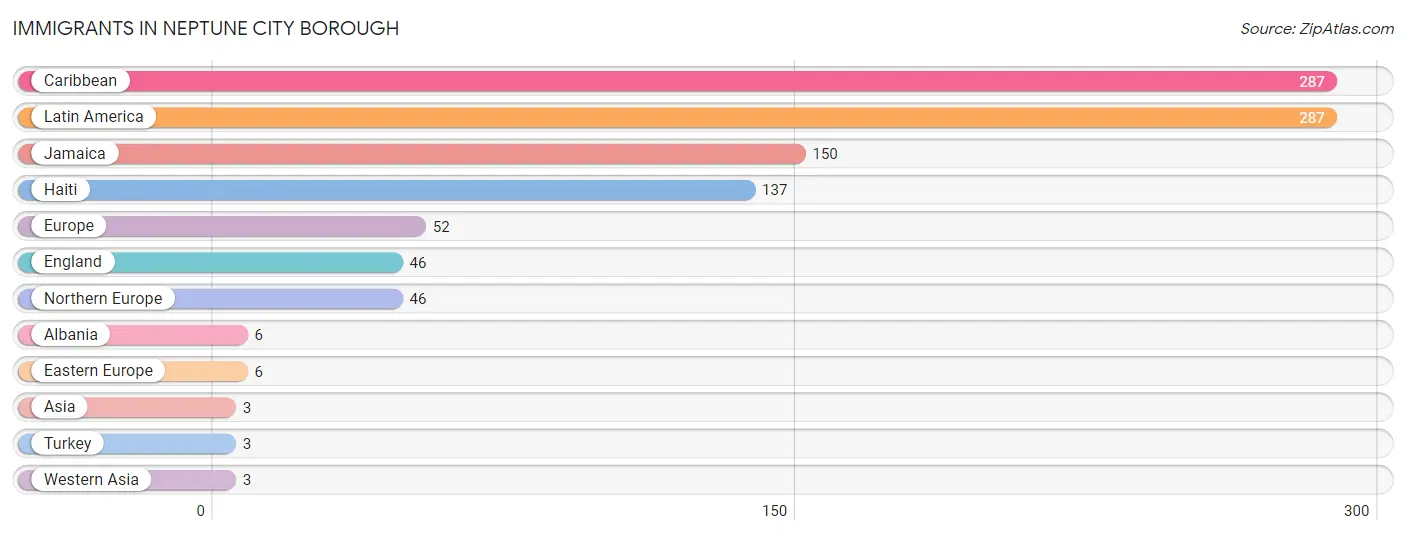
Immigrants in Neptune City borough
The most numerous immigrant groups reported in Neptune City borough came from Caribbean (287 | 6.2%), Latin America (287 | 6.2%), Jamaica (150 | 3.3%), Haiti (137 | 3.0%), and Europe (52 | 1.1%), together accounting for 19.8% of all Neptune City borough residents.
| Immigration Origin | # Population | % Population |
| Albania | 6 | 0.1% |
| Asia | 3 | 0.1% |
| Caribbean | 287 | 6.2% |
| Eastern Europe | 6 | 0.1% |
| England | 46 | 1.0% |
| Europe | 52 | 1.1% |
| Haiti | 137 | 3.0% |
| Jamaica | 150 | 3.3% |
| Latin America | 287 | 6.2% |
| Northern Europe | 46 | 1.0% |
| Turkey | 3 | 0.1% |
| Western Asia | 3 | 0.1% | View All 12 Rows |
Sex and Age in Neptune City borough
Sex and Age in Neptune City borough
The most populous age groups in Neptune City borough are 15 to 19 Years (295 | 12.5%) for men and 30 to 34 Years (262 | 11.6%) for women.
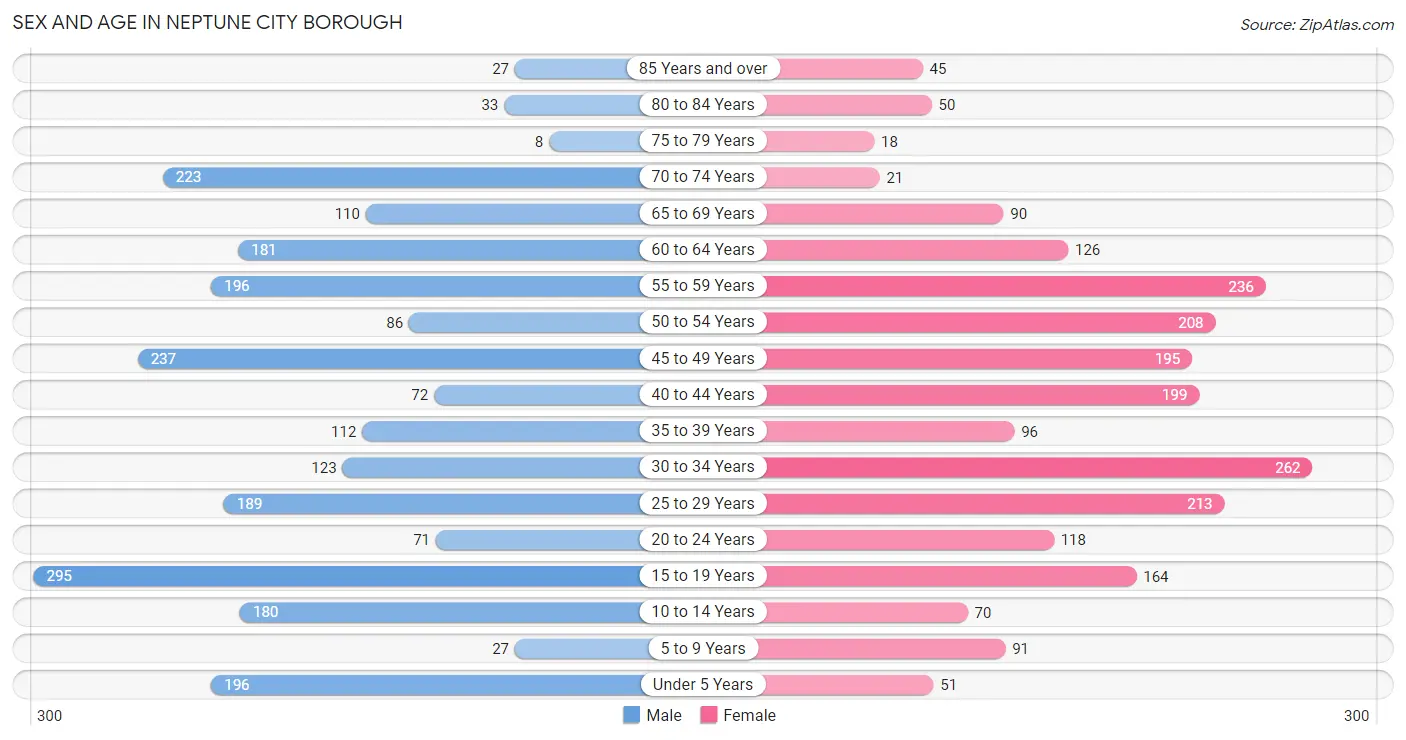
| Age Bracket | Male | Female |
| Under 5 Years | 196 (8.3%) | 51 (2.3%) |
| 5 to 9 Years | 27 (1.1%) | 91 (4.0%) |
| 10 to 14 Years | 180 (7.6%) | 70 (3.1%) |
| 15 to 19 Years | 295 (12.5%) | 164 (7.3%) |
| 20 to 24 Years | 71 (3.0%) | 118 (5.2%) |
| 25 to 29 Years | 189 (8.0%) | 213 (9.5%) |
| 30 to 34 Years | 123 (5.2%) | 262 (11.6%) |
| 35 to 39 Years | 112 (4.7%) | 96 (4.3%) |
| 40 to 44 Years | 72 (3.0%) | 199 (8.8%) |
| 45 to 49 Years | 237 (10.0%) | 195 (8.7%) |
| 50 to 54 Years | 86 (3.6%) | 208 (9.2%) |
| 55 to 59 Years | 196 (8.3%) | 236 (10.5%) |
| 60 to 64 Years | 181 (7.6%) | 126 (5.6%) |
| 65 to 69 Years | 110 (4.6%) | 90 (4.0%) |
| 70 to 74 Years | 223 (9.4%) | 21 (0.9%) |
| 75 to 79 Years | 8 (0.3%) | 18 (0.8%) |
| 80 to 84 Years | 33 (1.4%) | 50 (2.2%) |
| 85 Years and over | 27 (1.1%) | 45 (2.0%) |
| Total | 2,366 (100.0%) | 2,253 (100.0%) |
Families and Households in Neptune City borough
Median Family Size in Neptune City borough
The median family size in Neptune City borough is 2.57 persons per family, with married-couple families (769 | 62.7%) accounting for the largest median family size of 2.75 persons per family. On the other hand, single male/father families (210 | 17.1%) represent the smallest median family size with 2.09 persons per family.
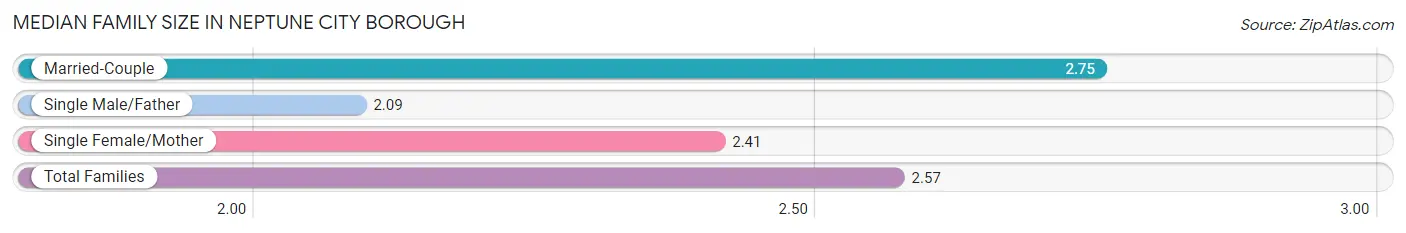
| Family Type | # Families | Family Size |
| Married-Couple | 769 (62.7%) | 2.75 |
| Single Male/Father | 210 (17.1%) | 2.09 |
| Single Female/Mother | 247 (20.2%) | 2.41 |
| Total Families | 1,226 (100.0%) | 2.57 |
Median Household Size in Neptune City borough
The median household size in Neptune City borough is 2.04 persons per household, with married-couple households (769 | 34.7%) accounting for the largest median household size of 2.85 persons per household. non-family households (993 | 44.8%) represent the smallest median household size with 1.19 persons per household.
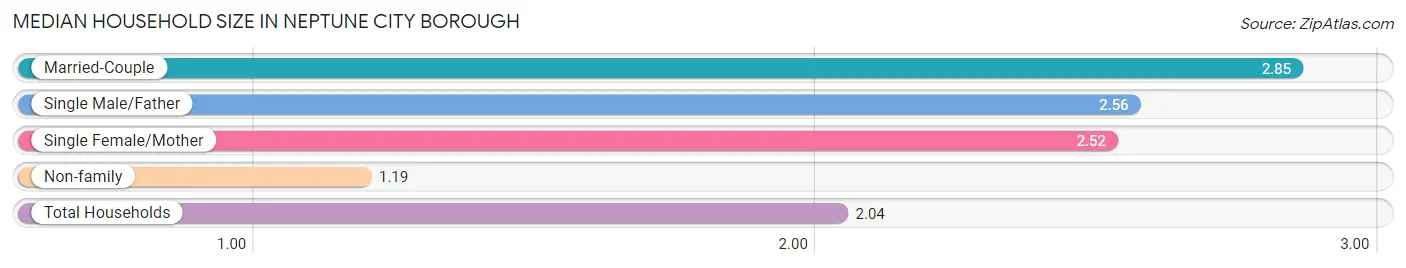
| Household Type | # Households | Household Size |
| Married-Couple | 769 (34.7%) | 2.85 |
| Single Male/Father | 210 (9.5%) | 2.56 |
| Single Female/Mother | 247 (11.1%) | 2.52 |
| Non-family | 993 (44.8%) | 1.19 |
| Total Households | 2,219 (100.0%) | 2.04 |
Household Size by Marriage Status in Neptune City borough
Out of a total of 2,219 households in Neptune City borough, 1,226 (55.2%) are family households, while 993 (44.8%) are nonfamily households. The most numerous type of family households are 2-person households, comprising 714, and the most common type of nonfamily households are 1-person households, comprising 818.
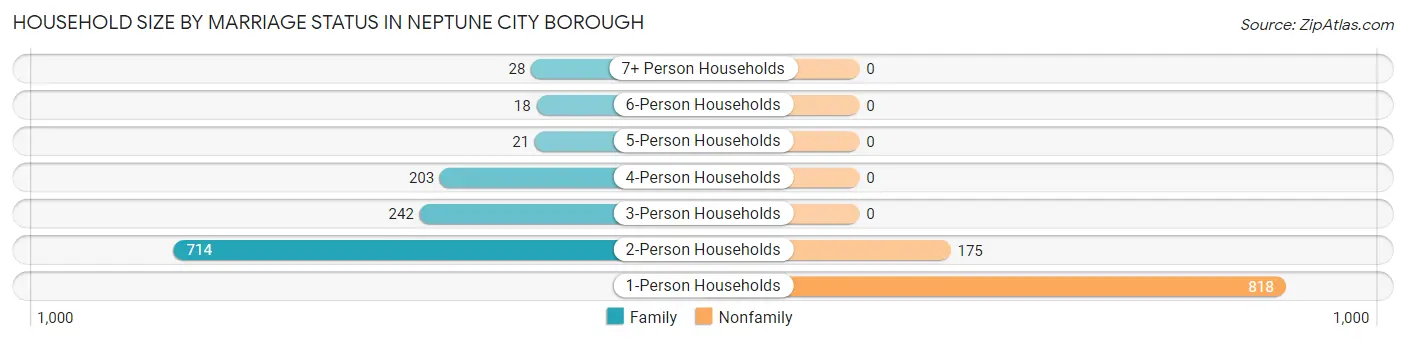
| Household Size | Family Households | Nonfamily Households |
| 1-Person Households | - | 818 (36.9%) |
| 2-Person Households | 714 (32.2%) | 175 (7.9%) |
| 3-Person Households | 242 (10.9%) | 0 (0.0%) |
| 4-Person Households | 203 (9.1%) | 0 (0.0%) |
| 5-Person Households | 21 (0.9%) | 0 (0.0%) |
| 6-Person Households | 18 (0.8%) | 0 (0.0%) |
| 7+ Person Households | 28 (1.3%) | 0 (0.0%) |
| Total | 1,226 (55.2%) | 993 (44.8%) |
Female Fertility in Neptune City borough
Fertility by Age in Neptune City borough
Average fertility rate in Neptune City borough is 28.0 births per 1,000 women. Women in the age bracket of 20 to 34 years have the highest fertility rate with 37.0 births per 1,000 women. Women in the age bracket of 20 to 34 years acount for 59.5% of all women with births.
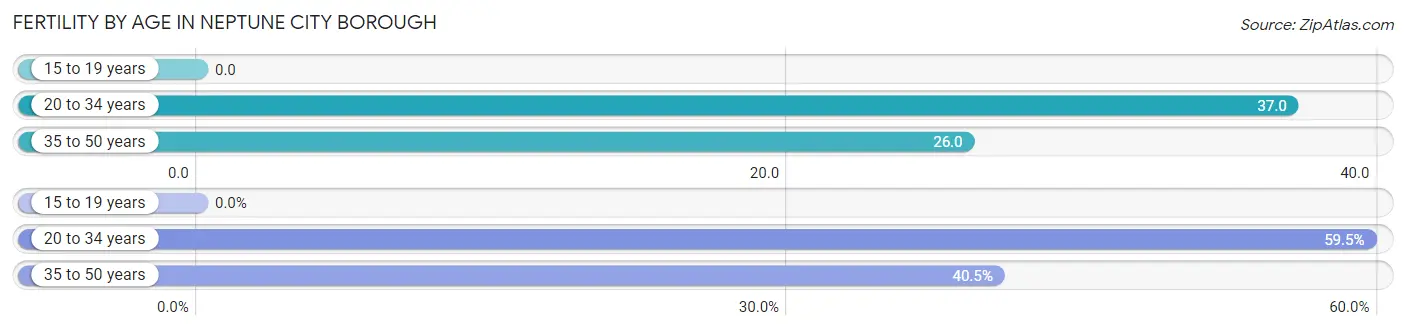
| Age Bracket | Women with Births | Births / 1,000 Women |
| 15 to 19 years | 0 (0.0%) | 0.0 |
| 20 to 34 years | 22 (59.5%) | 37.0 |
| 35 to 50 years | 15 (40.5%) | 26.0 |
| Total | 37 (100.0%) | 28.0 |
Fertility by Age by Marriage Status in Neptune City borough
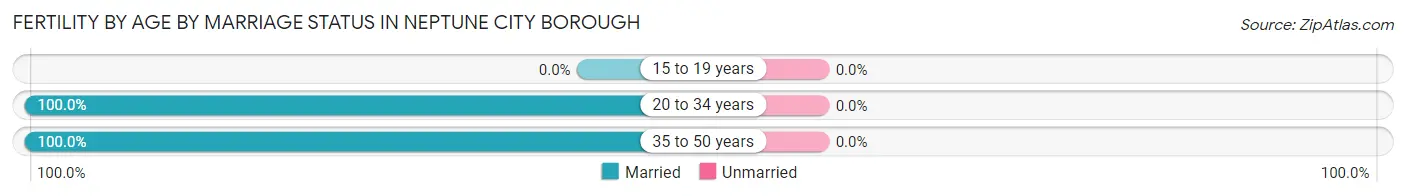
| Age Bracket | Married | Unmarried |
| 15 to 19 years | 0 (0.0%) | 0 (0.0%) |
| 20 to 34 years | 22 (100.0%) | 0 (0.0%) |
| 35 to 50 years | 15 (100.0%) | 0 (0.0%) |
| Total | 37 (100.0%) | 0 (0.0%) |
Fertility by Education in Neptune City borough
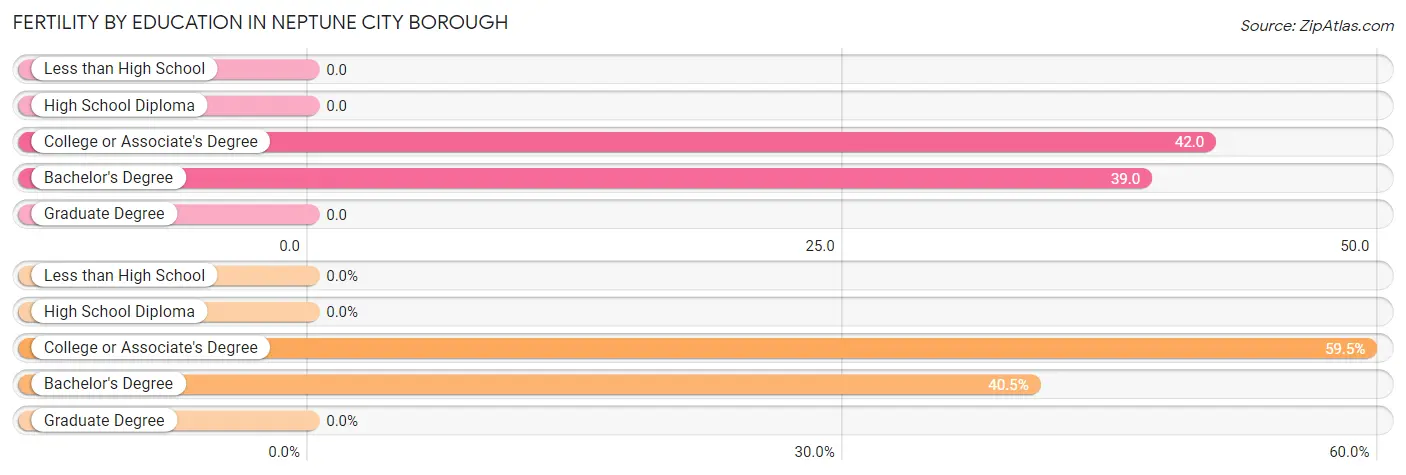
| Educational Attainment | Women with Births | Births / 1,000 Women |
| Less than High School | 0 (0.0%) | 0.0 |
| High School Diploma | 0 (0.0%) | 0.0 |
| College or Associate's Degree | 22 (59.5%) | 42.0 |
| Bachelor's Degree | 15 (40.5%) | 39.0 |
| Graduate Degree | 0 (0.0%) | 0.0 |
| Total | 37 (100.0%) | 28.0 |
Fertility by Education by Marriage Status in Neptune City borough
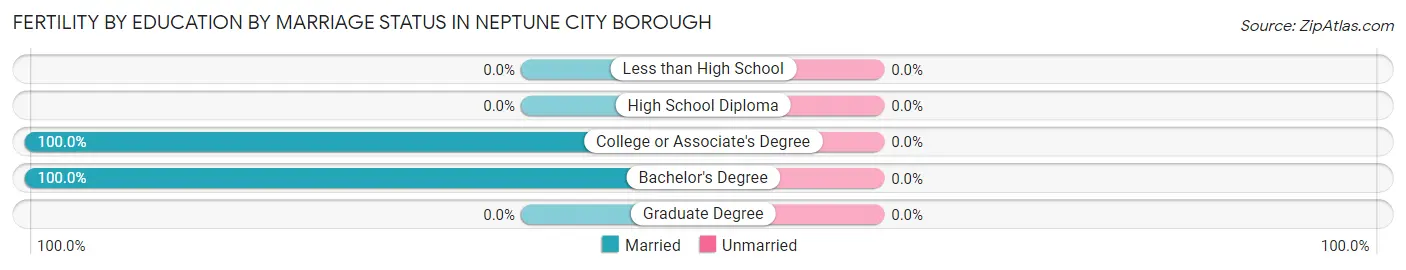
| Educational Attainment | Married | Unmarried |
| Less than High School | 0 (0.0%) | 0 (0.0%) |
| High School Diploma | 0 (0.0%) | 0 (0.0%) |
| College or Associate's Degree | 22 (100.0%) | 0 (0.0%) |
| Bachelor's Degree | 15 (100.0%) | 0 (0.0%) |
| Graduate Degree | 0 (0.0%) | 0 (0.0%) |
| Total | 37 (100.0%) | 0 (0.0%) |
Employment Characteristics in Neptune City borough
Employment by Class of Employer in Neptune City borough
Among the 2,807 employed individuals in Neptune City borough, private company employees (2,034 | 72.5%), local government employees (384 | 13.7%), and not-for-profit organizations (189 | 6.7%) make up the most common classes of employment.
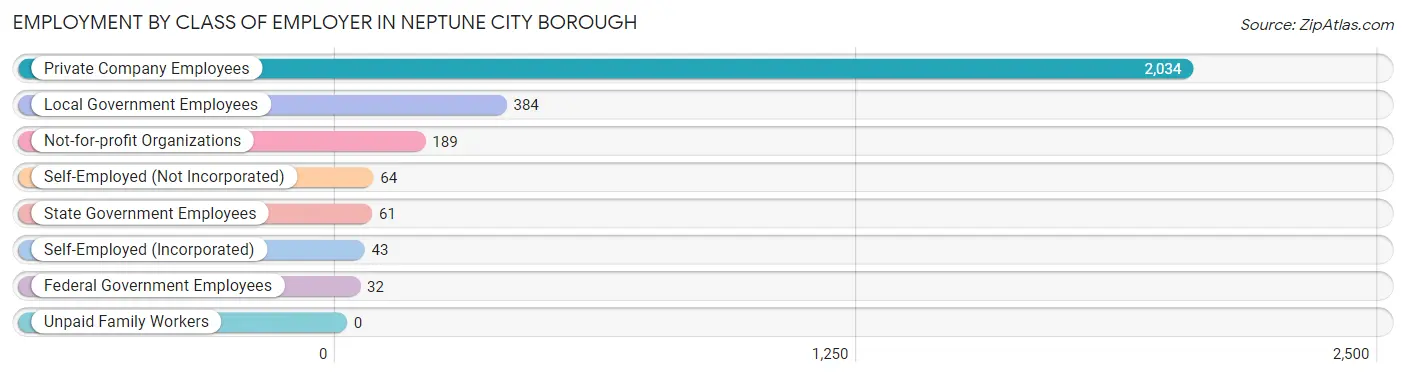
| Employer Class | # Employees | % Employees |
| Private Company Employees | 2,034 | 72.5% |
| Self-Employed (Incorporated) | 43 | 1.5% |
| Self-Employed (Not Incorporated) | 64 | 2.3% |
| Not-for-profit Organizations | 189 | 6.7% |
| Local Government Employees | 384 | 13.7% |
| State Government Employees | 61 | 2.2% |
| Federal Government Employees | 32 | 1.1% |
| Unpaid Family Workers | 0 | 0.0% |
| Total | 2,807 | 100.0% |
Employment Status by Age in Neptune City borough
According to the labor force statistics for Neptune City borough, out of the total population over 16 years of age (3,983), 76.6% or 3,051 individuals are in the labor force, with 6.8% or 207 of them unemployed. The age group with the highest labor force participation rate is 20 to 24 years, with 100.0% or 189 individuals in the labor force. Within the labor force, the 25 to 29 years age range has the highest percentage of unemployed individuals, with 30.0% or 115 of them being unemployed.
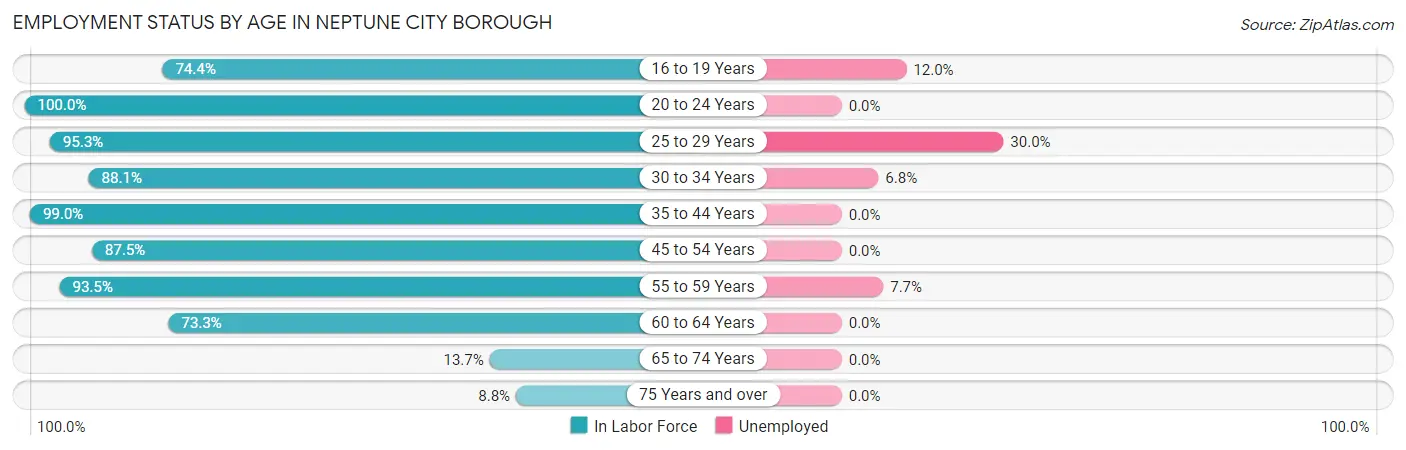
| Age Bracket | In Labor Force | Unemployed |
| 16 to 19 Years | 326 (74.4%) | 39 (12.0%) |
| 20 to 24 Years | 189 (100.0%) | 0 (0.0%) |
| 25 to 29 Years | 383 (95.3%) | 115 (30.0%) |
| 30 to 34 Years | 339 (88.1%) | 23 (6.8%) |
| 35 to 44 Years | 474 (99.0%) | 0 (0.0%) |
| 45 to 54 Years | 635 (87.5%) | 0 (0.0%) |
| 55 to 59 Years | 404 (93.5%) | 31 (7.7%) |
| 60 to 64 Years | 225 (73.3%) | 0 (0.0%) |
| 65 to 74 Years | 61 (13.7%) | 0 (0.0%) |
| 75 Years and over | 16 (8.8%) | 0 (0.0%) |
| Total | 3,051 (76.6%) | 207 (6.8%) |
Employment Status by Educational Attainment in Neptune City borough
According to labor force statistics for Neptune City borough, 90.1% of individuals (2,461) out of the total population between 25 and 64 years of age (2,731) are in the labor force, with 6.9% or 170 of them being unemployed. The group with the highest labor force participation rate are those with the educational attainment of less than high school, with 100.0% or 56 individuals in the labor force. Within the labor force, individuals with college / associate degree education have the highest percentage of unemployment, with 15.3% or 168 of them being unemployed.
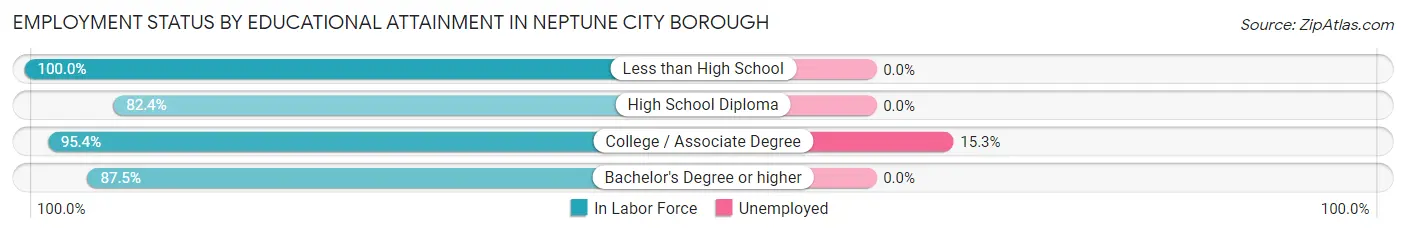
| Educational Attainment | In Labor Force | Unemployed |
| Less than High School | 56 (100.0%) | 0 (0.0%) |
| High School Diploma | 444 (82.4%) | 0 (0.0%) |
| College / Associate Degree | 1,101 (95.4%) | 177 (15.3%) |
| Bachelor's Degree or higher | 859 (87.5%) | 0 (0.0%) |
| Total | 2,461 (90.1%) | 188 (6.9%) |
Employment Occupations by Sex in Neptune City borough
Management, Business, Science and Arts Occupations
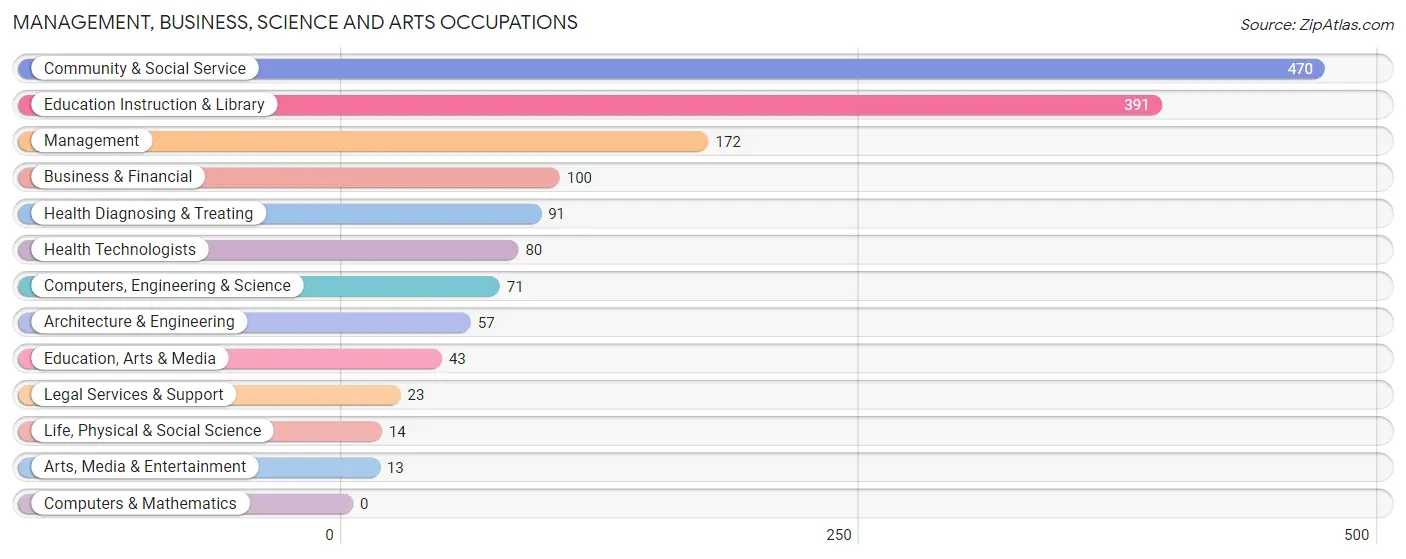
The most common Management, Business, Science and Arts occupations in Neptune City borough are Community & Social Service (470 | 16.5%), Education Instruction & Library (391 | 13.8%), Management (172 | 6.0%), Business & Financial (100 | 3.5%), and Health Diagnosing & Treating (91 | 3.2%).
Management, Business, Science and Arts Occupations by Sex
Within the Management, Business, Science and Arts occupations in Neptune City borough, the most male-oriented occupations are Computers, Engineering & Science (100.0%), Architecture & Engineering (100.0%), and Life, Physical & Social Science (100.0%), while the most female-oriented occupations are Legal Services & Support (100.0%), Health Diagnosing & Treating (100.0%), and Health Technologists (100.0%).
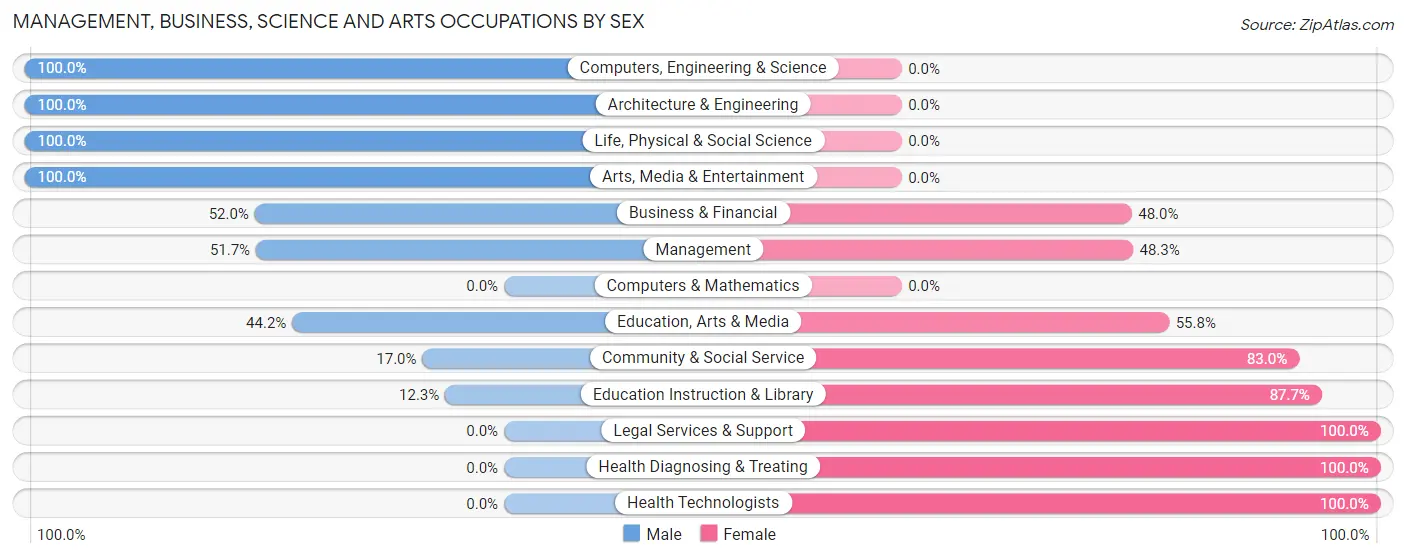
| Occupation | Male | Female |
| Management | 89 (51.7%) | 83 (48.3%) |
| Business & Financial | 52 (52.0%) | 48 (48.0%) |
| Computers, Engineering & Science | 71 (100.0%) | 0 (0.0%) |
| Computers & Mathematics | 0 (0.0%) | 0 (0.0%) |
| Architecture & Engineering | 57 (100.0%) | 0 (0.0%) |
| Life, Physical & Social Science | 14 (100.0%) | 0 (0.0%) |
| Community & Social Service | 80 (17.0%) | 390 (83.0%) |
| Education, Arts & Media | 19 (44.2%) | 24 (55.8%) |
| Legal Services & Support | 0 (0.0%) | 23 (100.0%) |
| Education Instruction & Library | 48 (12.3%) | 343 (87.7%) |
| Arts, Media & Entertainment | 13 (100.0%) | 0 (0.0%) |
| Health Diagnosing & Treating | 0 (0.0%) | 91 (100.0%) |
| Health Technologists | 0 (0.0%) | 80 (100.0%) |
| Total (Category) | 292 (32.3%) | 612 (67.7%) |
| Total (Overall) | 1,285 (45.2%) | 1,559 (54.8%) |
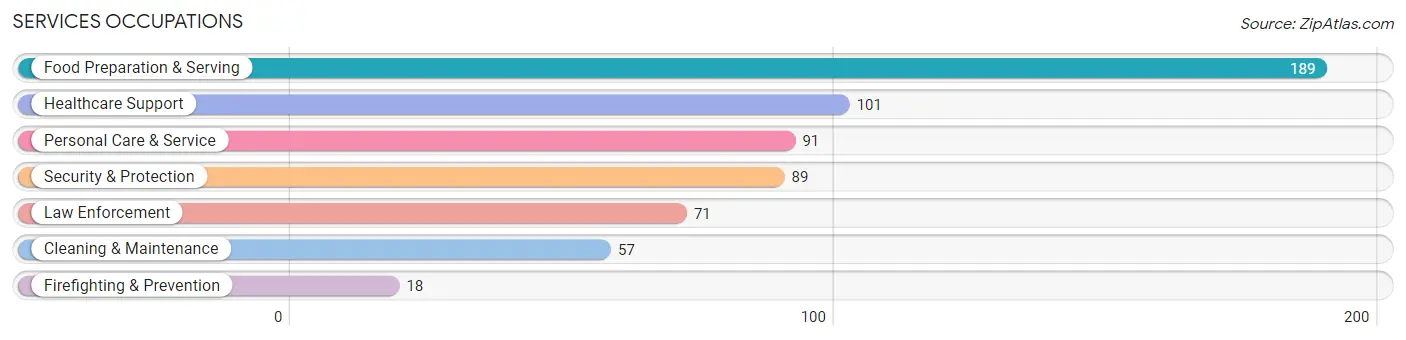
Services Occupations
The most common Services occupations in Neptune City borough are Food Preparation & Serving (189 | 6.7%), Healthcare Support (101 | 3.5%), Personal Care & Service (91 | 3.2%), Security & Protection (89 | 3.1%), and Law Enforcement (71 | 2.5%).
Services Occupations by Sex
Within the Services occupations in Neptune City borough, the most male-oriented occupations are Security & Protection (100.0%), Firefighting & Prevention (100.0%), and Law Enforcement (100.0%), while the most female-oriented occupations are Healthcare Support (100.0%), Personal Care & Service (83.5%), and Food Preparation & Serving (34.4%).
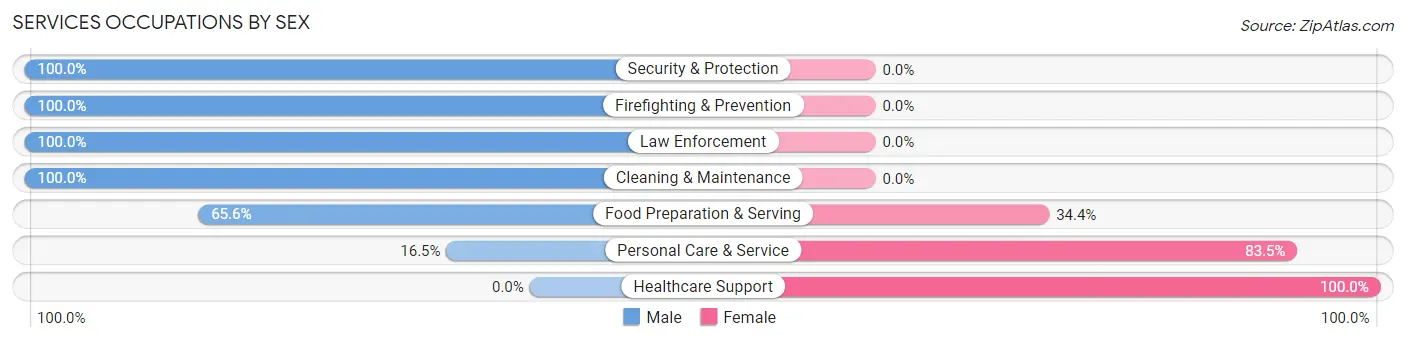
| Occupation | Male | Female |
| Healthcare Support | 0 (0.0%) | 101 (100.0%) |
| Security & Protection | 89 (100.0%) | 0 (0.0%) |
| Firefighting & Prevention | 18 (100.0%) | 0 (0.0%) |
| Law Enforcement | 71 (100.0%) | 0 (0.0%) |
| Food Preparation & Serving | 124 (65.6%) | 65 (34.4%) |
| Cleaning & Maintenance | 57 (100.0%) | 0 (0.0%) |
| Personal Care & Service | 15 (16.5%) | 76 (83.5%) |
| Total (Category) | 285 (54.1%) | 242 (45.9%) |
| Total (Overall) | 1,285 (45.2%) | 1,559 (54.8%) |
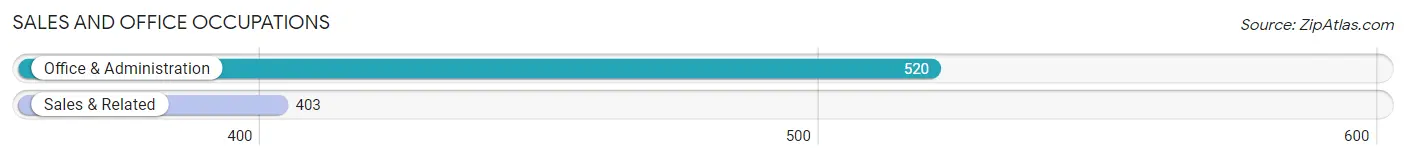
Sales and Office Occupations
The most common Sales and Office occupations in Neptune City borough are Office & Administration (520 | 18.3%), and Sales & Related (403 | 14.2%).
Sales and Office Occupations by Sex
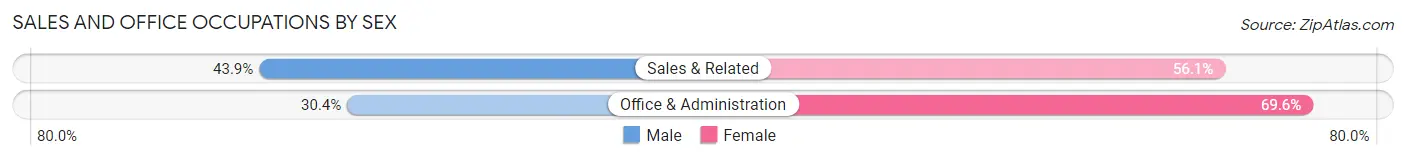
| Occupation | Male | Female |
| Sales & Related | 177 (43.9%) | 226 (56.1%) |
| Office & Administration | 158 (30.4%) | 362 (69.6%) |
| Total (Category) | 335 (36.3%) | 588 (63.7%) |
| Total (Overall) | 1,285 (45.2%) | 1,559 (54.8%) |
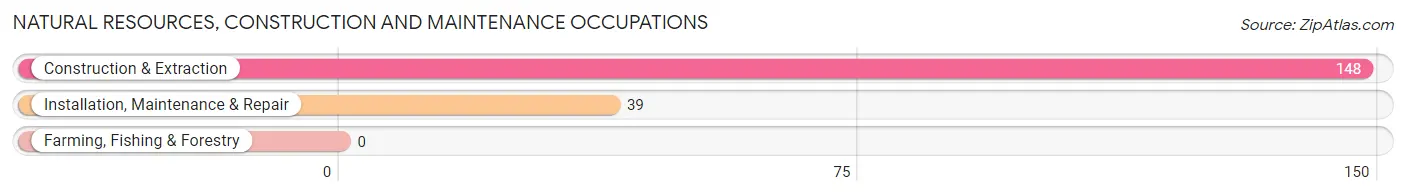
Natural Resources, Construction and Maintenance Occupations
The most common Natural Resources, Construction and Maintenance occupations in Neptune City borough are Construction & Extraction (148 | 5.2%), and Installation, Maintenance & Repair (39 | 1.4%).
Natural Resources, Construction and Maintenance Occupations by Sex
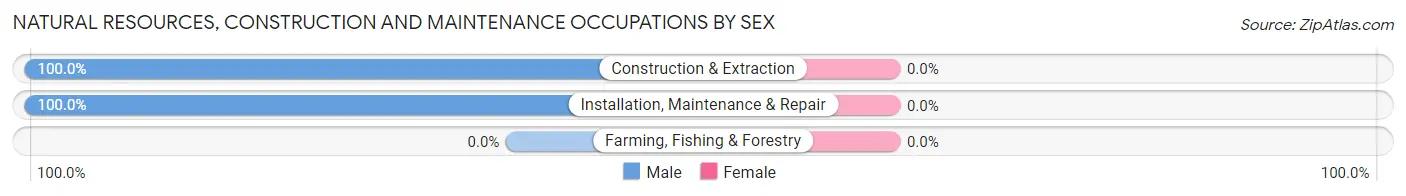
| Occupation | Male | Female |
| Farming, Fishing & Forestry | 0 (0.0%) | 0 (0.0%) |
| Construction & Extraction | 148 (100.0%) | 0 (0.0%) |
| Installation, Maintenance & Repair | 39 (100.0%) | 0 (0.0%) |
| Total (Category) | 187 (100.0%) | 0 (0.0%) |
| Total (Overall) | 1,285 (45.2%) | 1,559 (54.8%) |
Production, Transportation and Moving Occupations
The most common Production, Transportation and Moving occupations in Neptune City borough are Production (183 | 6.4%), Material Moving (64 | 2.2%), and Transportation (56 | 2.0%).
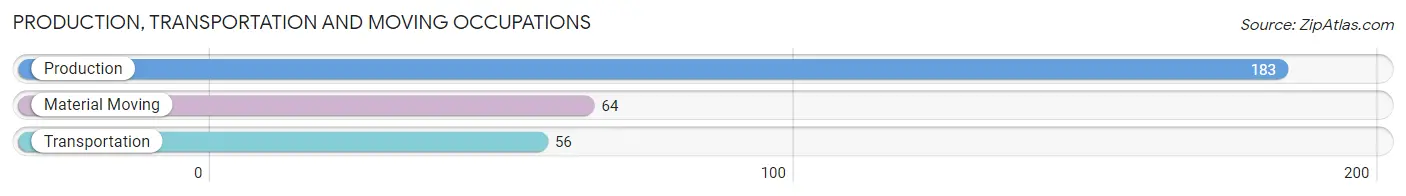
Production, Transportation and Moving Occupations by Sex
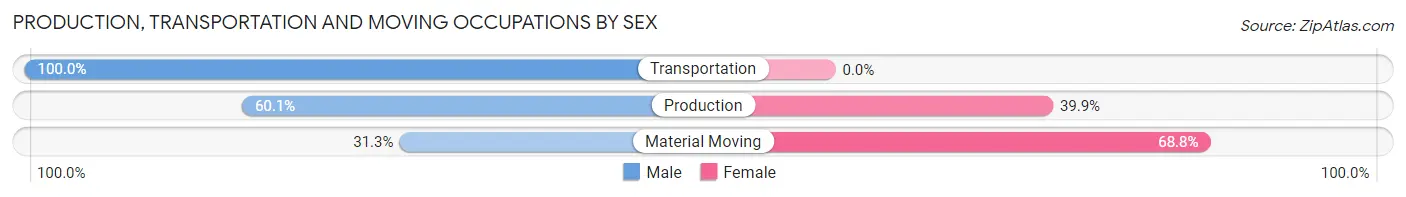
| Occupation | Male | Female |
| Production | 110 (60.1%) | 73 (39.9%) |
| Transportation | 56 (100.0%) | 0 (0.0%) |
| Material Moving | 20 (31.2%) | 44 (68.8%) |
| Total (Category) | 186 (61.4%) | 117 (38.6%) |
| Total (Overall) | 1,285 (45.2%) | 1,559 (54.8%) |
Employment Industries by Sex in Neptune City borough
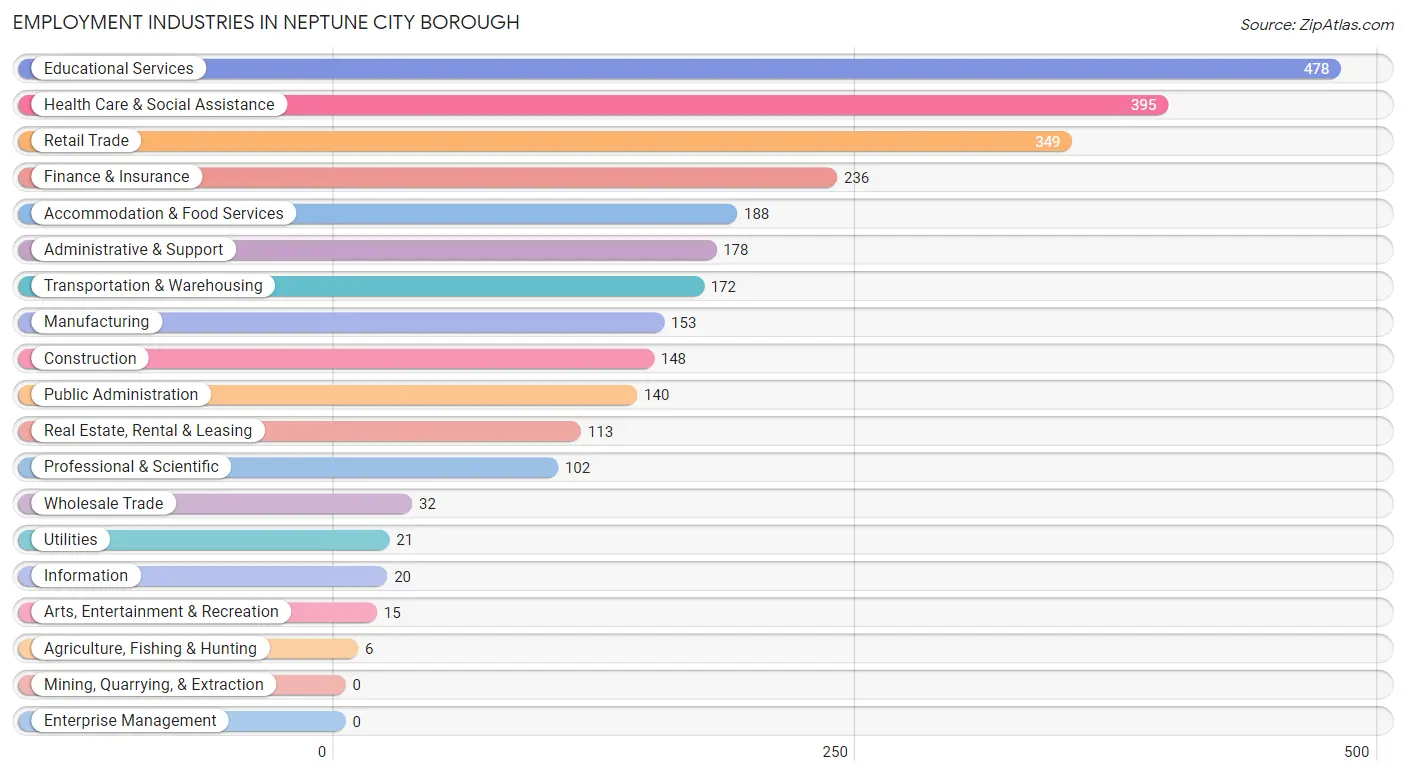
Employment Industries in Neptune City borough
The major employment industries in Neptune City borough include Educational Services (478 | 16.8%), Health Care & Social Assistance (395 | 13.9%), Retail Trade (349 | 12.3%), Finance & Insurance (236 | 8.3%), and Accommodation & Food Services (188 | 6.6%).
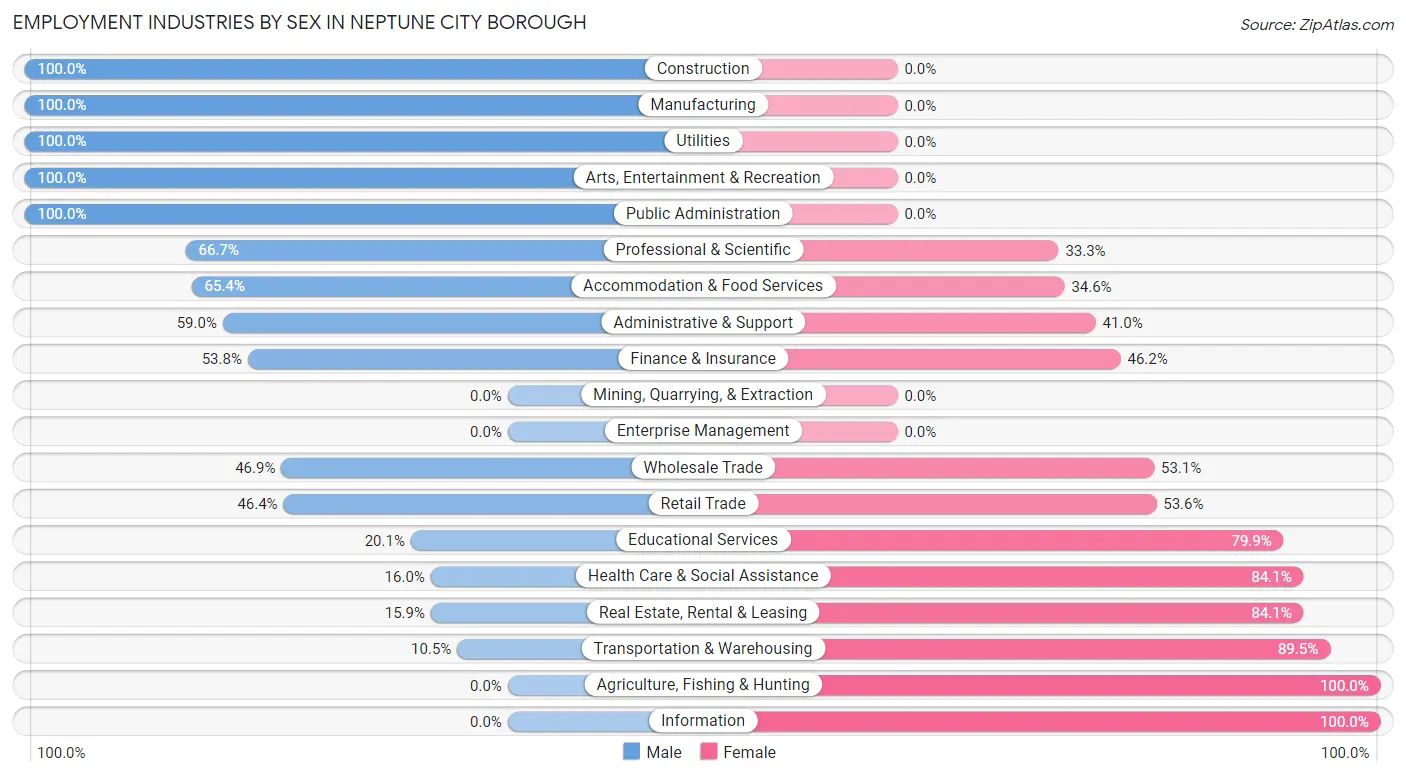
Employment Industries by Sex in Neptune City borough
The Neptune City borough industries that see more men than women are Construction (100.0%), Manufacturing (100.0%), and Utilities (100.0%), whereas the industries that tend to have a higher number of women are Agriculture, Fishing & Hunting (100.0%), Information (100.0%), and Transportation & Warehousing (89.5%).
| Industry | Male | Female |
| Agriculture, Fishing & Hunting | 0 (0.0%) | 6 (100.0%) |
| Mining, Quarrying, & Extraction | 0 (0.0%) | 0 (0.0%) |
| Construction | 148 (100.0%) | 0 (0.0%) |
| Manufacturing | 153 (100.0%) | 0 (0.0%) |
| Wholesale Trade | 15 (46.9%) | 17 (53.1%) |
| Retail Trade | 162 (46.4%) | 187 (53.6%) |
| Transportation & Warehousing | 18 (10.5%) | 154 (89.5%) |
| Utilities | 21 (100.0%) | 0 (0.0%) |
| Information | 0 (0.0%) | 20 (100.0%) |
| Finance & Insurance | 127 (53.8%) | 109 (46.2%) |
| Real Estate, Rental & Leasing | 18 (15.9%) | 95 (84.1%) |
| Professional & Scientific | 68 (66.7%) | 34 (33.3%) |
| Enterprise Management | 0 (0.0%) | 0 (0.0%) |
| Administrative & Support | 105 (59.0%) | 73 (41.0%) |
| Educational Services | 96 (20.1%) | 382 (79.9%) |
| Health Care & Social Assistance | 63 (16.0%) | 332 (84.1%) |
| Arts, Entertainment & Recreation | 15 (100.0%) | 0 (0.0%) |
| Accommodation & Food Services | 123 (65.4%) | 65 (34.6%) |
| Public Administration | 140 (100.0%) | 0 (0.0%) |
| Total | 1,285 (45.2%) | 1,559 (54.8%) |
Education in Neptune City borough
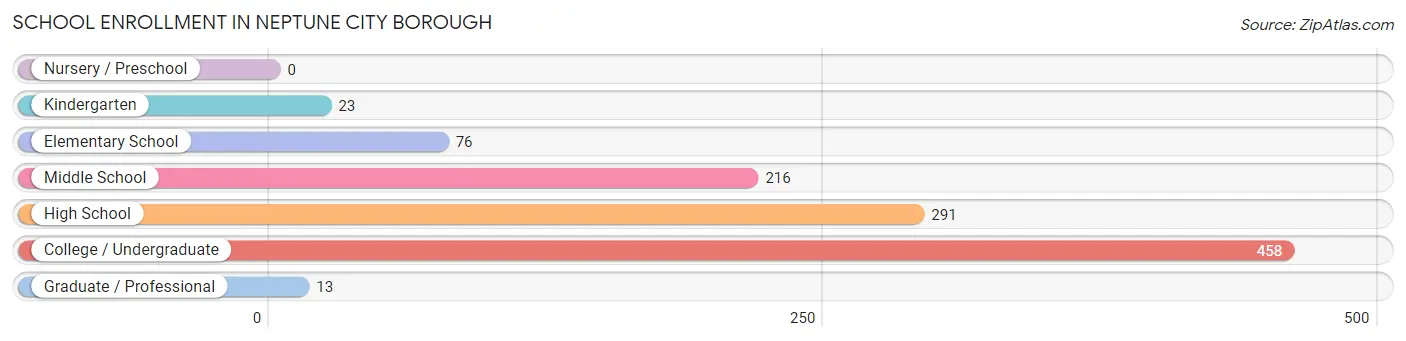
School Enrollment in Neptune City borough
The most common levels of schooling among the 1,077 students in Neptune City borough are college / undergraduate (458 | 42.5%), high school (291 | 27.0%), and middle school (216 | 20.1%).
| School Level | # Students | % Students |
| Nursery / Preschool | 0 | 0.0% |
| Kindergarten | 23 | 2.1% |
| Elementary School | 76 | 7.1% |
| Middle School | 216 | 20.1% |
| High School | 291 | 27.0% |
| College / Undergraduate | 458 | 42.5% |
| Graduate / Professional | 13 | 1.2% |
| Total | 1,077 | 100.0% |
School Enrollment by Age by Funding Source in Neptune City borough
Out of a total of 1,077 students who are enrolled in schools in Neptune City borough, 96 (8.9%) attend a private institution, while the remaining 981 (91.1%) are enrolled in public schools. The age group of 20 to 24 year olds has the highest likelihood of being enrolled in private schools, with 59 (100.0% in the age bracket) enrolled. Conversely, the age group of 10 to 14 year olds has the lowest likelihood of being enrolled in a private school, with 250 (100.0% in the age bracket) attending a public institution.
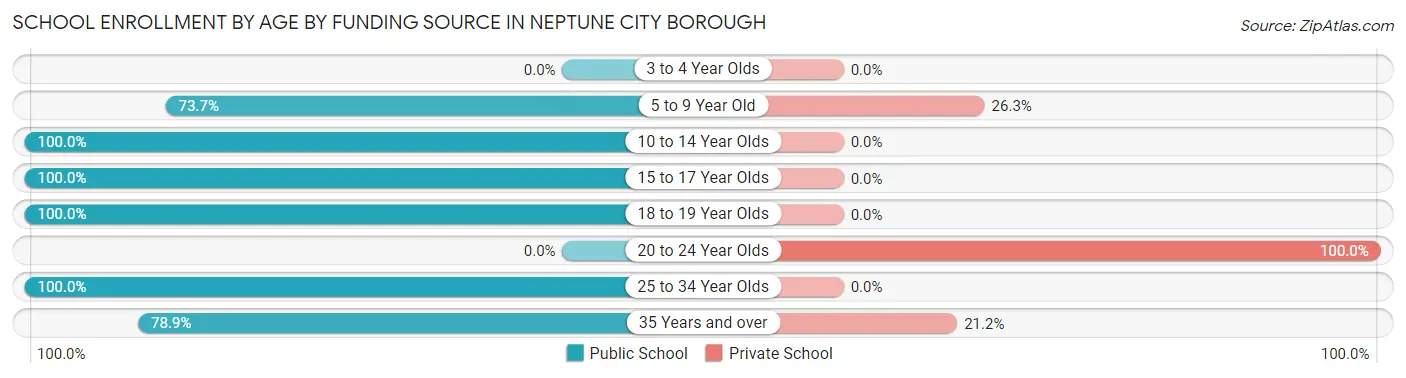
| Age Bracket | Public School | Private School |
| 3 to 4 Year Olds | 0 (0.0%) | 0 (0.0%) |
| 5 to 9 Year Old | 73 (73.7%) | 26 (26.3%) |
| 10 to 14 Year Olds | 250 (100.0%) | 0 (0.0%) |
| 15 to 17 Year Olds | 209 (100.0%) | 0 (0.0%) |
| 18 to 19 Year Olds | 250 (100.0%) | 0 (0.0%) |
| 20 to 24 Year Olds | 0 (0.0%) | 59 (100.0%) |
| 25 to 34 Year Olds | 158 (100.0%) | 0 (0.0%) |
| 35 Years and over | 41 (78.8%) | 11 (21.1%) |
| Total | 981 (91.1%) | 96 (8.9%) |
Educational Attainment by Field of Study in Neptune City borough
Business (229 | 20.4%), education (179 | 15.9%), liberal arts & history (120 | 10.7%), social sciences (103 | 9.2%), and science & technology (91 | 8.1%) are the most common fields of study among 1,123 individuals in Neptune City borough who have obtained a bachelor's degree or higher.
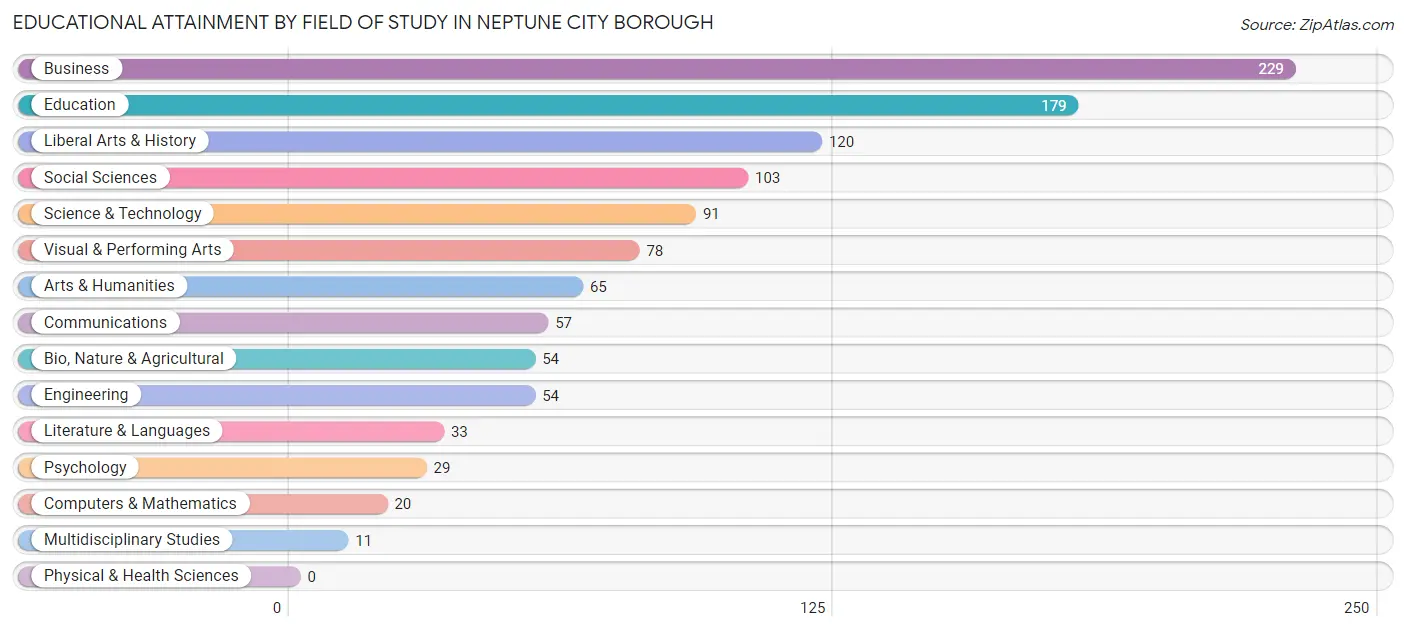
| Field of Study | # Graduates | % Graduates |
| Computers & Mathematics | 20 | 1.8% |
| Bio, Nature & Agricultural | 54 | 4.8% |
| Physical & Health Sciences | 0 | 0.0% |
| Psychology | 29 | 2.6% |
| Social Sciences | 103 | 9.2% |
| Engineering | 54 | 4.8% |
| Multidisciplinary Studies | 11 | 1.0% |
| Science & Technology | 91 | 8.1% |
| Business | 229 | 20.4% |
| Education | 179 | 15.9% |
| Literature & Languages | 33 | 2.9% |
| Liberal Arts & History | 120 | 10.7% |
| Visual & Performing Arts | 78 | 7.0% |
| Communications | 57 | 5.1% |
| Arts & Humanities | 65 | 5.8% |
| Total | 1,123 | 100.0% |
Transportation & Commute in Neptune City borough
Vehicle Availability by Sex in Neptune City borough
The most prevalent vehicle ownership categories in Neptune City borough are males with 2 vehicles (811, accounting for 63.1%) and females with 2 vehicles (797, making up 53.3%).
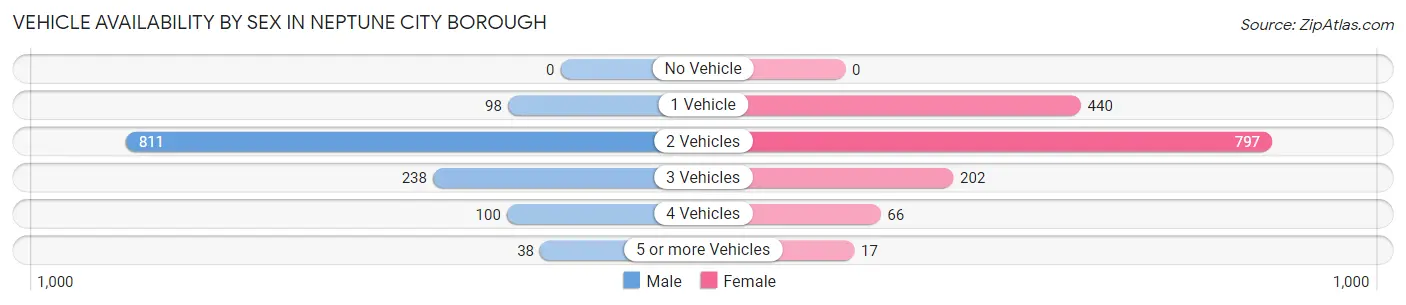
| Vehicles Available | Male | Female |
| No Vehicle | 0 (0.0%) | 0 (0.0%) |
| 1 Vehicle | 98 (7.6%) | 440 (28.9%) |
| 2 Vehicles | 811 (63.1%) | 797 (52.4%) |
| 3 Vehicles | 238 (18.5%) | 202 (13.3%) |
| 4 Vehicles | 100 (7.8%) | 66 (4.3%) |
| 5 or more Vehicles | 38 (3.0%) | 17 (1.1%) |
| Total | 1,285 (100.0%) | 1,522 (100.0%) |
Commute Time in Neptune City borough
The most frequently occuring commute durations in Neptune City borough are 10 to 14 minutes (601 commuters, 22.6%), 15 to 19 minutes (441 commuters, 16.6%), and 5 to 9 minutes (321 commuters, 12.1%).
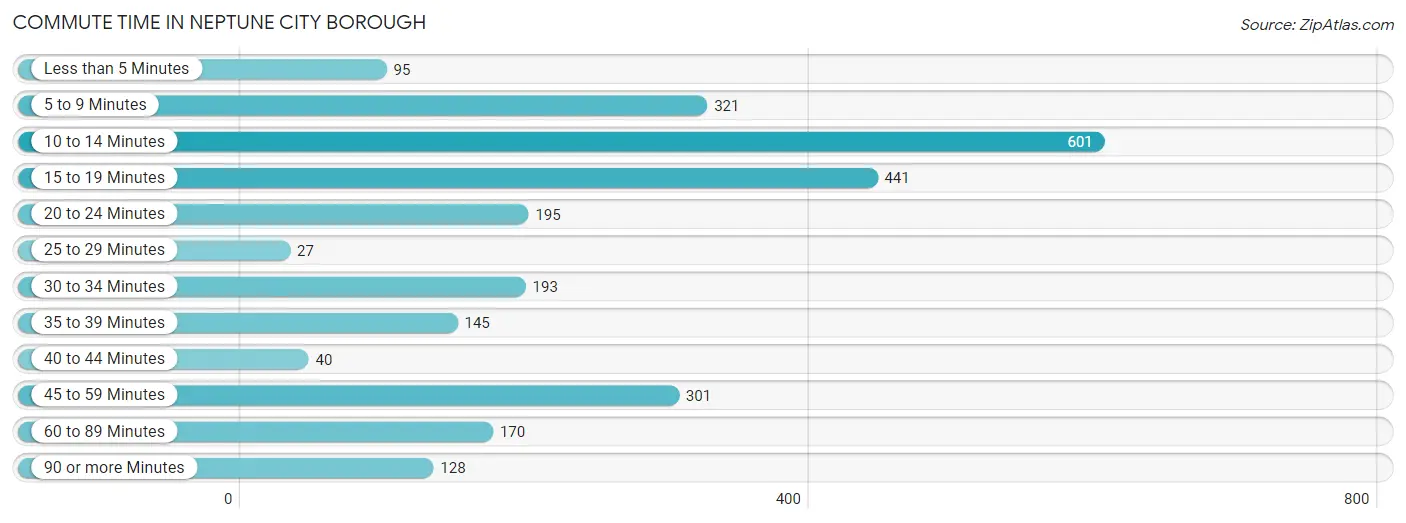
| Commute Time | # Commuters | % Commuters |
| Less than 5 Minutes | 95 | 3.6% |
| 5 to 9 Minutes | 321 | 12.1% |
| 10 to 14 Minutes | 601 | 22.6% |
| 15 to 19 Minutes | 441 | 16.6% |
| 20 to 24 Minutes | 195 | 7.3% |
| 25 to 29 Minutes | 27 | 1.0% |
| 30 to 34 Minutes | 193 | 7.3% |
| 35 to 39 Minutes | 145 | 5.5% |
| 40 to 44 Minutes | 40 | 1.5% |
| 45 to 59 Minutes | 301 | 11.3% |
| 60 to 89 Minutes | 170 | 6.4% |
| 90 or more Minutes | 128 | 4.8% |
Commute Time by Sex in Neptune City borough
The most common commute times in Neptune City borough are 15 to 19 minutes (307 commuters, 24.3%) for males and 10 to 14 minutes (448 commuters, 32.1%) for females.
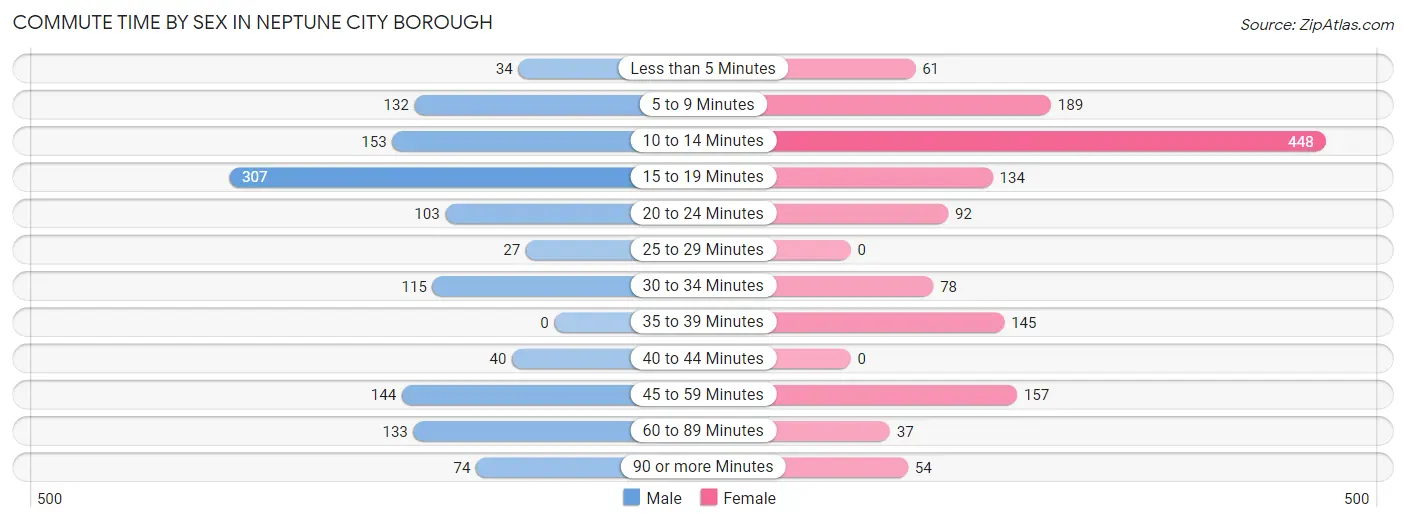
| Commute Time | Male | Female |
| Less than 5 Minutes | 34 (2.7%) | 61 (4.4%) |
| 5 to 9 Minutes | 132 (10.5%) | 189 (13.6%) |
| 10 to 14 Minutes | 153 (12.1%) | 448 (32.1%) |
| 15 to 19 Minutes | 307 (24.3%) | 134 (9.6%) |
| 20 to 24 Minutes | 103 (8.2%) | 92 (6.6%) |
| 25 to 29 Minutes | 27 (2.1%) | 0 (0.0%) |
| 30 to 34 Minutes | 115 (9.1%) | 78 (5.6%) |
| 35 to 39 Minutes | 0 (0.0%) | 145 (10.4%) |
| 40 to 44 Minutes | 40 (3.2%) | 0 (0.0%) |
| 45 to 59 Minutes | 144 (11.4%) | 157 (11.3%) |
| 60 to 89 Minutes | 133 (10.5%) | 37 (2.6%) |
| 90 or more Minutes | 74 (5.9%) | 54 (3.9%) |
Time of Departure to Work by Sex in Neptune City borough
The most frequent times of departure to work in Neptune City borough are 6:00 AM to 6:29 AM (314, 24.9%) for males and 7:30 AM to 7:59 AM (442, 31.7%) for females.
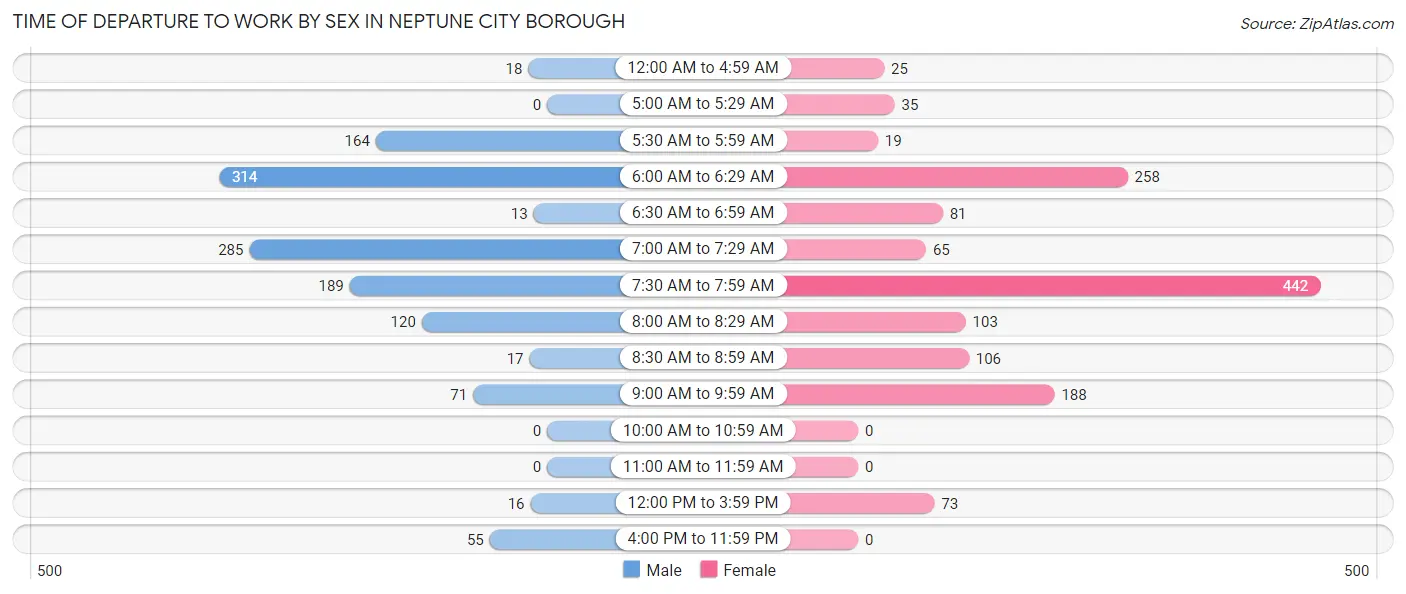
| Time of Departure | Male | Female |
| 12:00 AM to 4:59 AM | 18 (1.4%) | 25 (1.8%) |
| 5:00 AM to 5:29 AM | 0 (0.0%) | 35 (2.5%) |
| 5:30 AM to 5:59 AM | 164 (13.0%) | 19 (1.4%) |
| 6:00 AM to 6:29 AM | 314 (24.9%) | 258 (18.5%) |
| 6:30 AM to 6:59 AM | 13 (1.0%) | 81 (5.8%) |
| 7:00 AM to 7:29 AM | 285 (22.6%) | 65 (4.7%) |
| 7:30 AM to 7:59 AM | 189 (15.0%) | 442 (31.7%) |
| 8:00 AM to 8:29 AM | 120 (9.5%) | 103 (7.4%) |
| 8:30 AM to 8:59 AM | 17 (1.3%) | 106 (7.6%) |
| 9:00 AM to 9:59 AM | 71 (5.6%) | 188 (13.5%) |
| 10:00 AM to 10:59 AM | 0 (0.0%) | 0 (0.0%) |
| 11:00 AM to 11:59 AM | 0 (0.0%) | 0 (0.0%) |
| 12:00 PM to 3:59 PM | 16 (1.3%) | 73 (5.2%) |
| 4:00 PM to 11:59 PM | 55 (4.4%) | 0 (0.0%) |
| Total | 1,262 (100.0%) | 1,395 (100.0%) |
Housing Occupancy in Neptune City borough
Occupancy by Ownership in Neptune City borough
Of the total 2,219 dwellings in Neptune City borough, owner-occupied units account for 1,288 (58.0%), while renter-occupied units make up 931 (42.0%).
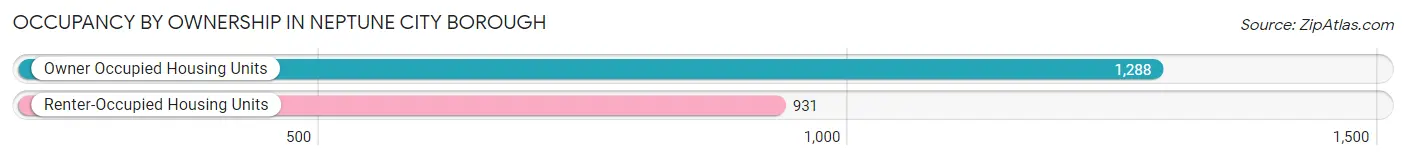
| Occupancy | # Housing Units | % Housing Units |
| Owner Occupied Housing Units | 1,288 | 58.0% |
| Renter-Occupied Housing Units | 931 | 42.0% |
| Total Occupied Housing Units | 2,219 | 100.0% |
Occupancy by Household Size in Neptune City borough
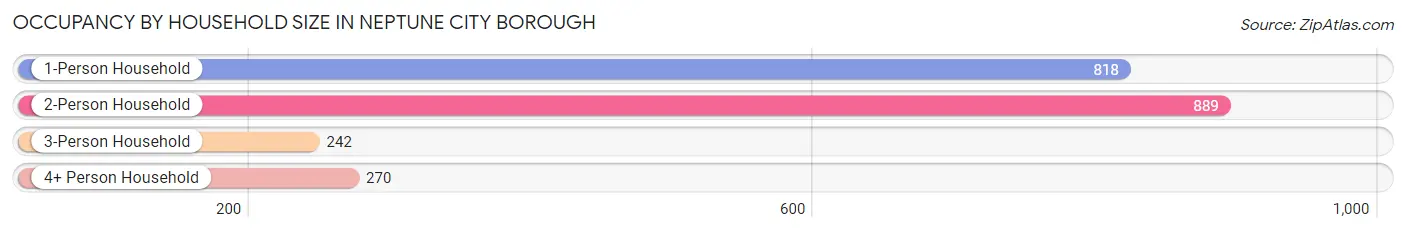
| Household Size | # Housing Units | % Housing Units |
| 1-Person Household | 818 | 36.9% |
| 2-Person Household | 889 | 40.1% |
| 3-Person Household | 242 | 10.9% |
| 4+ Person Household | 270 | 12.2% |
| Total Housing Units | 2,219 | 100.0% |
Occupancy by Ownership by Household Size in Neptune City borough
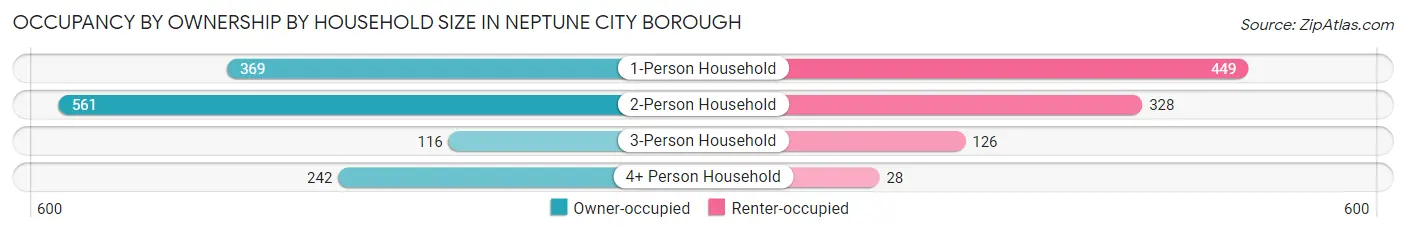
| Household Size | Owner-occupied | Renter-occupied |
| 1-Person Household | 369 (45.1%) | 449 (54.9%) |
| 2-Person Household | 561 (63.1%) | 328 (36.9%) |
| 3-Person Household | 116 (47.9%) | 126 (52.1%) |
| 4+ Person Household | 242 (89.6%) | 28 (10.4%) |
| Total Housing Units | 1,288 (58.0%) | 931 (42.0%) |
Occupancy by Educational Attainment in Neptune City borough
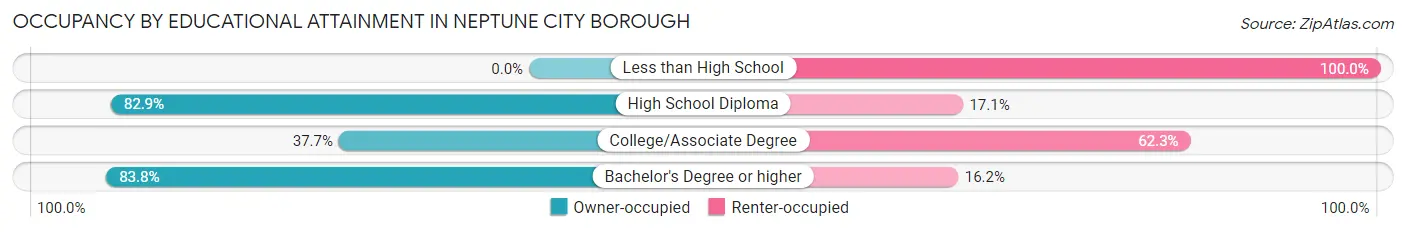
| Household Size | Owner-occupied | Renter-occupied |
| Less than High School | 0 (0.0%) | 14 (100.0%) |
| High School Diploma | 310 (82.9%) | 64 (17.1%) |
| College/Associate Degree | 455 (37.7%) | 752 (62.3%) |
| Bachelor's Degree or higher | 523 (83.8%) | 101 (16.2%) |
Occupancy by Age of Householder in Neptune City borough
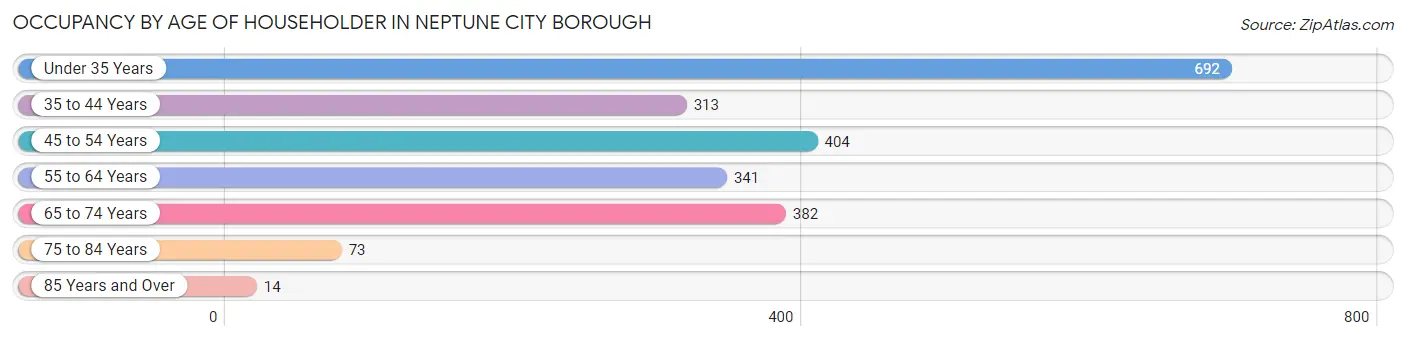
| Age Bracket | # Households | % Households |
| Under 35 Years | 692 | 31.2% |
| 35 to 44 Years | 313 | 14.1% |
| 45 to 54 Years | 404 | 18.2% |
| 55 to 64 Years | 341 | 15.4% |
| 65 to 74 Years | 382 | 17.2% |
| 75 to 84 Years | 73 | 3.3% |
| 85 Years and Over | 14 | 0.6% |
| Total | 2,219 | 100.0% |
Housing Finances in Neptune City borough
Median Income by Occupancy in Neptune City borough
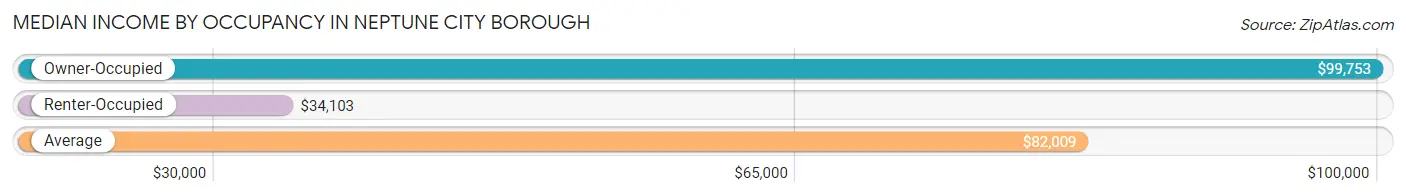
| Occupancy Type | # Households | Median Income |
| Owner-Occupied | 1,288 (58.0%) | $99,753 |
| Renter-Occupied | 931 (42.0%) | $34,103 |
| Average | 2,219 (100.0%) | $82,009 |
Occupancy by Householder Income Bracket in Neptune City borough
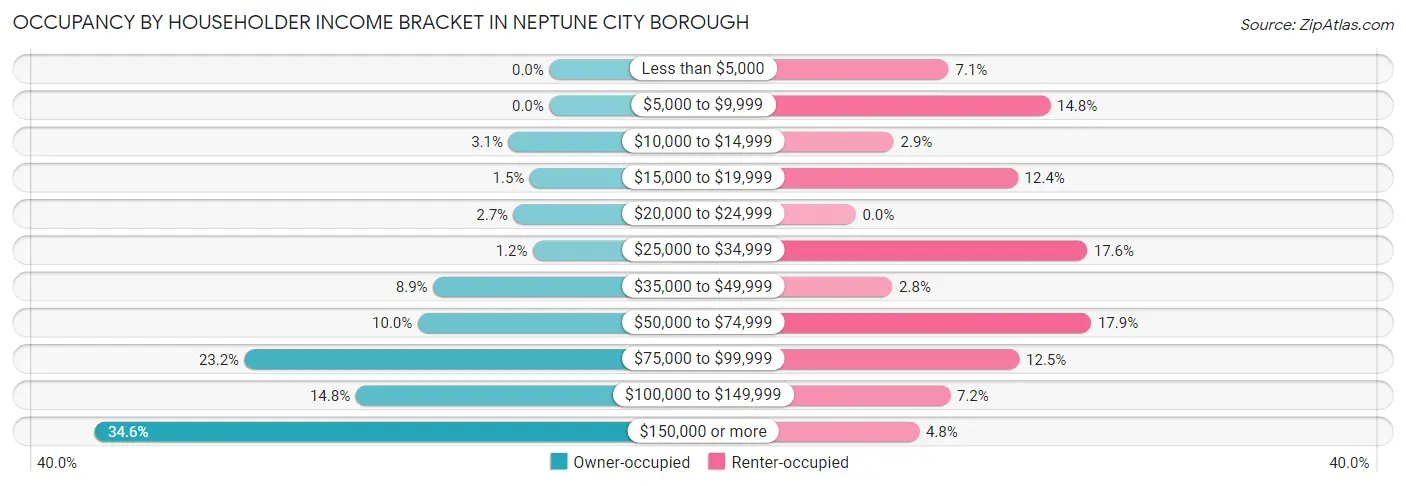
| Income Bracket | Owner-occupied | Renter-occupied |
| Less than $5,000 | 0 (0.0%) | 66 (7.1%) |
| $5,000 to $9,999 | 0 (0.0%) | 138 (14.8%) |
| $10,000 to $14,999 | 40 (3.1%) | 27 (2.9%) |
| $15,000 to $19,999 | 19 (1.5%) | 115 (12.3%) |
| $20,000 to $24,999 | 35 (2.7%) | 0 (0.0%) |
| $25,000 to $34,999 | 16 (1.2%) | 164 (17.6%) |
| $35,000 to $49,999 | 114 (8.8%) | 26 (2.8%) |
| $50,000 to $74,999 | 129 (10.0%) | 167 (17.9%) |
| $75,000 to $99,999 | 299 (23.2%) | 116 (12.5%) |
| $100,000 to $149,999 | 190 (14.7%) | 67 (7.2%) |
| $150,000 or more | 446 (34.6%) | 45 (4.8%) |
| Total | 1,288 (100.0%) | 931 (100.0%) |
Monthly Housing Cost Tiers in Neptune City borough
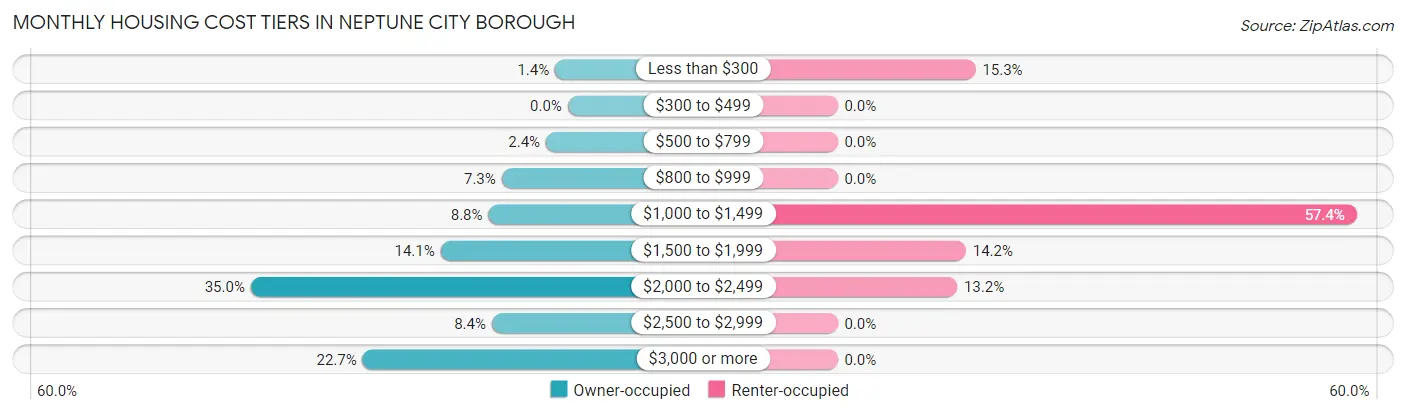
| Monthly Cost | Owner-occupied | Renter-occupied |
| Less than $300 | 18 (1.4%) | 142 (15.2%) |
| $300 to $499 | 0 (0.0%) | 0 (0.0%) |
| $500 to $799 | 31 (2.4%) | 0 (0.0%) |
| $800 to $999 | 94 (7.3%) | 0 (0.0%) |
| $1,000 to $1,499 | 113 (8.8%) | 534 (57.4%) |
| $1,500 to $1,999 | 181 (14.1%) | 132 (14.2%) |
| $2,000 to $2,499 | 451 (35.0%) | 123 (13.2%) |
| $2,500 to $2,999 | 108 (8.4%) | 0 (0.0%) |
| $3,000 or more | 292 (22.7%) | 0 (0.0%) |
| Total | 1,288 (100.0%) | 931 (100.0%) |
Physical Housing Characteristics in Neptune City borough
Housing Structures in Neptune City borough
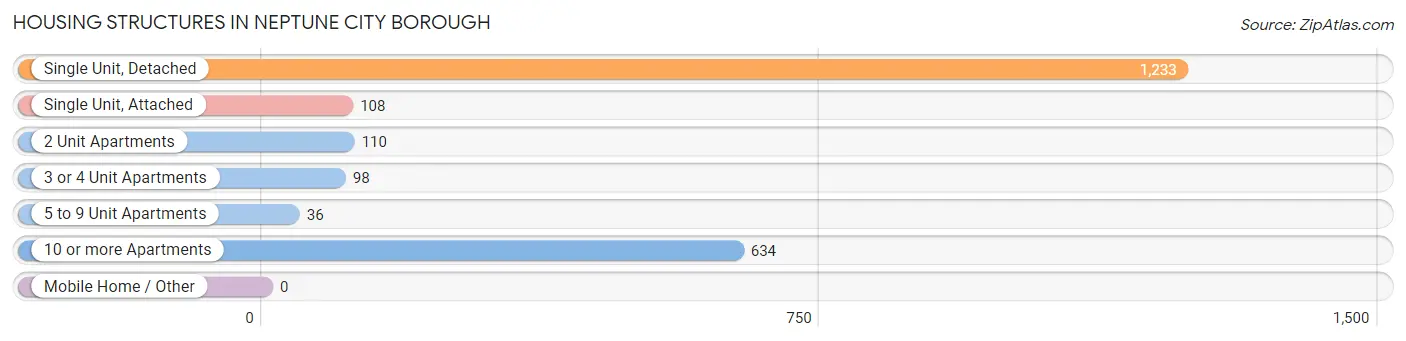
| Structure Type | # Housing Units | % Housing Units |
| Single Unit, Detached | 1,233 | 55.6% |
| Single Unit, Attached | 108 | 4.9% |
| 2 Unit Apartments | 110 | 5.0% |
| 3 or 4 Unit Apartments | 98 | 4.4% |
| 5 to 9 Unit Apartments | 36 | 1.6% |
| 10 or more Apartments | 634 | 28.6% |
| Mobile Home / Other | 0 | 0.0% |
| Total | 2,219 | 100.0% |
Housing Structures by Occupancy in Neptune City borough
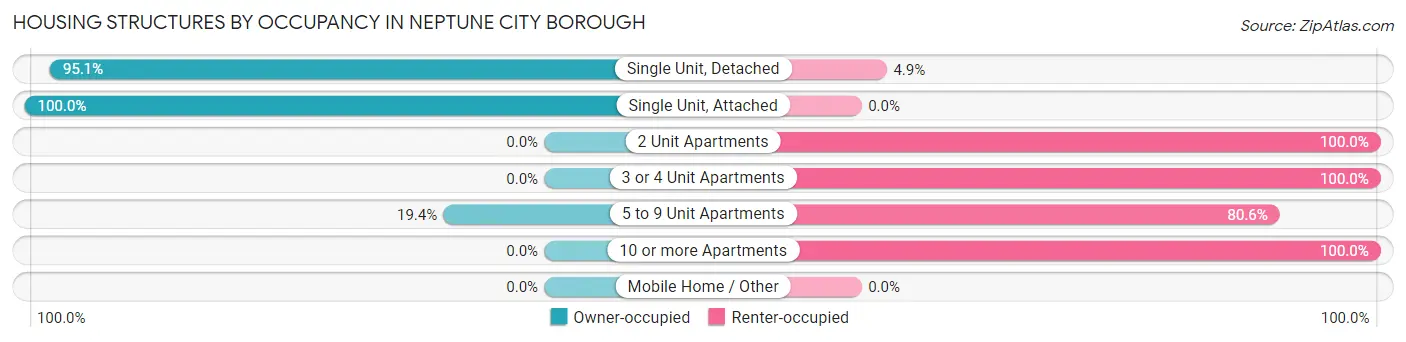
| Structure Type | Owner-occupied | Renter-occupied |
| Single Unit, Detached | 1,173 (95.1%) | 60 (4.9%) |
| Single Unit, Attached | 108 (100.0%) | 0 (0.0%) |
| 2 Unit Apartments | 0 (0.0%) | 110 (100.0%) |
| 3 or 4 Unit Apartments | 0 (0.0%) | 98 (100.0%) |
| 5 to 9 Unit Apartments | 7 (19.4%) | 29 (80.6%) |
| 10 or more Apartments | 0 (0.0%) | 634 (100.0%) |
| Mobile Home / Other | 0 (0.0%) | 0 (0.0%) |
| Total | 1,288 (58.0%) | 931 (42.0%) |
Housing Structures by Number of Rooms in Neptune City borough
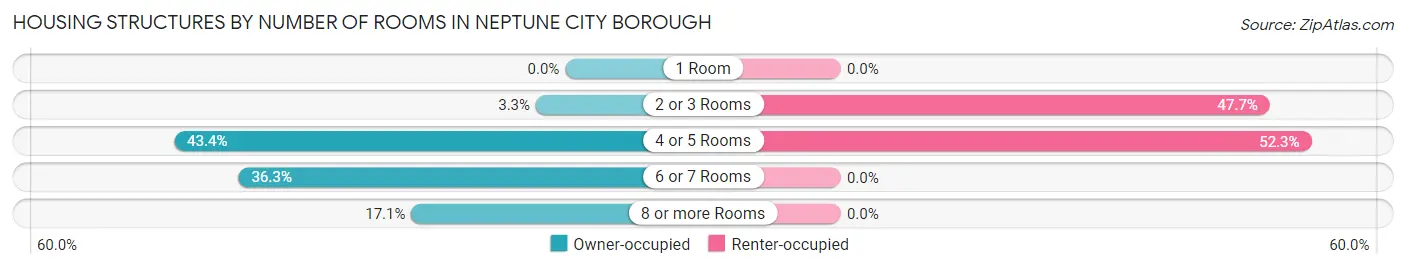
| Number of Rooms | Owner-occupied | Renter-occupied |
| 1 Room | 0 (0.0%) | 0 (0.0%) |
| 2 or 3 Rooms | 42 (3.3%) | 444 (47.7%) |
| 4 or 5 Rooms | 559 (43.4%) | 487 (52.3%) |
| 6 or 7 Rooms | 467 (36.3%) | 0 (0.0%) |
| 8 or more Rooms | 220 (17.1%) | 0 (0.0%) |
| Total | 1,288 (100.0%) | 931 (100.0%) |
Housing Structure by Heating Type in Neptune City borough
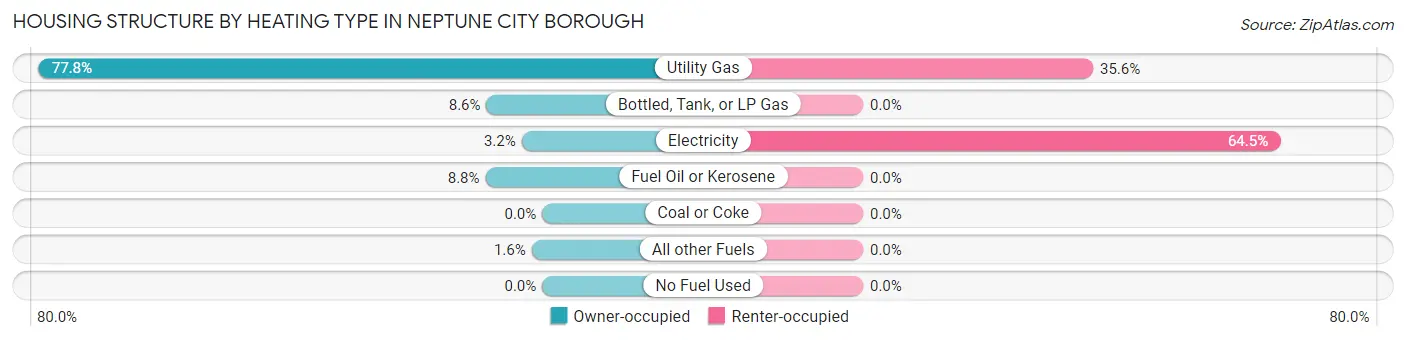
| Heating Type | Owner-occupied | Renter-occupied |
| Utility Gas | 1,002 (77.8%) | 331 (35.5%) |
| Bottled, Tank, or LP Gas | 111 (8.6%) | 0 (0.0%) |
| Electricity | 41 (3.2%) | 600 (64.4%) |
| Fuel Oil or Kerosene | 113 (8.8%) | 0 (0.0%) |
| Coal or Coke | 0 (0.0%) | 0 (0.0%) |
| All other Fuels | 21 (1.6%) | 0 (0.0%) |
| No Fuel Used | 0 (0.0%) | 0 (0.0%) |
| Total | 1,288 (100.0%) | 931 (100.0%) |
Household Vehicle Usage in Neptune City borough
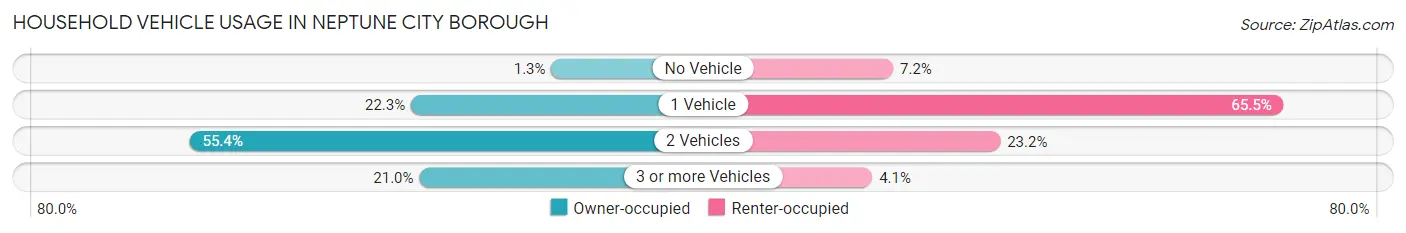
| Vehicles per Household | Owner-occupied | Renter-occupied |
| No Vehicle | 17 (1.3%) | 67 (7.2%) |
| 1 Vehicle | 287 (22.3%) | 610 (65.5%) |
| 2 Vehicles | 713 (55.4%) | 216 (23.2%) |
| 3 or more Vehicles | 271 (21.0%) | 38 (4.1%) |
| Total | 1,288 (100.0%) | 931 (100.0%) |
Real Estate & Mortgages in Neptune City borough
Real Estate and Mortgage Overview in Neptune City borough
| Characteristic | Without Mortgage | With Mortgage |
| Housing Units | 235 | 1,053 |
| Median Property Value | $366,200 | $368,400 |
| Median Household Income | $82,188 | $380 |
| Monthly Housing Costs | $958 | $292 |
| Real Estate Taxes | $6,413 | $0 |
Property Value by Mortgage Status in Neptune City borough
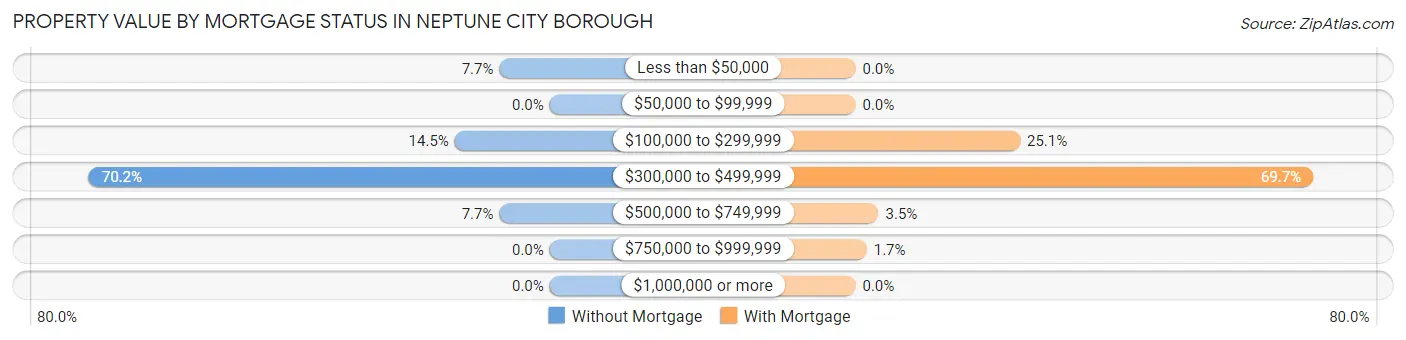
| Property Value | Without Mortgage | With Mortgage |
| Less than $50,000 | 18 (7.7%) | 0 (0.0%) |
| $50,000 to $99,999 | 0 (0.0%) | 0 (0.0%) |
| $100,000 to $299,999 | 34 (14.5%) | 264 (25.1%) |
| $300,000 to $499,999 | 165 (70.2%) | 734 (69.7%) |
| $500,000 to $749,999 | 18 (7.7%) | 37 (3.5%) |
| $750,000 to $999,999 | 0 (0.0%) | 18 (1.7%) |
| $1,000,000 or more | 0 (0.0%) | 0 (0.0%) |
| Total | 235 (100.0%) | 1,053 (100.0%) |
Household Income by Mortgage Status in Neptune City borough
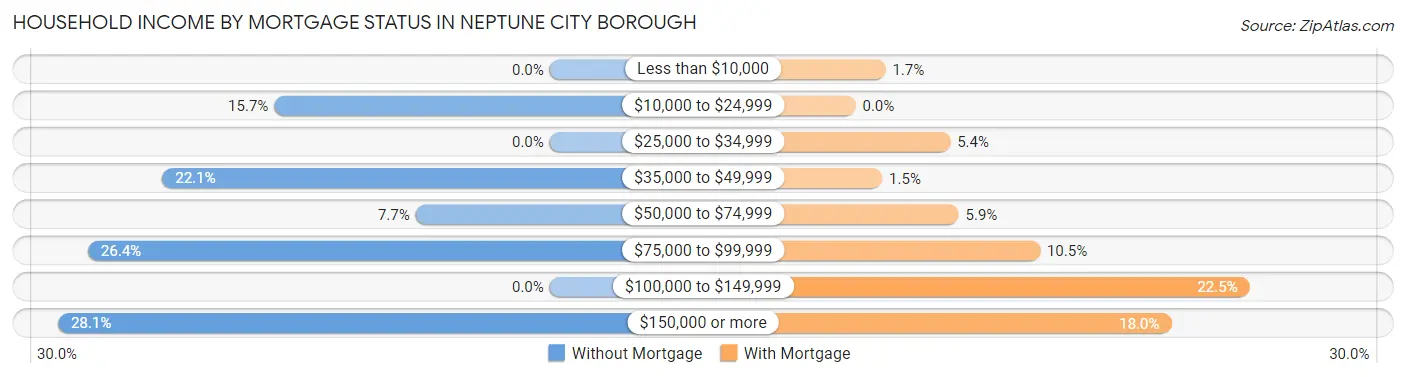
| Household Income | Without Mortgage | With Mortgage |
| Less than $10,000 | 0 (0.0%) | 18 (1.7%) |
| $10,000 to $24,999 | 37 (15.7%) | 0 (0.0%) |
| $25,000 to $34,999 | 0 (0.0%) | 57 (5.4%) |
| $35,000 to $49,999 | 52 (22.1%) | 16 (1.5%) |
| $50,000 to $74,999 | 18 (7.7%) | 62 (5.9%) |
| $75,000 to $99,999 | 62 (26.4%) | 111 (10.5%) |
| $100,000 to $149,999 | 0 (0.0%) | 237 (22.5%) |
| $150,000 or more | 66 (28.1%) | 190 (18.0%) |
| Total | 235 (100.0%) | 1,053 (100.0%) |
Property Value to Household Income Ratio in Neptune City borough
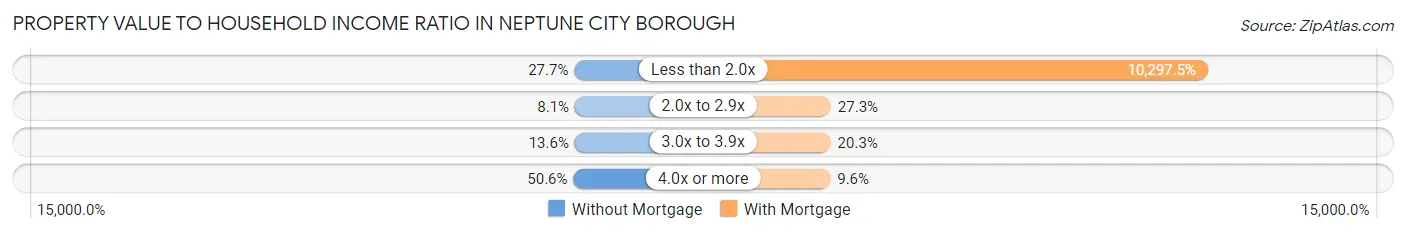
| Value-to-Income Ratio | Without Mortgage | With Mortgage |
| Less than 2.0x | 65 (27.7%) | 108,433 (10,297.5%) |
| 2.0x to 2.9x | 19 (8.1%) | 287 (27.3%) |
| 3.0x to 3.9x | 32 (13.6%) | 214 (20.3%) |
| 4.0x or more | 119 (50.6%) | 101 (9.6%) |
| Total | 235 (100.0%) | 1,053 (100.0%) |
Real Estate Taxes by Mortgage Status in Neptune City borough
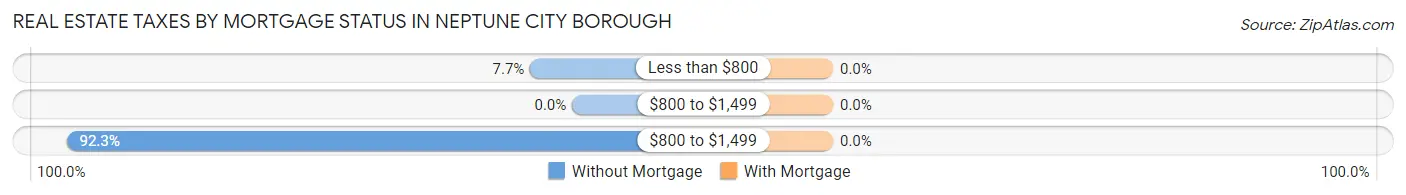
| Property Taxes | Without Mortgage | With Mortgage |
| Less than $800 | 18 (7.7%) | 0 (0.0%) |
| $800 to $1,499 | 0 (0.0%) | 0 (0.0%) |
| $800 to $1,499 | 217 (92.3%) | 0 (0.0%) |
| Total | 235 (100.0%) | 1,053 (100.0%) |
Health & Disability in Neptune City borough
Health Insurance Coverage by Age in Neptune City borough
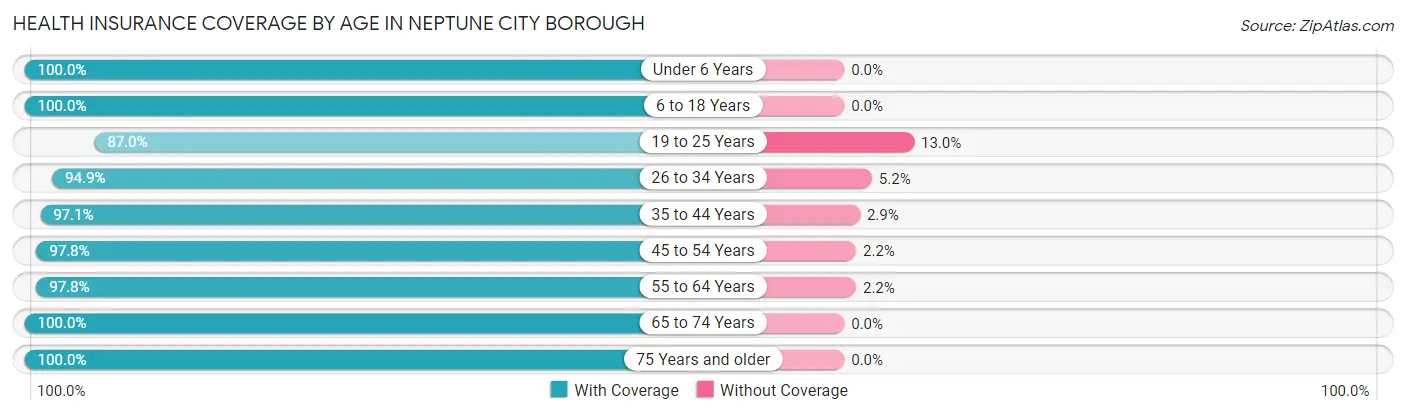
| Age Bracket | With Coverage | Without Coverage |
| Under 6 Years | 289 (100.0%) | 0 (0.0%) |
| 6 to 18 Years | 555 (100.0%) | 0 (0.0%) |
| 19 to 25 Years | 475 (87.0%) | 71 (13.0%) |
| 26 to 34 Years | 626 (94.9%) | 34 (5.1%) |
| 35 to 44 Years | 465 (97.1%) | 14 (2.9%) |
| 45 to 54 Years | 710 (97.8%) | 16 (2.2%) |
| 55 to 64 Years | 713 (97.8%) | 16 (2.2%) |
| 65 to 74 Years | 420 (100.0%) | 0 (0.0%) |
| 75 Years and older | 132 (100.0%) | 0 (0.0%) |
| Total | 4,385 (96.7%) | 151 (3.3%) |
Health Insurance Coverage by Citizenship Status in Neptune City borough
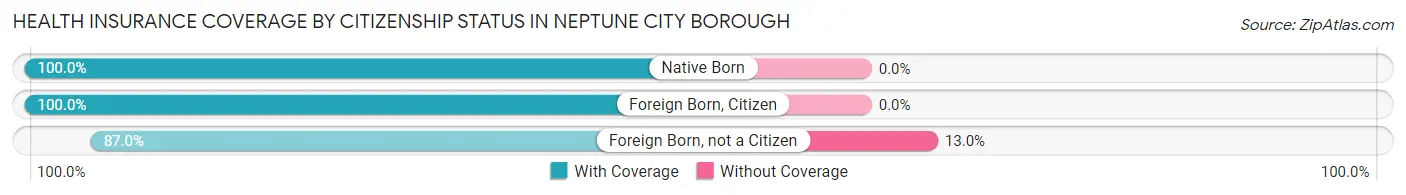
| Citizenship Status | With Coverage | Without Coverage |
| Native Born | 289 (100.0%) | 0 (0.0%) |
| Foreign Born, Citizen | 555 (100.0%) | 0 (0.0%) |
| Foreign Born, not a Citizen | 475 (87.0%) | 71 (13.0%) |
Health Insurance Coverage by Household Income in Neptune City borough
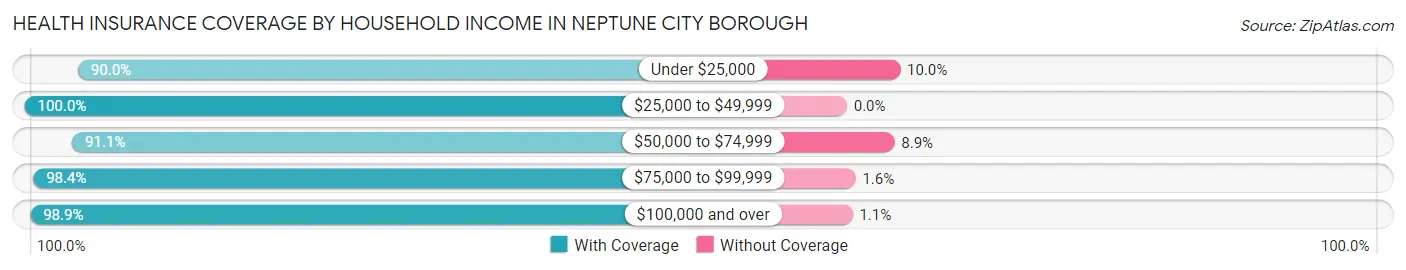
| Household Income | With Coverage | Without Coverage |
| Under $25,000 | 640 (90.0%) | 71 (10.0%) |
| $25,000 to $49,999 | 459 (100.0%) | 0 (0.0%) |
| $50,000 to $74,999 | 470 (91.1%) | 46 (8.9%) |
| $75,000 to $99,999 | 669 (98.4%) | 11 (1.6%) |
| $100,000 and over | 2,147 (98.9%) | 23 (1.1%) |
Public vs Private Health Insurance Coverage by Age in Neptune City borough
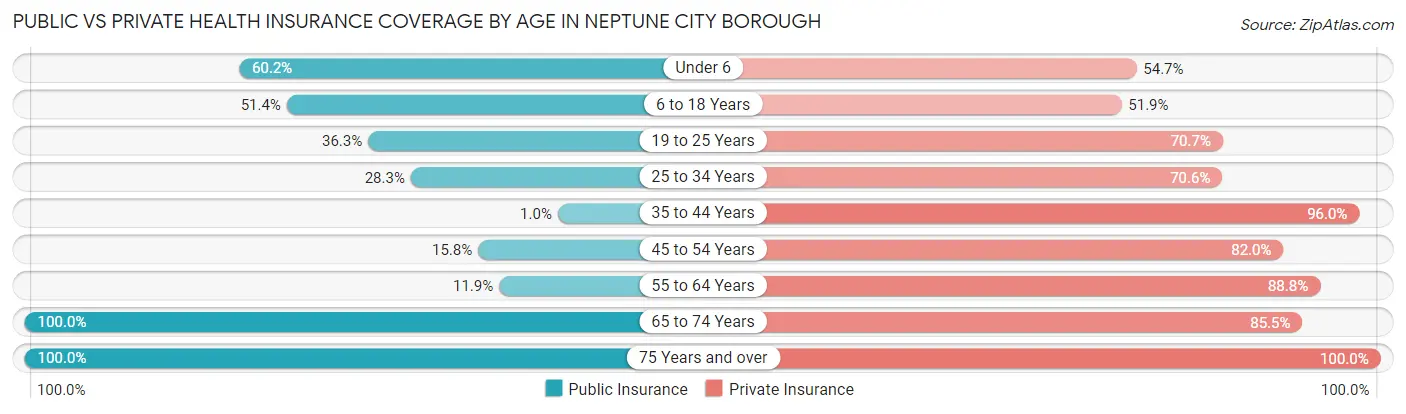
| Age Bracket | Public Insurance | Private Insurance |
| Under 6 | 174 (60.2%) | 158 (54.7%) |
| 6 to 18 Years | 285 (51.3%) | 288 (51.9%) |
| 19 to 25 Years | 198 (36.3%) | 386 (70.7%) |
| 25 to 34 Years | 187 (28.3%) | 466 (70.6%) |
| 35 to 44 Years | 5 (1.0%) | 460 (96.0%) |
| 45 to 54 Years | 115 (15.8%) | 595 (82.0%) |
| 55 to 64 Years | 87 (11.9%) | 647 (88.7%) |
| 65 to 74 Years | 420 (100.0%) | 359 (85.5%) |
| 75 Years and over | 132 (100.0%) | 132 (100.0%) |
| Total | 1,603 (35.3%) | 3,491 (77.0%) |
Disability Status by Sex by Age in Neptune City borough
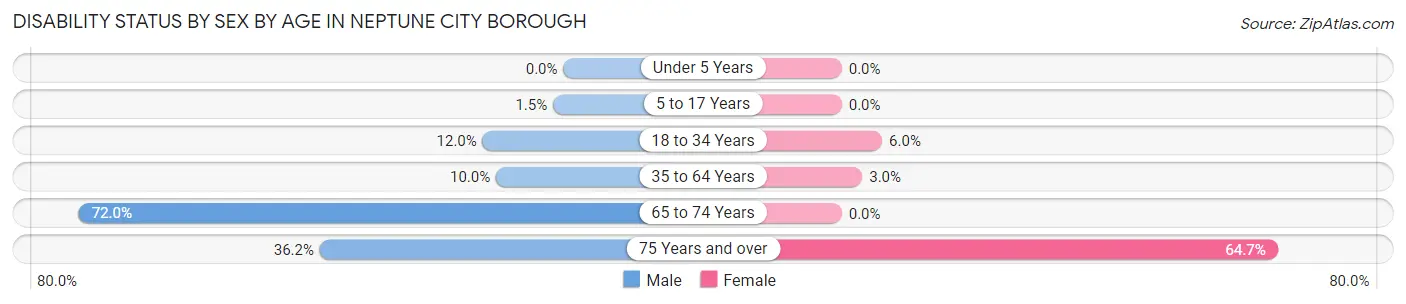
| Age Bracket | Male | Female |
| Under 5 Years | 0 (0.0%) | 0 (0.0%) |
| 5 to 17 Years | 6 (1.5%) | 0 (0.0%) |
| 18 to 34 Years | 59 (12.0%) | 44 (6.0%) |
| 35 to 64 Years | 88 (10.0%) | 32 (3.0%) |
| 65 to 74 Years | 231 (72.0%) | 0 (0.0%) |
| 75 Years and over | 17 (36.2%) | 55 (64.7%) |
Disability Class by Sex by Age in Neptune City borough
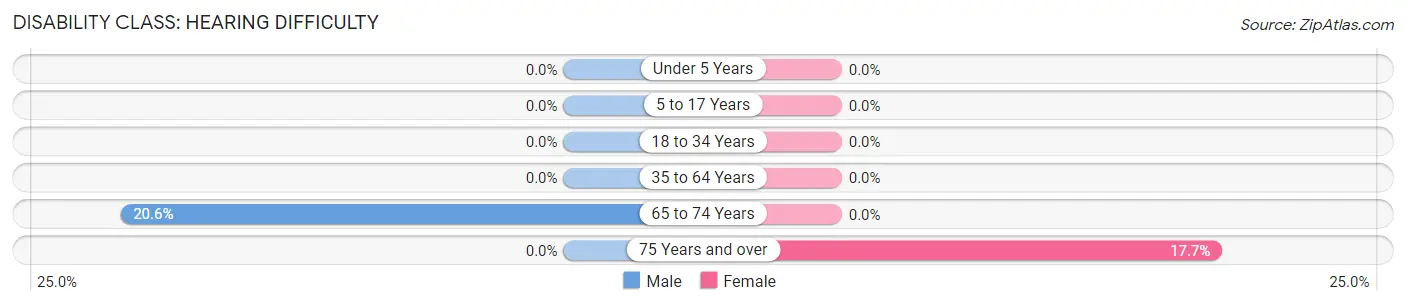
Disability Class: Hearing Difficulty
| Age Bracket | Male | Female |
| Under 5 Years | 0 (0.0%) | 0 (0.0%) |
| 5 to 17 Years | 0 (0.0%) | 0 (0.0%) |
| 18 to 34 Years | 0 (0.0%) | 0 (0.0%) |
| 35 to 64 Years | 0 (0.0%) | 0 (0.0%) |
| 65 to 74 Years | 66 (20.6%) | 0 (0.0%) |
| 75 Years and over | 0 (0.0%) | 15 (17.6%) |
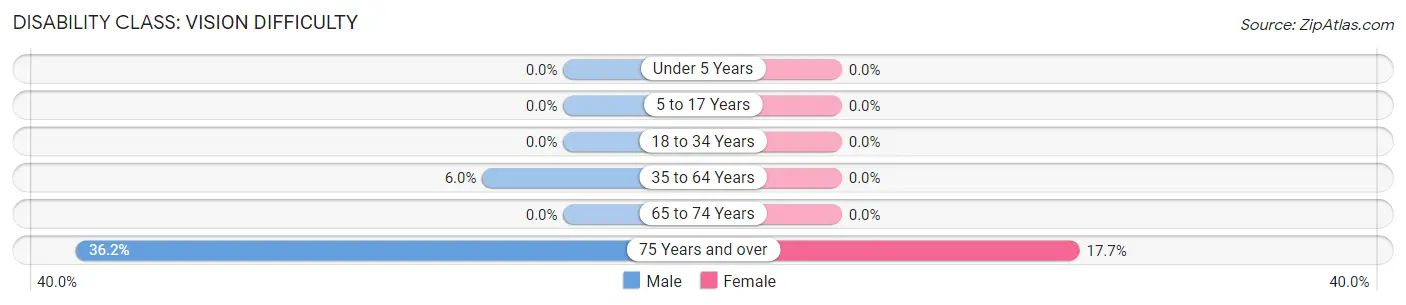
Disability Class: Vision Difficulty
| Age Bracket | Male | Female |
| Under 5 Years | 0 (0.0%) | 0 (0.0%) |
| 5 to 17 Years | 0 (0.0%) | 0 (0.0%) |
| 18 to 34 Years | 0 (0.0%) | 0 (0.0%) |
| 35 to 64 Years | 53 (6.0%) | 0 (0.0%) |
| 65 to 74 Years | 0 (0.0%) | 0 (0.0%) |
| 75 Years and over | 17 (36.2%) | 15 (17.6%) |
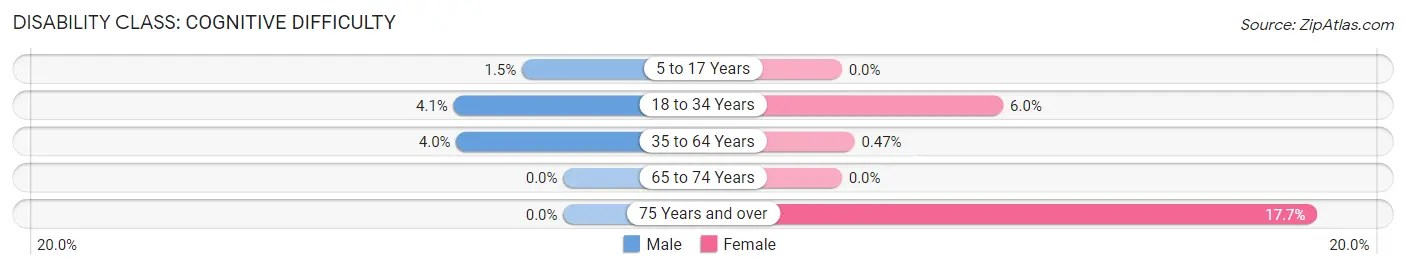
Disability Class: Cognitive Difficulty
| Age Bracket | Male | Female |
| 5 to 17 Years | 6 (1.5%) | 0 (0.0%) |
| 18 to 34 Years | 20 (4.1%) | 44 (6.0%) |
| 35 to 64 Years | 35 (4.0%) | 5 (0.5%) |
| 65 to 74 Years | 0 (0.0%) | 0 (0.0%) |
| 75 Years and over | 0 (0.0%) | 15 (17.6%) |
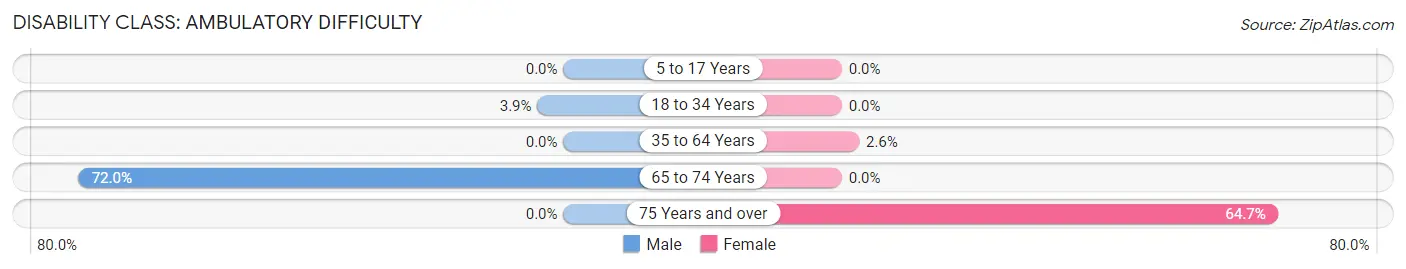
Disability Class: Ambulatory Difficulty
| Age Bracket | Male | Female |
| 5 to 17 Years | 0 (0.0%) | 0 (0.0%) |
| 18 to 34 Years | 19 (3.9%) | 0 (0.0%) |
| 35 to 64 Years | 0 (0.0%) | 27 (2.6%) |
| 65 to 74 Years | 231 (72.0%) | 0 (0.0%) |
| 75 Years and over | 0 (0.0%) | 55 (64.7%) |
Disability Class: Self-Care Difficulty
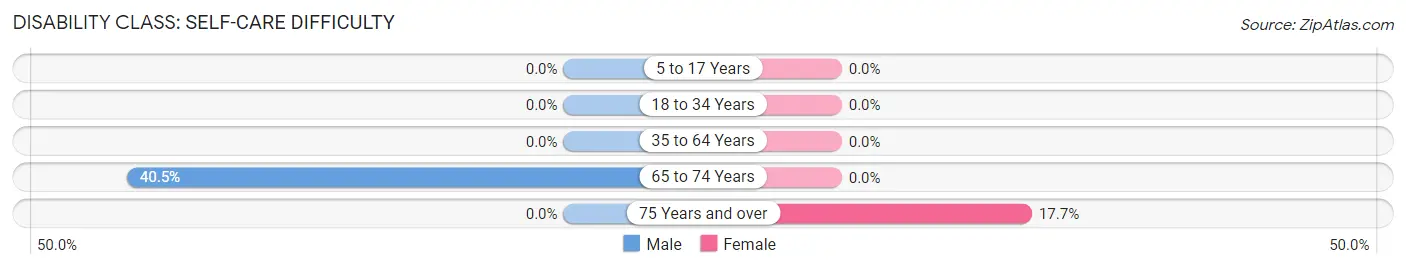
| Age Bracket | Male | Female |
| 5 to 17 Years | 0 (0.0%) | 0 (0.0%) |
| 18 to 34 Years | 0 (0.0%) | 0 (0.0%) |
| 35 to 64 Years | 0 (0.0%) | 0 (0.0%) |
| 65 to 74 Years | 130 (40.5%) | 0 (0.0%) |
| 75 Years and over | 0 (0.0%) | 15 (17.6%) |
Technology Access in Neptune City borough
Computing Device Access in Neptune City borough
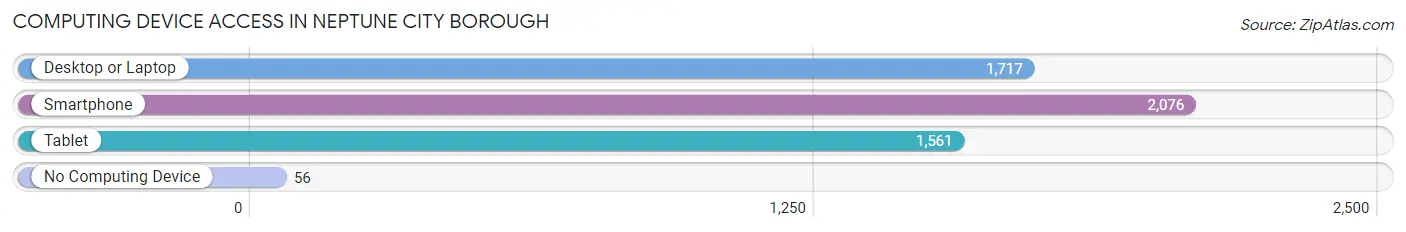
| Device Type | # Households | % Households |
| Desktop or Laptop | 1,717 | 77.4% |
| Smartphone | 2,076 | 93.6% |
| Tablet | 1,561 | 70.4% |
| No Computing Device | 56 | 2.5% |
| Total | 2,219 | 100.0% |
Internet Access in Neptune City borough
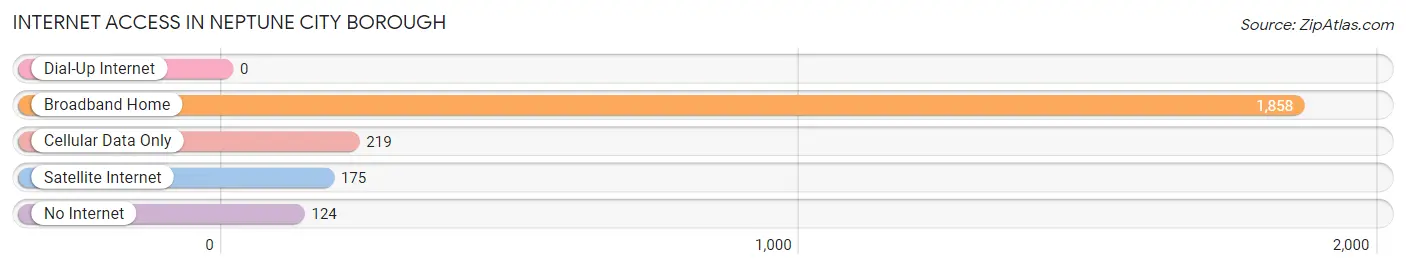
| Internet Type | # Households | % Households |
| Dial-Up Internet | 0 | 0.0% |
| Broadband Home | 1,858 | 83.7% |
| Cellular Data Only | 219 | 9.9% |
| Satellite Internet | 175 | 7.9% |
| No Internet | 124 | 5.6% |
| Total | 2,219 | 100.0% |
Neptune City borough Summary
Neptune City Borough is a small borough located in Monmouth County, New Jersey. It is situated on the Shark River, just south of the larger city of Asbury Park. The borough was incorporated in 1881 and is home to a population of approximately 5,000 people.
Geography
Neptune City Borough is located in the Shark River Valley, which is part of the larger Atlantic Coastal Plain. The borough is situated on the south side of the Shark River, which is a tributary of the larger Navesink River. The borough is bordered by the cities of Asbury Park and Neptune Township. The borough is approximately 2.5 square miles in size and is located approximately 40 miles south of New York City.
The borough is mostly flat, with some rolling hills in the northern part of the borough. The Shark River runs through the center of the borough, providing a natural border between the two municipalities. The borough is also home to several small lakes, including Lake Como and Lake Lefferts.
Climate
Neptune City Borough has a humid subtropical climate, with hot, humid summers and mild winters. The average high temperature in the summer is around 85 degrees Fahrenheit, while the average low temperature in the winter is around 30 degrees Fahrenheit. The borough receives an average of 45 inches of precipitation per year, with most of it falling in the summer months.
Demographics
As of the 2010 census, the population of Neptune City Borough was 5,037. The racial makeup of the borough was 79.3% White, 11.2% African American, 0.3% Native American, 3.2% Asian, and 4.9% from other races. Hispanic or Latino of any race were 8.3% of the population.
The median household income in the borough was $60,945, and the median family income was $71,917. The per capita income was $30,945. About 6.3% of families and 8.2% of the population were below the poverty line, including 10.3% of those under age 18 and 6.2% of those age 65 or over.
Economy
Neptune City Borough is home to a variety of businesses, including retail stores, restaurants, and professional services. The borough is also home to several manufacturing companies, including a plastics manufacturer and a metal fabrication company. The borough is also home to a number of small businesses, including a bakery, a florist, and a pet store.
The borough is also home to a number of recreational facilities, including a public golf course, a public beach, and several parks. The borough is also home to a number of cultural attractions, including the Monmouth County Historical Society and the Monmouth County Arts Council.
Conclusion
Neptune City Borough is a small borough located in Monmouth County, New Jersey. It is situated on the Shark River, just south of the larger city of Asbury Park. The borough was incorporated in 1881 and is home to a population of approximately 5,000 people. The borough is mostly flat, with some rolling hills in the northern part of the borough. The borough is home to a variety of businesses, including retail stores, restaurants, and professional services. The borough is also home to a number of recreational facilities, including a public golf course, a public beach, and several parks. The borough is also home to a number of cultural attractions, including the Monmouth County Historical Society and the Monmouth County Arts Council.
Common Questions
What is Per Capita Income in Neptune City borough?
Per Capita income in Neptune City borough is $45,178.
What is the Median Family Income in Neptune City borough?
Median Family Income in Neptune City borough is $99,894.
What is the Median Household income in Neptune City borough?
Median Household Income in Neptune City borough is $82,009.
What is Income or Wage Gap in Neptune City borough?
Income or Wage Gap in Neptune City borough is 43.6%.
Women in Neptune City borough earn 56.4 cents for every dollar earned by a man.
What is Inequality or Gini Index in Neptune City borough?
Inequality or Gini Index in Neptune City borough is 0.44.
What is the Total Population of Neptune City borough?
Total Population of Neptune City borough is 4,619.
What is the Total Male Population of Neptune City borough?
Total Male Population of Neptune City borough is 2,366.
What is the Total Female Population of Neptune City borough?
Total Female Population of Neptune City borough is 2,253.
What is the Ratio of Males per 100 Females in Neptune City borough?
There are 105.02 Males per 100 Females in Neptune City borough.
What is the Ratio of Females per 100 Males in Neptune City borough?
There are 95.22 Females per 100 Males in Neptune City borough.
What is the Median Population Age in Neptune City borough?
Median Population Age in Neptune City borough is 41.3 Years.
What is the Average Family Size in Neptune City borough
Average Family Size in Neptune City borough is 2.6 People.
What is the Average Household Size in Neptune City borough
Average Household Size in Neptune City borough is 2.0 People.
How Large is the Labor Force in Neptune City borough?
There are 3,051 People in the Labor Forcein in Neptune City borough.
What is the Percentage of People in the Labor Force in Neptune City borough?
76.6% of People are in the Labor Force in Neptune City borough.
What is the Unemployment Rate in Neptune City borough?
Unemployment Rate in Neptune City borough is 6.8%.