Paulsboro borough, NJ Map & Demographics
Paulsboro borough Overview
$36,377
PER CAPITA INCOME
$59,558
AVG FAMILY INCOME
$58,271
AVG HOUSEHOLD INCOME
27.1%
WAGE / INCOME GAP [ % ]
72.9¢/ $1
WAGE / INCOME GAP [ $ ]
0.49
INEQUALITY / GINI INDEX
6,195
TOTAL POPULATION
2,925
MALE POPULATION
3,270
FEMALE POPULATION
89.45
MALES / 100 FEMALES
111.79
FEMALES / 100 MALES
38.1
MEDIAN AGE
3.0
AVG FAMILY SIZE
2.5
AVG HOUSEHOLD SIZE
3,155
LABOR FORCE [ PEOPLE ]
62.3%
PERCENT IN LABOR FORCE
13.4%
UNEMPLOYMENT RATE
Income in Paulsboro borough
Income Overview in Paulsboro borough
Per Capita Income in Paulsboro borough is $36,377, while median incomes of families and households are $59,558 and $58,271 respectively.
| Characteristic | Number | Measure |
| Per Capita Income | 6,195 | $36,377 |
| Median Family Income | 1,632 | $59,558 |
| Mean Family Income | 1,632 | $103,954 |
| Median Household Income | 2,467 | $58,271 |
| Mean Household Income | 2,467 | $90,388 |
| Income Deficit | 1,632 | $0 |
| Wage / Income Gap (%) | 6,195 | 27.07% |
| Wage / Income Gap ($) | 6,195 | 72.93¢ per $1 |
| Gini / Inequality Index | 6,195 | 0.49 |
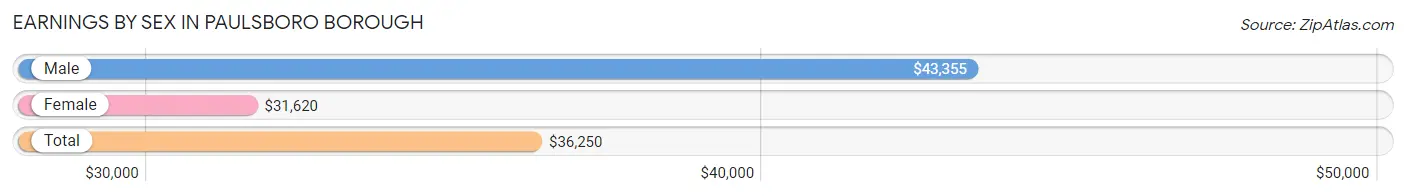
Earnings by Sex in Paulsboro borough
Average Earnings in Paulsboro borough are $36,250, $43,355 for men and $31,620 for women, a difference of 27.1%.
| Sex | Number | Average Earnings |
| Male | 1,439 (48.3%) | $43,355 |
| Female | 1,538 (51.7%) | $31,620 |
| Total | 2,977 (100.0%) | $36,250 |
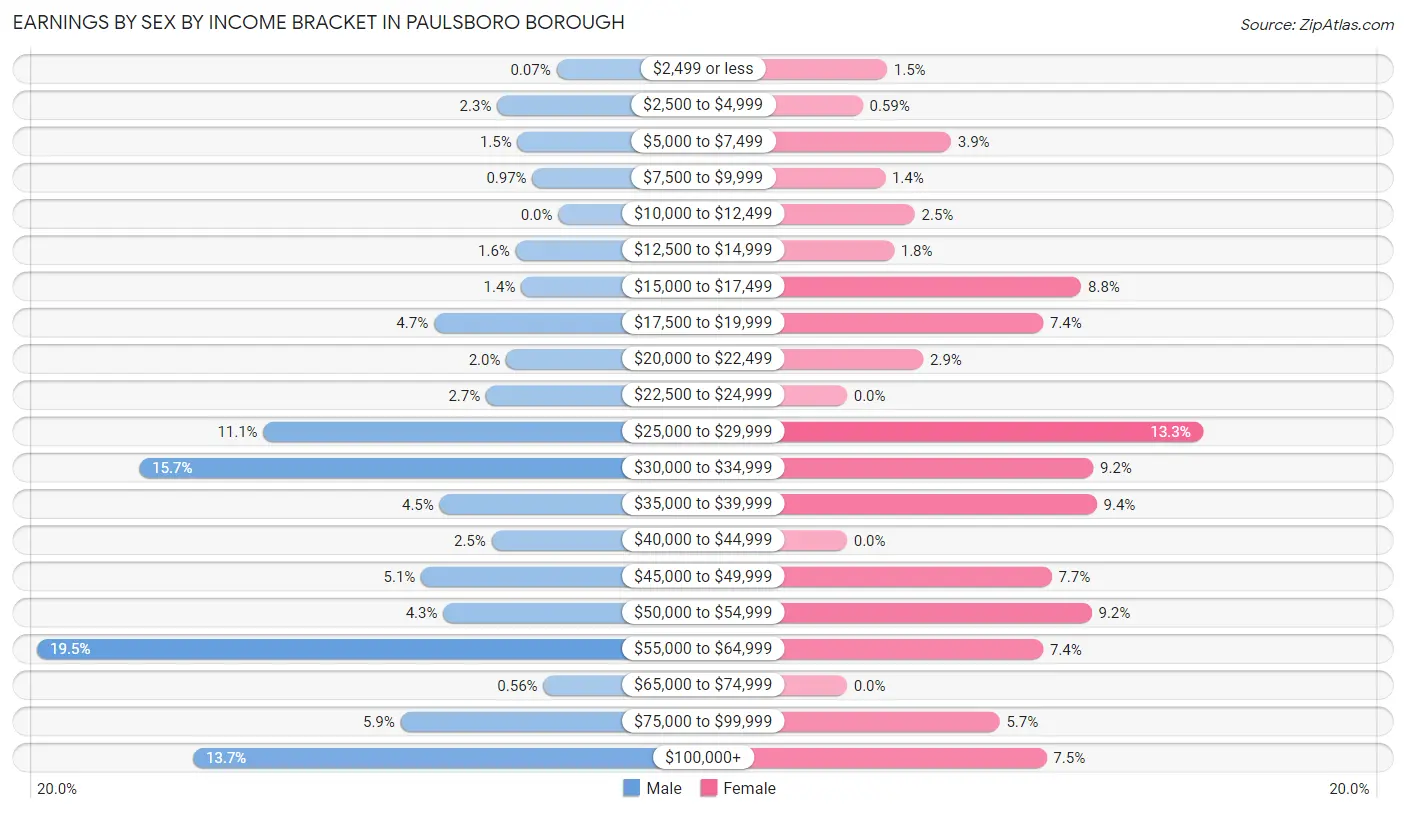
Earnings by Sex by Income Bracket in Paulsboro borough
The most common earnings brackets in Paulsboro borough are $55,000 to $64,999 for men (281 | 19.5%) and $25,000 to $29,999 for women (205 | 13.3%).
| Income | Male | Female |
| $2,499 or less | 1 (0.1%) | 23 (1.5%) |
| $2,500 to $4,999 | 33 (2.3%) | 9 (0.6%) |
| $5,000 to $7,499 | 22 (1.5%) | 60 (3.9%) |
| $7,500 to $9,999 | 14 (1.0%) | 22 (1.4%) |
| $10,000 to $12,499 | 0 (0.0%) | 39 (2.5%) |
| $12,500 to $14,999 | 23 (1.6%) | 27 (1.8%) |
| $15,000 to $17,499 | 20 (1.4%) | 135 (8.8%) |
| $17,500 to $19,999 | 67 (4.7%) | 113 (7.3%) |
| $20,000 to $22,499 | 28 (1.9%) | 44 (2.9%) |
| $22,500 to $24,999 | 39 (2.7%) | 0 (0.0%) |
| $25,000 to $29,999 | 159 (11.1%) | 205 (13.3%) |
| $30,000 to $34,999 | 226 (15.7%) | 142 (9.2%) |
| $35,000 to $39,999 | 64 (4.4%) | 144 (9.4%) |
| $40,000 to $44,999 | 36 (2.5%) | 0 (0.0%) |
| $45,000 to $49,999 | 74 (5.1%) | 118 (7.7%) |
| $50,000 to $54,999 | 62 (4.3%) | 141 (9.2%) |
| $55,000 to $64,999 | 281 (19.5%) | 113 (7.3%) |
| $65,000 to $74,999 | 8 (0.6%) | 0 (0.0%) |
| $75,000 to $99,999 | 85 (5.9%) | 88 (5.7%) |
| $100,000+ | 197 (13.7%) | 115 (7.5%) |
| Total | 1,439 (100.0%) | 1,538 (100.0%) |
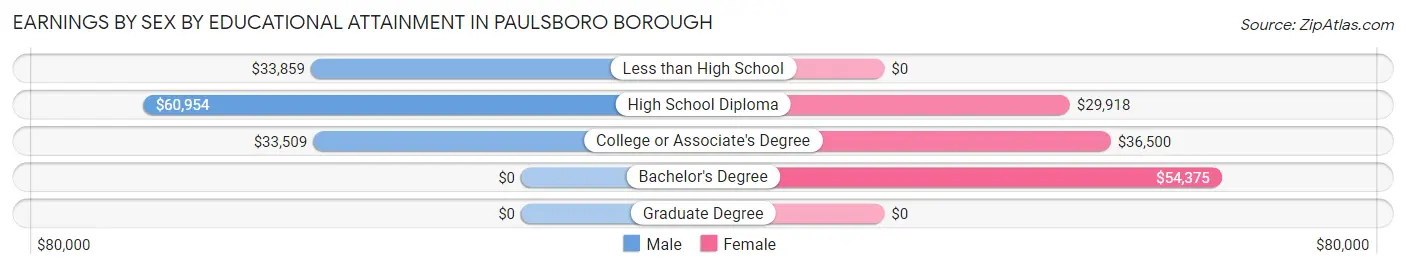
Earnings by Sex by Educational Attainment in Paulsboro borough
Average earnings in Paulsboro borough are $44,211 for men and $31,629 for women, a difference of 28.5%. Men with an educational attainment of high school diploma enjoy the highest average annual earnings of $60,954, while those with college or associate's degree education earn the least with $33,509. Women with an educational attainment of bachelor's degree earn the most with the average annual earnings of $54,375, while those with high school diploma education have the smallest earnings of $29,918.
| Educational Attainment | Male Income | Female Income |
| Less than High School | $33,859 | $0 |
| High School Diploma | $60,954 | $29,918 |
| College or Associate's Degree | $33,509 | $36,500 |
| Bachelor's Degree | - | - |
| Graduate Degree | - | - |
| Total | $44,211 | $31,629 |
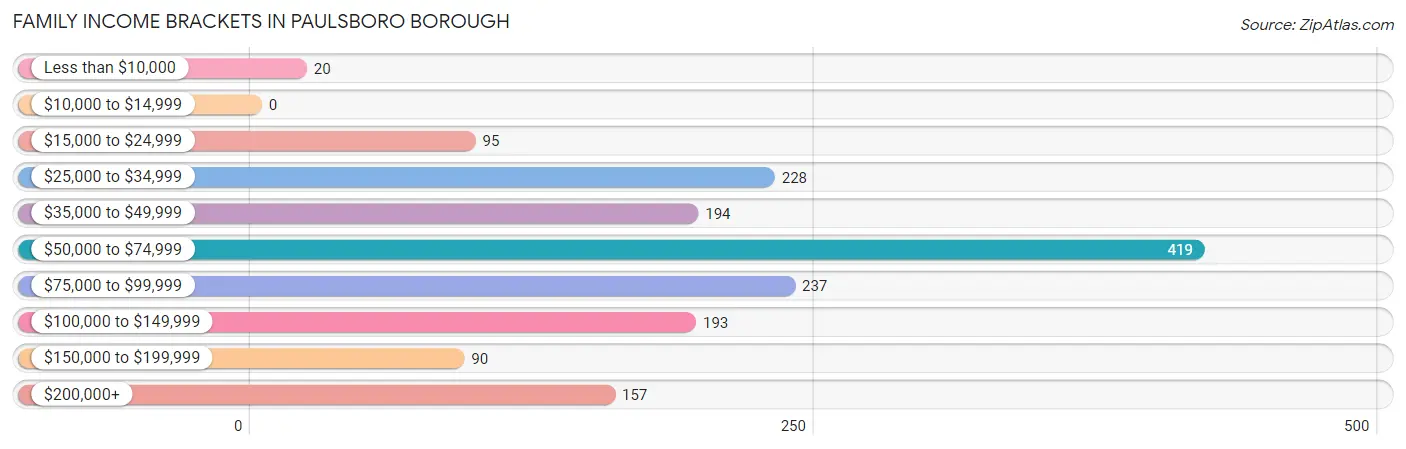
Family Income in Paulsboro borough
Family Income Brackets in Paulsboro borough
According to the Paulsboro borough family income data, there are 419 families falling into the $50,000 to $74,999 income range, which is the most common income bracket and makes up 25.7% of all families.
| Income Bracket | # Families | % Families |
| Less than $10,000 | 20 | 1.2% |
| $10,000 to $14,999 | 0 | 0.0% |
| $15,000 to $24,999 | 95 | 5.8% |
| $25,000 to $34,999 | 228 | 14.0% |
| $35,000 to $49,999 | 194 | 11.9% |
| $50,000 to $74,999 | 419 | 25.7% |
| $75,000 to $99,999 | 237 | 14.5% |
| $100,000 to $149,999 | 193 | 11.8% |
| $150,000 to $199,999 | 90 | 5.5% |
| $200,000+ | 157 | 9.6% |
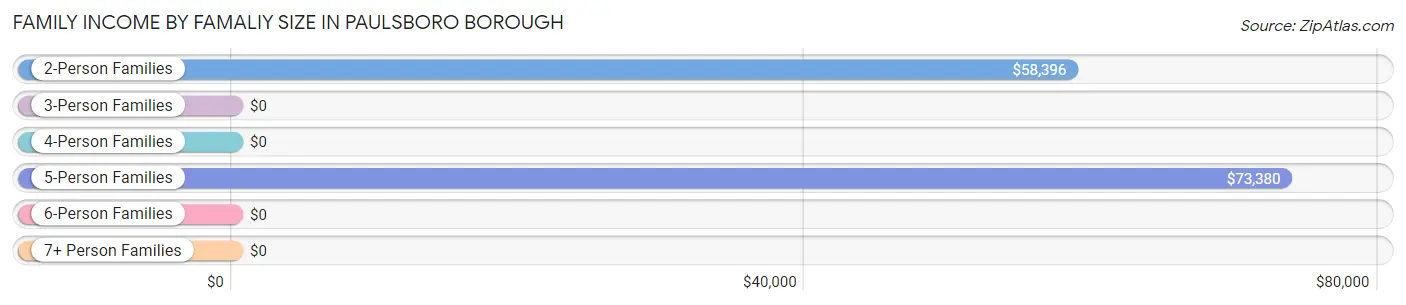
Family Income by Famaliy Size in Paulsboro borough
5-person families (146 | 8.9%) account for the highest median family income in Paulsboro borough with $73,380 per family, while 2-person families (911 | 55.8%) have the highest median income of $29,198 per family member.
| Income Bracket | # Families | Median Income |
| 2-Person Families | 911 (55.8%) | $58,396 |
| 3-Person Families | 304 (18.6%) | $0 |
| 4-Person Families | 271 (16.6%) | $0 |
| 5-Person Families | 146 (8.9%) | $73,380 |
| 6-Person Families | 0 (0.0%) | $0 |
| 7+ Person Families | 0 (0.0%) | $0 |
| Total | 1,632 (100.0%) | $59,558 |
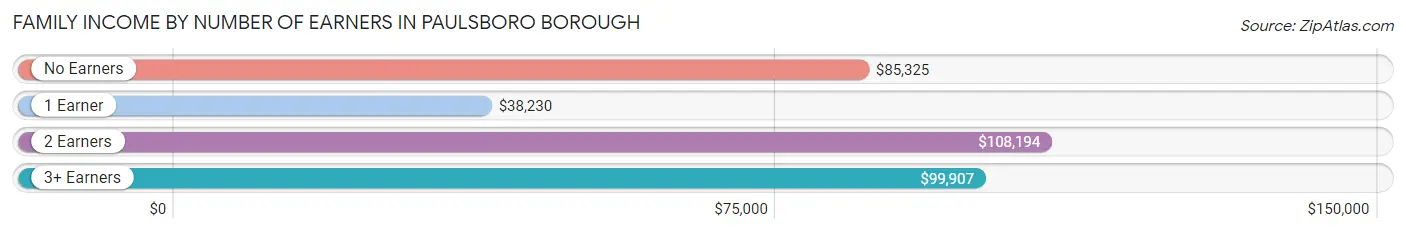
Family Income by Number of Earners in Paulsboro borough
The median family income in Paulsboro borough is $59,558, with families comprising 2 earners (544) having the highest median family income of $108,194, while families with 1 earner (524) have the lowest median family income of $38,230, accounting for 33.3% and 32.1% of families, respectively.
| Number of Earners | # Families | Median Income |
| No Earners | 330 (20.2%) | $85,325 |
| 1 Earner | 524 (32.1%) | $38,230 |
| 2 Earners | 544 (33.3%) | $108,194 |
| 3+ Earners | 234 (14.3%) | $99,907 |
| Total | 1,632 (100.0%) | $59,558 |
Household Income in Paulsboro borough
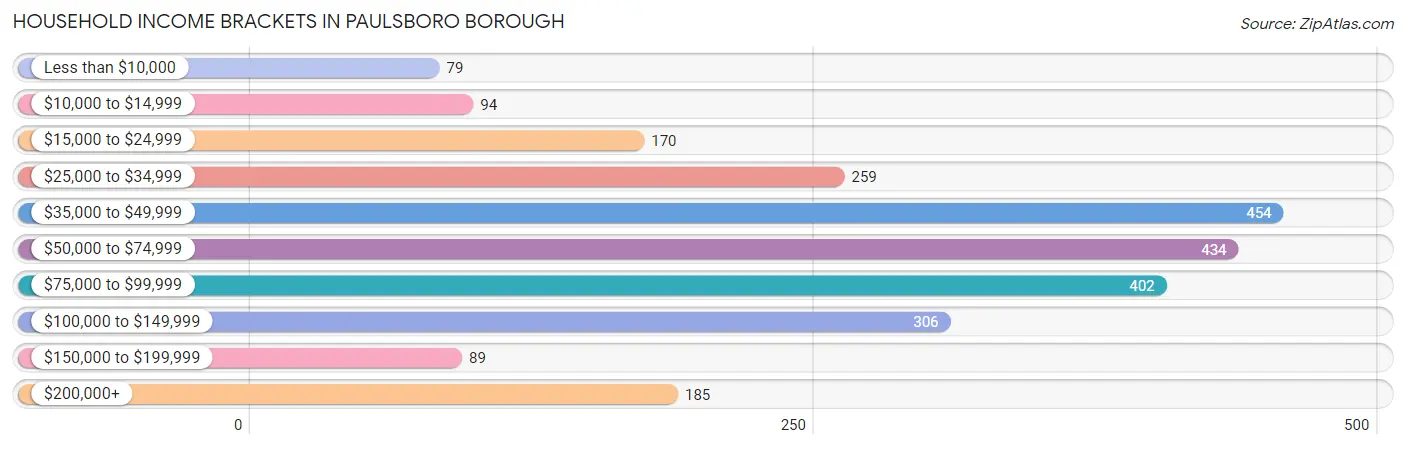
Household Income Brackets in Paulsboro borough
With 454 households falling in the category, the $35,000 to $49,999 income range is the most frequent in Paulsboro borough, accounting for 18.4% of all households. In contrast, only 79 households (3.2%) fall into the less than $10,000 income bracket, making it the least populous group.
| Income Bracket | # Households | % Households |
| Less than $10,000 | 79 | 3.2% |
| $10,000 to $14,999 | 94 | 3.8% |
| $15,000 to $24,999 | 170 | 6.9% |
| $25,000 to $34,999 | 259 | 10.5% |
| $35,000 to $49,999 | 454 | 18.4% |
| $50,000 to $74,999 | 434 | 17.6% |
| $75,000 to $99,999 | 402 | 16.3% |
| $100,000 to $149,999 | 306 | 12.4% |
| $150,000 to $199,999 | 89 | 3.6% |
| $200,000+ | 185 | 7.5% |
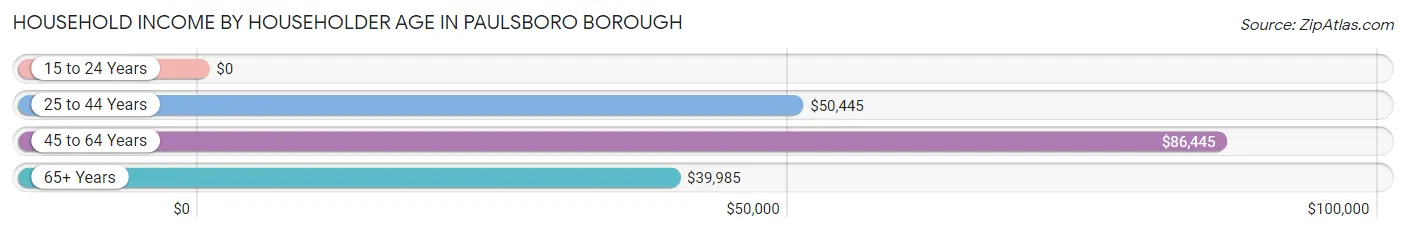
Household Income by Householder Age in Paulsboro borough
The median household income in Paulsboro borough is $58,271, with the highest median household income of $86,445 found in the 45 to 64 years age bracket for the primary householder. A total of 921 households (37.3%) fall into this category. Meanwhile, the 15 to 24 years age bracket for the primary householder has the lowest median household income of $0, with 73 households (3.0%) in this group.
| Income Bracket | # Households | Median Income |
| 15 to 24 Years | 73 (3.0%) | $0 |
| 25 to 44 Years | 793 (32.1%) | $50,445 |
| 45 to 64 Years | 921 (37.3%) | $86,445 |
| 65+ Years | 680 (27.6%) | $39,985 |
| Total | 2,467 (100.0%) | $58,271 |
Poverty in Paulsboro borough
Income Below Poverty by Sex and Age in Paulsboro borough
With 8.4% poverty level for males and 9.3% for females among the residents of Paulsboro borough, 75 year old and over males and 45 to 54 year old females are the most vulnerable to poverty, with 19 males (100.0%) and 79 females (28.6%) in their respective age groups living below the poverty level.
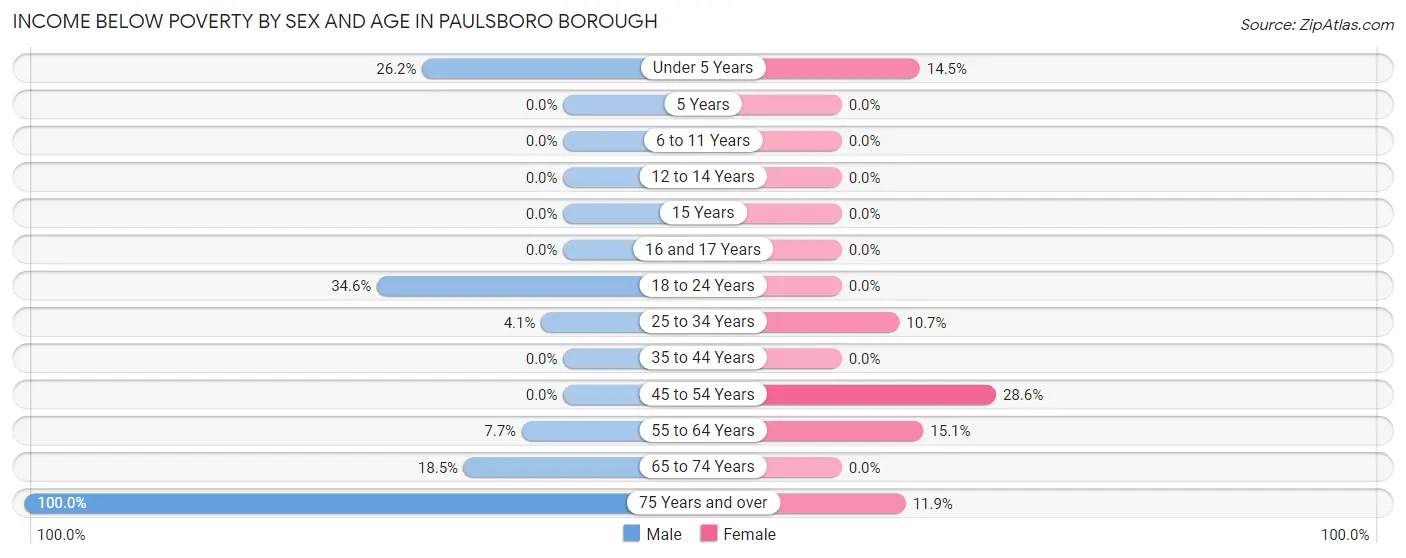
| Age Bracket | Male | Female |
| Under 5 Years | 56 (26.2%) | 40 (14.5%) |
| 5 Years | 0 (0.0%) | 0 (0.0%) |
| 6 to 11 Years | 0 (0.0%) | 0 (0.0%) |
| 12 to 14 Years | 0 (0.0%) | 0 (0.0%) |
| 15 Years | 0 (0.0%) | 0 (0.0%) |
| 16 and 17 Years | 0 (0.0%) | 0 (0.0%) |
| 18 to 24 Years | 85 (34.5%) | 0 (0.0%) |
| 25 to 34 Years | 22 (4.1%) | 65 (10.7%) |
| 35 to 44 Years | 0 (0.0%) | 0 (0.0%) |
| 45 to 54 Years | 0 (0.0%) | 79 (28.6%) |
| 55 to 64 Years | 41 (7.7%) | 56 (15.1%) |
| 65 to 74 Years | 24 (18.5%) | 0 (0.0%) |
| 75 Years and over | 19 (100.0%) | 63 (11.9%) |
| Total | 247 (8.4%) | 303 (9.3%) |
Income Above Poverty by Sex and Age in Paulsboro borough
According to the poverty statistics in Paulsboro borough, males aged 5 years and females aged 6 to 11 years are the age groups that are most secure financially, with 100.0% of males and 100.0% of females in these age groups living above the poverty line.
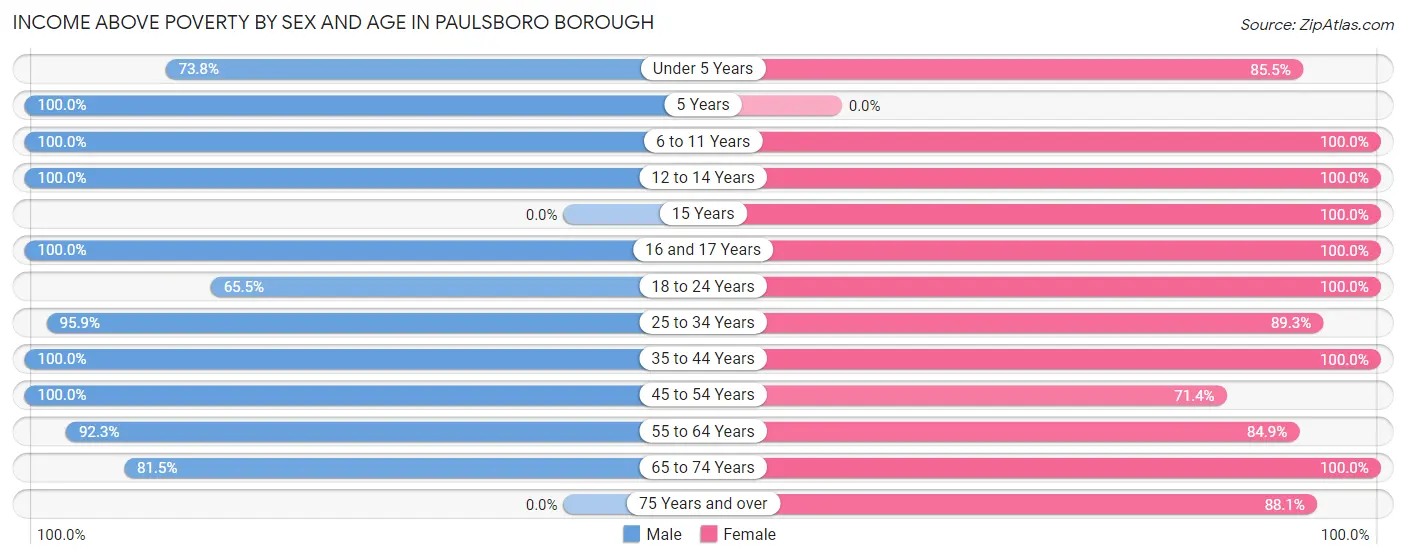
| Age Bracket | Male | Female |
| Under 5 Years | 158 (73.8%) | 236 (85.5%) |
| 5 Years | 19 (100.0%) | 0 (0.0%) |
| 6 to 11 Years | 229 (100.0%) | 150 (100.0%) |
| 12 to 14 Years | 109 (100.0%) | 96 (100.0%) |
| 15 Years | 0 (0.0%) | 14 (100.0%) |
| 16 and 17 Years | 113 (100.0%) | 58 (100.0%) |
| 18 to 24 Years | 161 (65.4%) | 220 (100.0%) |
| 25 to 34 Years | 516 (95.9%) | 543 (89.3%) |
| 35 to 44 Years | 314 (100.0%) | 409 (100.0%) |
| 45 to 54 Years | 461 (100.0%) | 197 (71.4%) |
| 55 to 64 Years | 492 (92.3%) | 314 (84.9%) |
| 65 to 74 Years | 106 (81.5%) | 239 (100.0%) |
| 75 Years and over | 0 (0.0%) | 468 (88.1%) |
| Total | 2,678 (91.6%) | 2,944 (90.7%) |
Income Below Poverty Among Married-Couple Families in Paulsboro borough
The poverty statistics for married-couple families in Paulsboro borough show that 2.4% or 19 of the total 806 families live below the poverty line. Families with no children have the highest poverty rate of 3.1%, comprising of 19 families. On the other hand, families with 1 or 2 children have the lowest poverty rate of 0.0%, which includes 0 families.
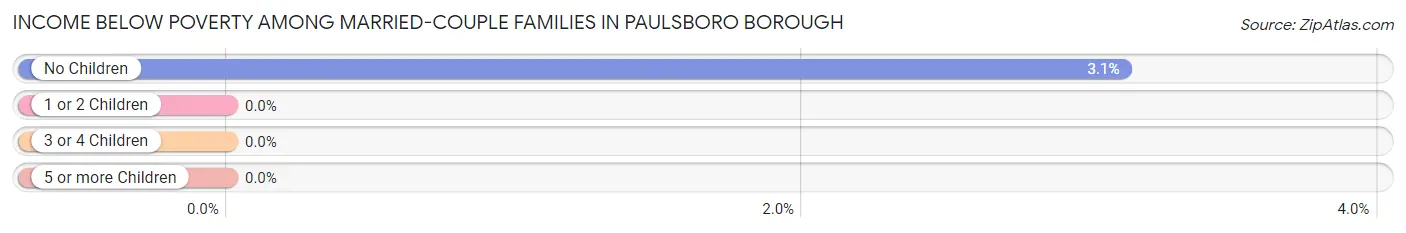
| Children | Above Poverty | Below Poverty |
| No Children | 591 (96.9%) | 19 (3.1%) |
| 1 or 2 Children | 196 (100.0%) | 0 (0.0%) |
| 3 or 4 Children | 0 (0.0%) | 0 (0.0%) |
| 5 or more Children | 0 (0.0%) | 0 (0.0%) |
| Total | 787 (97.6%) | 19 (2.4%) |
Income Below Poverty Among Single-Parent Households in Paulsboro borough
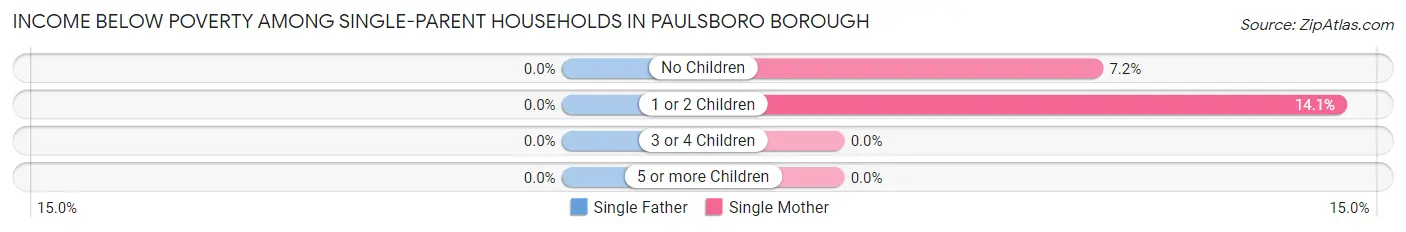
| Children | Single Father | Single Mother |
| No Children | 0 (0.0%) | 23 (7.2%) |
| 1 or 2 Children | 0 (0.0%) | 27 (14.1%) |
| 3 or 4 Children | 0 (0.0%) | 0 (0.0%) |
| 5 or more Children | 0 (0.0%) | 0 (0.0%) |
| Total | 0 (0.0%) | 50 (7.4%) |
Income Below Poverty Among Married-Couple vs Single-Parent Households in Paulsboro borough
The poverty data for Paulsboro borough shows that 19 of the married-couple family households (2.4%) and 50 of the single-parent households (6.0%) are living below the poverty level. Within the married-couple family households, those with no children have the highest poverty rate, with 19 households (3.1%) falling below the poverty line. Among the single-parent households, those with 1 or 2 children have the highest poverty rate, with 27 household (11.5%) living below poverty.
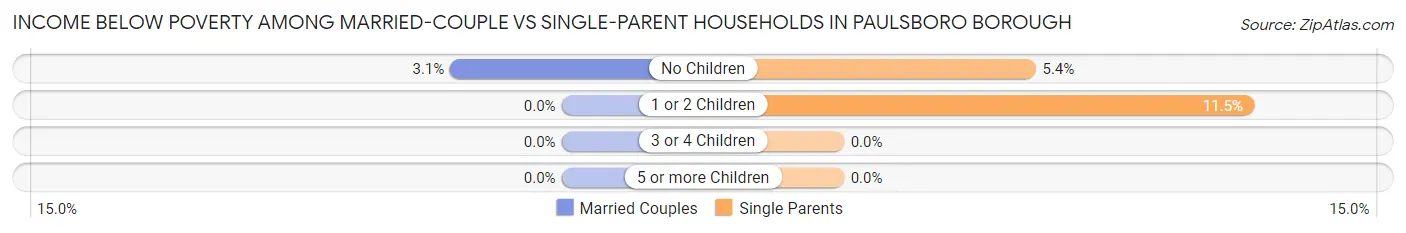
| Children | Married-Couple Families | Single-Parent Households |
| No Children | 19 (3.1%) | 23 (5.4%) |
| 1 or 2 Children | 0 (0.0%) | 27 (11.5%) |
| 3 or 4 Children | 0 (0.0%) | 0 (0.0%) |
| 5 or more Children | 0 (0.0%) | 0 (0.0%) |
| Total | 19 (2.4%) | 50 (6.0%) |
Race in Paulsboro borough
The most populous races in Paulsboro borough are Black / African American (2,611 | 42.1%), White / Caucasian (2,379 | 38.4%), and Two or more Races (857 | 13.8%).
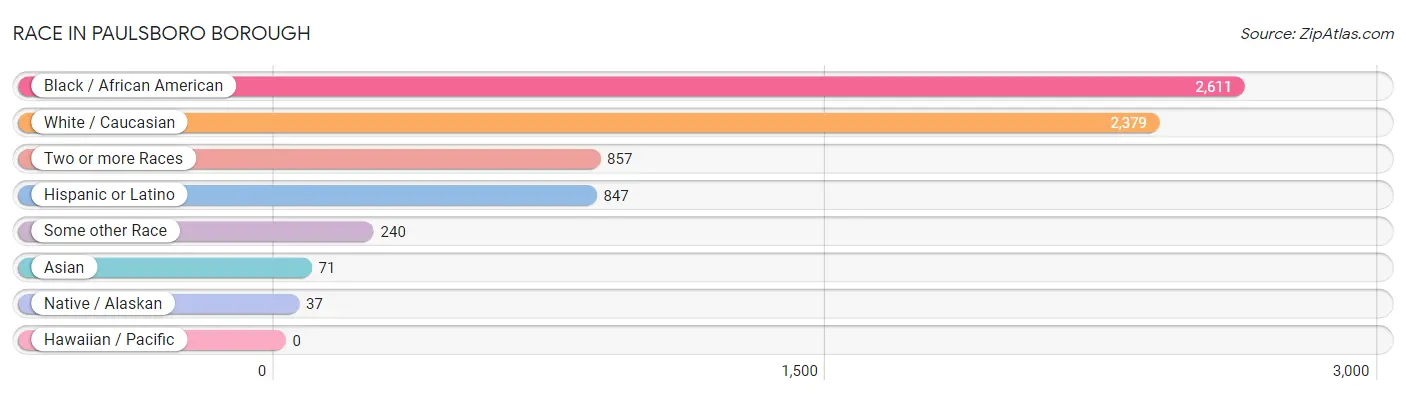
| Race | # Population | % Population |
| Asian | 71 | 1.1% |
| Black / African American | 2,611 | 42.1% |
| Hawaiian / Pacific | 0 | 0.0% |
| Hispanic or Latino | 847 | 13.7% |
| Native / Alaskan | 37 | 0.6% |
| White / Caucasian | 2,379 | 38.4% |
| Two or more Races | 857 | 13.8% |
| Some other Race | 240 | 3.9% |
| Total | 6,195 | 100.0% |
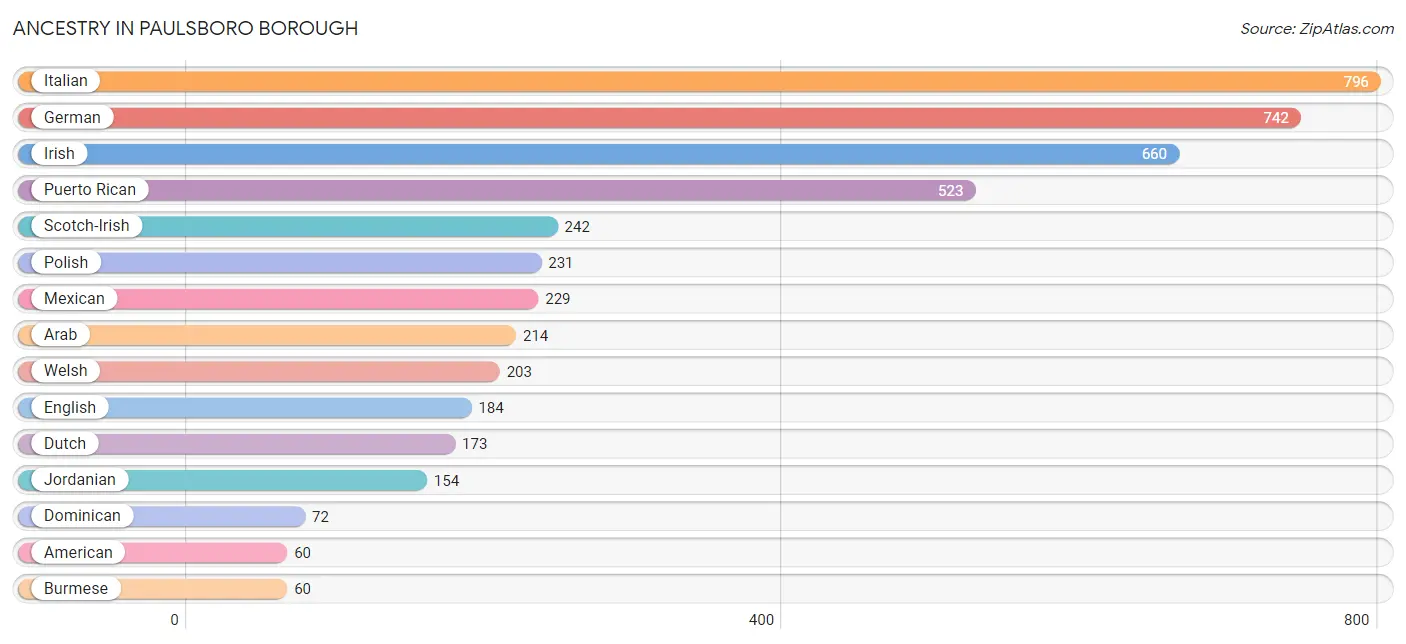
Ancestry in Paulsboro borough
The most populous ancestries reported in Paulsboro borough are Italian (796 | 12.9%), German (742 | 12.0%), Irish (660 | 10.6%), Puerto Rican (523 | 8.4%), and Scotch-Irish (242 | 3.9%), together accounting for 47.8% of all Paulsboro borough residents.
| Ancestry | # Population | % Population |
| American | 60 | 1.0% |
| Arab | 214 | 3.5% |
| Arapaho | 7 | 0.1% |
| Bhutanese | 25 | 0.4% |
| Burmese | 60 | 1.0% |
| Central American | 23 | 0.4% |
| Dominican | 72 | 1.2% |
| Dutch | 173 | 2.8% |
| English | 184 | 3.0% |
| European | 38 | 0.6% |
| French | 40 | 0.6% |
| German | 742 | 12.0% |
| Irish | 660 | 10.6% |
| Italian | 796 | 12.9% |
| Jamaican | 36 | 0.6% |
| Jordanian | 154 | 2.5% |
| Lithuanian | 18 | 0.3% |
| Mexican | 229 | 3.7% |
| Nicaraguan | 23 | 0.4% |
| Polish | 231 | 3.7% |
| Portuguese | 19 | 0.3% |
| Puerto Rican | 523 | 8.4% |
| Russian | 23 | 0.4% |
| Scotch-Irish | 242 | 3.9% |
| Scottish | 12 | 0.2% |
| Swiss | 25 | 0.4% |
| Syrian | 39 | 0.6% |
| Thai | 55 | 0.9% |
| Ukrainian | 19 | 0.3% |
| Welsh | 203 | 3.3% | View All 30 Rows |
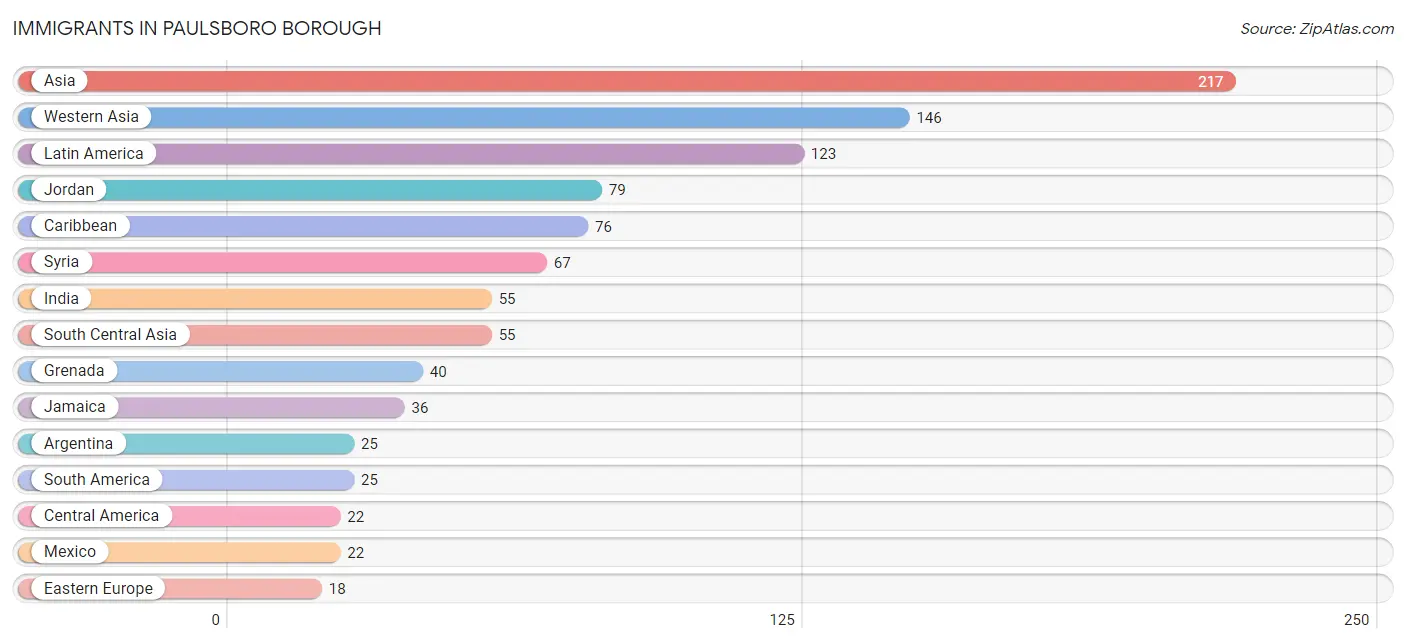
Immigrants in Paulsboro borough
The most numerous immigrant groups reported in Paulsboro borough came from Asia (217 | 3.5%), Western Asia (146 | 2.4%), Latin America (123 | 2.0%), Jordan (79 | 1.3%), and Caribbean (76 | 1.2%), together accounting for 10.4% of all Paulsboro borough residents.
| Immigration Origin | # Population | % Population |
| Argentina | 25 | 0.4% |
| Asia | 217 | 3.5% |
| Caribbean | 76 | 1.2% |
| Central America | 22 | 0.4% |
| Eastern Asia | 16 | 0.3% |
| Eastern Europe | 18 | 0.3% |
| Europe | 18 | 0.3% |
| Grenada | 40 | 0.6% |
| India | 55 | 0.9% |
| Jamaica | 36 | 0.6% |
| Jordan | 79 | 1.3% |
| Korea | 16 | 0.3% |
| Latin America | 123 | 2.0% |
| Mexico | 22 | 0.4% |
| Poland | 18 | 0.3% |
| South America | 25 | 0.4% |
| South Central Asia | 55 | 0.9% |
| Syria | 67 | 1.1% |
| Western Asia | 146 | 2.4% | View All 19 Rows |
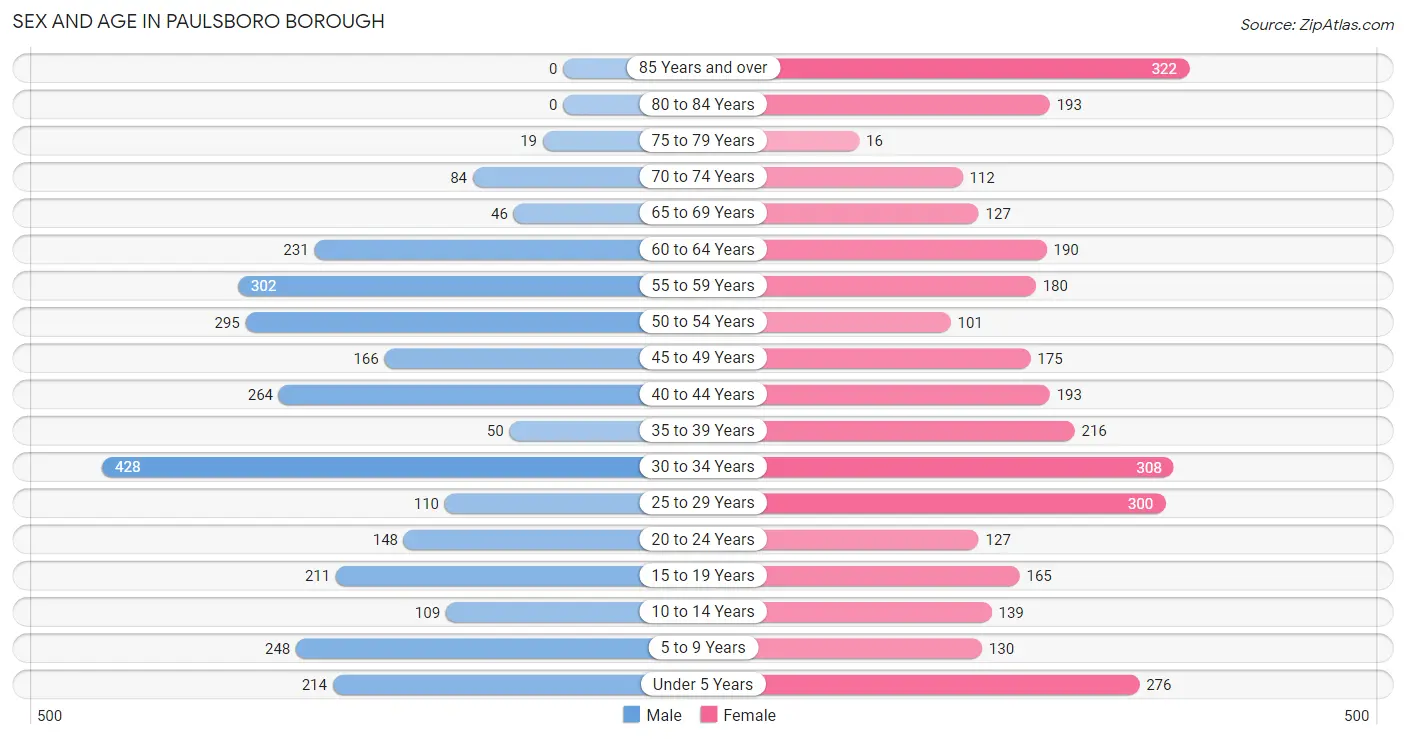
Sex and Age in Paulsboro borough
Sex and Age in Paulsboro borough
The most populous age groups in Paulsboro borough are 30 to 34 Years (428 | 14.6%) for men and 85 Years and over (322 | 9.9%) for women.
| Age Bracket | Male | Female |
| Under 5 Years | 214 (7.3%) | 276 (8.4%) |
| 5 to 9 Years | 248 (8.5%) | 130 (4.0%) |
| 10 to 14 Years | 109 (3.7%) | 139 (4.3%) |
| 15 to 19 Years | 211 (7.2%) | 165 (5.1%) |
| 20 to 24 Years | 148 (5.1%) | 127 (3.9%) |
| 25 to 29 Years | 110 (3.8%) | 300 (9.2%) |
| 30 to 34 Years | 428 (14.6%) | 308 (9.4%) |
| 35 to 39 Years | 50 (1.7%) | 216 (6.6%) |
| 40 to 44 Years | 264 (9.0%) | 193 (5.9%) |
| 45 to 49 Years | 166 (5.7%) | 175 (5.3%) |
| 50 to 54 Years | 295 (10.1%) | 101 (3.1%) |
| 55 to 59 Years | 302 (10.3%) | 180 (5.5%) |
| 60 to 64 Years | 231 (7.9%) | 190 (5.8%) |
| 65 to 69 Years | 46 (1.6%) | 127 (3.9%) |
| 70 to 74 Years | 84 (2.9%) | 112 (3.4%) |
| 75 to 79 Years | 19 (0.6%) | 16 (0.5%) |
| 80 to 84 Years | 0 (0.0%) | 193 (5.9%) |
| 85 Years and over | 0 (0.0%) | 322 (9.9%) |
| Total | 2,925 (100.0%) | 3,270 (100.0%) |
Families and Households in Paulsboro borough
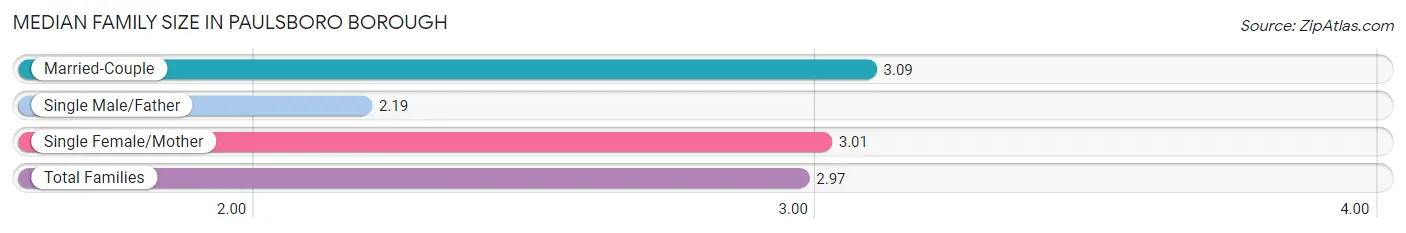
Median Family Size in Paulsboro borough
The median family size in Paulsboro borough is 2.97 persons per family, with married-couple families (806 | 49.4%) accounting for the largest median family size of 3.09 persons per family. On the other hand, single male/father families (154 | 9.4%) represent the smallest median family size with 2.19 persons per family.
| Family Type | # Families | Family Size |
| Married-Couple | 806 (49.4%) | 3.09 |
| Single Male/Father | 154 (9.4%) | 2.19 |
| Single Female/Mother | 672 (41.2%) | 3.01 |
| Total Families | 1,632 (100.0%) | 2.97 |
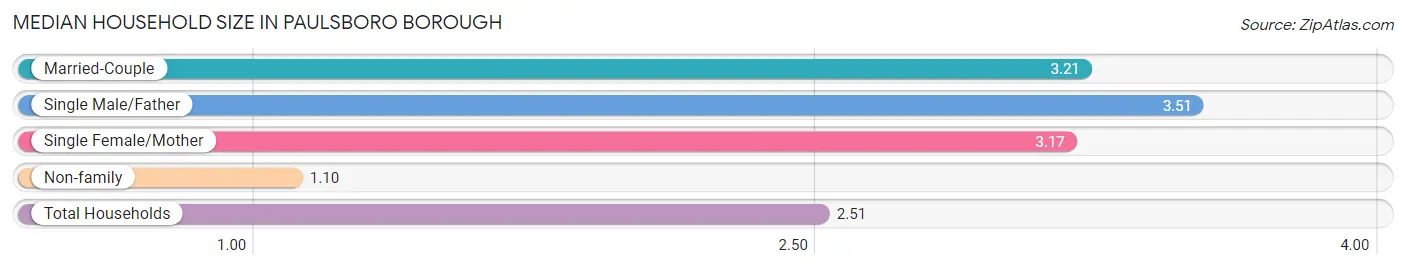
Median Household Size in Paulsboro borough
The median household size in Paulsboro borough is 2.51 persons per household, with single male/father households (154 | 6.2%) accounting for the largest median household size of 3.51 persons per household. non-family households (835 | 33.9%) represent the smallest median household size with 1.10 persons per household.
| Household Type | # Households | Household Size |
| Married-Couple | 806 (32.7%) | 3.21 |
| Single Male/Father | 154 (6.2%) | 3.51 |
| Single Female/Mother | 672 (27.2%) | 3.17 |
| Non-family | 835 (33.9%) | 1.10 |
| Total Households | 2,467 (100.0%) | 2.51 |
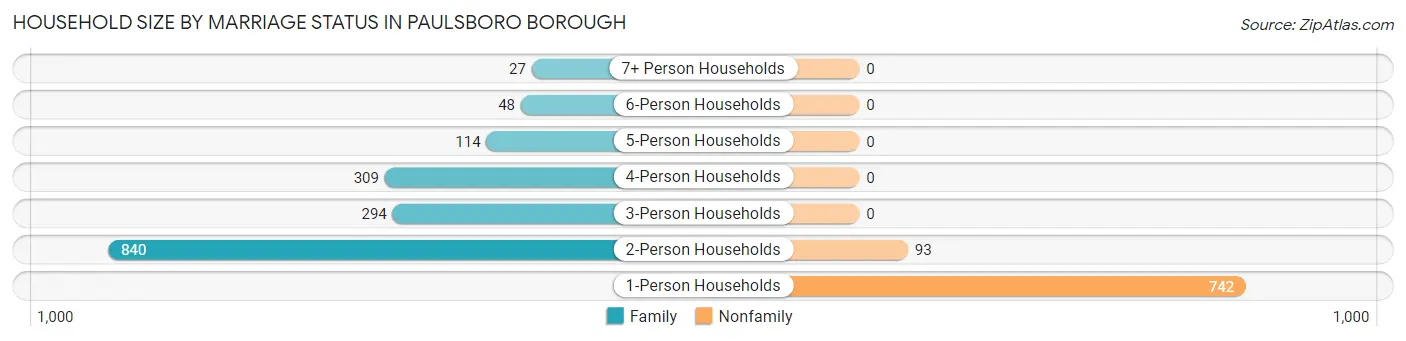
Household Size by Marriage Status in Paulsboro borough
Out of a total of 2,467 households in Paulsboro borough, 1,632 (66.1%) are family households, while 835 (33.9%) are nonfamily households. The most numerous type of family households are 2-person households, comprising 840, and the most common type of nonfamily households are 1-person households, comprising 742.
| Household Size | Family Households | Nonfamily Households |
| 1-Person Households | - | 742 (30.1%) |
| 2-Person Households | 840 (34.1%) | 93 (3.8%) |
| 3-Person Households | 294 (11.9%) | 0 (0.0%) |
| 4-Person Households | 309 (12.5%) | 0 (0.0%) |
| 5-Person Households | 114 (4.6%) | 0 (0.0%) |
| 6-Person Households | 48 (1.9%) | 0 (0.0%) |
| 7+ Person Households | 27 (1.1%) | 0 (0.0%) |
| Total | 1,632 (66.1%) | 835 (33.9%) |
Female Fertility in Paulsboro borough
Fertility by Age in Paulsboro borough
Average fertility rate in Paulsboro borough is 76.0 births per 1,000 women. Women in the age bracket of 20 to 34 years have the highest fertility rate with 155.0 births per 1,000 women. Women in the age bracket of 20 to 34 years acount for 100.0% of all women with births.
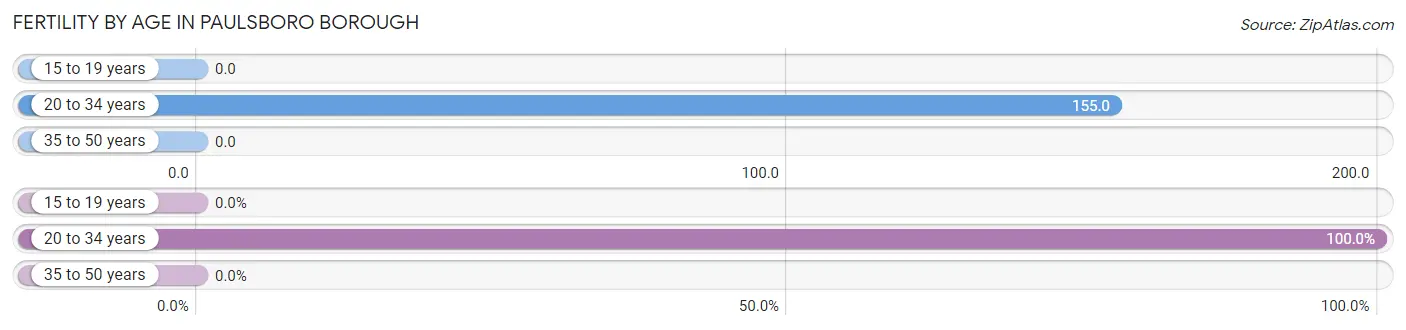
| Age Bracket | Women with Births | Births / 1,000 Women |
| 15 to 19 years | 0 (0.0%) | 0.0 |
| 20 to 34 years | 114 (100.0%) | 155.0 |
| 35 to 50 years | 0 (0.0%) | 0.0 |
| Total | 114 (100.0%) | 76.0 |
Fertility by Age by Marriage Status in Paulsboro borough
76.3% of women with births (114) in Paulsboro borough are married. The highest percentage of unmarried women with births falls into 20 to 34 years age bracket with 23.7% of them unmarried at the time of birth, while the lowest percentage of unmarried women with births belong to 20 to 34 years age bracket with 23.7% of them unmarried.
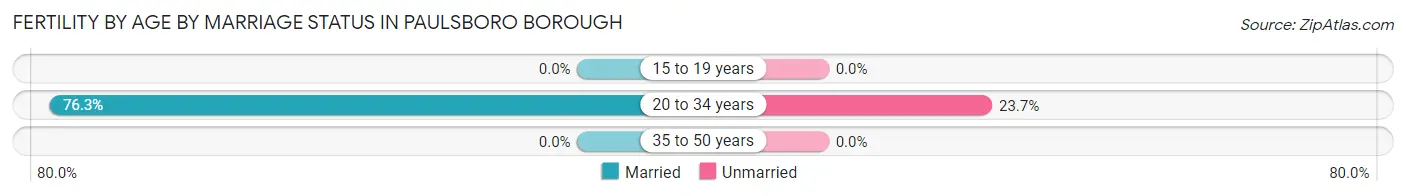
| Age Bracket | Married | Unmarried |
| 15 to 19 years | 0 (0.0%) | 0 (0.0%) |
| 20 to 34 years | 87 (76.3%) | 27 (23.7%) |
| 35 to 50 years | 0 (0.0%) | 0 (0.0%) |
| Total | 87 (76.3%) | 27 (23.7%) |
Fertility by Education in Paulsboro borough
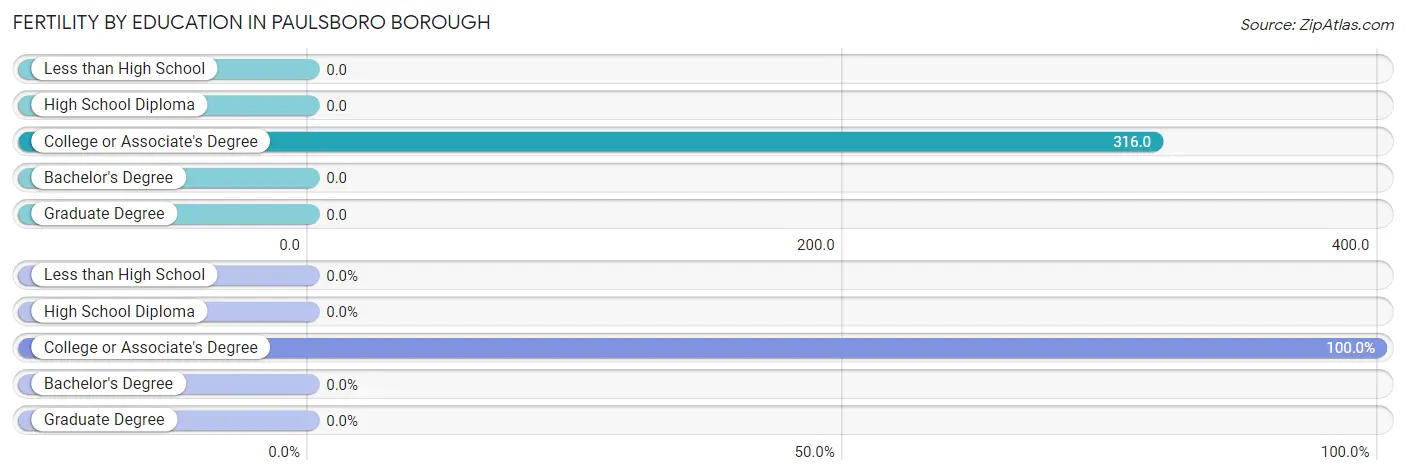
| Educational Attainment | Women with Births | Births / 1,000 Women |
| Less than High School | 0 (0.0%) | 0.0 |
| High School Diploma | 0 (0.0%) | 0.0 |
| College or Associate's Degree | 114 (100.0%) | 316.0 |
| Bachelor's Degree | 0 (0.0%) | 0.0 |
| Graduate Degree | 0 (0.0%) | 0.0 |
| Total | 114 (100.0%) | 76.0 |
Fertility by Education by Marriage Status in Paulsboro borough
23.7% of women with births in Paulsboro borough are unmarried. Women with the educational attainment of college or associate's degree are most likely to be married with 76.3% of them married at childbirth, while women with the educational attainment of college or associate's degree are least likely to be married with 23.7% of them unmarried at childbirth.
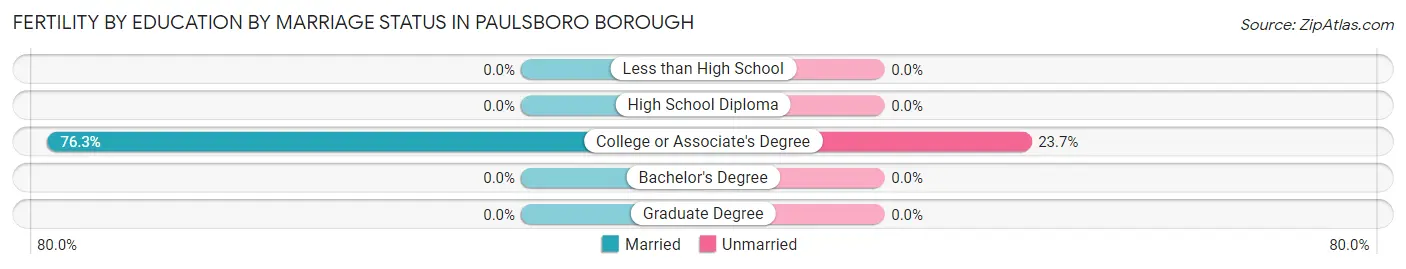
| Educational Attainment | Married | Unmarried |
| Less than High School | 0 (0.0%) | 0 (0.0%) |
| High School Diploma | 0 (0.0%) | 0 (0.0%) |
| College or Associate's Degree | 87 (76.3%) | 27 (23.7%) |
| Bachelor's Degree | 0 (0.0%) | 0 (0.0%) |
| Graduate Degree | 0 (0.0%) | 0 (0.0%) |
| Total | 87 (76.3%) | 27 (23.7%) |
Employment Characteristics in Paulsboro borough
Employment by Class of Employer in Paulsboro borough
Among the 2,598 employed individuals in Paulsboro borough, private company employees (2,092 | 80.5%), local government employees (255 | 9.8%), and not-for-profit organizations (137 | 5.3%) make up the most common classes of employment.
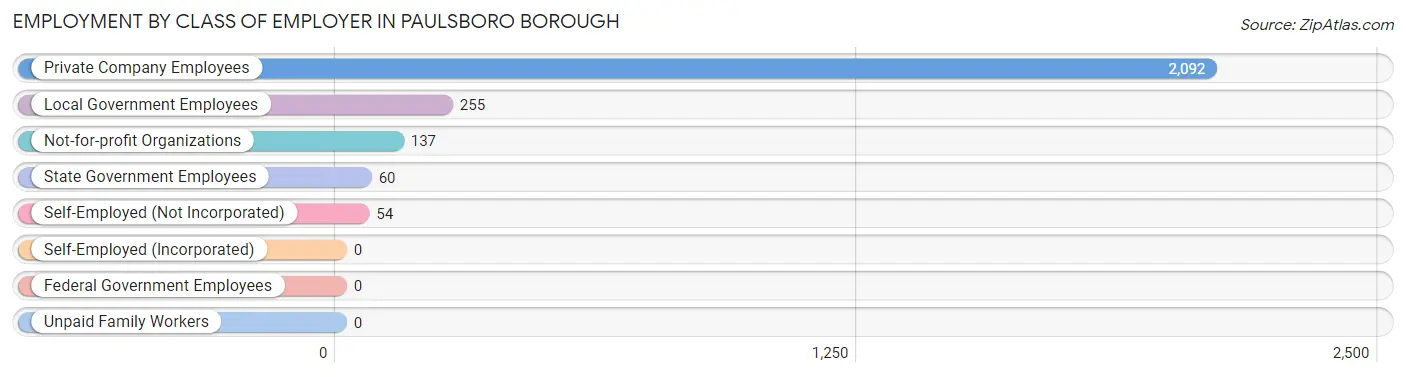
| Employer Class | # Employees | % Employees |
| Private Company Employees | 2,092 | 80.5% |
| Self-Employed (Incorporated) | 0 | 0.0% |
| Self-Employed (Not Incorporated) | 54 | 2.1% |
| Not-for-profit Organizations | 137 | 5.3% |
| Local Government Employees | 255 | 9.8% |
| State Government Employees | 60 | 2.3% |
| Federal Government Employees | 0 | 0.0% |
| Unpaid Family Workers | 0 | 0.0% |
| Total | 2,598 | 100.0% |
Employment Status by Age in Paulsboro borough
According to the labor force statistics for Paulsboro borough, out of the total population over 16 years of age (5,065), 62.3% or 3,155 individuals are in the labor force, with 13.4% or 423 of them unemployed. The age group with the highest labor force participation rate is 25 to 29 years, with 90.0% or 369 individuals in the labor force. Within the labor force, the 30 to 34 years age range has the highest percentage of unemployed individuals, with 45.4% or 279 of them being unemployed.
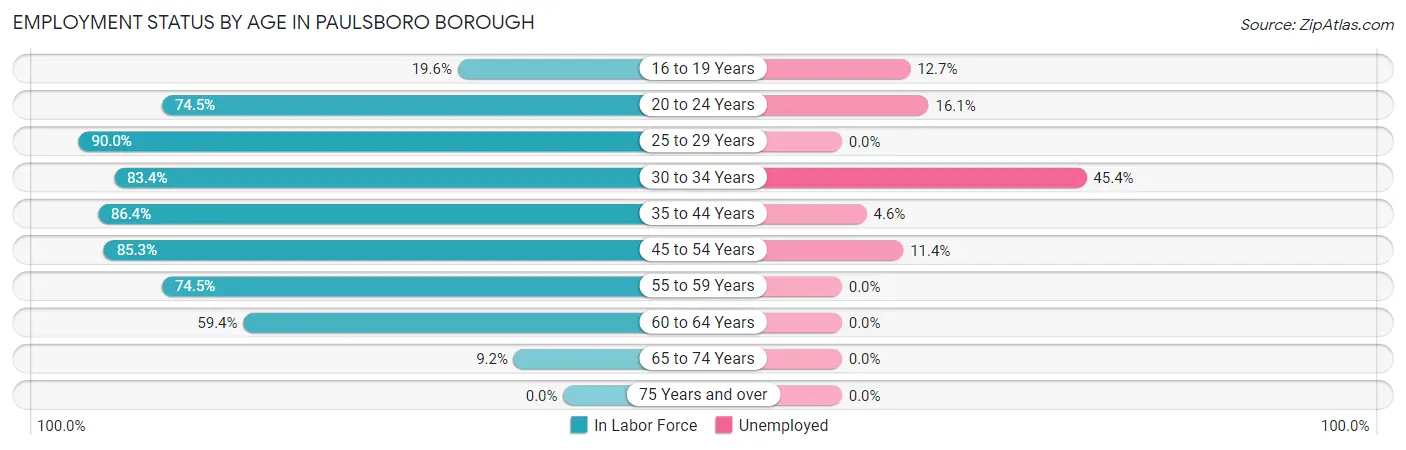
| Age Bracket | In Labor Force | Unemployed |
| 16 to 19 Years | 71 (19.6%) | 9 (12.7%) |
| 20 to 24 Years | 205 (74.5%) | 33 (16.1%) |
| 25 to 29 Years | 369 (90.0%) | 0 (0.0%) |
| 30 to 34 Years | 614 (83.4%) | 279 (45.4%) |
| 35 to 44 Years | 625 (86.4%) | 29 (4.6%) |
| 45 to 54 Years | 629 (85.3%) | 72 (11.4%) |
| 55 to 59 Years | 359 (74.5%) | 0 (0.0%) |
| 60 to 64 Years | 250 (59.4%) | 0 (0.0%) |
| 65 to 74 Years | 34 (9.2%) | 0 (0.0%) |
| 75 Years and over | 0 (0.0%) | 0 (0.0%) |
| Total | 3,155 (62.3%) | 423 (13.4%) |
Employment Status by Educational Attainment in Paulsboro borough
According to labor force statistics for Paulsboro borough, 81.1% of individuals (2,846) out of the total population between 25 and 64 years of age (3,509) are in the labor force, with 13.4% or 381 of them being unemployed. The group with the highest labor force participation rate are those with the educational attainment of bachelor's degree or higher, with 96.0% or 672 individuals in the labor force. Within the labor force, individuals with high school diploma education have the highest percentage of unemployment, with 27.8% or 300 of them being unemployed.
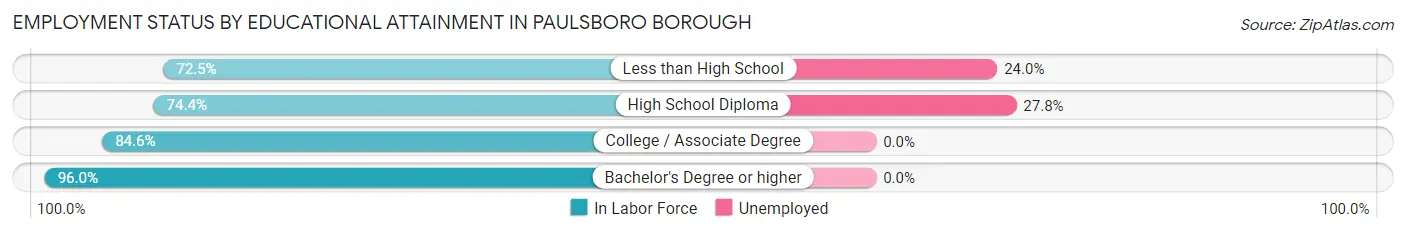
| Educational Attainment | In Labor Force | Unemployed |
| Less than High School | 333 (72.5%) | 110 (24.0%) |
| High School Diploma | 1,080 (74.4%) | 403 (27.8%) |
| College / Associate Degree | 761 (84.6%) | 0 (0.0%) |
| Bachelor's Degree or higher | 672 (96.0%) | 0 (0.0%) |
| Total | 2,846 (81.1%) | 470 (13.4%) |
Employment Occupations by Sex in Paulsboro borough
Management, Business, Science and Arts Occupations
The most common Management, Business, Science and Arts occupations in Paulsboro borough are Community & Social Service (218 | 8.0%), Management (210 | 7.7%), Business & Financial (154 | 5.6%), Health Diagnosing & Treating (130 | 4.8%), and Education Instruction & Library (116 | 4.2%).
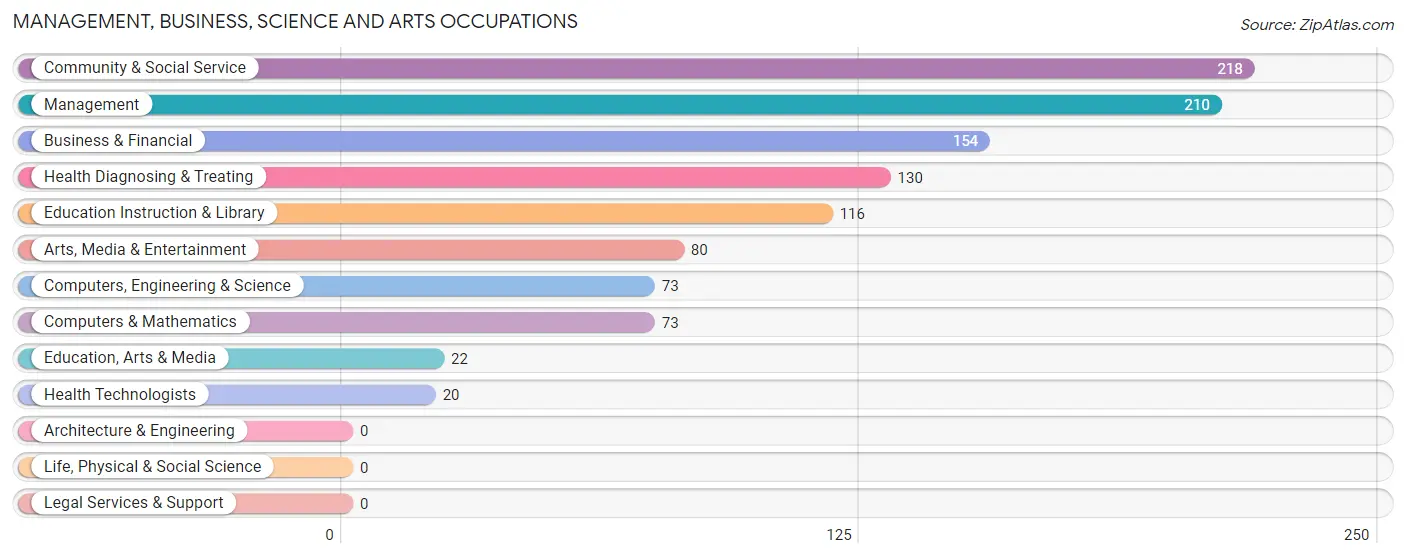
Management, Business, Science and Arts Occupations by Sex
Within the Management, Business, Science and Arts occupations in Paulsboro borough, the most male-oriented occupations are Arts, Media & Entertainment (71.3%), Management (60.0%), and Community & Social Service (27.1%), while the most female-oriented occupations are Education Instruction & Library (100.0%), Health Diagnosing & Treating (100.0%), and Health Technologists (100.0%).
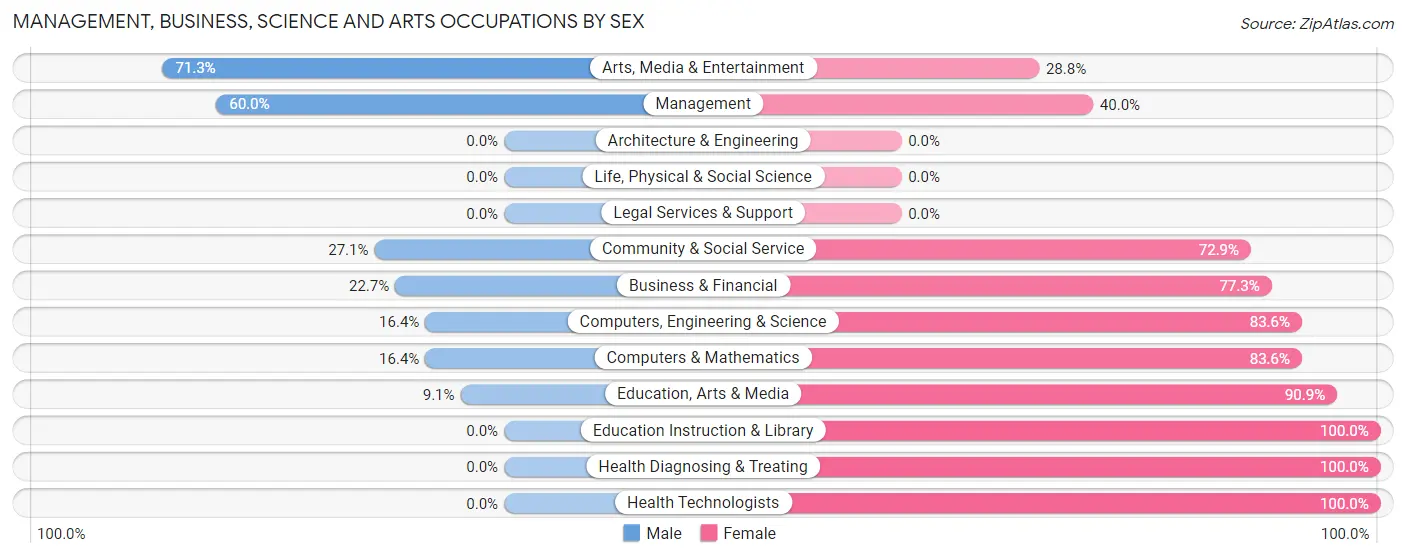
| Occupation | Male | Female |
| Management | 126 (60.0%) | 84 (40.0%) |
| Business & Financial | 35 (22.7%) | 119 (77.3%) |
| Computers, Engineering & Science | 12 (16.4%) | 61 (83.6%) |
| Computers & Mathematics | 12 (16.4%) | 61 (83.6%) |
| Architecture & Engineering | 0 (0.0%) | 0 (0.0%) |
| Life, Physical & Social Science | 0 (0.0%) | 0 (0.0%) |
| Community & Social Service | 59 (27.1%) | 159 (72.9%) |
| Education, Arts & Media | 2 (9.1%) | 20 (90.9%) |
| Legal Services & Support | 0 (0.0%) | 0 (0.0%) |
| Education Instruction & Library | 0 (0.0%) | 116 (100.0%) |
| Arts, Media & Entertainment | 57 (71.3%) | 23 (28.7%) |
| Health Diagnosing & Treating | 0 (0.0%) | 130 (100.0%) |
| Health Technologists | 0 (0.0%) | 20 (100.0%) |
| Total (Category) | 232 (29.5%) | 553 (70.5%) |
| Total (Overall) | 1,326 (48.5%) | 1,408 (51.5%) |
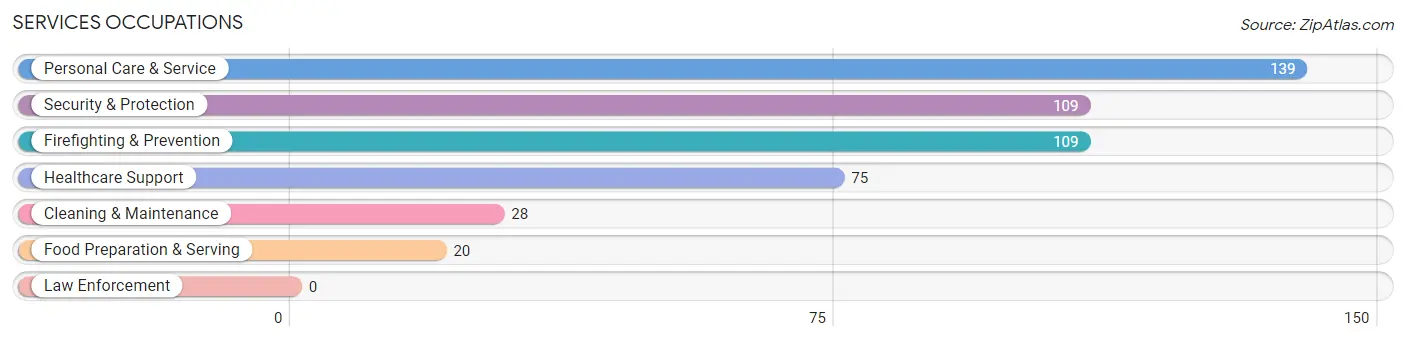
Services Occupations
The most common Services occupations in Paulsboro borough are Personal Care & Service (139 | 5.1%), Security & Protection (109 | 4.0%), Firefighting & Prevention (109 | 4.0%), Healthcare Support (75 | 2.7%), and Cleaning & Maintenance (28 | 1.0%).
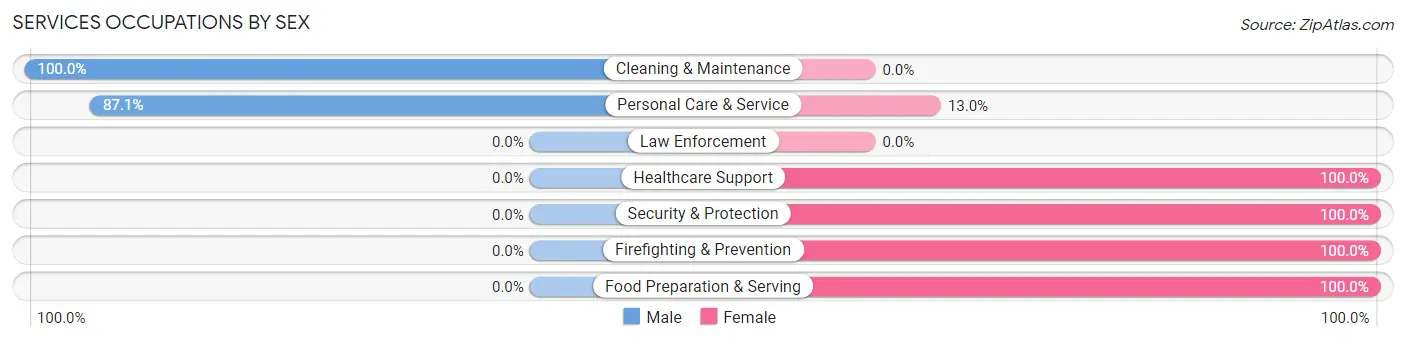
Services Occupations by Sex
Within the Services occupations in Paulsboro borough, the most male-oriented occupations are Cleaning & Maintenance (100.0%), and Personal Care & Service (87.1%), while the most female-oriented occupations are Healthcare Support (100.0%), Security & Protection (100.0%), and Firefighting & Prevention (100.0%).
| Occupation | Male | Female |
| Healthcare Support | 0 (0.0%) | 75 (100.0%) |
| Security & Protection | 0 (0.0%) | 109 (100.0%) |
| Firefighting & Prevention | 0 (0.0%) | 109 (100.0%) |
| Law Enforcement | 0 (0.0%) | 0 (0.0%) |
| Food Preparation & Serving | 0 (0.0%) | 20 (100.0%) |
| Cleaning & Maintenance | 28 (100.0%) | 0 (0.0%) |
| Personal Care & Service | 121 (87.1%) | 18 (13.0%) |
| Total (Category) | 149 (40.2%) | 222 (59.8%) |
| Total (Overall) | 1,326 (48.5%) | 1,408 (51.5%) |
Sales and Office Occupations
The most common Sales and Office occupations in Paulsboro borough are Office & Administration (365 | 13.4%), and Sales & Related (195 | 7.1%).

Sales and Office Occupations by Sex

| Occupation | Male | Female |
| Sales & Related | 14 (7.2%) | 181 (92.8%) |
| Office & Administration | 114 (31.2%) | 251 (68.8%) |
| Total (Category) | 128 (22.9%) | 432 (77.1%) |
| Total (Overall) | 1,326 (48.5%) | 1,408 (51.5%) |
Natural Resources, Construction and Maintenance Occupations
The most common Natural Resources, Construction and Maintenance occupations in Paulsboro borough are Construction & Extraction (279 | 10.2%), Installation, Maintenance & Repair (47 | 1.7%), and Farming, Fishing & Forestry (20 | 0.7%).

Natural Resources, Construction and Maintenance Occupations by Sex

| Occupation | Male | Female |
| Farming, Fishing & Forestry | 20 (100.0%) | 0 (0.0%) |
| Construction & Extraction | 279 (100.0%) | 0 (0.0%) |
| Installation, Maintenance & Repair | 47 (100.0%) | 0 (0.0%) |
| Total (Category) | 346 (100.0%) | 0 (0.0%) |
| Total (Overall) | 1,326 (48.5%) | 1,408 (51.5%) |
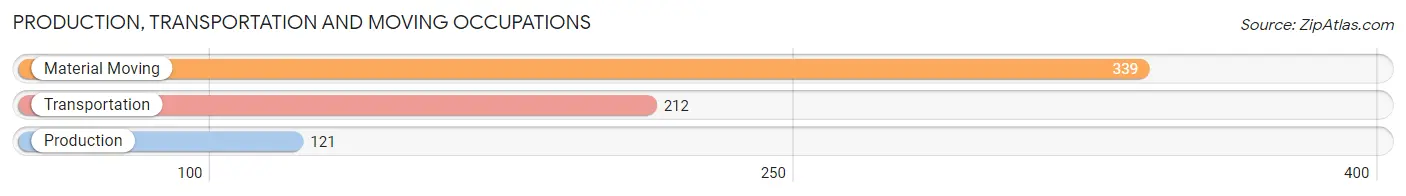
Production, Transportation and Moving Occupations
The most common Production, Transportation and Moving occupations in Paulsboro borough are Material Moving (339 | 12.4%), Transportation (212 | 7.7%), and Production (121 | 4.4%).
Production, Transportation and Moving Occupations by Sex

| Occupation | Male | Female |
| Production | 104 (86.0%) | 17 (14.1%) |
| Transportation | 141 (66.5%) | 71 (33.5%) |
| Material Moving | 226 (66.7%) | 113 (33.3%) |
| Total (Category) | 471 (70.1%) | 201 (29.9%) |
| Total (Overall) | 1,326 (48.5%) | 1,408 (51.5%) |
Employment Industries by Sex in Paulsboro borough
Employment Industries in Paulsboro borough
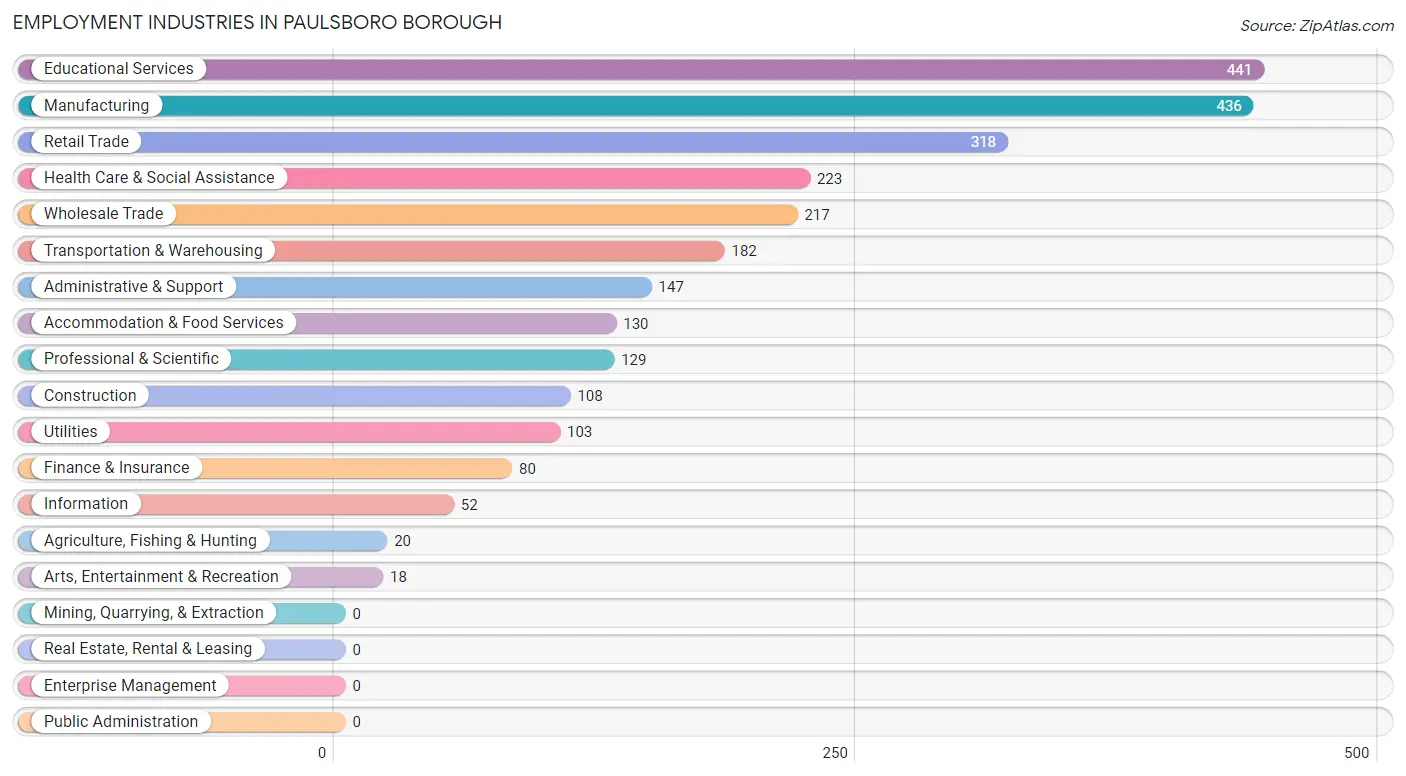
The major employment industries in Paulsboro borough include Educational Services (441 | 16.1%), Manufacturing (436 | 16.0%), Retail Trade (318 | 11.6%), Health Care & Social Assistance (223 | 8.2%), and Wholesale Trade (217 | 7.9%).
Employment Industries by Sex in Paulsboro borough
The Paulsboro borough industries that see more men than women are Agriculture, Fishing & Hunting (100.0%), Construction (100.0%), and Finance & Insurance (100.0%), whereas the industries that tend to have a higher number of women are Arts, Entertainment & Recreation (100.0%), Health Care & Social Assistance (91.9%), and Utilities (84.5%).
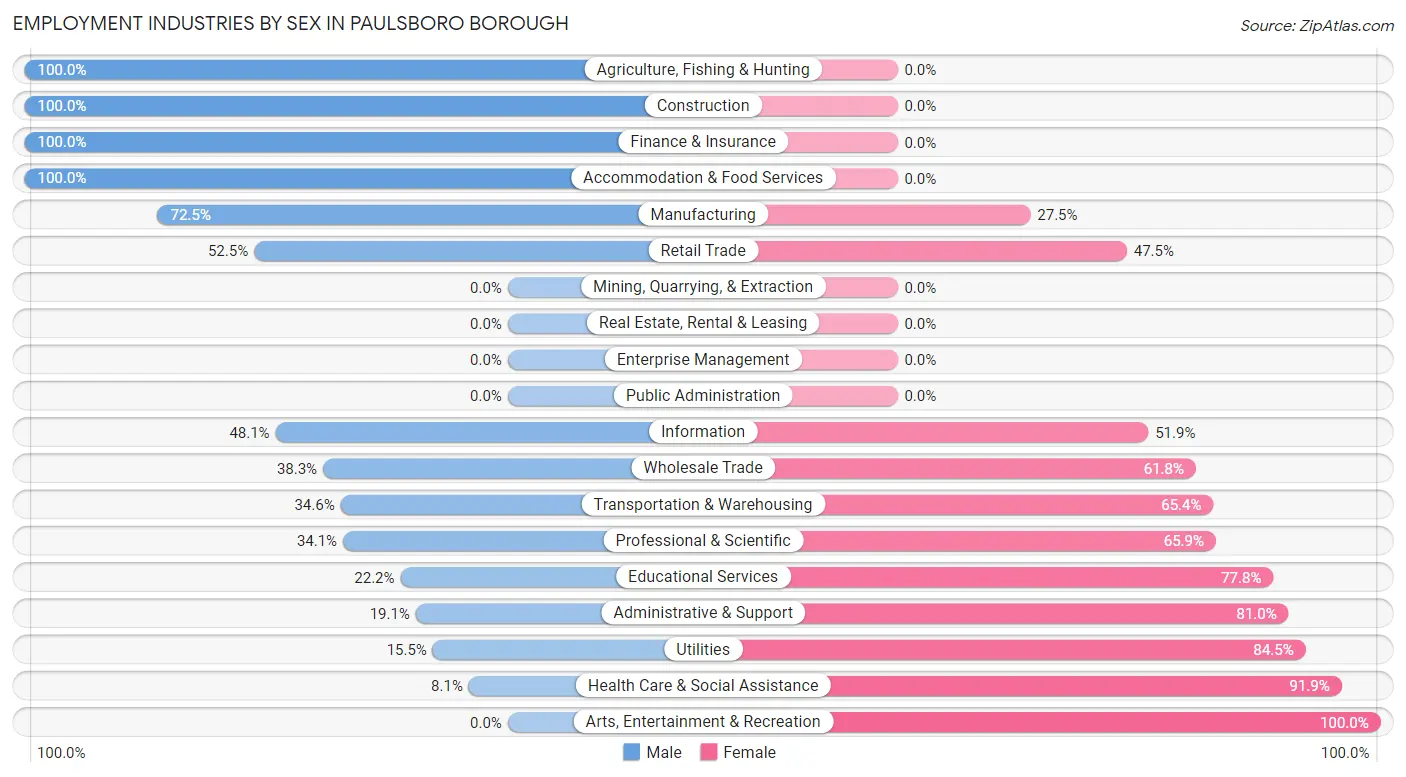
| Industry | Male | Female |
| Agriculture, Fishing & Hunting | 20 (100.0%) | 0 (0.0%) |
| Mining, Quarrying, & Extraction | 0 (0.0%) | 0 (0.0%) |
| Construction | 108 (100.0%) | 0 (0.0%) |
| Manufacturing | 316 (72.5%) | 120 (27.5%) |
| Wholesale Trade | 83 (38.3%) | 134 (61.8%) |
| Retail Trade | 167 (52.5%) | 151 (47.5%) |
| Transportation & Warehousing | 63 (34.6%) | 119 (65.4%) |
| Utilities | 16 (15.5%) | 87 (84.5%) |
| Information | 25 (48.1%) | 27 (51.9%) |
| Finance & Insurance | 80 (100.0%) | 0 (0.0%) |
| Real Estate, Rental & Leasing | 0 (0.0%) | 0 (0.0%) |
| Professional & Scientific | 44 (34.1%) | 85 (65.9%) |
| Enterprise Management | 0 (0.0%) | 0 (0.0%) |
| Administrative & Support | 28 (19.1%) | 119 (80.9%) |
| Educational Services | 98 (22.2%) | 343 (77.8%) |
| Health Care & Social Assistance | 18 (8.1%) | 205 (91.9%) |
| Arts, Entertainment & Recreation | 0 (0.0%) | 18 (100.0%) |
| Accommodation & Food Services | 130 (100.0%) | 0 (0.0%) |
| Public Administration | 0 (0.0%) | 0 (0.0%) |
| Total | 1,326 (48.5%) | 1,408 (51.5%) |
Education in Paulsboro borough
School Enrollment in Paulsboro borough
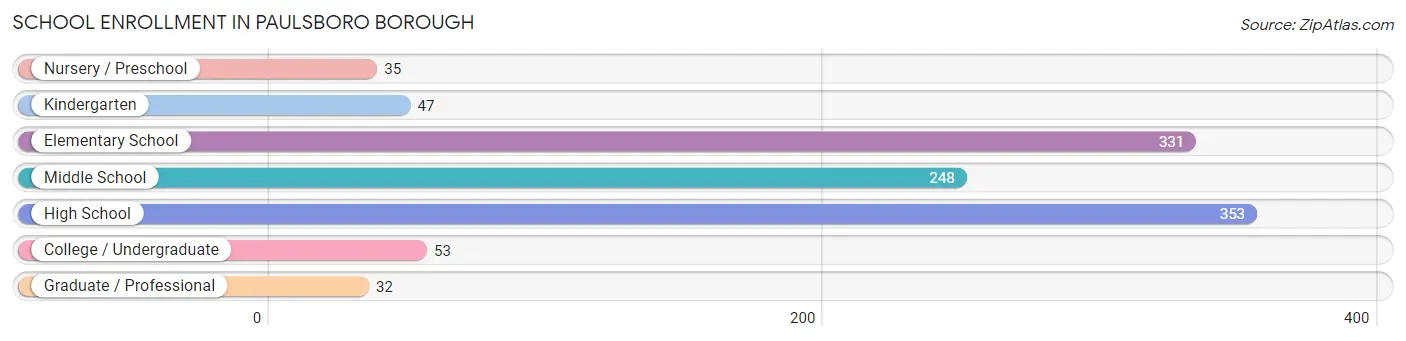
The most common levels of schooling among the 1,099 students in Paulsboro borough are high school (353 | 32.1%), elementary school (331 | 30.1%), and middle school (248 | 22.6%).
| School Level | # Students | % Students |
| Nursery / Preschool | 35 | 3.2% |
| Kindergarten | 47 | 4.3% |
| Elementary School | 331 | 30.1% |
| Middle School | 248 | 22.6% |
| High School | 353 | 32.1% |
| College / Undergraduate | 53 | 4.8% |
| Graduate / Professional | 32 | 2.9% |
| Total | 1,099 | 100.0% |
School Enrollment by Age by Funding Source in Paulsboro borough
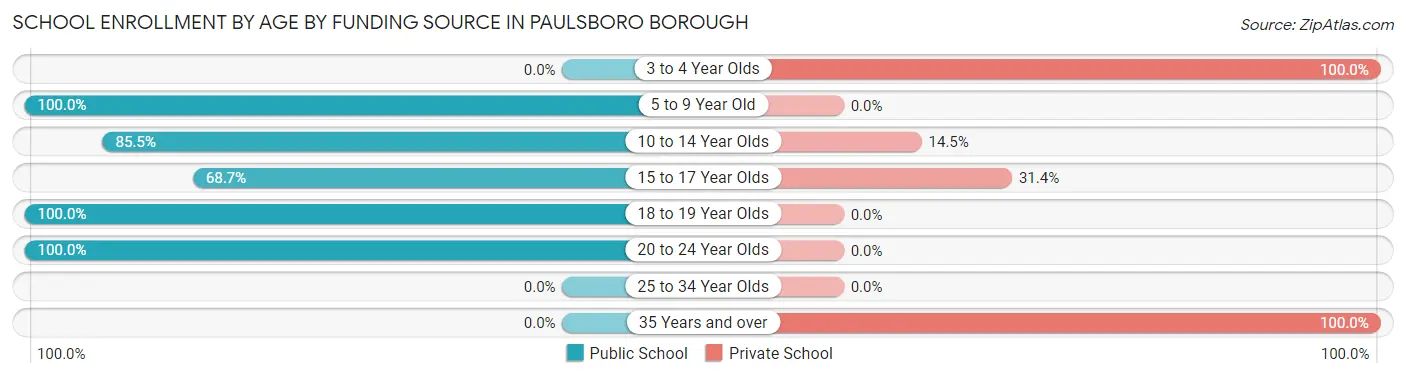
Out of a total of 1,099 students who are enrolled in schools in Paulsboro borough, 143 (13.0%) attend a private institution, while the remaining 956 (87.0%) are enrolled in public schools. The age group of 3 to 4 year olds has the highest likelihood of being enrolled in private schools, with 35 (100.0% in the age bracket) enrolled. Conversely, the age group of 5 to 9 year old has the lowest likelihood of being enrolled in a private school, with 378 (100.0% in the age bracket) attending a public institution.
| Age Bracket | Public School | Private School |
| 3 to 4 Year Olds | 0 (0.0%) | 35 (100.0%) |
| 5 to 9 Year Old | 378 (100.0%) | 0 (0.0%) |
| 10 to 14 Year Olds | 212 (85.5%) | 36 (14.5%) |
| 15 to 17 Year Olds | 127 (68.6%) | 58 (31.4%) |
| 18 to 19 Year Olds | 182 (100.0%) | 0 (0.0%) |
| 20 to 24 Year Olds | 57 (100.0%) | 0 (0.0%) |
| 25 to 34 Year Olds | 0 (0.0%) | 0 (0.0%) |
| 35 Years and over | 0 (0.0%) | 14 (100.0%) |
| Total | 956 (87.0%) | 143 (13.0%) |
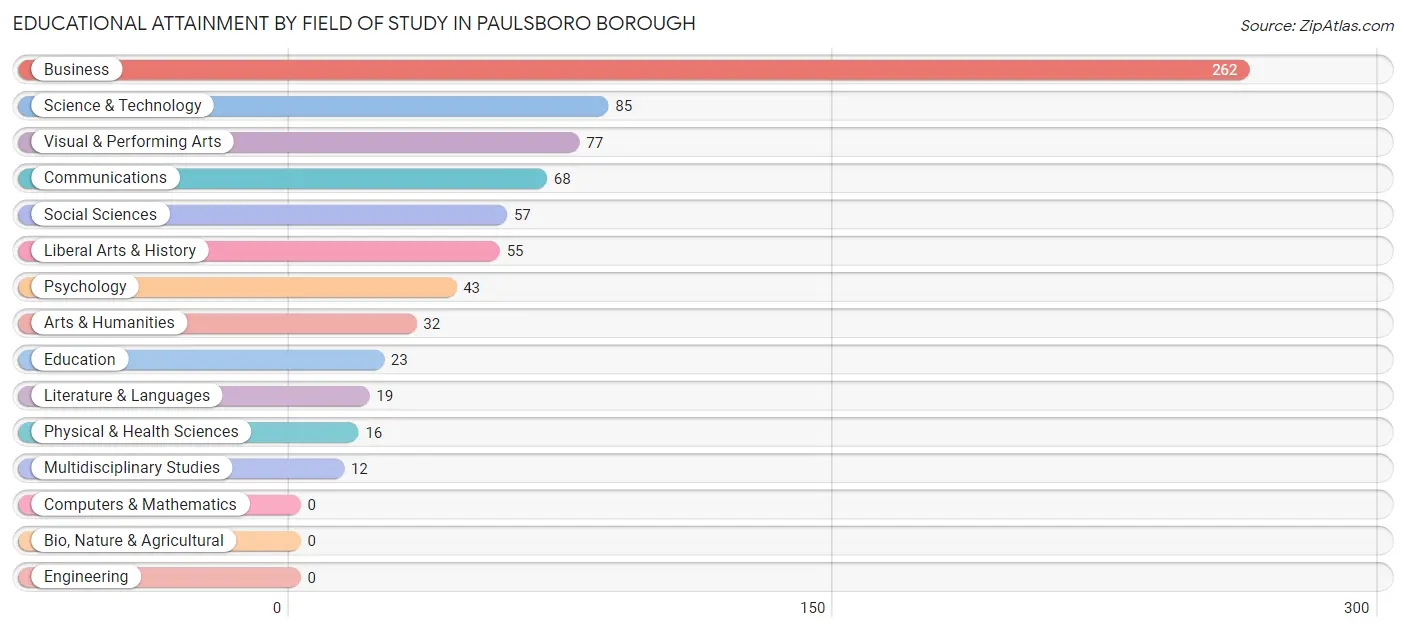
Educational Attainment by Field of Study in Paulsboro borough
Business (262 | 35.0%), science & technology (85 | 11.4%), visual & performing arts (77 | 10.3%), communications (68 | 9.1%), and social sciences (57 | 7.6%) are the most common fields of study among 749 individuals in Paulsboro borough who have obtained a bachelor's degree or higher.
| Field of Study | # Graduates | % Graduates |
| Computers & Mathematics | 0 | 0.0% |
| Bio, Nature & Agricultural | 0 | 0.0% |
| Physical & Health Sciences | 16 | 2.1% |
| Psychology | 43 | 5.7% |
| Social Sciences | 57 | 7.6% |
| Engineering | 0 | 0.0% |
| Multidisciplinary Studies | 12 | 1.6% |
| Science & Technology | 85 | 11.4% |
| Business | 262 | 35.0% |
| Education | 23 | 3.1% |
| Literature & Languages | 19 | 2.5% |
| Liberal Arts & History | 55 | 7.3% |
| Visual & Performing Arts | 77 | 10.3% |
| Communications | 68 | 9.1% |
| Arts & Humanities | 32 | 4.3% |
| Total | 749 | 100.0% |
Transportation & Commute in Paulsboro borough
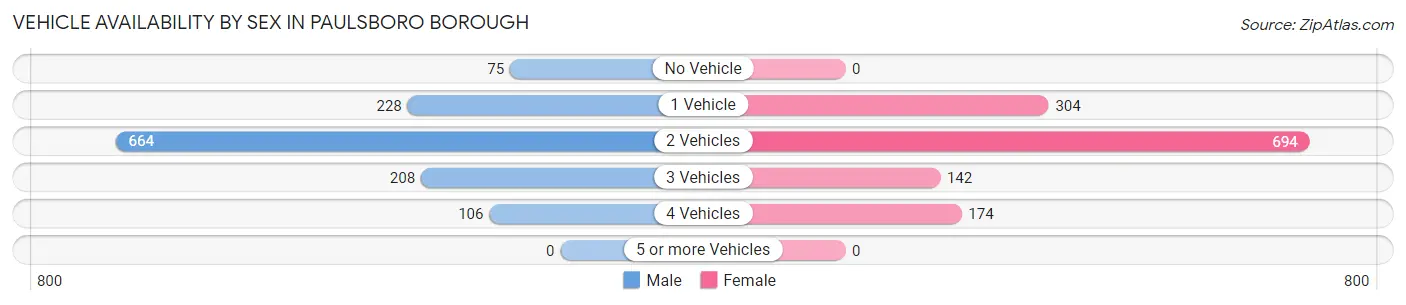
Vehicle Availability by Sex in Paulsboro borough
The most prevalent vehicle ownership categories in Paulsboro borough are males with 2 vehicles (664, accounting for 51.8%) and females with 2 vehicles (694, making up 50.5%).
| Vehicles Available | Male | Female |
| No Vehicle | 75 (5.9%) | 0 (0.0%) |
| 1 Vehicle | 228 (17.8%) | 304 (23.1%) |
| 2 Vehicles | 664 (51.8%) | 694 (52.8%) |
| 3 Vehicles | 208 (16.2%) | 142 (10.8%) |
| 4 Vehicles | 106 (8.3%) | 174 (13.2%) |
| 5 or more Vehicles | 0 (0.0%) | 0 (0.0%) |
| Total | 1,281 (100.0%) | 1,314 (100.0%) |
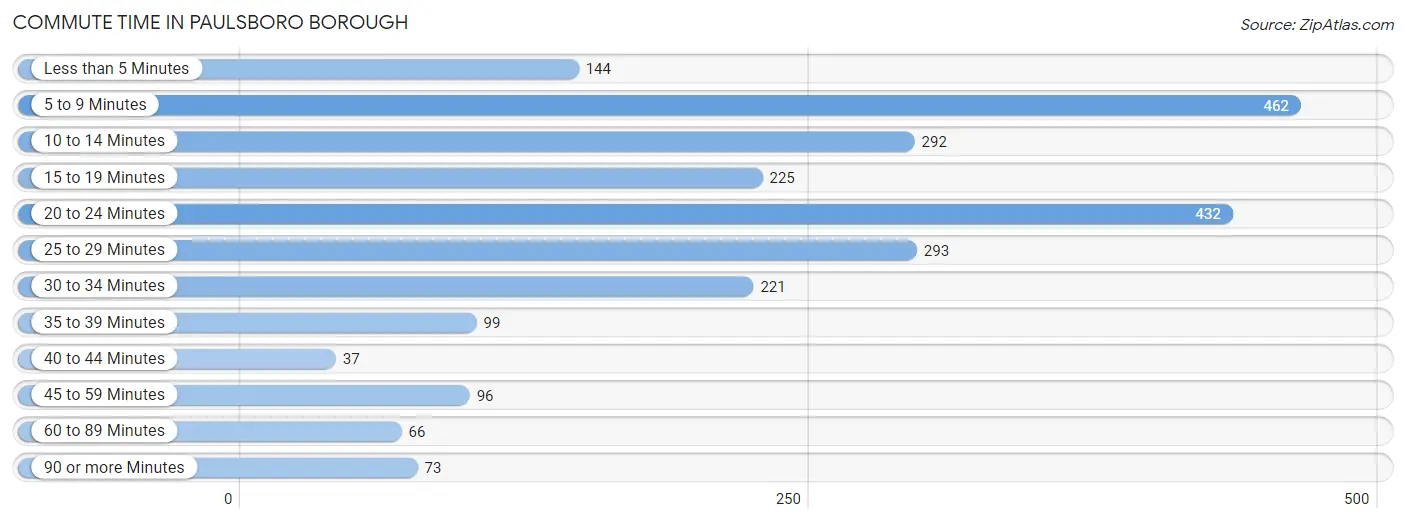
Commute Time in Paulsboro borough
The most frequently occuring commute durations in Paulsboro borough are 5 to 9 minutes (462 commuters, 18.9%), 20 to 24 minutes (432 commuters, 17.7%), and 25 to 29 minutes (293 commuters, 12.0%).
| Commute Time | # Commuters | % Commuters |
| Less than 5 Minutes | 144 | 5.9% |
| 5 to 9 Minutes | 462 | 18.9% |
| 10 to 14 Minutes | 292 | 12.0% |
| 15 to 19 Minutes | 225 | 9.2% |
| 20 to 24 Minutes | 432 | 17.7% |
| 25 to 29 Minutes | 293 | 12.0% |
| 30 to 34 Minutes | 221 | 9.1% |
| 35 to 39 Minutes | 99 | 4.1% |
| 40 to 44 Minutes | 37 | 1.5% |
| 45 to 59 Minutes | 96 | 3.9% |
| 60 to 89 Minutes | 66 | 2.7% |
| 90 or more Minutes | 73 | 3.0% |
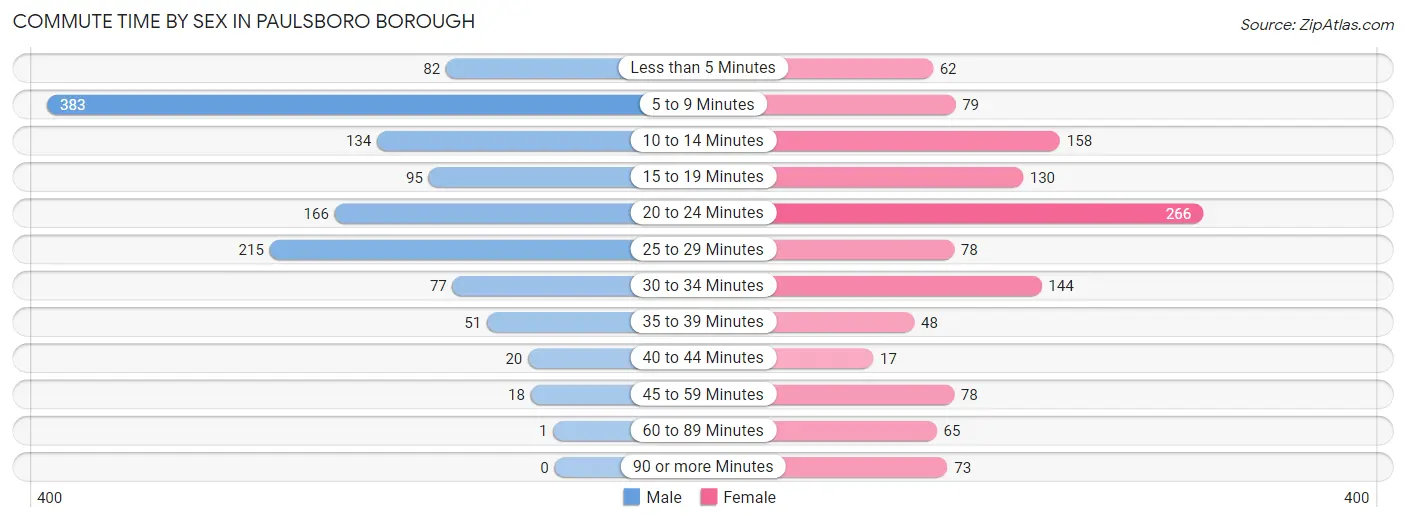
Commute Time by Sex in Paulsboro borough
The most common commute times in Paulsboro borough are 5 to 9 minutes (383 commuters, 30.8%) for males and 20 to 24 minutes (266 commuters, 22.2%) for females.
| Commute Time | Male | Female |
| Less than 5 Minutes | 82 (6.6%) | 62 (5.2%) |
| 5 to 9 Minutes | 383 (30.8%) | 79 (6.6%) |
| 10 to 14 Minutes | 134 (10.8%) | 158 (13.2%) |
| 15 to 19 Minutes | 95 (7.6%) | 130 (10.8%) |
| 20 to 24 Minutes | 166 (13.4%) | 266 (22.2%) |
| 25 to 29 Minutes | 215 (17.3%) | 78 (6.5%) |
| 30 to 34 Minutes | 77 (6.2%) | 144 (12.0%) |
| 35 to 39 Minutes | 51 (4.1%) | 48 (4.0%) |
| 40 to 44 Minutes | 20 (1.6%) | 17 (1.4%) |
| 45 to 59 Minutes | 18 (1.5%) | 78 (6.5%) |
| 60 to 89 Minutes | 1 (0.1%) | 65 (5.4%) |
| 90 or more Minutes | 0 (0.0%) | 73 (6.1%) |
Time of Departure to Work by Sex in Paulsboro borough
The most frequent times of departure to work in Paulsboro borough are 6:30 AM to 6:59 AM (291, 23.4%) for males and 8:00 AM to 8:29 AM (233, 19.5%) for females.
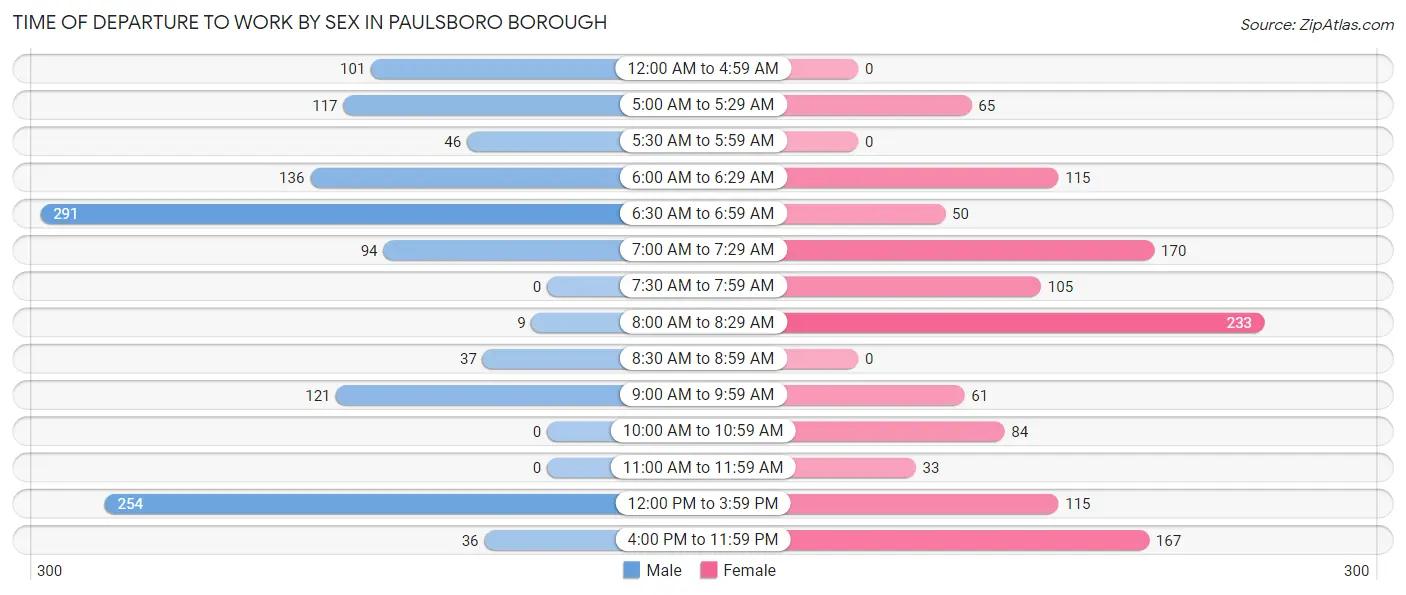
| Time of Departure | Male | Female |
| 12:00 AM to 4:59 AM | 101 (8.1%) | 0 (0.0%) |
| 5:00 AM to 5:29 AM | 117 (9.4%) | 65 (5.4%) |
| 5:30 AM to 5:59 AM | 46 (3.7%) | 0 (0.0%) |
| 6:00 AM to 6:29 AM | 136 (11.0%) | 115 (9.6%) |
| 6:30 AM to 6:59 AM | 291 (23.4%) | 50 (4.2%) |
| 7:00 AM to 7:29 AM | 94 (7.6%) | 170 (14.2%) |
| 7:30 AM to 7:59 AM | 0 (0.0%) | 105 (8.8%) |
| 8:00 AM to 8:29 AM | 9 (0.7%) | 233 (19.5%) |
| 8:30 AM to 8:59 AM | 37 (3.0%) | 0 (0.0%) |
| 9:00 AM to 9:59 AM | 121 (9.7%) | 61 (5.1%) |
| 10:00 AM to 10:59 AM | 0 (0.0%) | 84 (7.0%) |
| 11:00 AM to 11:59 AM | 0 (0.0%) | 33 (2.8%) |
| 12:00 PM to 3:59 PM | 254 (20.4%) | 115 (9.6%) |
| 4:00 PM to 11:59 PM | 36 (2.9%) | 167 (13.9%) |
| Total | 1,242 (100.0%) | 1,198 (100.0%) |
Housing Occupancy in Paulsboro borough
Occupancy by Ownership in Paulsboro borough
Of the total 2,467 dwellings in Paulsboro borough, owner-occupied units account for 1,784 (72.3%), while renter-occupied units make up 683 (27.7%).
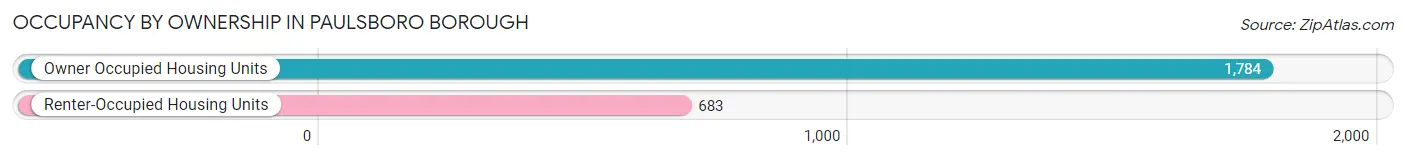
| Occupancy | # Housing Units | % Housing Units |
| Owner Occupied Housing Units | 1,784 | 72.3% |
| Renter-Occupied Housing Units | 683 | 27.7% |
| Total Occupied Housing Units | 2,467 | 100.0% |
Occupancy by Household Size in Paulsboro borough
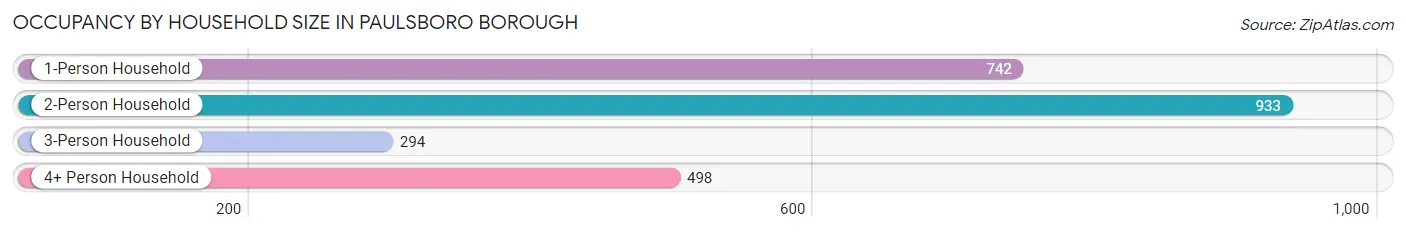
| Household Size | # Housing Units | % Housing Units |
| 1-Person Household | 742 | 30.1% |
| 2-Person Household | 933 | 37.8% |
| 3-Person Household | 294 | 11.9% |
| 4+ Person Household | 498 | 20.2% |
| Total Housing Units | 2,467 | 100.0% |
Occupancy by Ownership by Household Size in Paulsboro borough
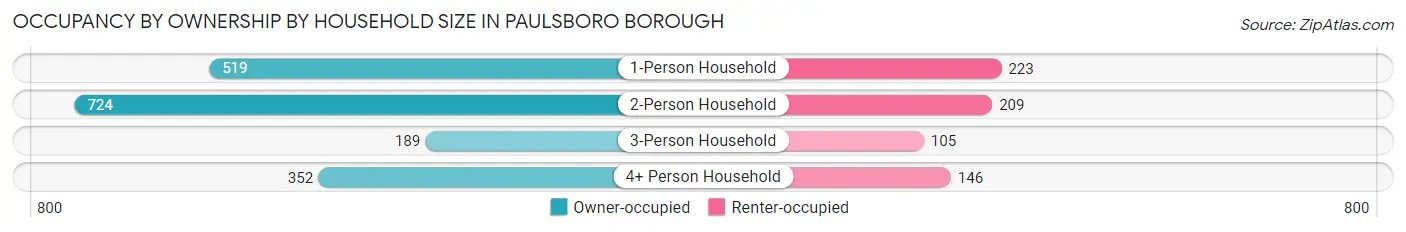
| Household Size | Owner-occupied | Renter-occupied |
| 1-Person Household | 519 (70.0%) | 223 (30.0%) |
| 2-Person Household | 724 (77.6%) | 209 (22.4%) |
| 3-Person Household | 189 (64.3%) | 105 (35.7%) |
| 4+ Person Household | 352 (70.7%) | 146 (29.3%) |
| Total Housing Units | 1,784 (72.3%) | 683 (27.7%) |
Occupancy by Educational Attainment in Paulsboro borough
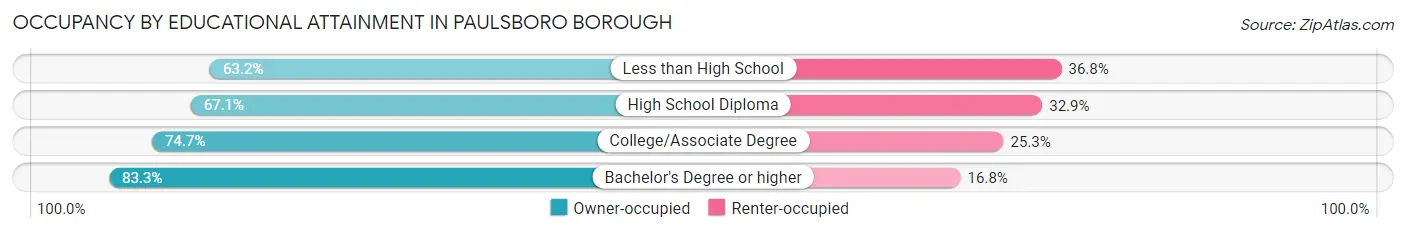
| Household Size | Owner-occupied | Renter-occupied |
| Less than High School | 160 (63.2%) | 93 (36.8%) |
| High School Diploma | 566 (67.1%) | 278 (32.9%) |
| College/Associate Degree | 725 (74.7%) | 245 (25.3%) |
| Bachelor's Degree or higher | 333 (83.3%) | 67 (16.8%) |
Occupancy by Age of Householder in Paulsboro borough
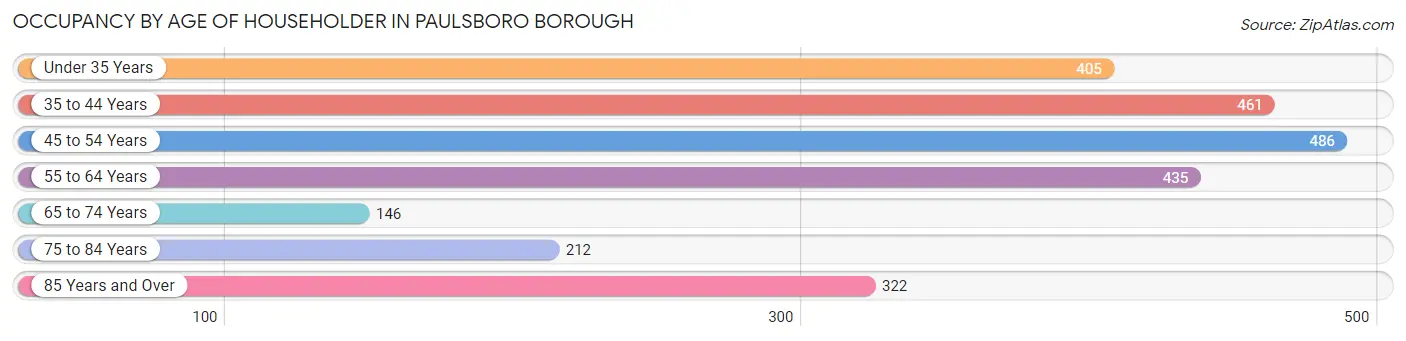
| Age Bracket | # Households | % Households |
| Under 35 Years | 405 | 16.4% |
| 35 to 44 Years | 461 | 18.7% |
| 45 to 54 Years | 486 | 19.7% |
| 55 to 64 Years | 435 | 17.6% |
| 65 to 74 Years | 146 | 5.9% |
| 75 to 84 Years | 212 | 8.6% |
| 85 Years and Over | 322 | 13.1% |
| Total | 2,467 | 100.0% |
Housing Finances in Paulsboro borough
Median Income by Occupancy in Paulsboro borough
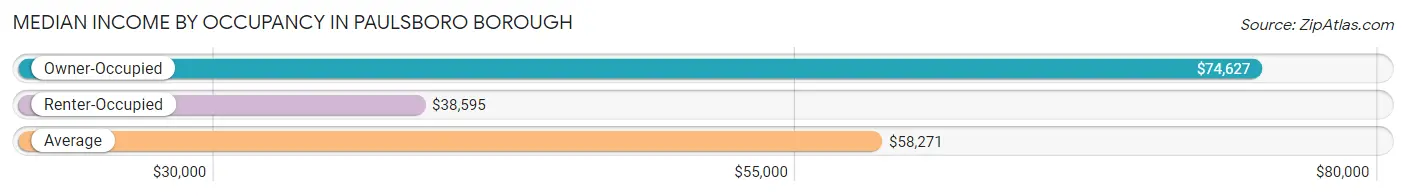
| Occupancy Type | # Households | Median Income |
| Owner-Occupied | 1,784 (72.3%) | $74,627 |
| Renter-Occupied | 683 (27.7%) | $38,595 |
| Average | 2,467 (100.0%) | $58,271 |
Occupancy by Householder Income Bracket in Paulsboro borough
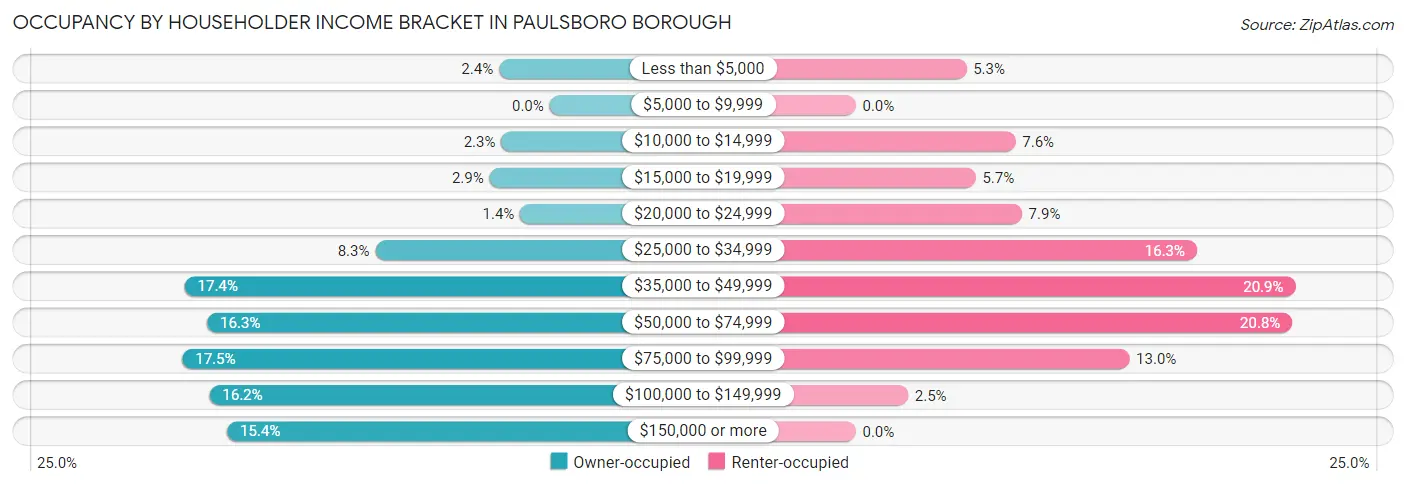
| Income Bracket | Owner-occupied | Renter-occupied |
| Less than $5,000 | 43 (2.4%) | 36 (5.3%) |
| $5,000 to $9,999 | 0 (0.0%) | 0 (0.0%) |
| $10,000 to $14,999 | 41 (2.3%) | 52 (7.6%) |
| $15,000 to $19,999 | 51 (2.9%) | 39 (5.7%) |
| $20,000 to $24,999 | 25 (1.4%) | 54 (7.9%) |
| $25,000 to $34,999 | 148 (8.3%) | 111 (16.3%) |
| $35,000 to $49,999 | 310 (17.4%) | 143 (20.9%) |
| $50,000 to $74,999 | 291 (16.3%) | 142 (20.8%) |
| $75,000 to $99,999 | 312 (17.5%) | 89 (13.0%) |
| $100,000 to $149,999 | 289 (16.2%) | 17 (2.5%) |
| $150,000 or more | 274 (15.4%) | 0 (0.0%) |
| Total | 1,784 (100.0%) | 683 (100.0%) |
Monthly Housing Cost Tiers in Paulsboro borough
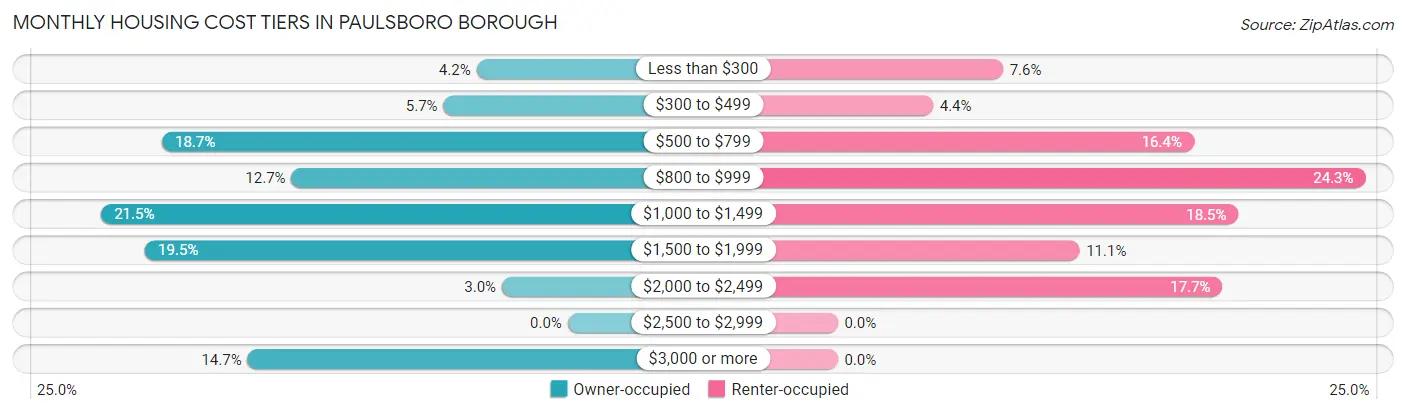
| Monthly Cost | Owner-occupied | Renter-occupied |
| Less than $300 | 75 (4.2%) | 52 (7.6%) |
| $300 to $499 | 102 (5.7%) | 30 (4.4%) |
| $500 to $799 | 333 (18.7%) | 112 (16.4%) |
| $800 to $999 | 227 (12.7%) | 166 (24.3%) |
| $1,000 to $1,499 | 383 (21.5%) | 126 (18.4%) |
| $1,500 to $1,999 | 347 (19.5%) | 76 (11.1%) |
| $2,000 to $2,499 | 54 (3.0%) | 121 (17.7%) |
| $2,500 to $2,999 | 0 (0.0%) | 0 (0.0%) |
| $3,000 or more | 263 (14.7%) | 0 (0.0%) |
| Total | 1,784 (100.0%) | 683 (100.0%) |
Physical Housing Characteristics in Paulsboro borough
Housing Structures in Paulsboro borough
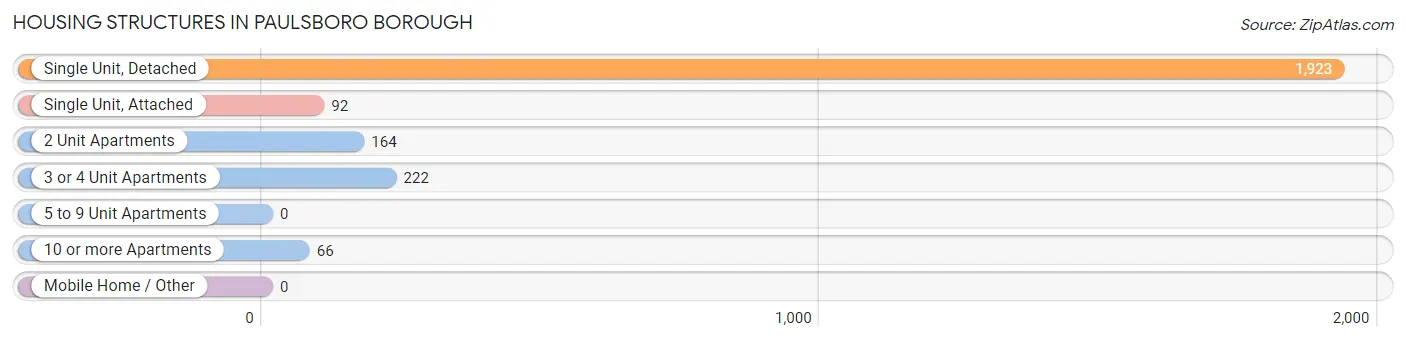
| Structure Type | # Housing Units | % Housing Units |
| Single Unit, Detached | 1,923 | 77.9% |
| Single Unit, Attached | 92 | 3.7% |
| 2 Unit Apartments | 164 | 6.7% |
| 3 or 4 Unit Apartments | 222 | 9.0% |
| 5 to 9 Unit Apartments | 0 | 0.0% |
| 10 or more Apartments | 66 | 2.7% |
| Mobile Home / Other | 0 | 0.0% |
| Total | 2,467 | 100.0% |
Housing Structures by Occupancy in Paulsboro borough
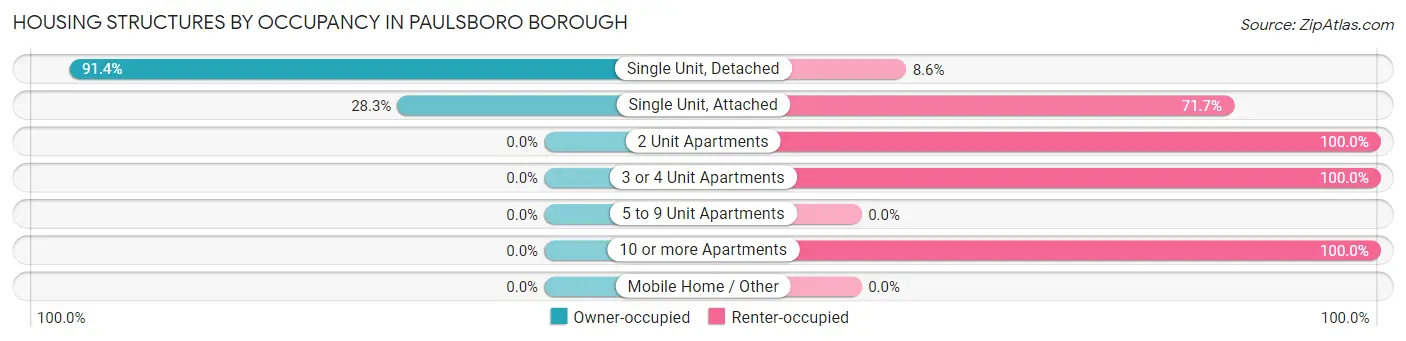
| Structure Type | Owner-occupied | Renter-occupied |
| Single Unit, Detached | 1,758 (91.4%) | 165 (8.6%) |
| Single Unit, Attached | 26 (28.3%) | 66 (71.7%) |
| 2 Unit Apartments | 0 (0.0%) | 164 (100.0%) |
| 3 or 4 Unit Apartments | 0 (0.0%) | 222 (100.0%) |
| 5 to 9 Unit Apartments | 0 (0.0%) | 0 (0.0%) |
| 10 or more Apartments | 0 (0.0%) | 66 (100.0%) |
| Mobile Home / Other | 0 (0.0%) | 0 (0.0%) |
| Total | 1,784 (72.3%) | 683 (27.7%) |
Housing Structures by Number of Rooms in Paulsboro borough
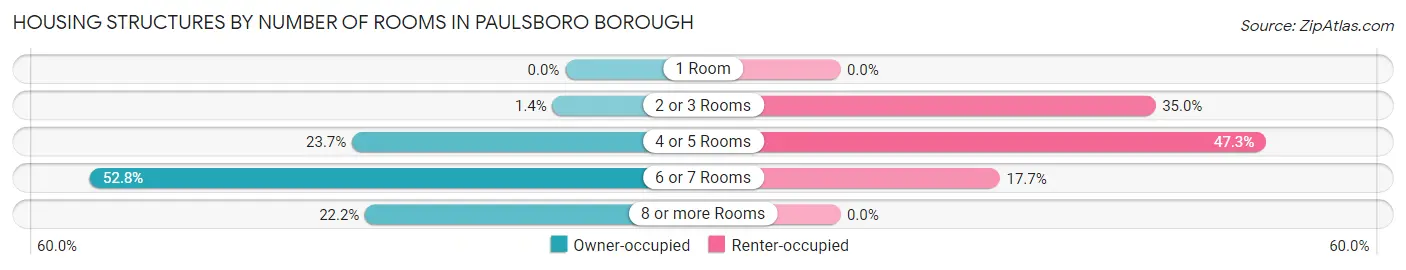
| Number of Rooms | Owner-occupied | Renter-occupied |
| 1 Room | 0 (0.0%) | 0 (0.0%) |
| 2 or 3 Rooms | 25 (1.4%) | 239 (35.0%) |
| 4 or 5 Rooms | 422 (23.6%) | 323 (47.3%) |
| 6 or 7 Rooms | 941 (52.7%) | 121 (17.7%) |
| 8 or more Rooms | 396 (22.2%) | 0 (0.0%) |
| Total | 1,784 (100.0%) | 683 (100.0%) |
Housing Structure by Heating Type in Paulsboro borough
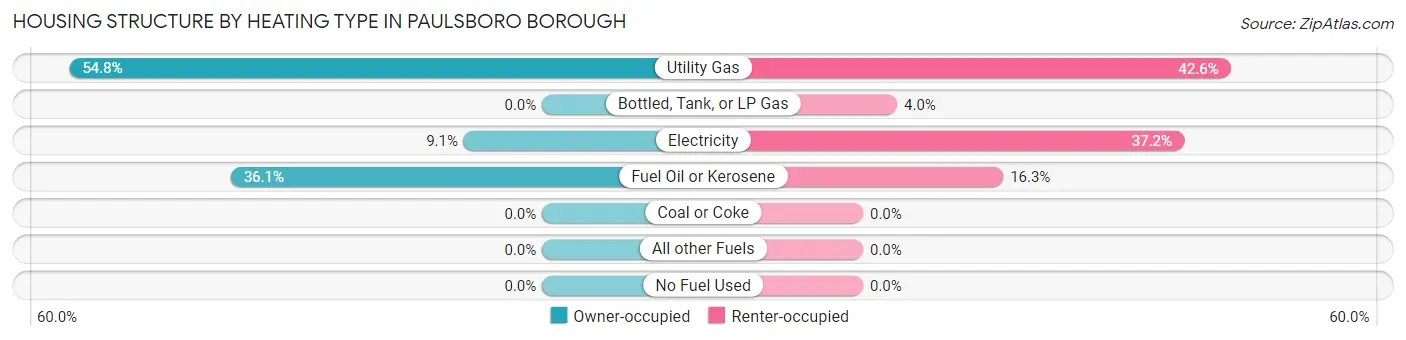
| Heating Type | Owner-occupied | Renter-occupied |
| Utility Gas | 978 (54.8%) | 291 (42.6%) |
| Bottled, Tank, or LP Gas | 0 (0.0%) | 27 (4.0%) |
| Electricity | 162 (9.1%) | 254 (37.2%) |
| Fuel Oil or Kerosene | 644 (36.1%) | 111 (16.3%) |
| Coal or Coke | 0 (0.0%) | 0 (0.0%) |
| All other Fuels | 0 (0.0%) | 0 (0.0%) |
| No Fuel Used | 0 (0.0%) | 0 (0.0%) |
| Total | 1,784 (100.0%) | 683 (100.0%) |
Household Vehicle Usage in Paulsboro borough
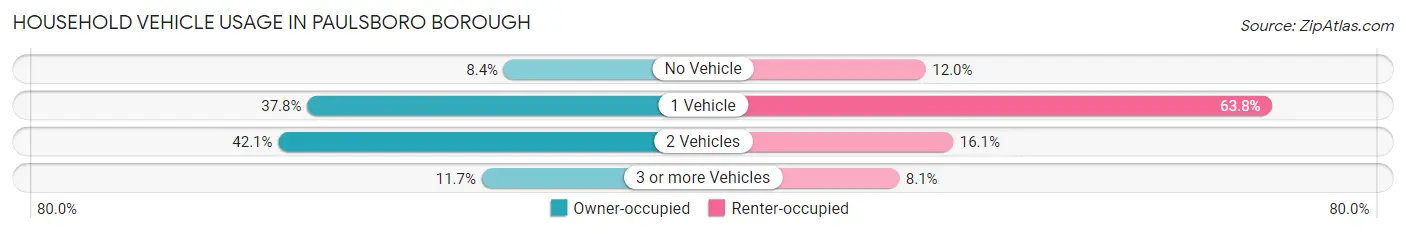
| Vehicles per Household | Owner-occupied | Renter-occupied |
| No Vehicle | 150 (8.4%) | 82 (12.0%) |
| 1 Vehicle | 674 (37.8%) | 436 (63.8%) |
| 2 Vehicles | 751 (42.1%) | 110 (16.1%) |
| 3 or more Vehicles | 209 (11.7%) | 55 (8.1%) |
| Total | 1,784 (100.0%) | 683 (100.0%) |
Real Estate & Mortgages in Paulsboro borough
Real Estate and Mortgage Overview in Paulsboro borough
| Characteristic | Without Mortgage | With Mortgage |
| Housing Units | 737 | 1,047 |
| Median Property Value | $149,900 | $172,600 |
| Median Household Income | - | - |
| Monthly Housing Costs | $765 | $263 |
| Real Estate Taxes | $5,386 | $84 |
Property Value by Mortgage Status in Paulsboro borough
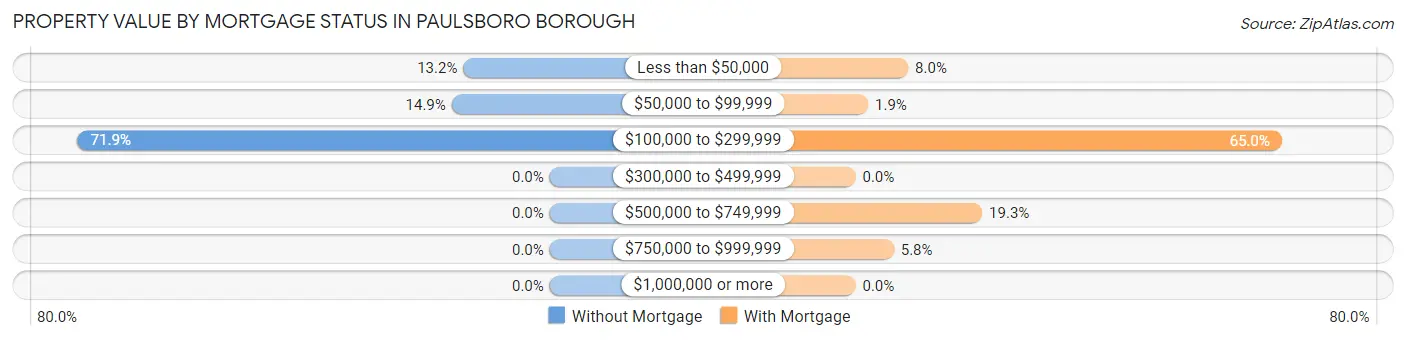
| Property Value | Without Mortgage | With Mortgage |
| Less than $50,000 | 97 (13.2%) | 84 (8.0%) |
| $50,000 to $99,999 | 110 (14.9%) | 20 (1.9%) |
| $100,000 to $299,999 | 530 (71.9%) | 680 (64.9%) |
| $300,000 to $499,999 | 0 (0.0%) | 0 (0.0%) |
| $500,000 to $749,999 | 0 (0.0%) | 202 (19.3%) |
| $750,000 to $999,999 | 0 (0.0%) | 61 (5.8%) |
| $1,000,000 or more | 0 (0.0%) | 0 (0.0%) |
| Total | 737 (100.0%) | 1,047 (100.0%) |
Household Income by Mortgage Status in Paulsboro borough
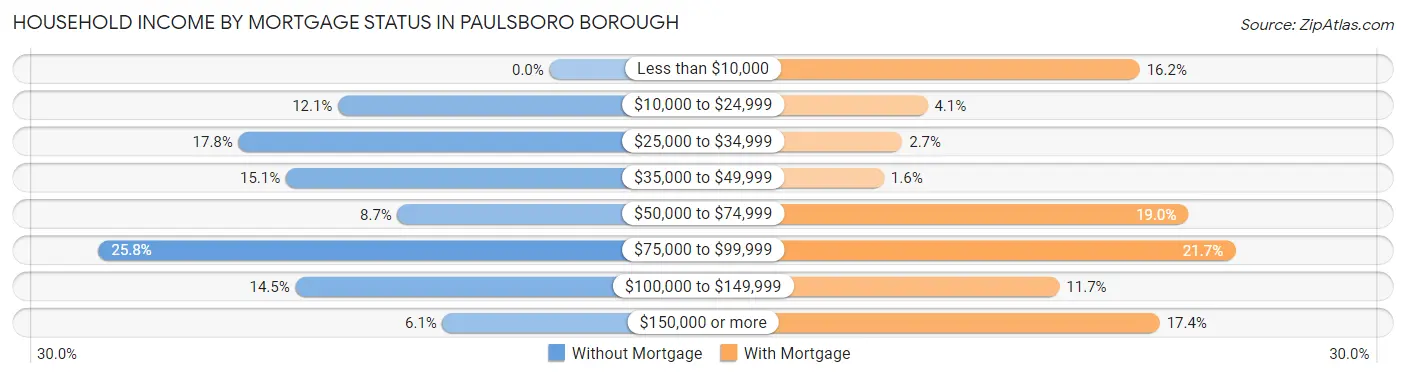
| Household Income | Without Mortgage | With Mortgage |
| Less than $10,000 | 0 (0.0%) | 170 (16.2%) |
| $10,000 to $24,999 | 89 (12.1%) | 43 (4.1%) |
| $25,000 to $34,999 | 131 (17.8%) | 28 (2.7%) |
| $35,000 to $49,999 | 111 (15.1%) | 17 (1.6%) |
| $50,000 to $74,999 | 64 (8.7%) | 199 (19.0%) |
| $75,000 to $99,999 | 190 (25.8%) | 227 (21.7%) |
| $100,000 to $149,999 | 107 (14.5%) | 122 (11.7%) |
| $150,000 or more | 45 (6.1%) | 182 (17.4%) |
| Total | 737 (100.0%) | 1,047 (100.0%) |
Property Value to Household Income Ratio in Paulsboro borough
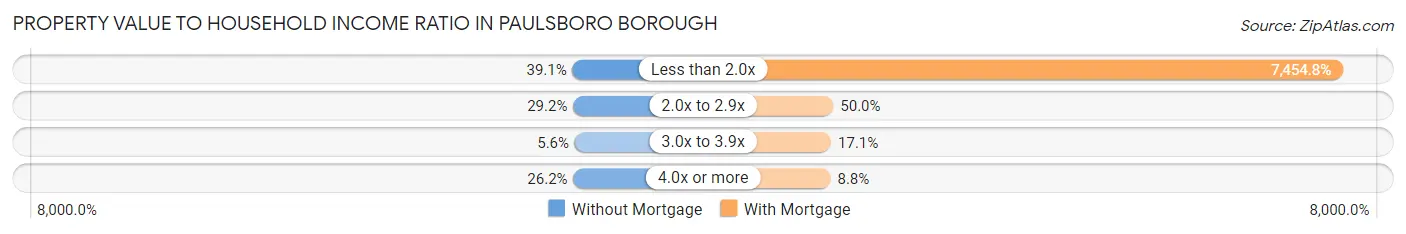
| Value-to-Income Ratio | Without Mortgage | With Mortgage |
| Less than 2.0x | 288 (39.1%) | 78,052 (7,454.8%) |
| 2.0x to 2.9x | 215 (29.2%) | 523 (49.9%) |
| 3.0x to 3.9x | 41 (5.6%) | 179 (17.1%) |
| 4.0x or more | 193 (26.2%) | 92 (8.8%) |
| Total | 737 (100.0%) | 1,047 (100.0%) |
Real Estate Taxes by Mortgage Status in Paulsboro borough
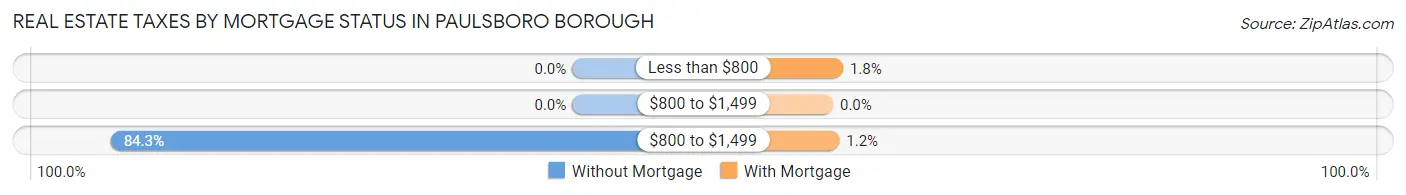
| Property Taxes | Without Mortgage | With Mortgage |
| Less than $800 | 0 (0.0%) | 19 (1.8%) |
| $800 to $1,499 | 0 (0.0%) | 0 (0.0%) |
| $800 to $1,499 | 621 (84.3%) | 12 (1.1%) |
| Total | 737 (100.0%) | 1,047 (100.0%) |
Health & Disability in Paulsboro borough
Health Insurance Coverage by Age in Paulsboro borough
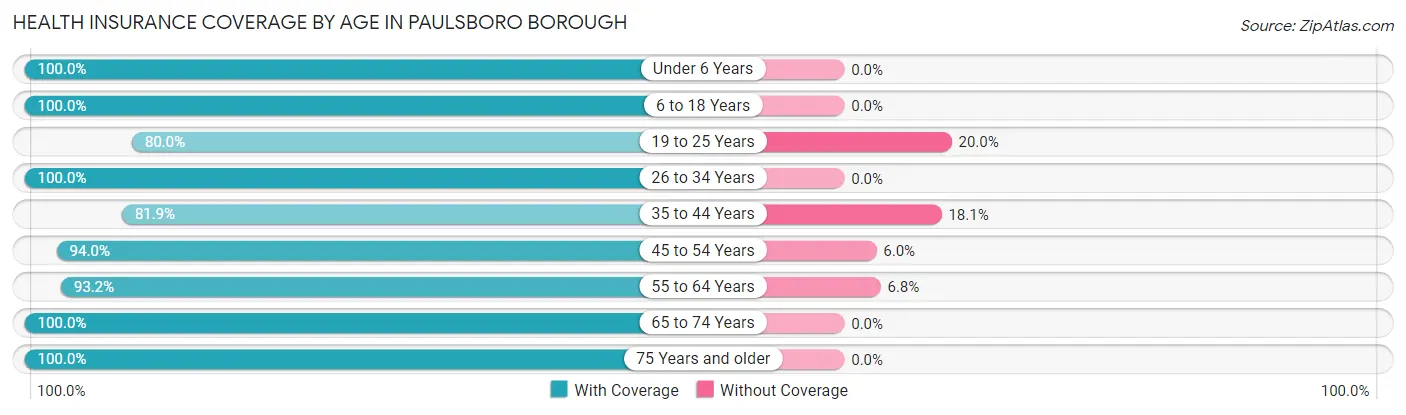
| Age Bracket | With Coverage | Without Coverage |
| Under 6 Years | 509 (100.0%) | 0 (0.0%) |
| 6 to 18 Years | 933 (100.0%) | 0 (0.0%) |
| 19 to 25 Years | 292 (80.0%) | 73 (20.0%) |
| 26 to 34 Years | 1,106 (100.0%) | 0 (0.0%) |
| 35 to 44 Years | 592 (81.9%) | 131 (18.1%) |
| 45 to 54 Years | 693 (94.0%) | 44 (6.0%) |
| 55 to 64 Years | 842 (93.2%) | 61 (6.8%) |
| 65 to 74 Years | 369 (100.0%) | 0 (0.0%) |
| 75 Years and older | 550 (100.0%) | 0 (0.0%) |
| Total | 5,886 (95.0%) | 309 (5.0%) |
Health Insurance Coverage by Citizenship Status in Paulsboro borough

| Citizenship Status | With Coverage | Without Coverage |
| Native Born | 509 (100.0%) | 0 (0.0%) |
| Foreign Born, Citizen | 933 (100.0%) | 0 (0.0%) |
| Foreign Born, not a Citizen | 292 (80.0%) | 73 (20.0%) |
Health Insurance Coverage by Household Income in Paulsboro borough
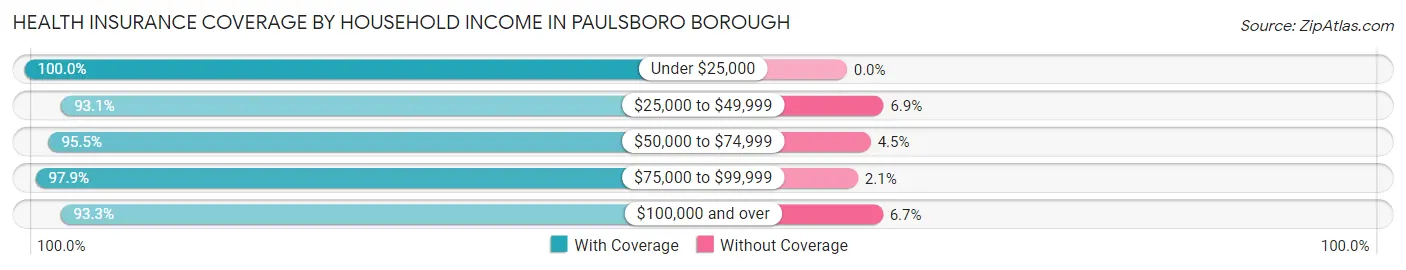
| Household Income | With Coverage | Without Coverage |
| Under $25,000 | 547 (100.0%) | 0 (0.0%) |
| $25,000 to $49,999 | 1,465 (93.1%) | 108 (6.9%) |
| $50,000 to $74,999 | 1,087 (95.5%) | 51 (4.5%) |
| $75,000 to $99,999 | 987 (97.9%) | 21 (2.1%) |
| $100,000 and over | 1,787 (93.3%) | 129 (6.7%) |
Public vs Private Health Insurance Coverage by Age in Paulsboro borough
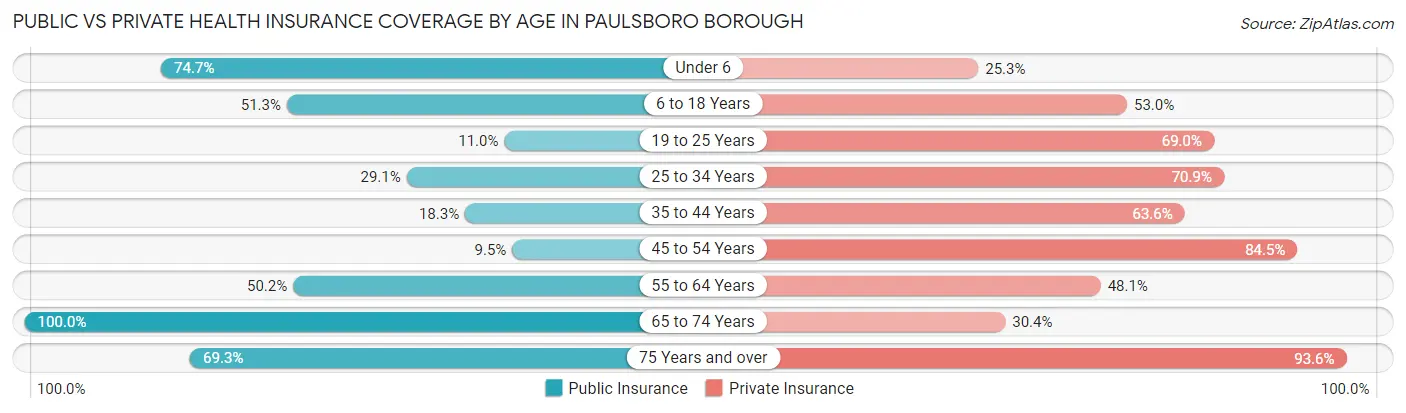
| Age Bracket | Public Insurance | Private Insurance |
| Under 6 | 380 (74.7%) | 129 (25.3%) |
| 6 to 18 Years | 479 (51.3%) | 494 (52.9%) |
| 19 to 25 Years | 40 (11.0%) | 252 (69.0%) |
| 25 to 34 Years | 322 (29.1%) | 784 (70.9%) |
| 35 to 44 Years | 132 (18.3%) | 460 (63.6%) |
| 45 to 54 Years | 70 (9.5%) | 623 (84.5%) |
| 55 to 64 Years | 453 (50.2%) | 434 (48.1%) |
| 65 to 74 Years | 369 (100.0%) | 112 (30.3%) |
| 75 Years and over | 381 (69.3%) | 515 (93.6%) |
| Total | 2,626 (42.4%) | 3,803 (61.4%) |
Disability Status by Sex by Age in Paulsboro borough
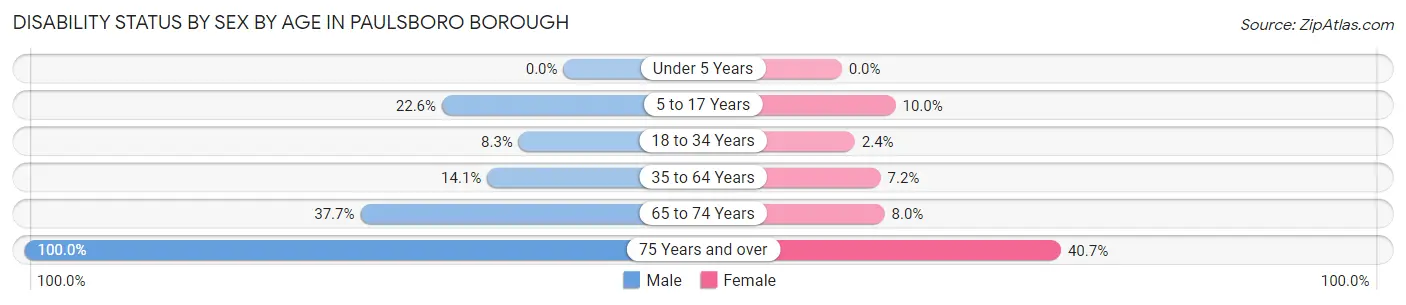
| Age Bracket | Male | Female |
| Under 5 Years | 0 (0.0%) | 0 (0.0%) |
| 5 to 17 Years | 106 (22.6%) | 34 (10.0%) |
| 18 to 34 Years | 65 (8.3%) | 20 (2.4%) |
| 35 to 64 Years | 185 (14.1%) | 76 (7.2%) |
| 65 to 74 Years | 49 (37.7%) | 19 (8.0%) |
| 75 Years and over | 19 (100.0%) | 216 (40.7%) |
Disability Class by Sex by Age in Paulsboro borough
Disability Class: Hearing Difficulty
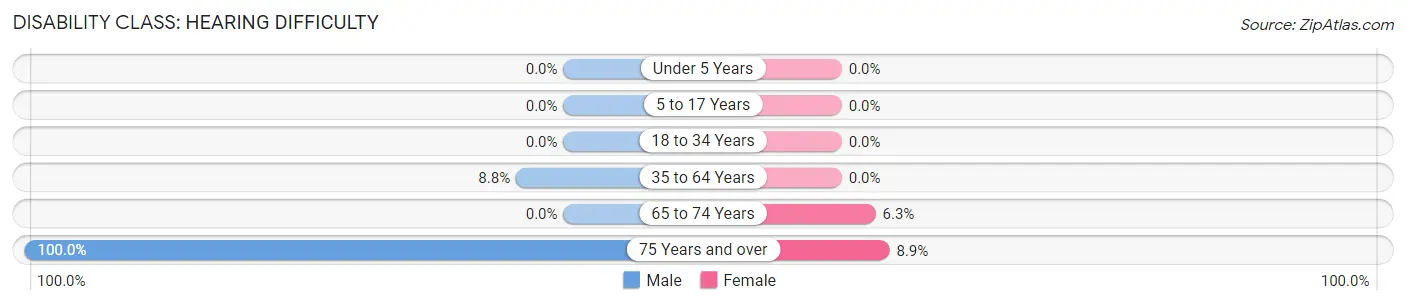
| Age Bracket | Male | Female |
| Under 5 Years | 0 (0.0%) | 0 (0.0%) |
| 5 to 17 Years | 0 (0.0%) | 0 (0.0%) |
| 18 to 34 Years | 0 (0.0%) | 0 (0.0%) |
| 35 to 64 Years | 115 (8.8%) | 0 (0.0%) |
| 65 to 74 Years | 0 (0.0%) | 15 (6.3%) |
| 75 Years and over | 19 (100.0%) | 47 (8.8%) |
Disability Class: Vision Difficulty
| Age Bracket | Male | Female |
| Under 5 Years | 0 (0.0%) | 0 (0.0%) |
| 5 to 17 Years | 0 (0.0%) | 0 (0.0%) |
| 18 to 34 Years | 0 (0.0%) | 0 (0.0%) |
| 35 to 64 Years | 0 (0.0%) | 0 (0.0%) |
| 65 to 74 Years | 0 (0.0%) | 0 (0.0%) |
| 75 Years and over | 0 (0.0%) | 0 (0.0%) |
Disability Class: Cognitive Difficulty
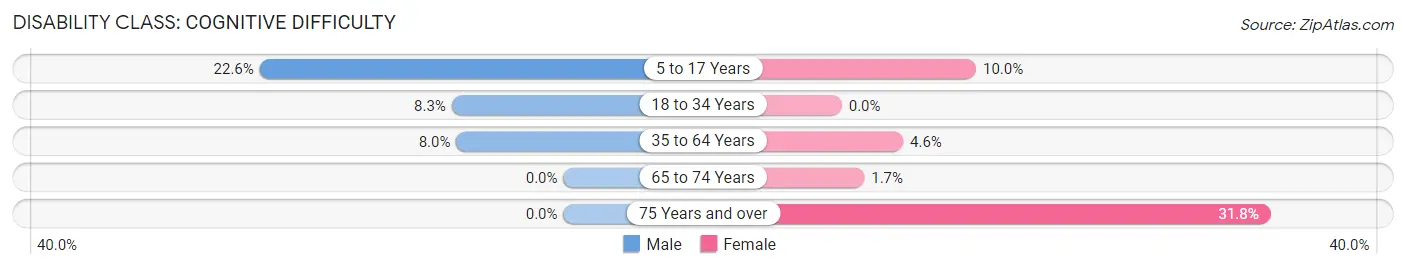
| Age Bracket | Male | Female |
| 5 to 17 Years | 106 (22.6%) | 34 (10.0%) |
| 18 to 34 Years | 65 (8.3%) | 0 (0.0%) |
| 35 to 64 Years | 104 (8.0%) | 48 (4.5%) |
| 65 to 74 Years | 0 (0.0%) | 4 (1.7%) |
| 75 Years and over | 0 (0.0%) | 169 (31.8%) |
Disability Class: Ambulatory Difficulty
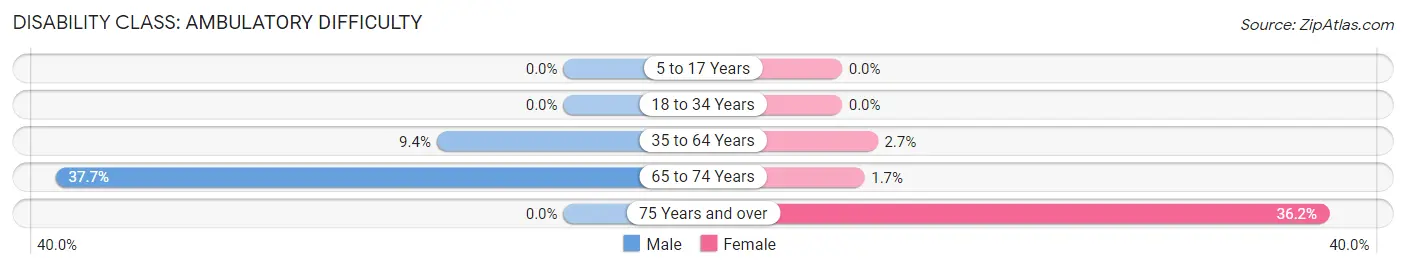
| Age Bracket | Male | Female |
| 5 to 17 Years | 0 (0.0%) | 0 (0.0%) |
| 18 to 34 Years | 0 (0.0%) | 0 (0.0%) |
| 35 to 64 Years | 123 (9.4%) | 28 (2.6%) |
| 65 to 74 Years | 49 (37.7%) | 4 (1.7%) |
| 75 Years and over | 0 (0.0%) | 192 (36.2%) |
Disability Class: Self-Care Difficulty
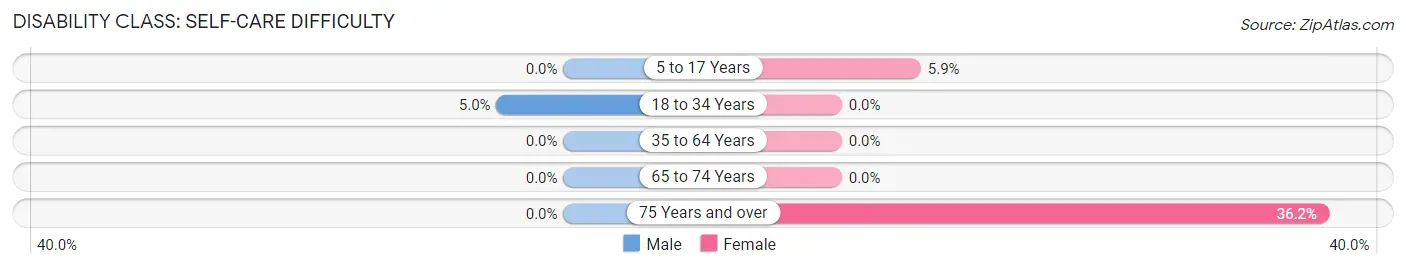
| Age Bracket | Male | Female |
| 5 to 17 Years | 0 (0.0%) | 20 (5.9%) |
| 18 to 34 Years | 39 (5.0%) | 0 (0.0%) |
| 35 to 64 Years | 0 (0.0%) | 0 (0.0%) |
| 65 to 74 Years | 0 (0.0%) | 0 (0.0%) |
| 75 Years and over | 0 (0.0%) | 192 (36.2%) |
Technology Access in Paulsboro borough
Computing Device Access in Paulsboro borough
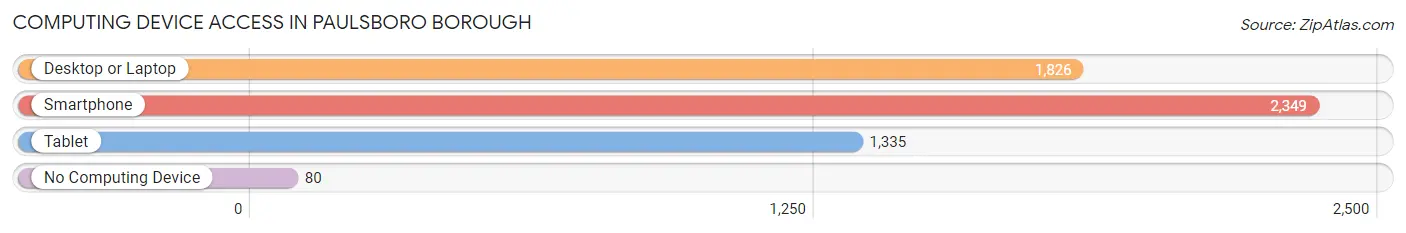
| Device Type | # Households | % Households |
| Desktop or Laptop | 1,826 | 74.0% |
| Smartphone | 2,349 | 95.2% |
| Tablet | 1,335 | 54.1% |
| No Computing Device | 80 | 3.2% |
| Total | 2,467 | 100.0% |
Internet Access in Paulsboro borough
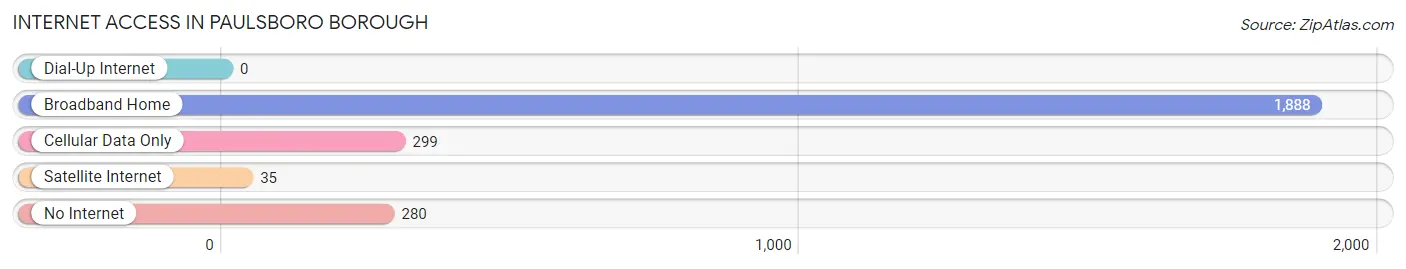
| Internet Type | # Households | % Households |
| Dial-Up Internet | 0 | 0.0% |
| Broadband Home | 1,888 | 76.5% |
| Cellular Data Only | 299 | 12.1% |
| Satellite Internet | 35 | 1.4% |
| No Internet | 280 | 11.4% |
| Total | 2,467 | 100.0% |
Paulsboro borough Summary
Paulsboro Borough is a small borough located in Gloucester County, New Jersey. It is situated on the Delaware River, just south of Philadelphia. The borough was incorporated in 1876 and is home to approximately 6,000 people.
Geography
Paulsboro Borough is located in the southwestern corner of Gloucester County, New Jersey. It is situated on the Delaware River, just south of Philadelphia. The borough is bordered by Greenwich Township to the north, West Deptford Township to the east, and Logan Township to the south. The borough is approximately 2.5 square miles in size and is home to approximately 6,000 people.
The borough is located in the Delaware Valley, which is a region of the United States that is known for its rich history and culture. The Delaware River is a major source of transportation and commerce for the region. The borough is also located near the New Jersey Turnpike, which provides easy access to Philadelphia and other major cities in the region.
History
Paulsboro Borough was originally part of Greenwich Township, which was established in 1695. The area was first settled by Dutch and Swedish immigrants in the late 1600s. The borough was officially incorporated in 1876 and was named after Paulsboro, England.
The borough was an important port for the shipping of coal and other goods in the late 1800s and early 1900s. The borough was also home to several large industries, including a glass factory, a shipbuilding company, and a chemical plant.
The borough experienced a period of decline in the mid-1900s, as many of the industries that had been the backbone of the local economy closed or moved away. In recent years, the borough has experienced a resurgence, as new businesses have moved into the area and the local economy has diversified.
Economy
Paulsboro Borough is home to a diverse economy. The borough is home to several large industries, including a glass factory, a shipbuilding company, and a chemical plant. The borough is also home to several small businesses, including restaurants, retail stores, and professional services.
The borough is also home to several large employers, including the Paulsboro Refinery, which is the largest employer in the borough. The refinery is owned by PBF Energy and is one of the largest refineries in the United States. The refinery processes crude oil into gasoline, diesel, and other products.
The borough is also home to several educational institutions, including the Paulsboro High School, the Paulsboro Middle School, and the Paulsboro Elementary School. The borough is also home to several parks and recreational facilities, including the Paulsboro Riverfront Park.
Demographics
As of the 2010 census, the population of Paulsboro Borough was 6,097. The population is predominantly white (83.3%), with African Americans (10.2%), Hispanics (3.7%), and Asians (2.2%) making up the remainder of the population. The median household income in the borough is $50,945, and the median age is 39.
The borough is home to a diverse religious community, with the majority of residents identifying as Christian (64.3%). Other religious affiliations include Judaism (2.2%), Islam (1.2%), and Buddhism (0.3%).
Conclusion
Paulsboro Borough is a small borough located in Gloucester County, New Jersey. It is situated on the Delaware River, just south of Philadelphia. The borough was incorporated in 1876 and is home to approximately 6,000 people. The borough is home to a diverse economy, with several large industries, small businesses, and educational institutions. The population of the borough is predominantly white, with African Americans, Hispanics, and Asians making up the remainder of the population. The borough is home to a diverse religious community, with the majority of residents identifying as Christian.
Common Questions
What is Per Capita Income in Paulsboro borough?
Per Capita income in Paulsboro borough is $36,377.
What is the Median Family Income in Paulsboro borough?
Median Family Income in Paulsboro borough is $59,558.
What is the Median Household income in Paulsboro borough?
Median Household Income in Paulsboro borough is $58,271.
What is Income or Wage Gap in Paulsboro borough?
Income or Wage Gap in Paulsboro borough is 27.1%.
Women in Paulsboro borough earn 72.9 cents for every dollar earned by a man.
What is Inequality or Gini Index in Paulsboro borough?
Inequality or Gini Index in Paulsboro borough is 0.49.
What is the Total Population of Paulsboro borough?
Total Population of Paulsboro borough is 6,195.
What is the Total Male Population of Paulsboro borough?
Total Male Population of Paulsboro borough is 2,925.
What is the Total Female Population of Paulsboro borough?
Total Female Population of Paulsboro borough is 3,270.
What is the Ratio of Males per 100 Females in Paulsboro borough?
There are 89.45 Males per 100 Females in Paulsboro borough.
What is the Ratio of Females per 100 Males in Paulsboro borough?
There are 111.79 Females per 100 Males in Paulsboro borough.
What is the Median Population Age in Paulsboro borough?
Median Population Age in Paulsboro borough is 38.1 Years.
What is the Average Family Size in Paulsboro borough
Average Family Size in Paulsboro borough is 3.0 People.
What is the Average Household Size in Paulsboro borough
Average Household Size in Paulsboro borough is 2.5 People.
How Large is the Labor Force in Paulsboro borough?
There are 3,155 People in the Labor Forcein in Paulsboro borough.
What is the Percentage of People in the Labor Force in Paulsboro borough?
62.3% of People are in the Labor Force in Paulsboro borough.
What is the Unemployment Rate in Paulsboro borough?
Unemployment Rate in Paulsboro borough is 13.4%.