Shiloh borough, NJ Map & Demographics
Shiloh borough Overview
$36,910
PER CAPITA INCOME
$99,375
AVG FAMILY INCOME
$87,917
AVG HOUSEHOLD INCOME
2.5%
WAGE / INCOME GAP [ % ]
97.5¢/ $1
WAGE / INCOME GAP [ $ ]
0.31
INEQUALITY / GINI INDEX
305
TOTAL POPULATION
117
MALE POPULATION
188
FEMALE POPULATION
62.23
MALES / 100 FEMALES
160.68
FEMALES / 100 MALES
47.9
MEDIAN AGE
3.2
AVG FAMILY SIZE
2.6
AVG HOUSEHOLD SIZE
160
LABOR FORCE [ PEOPLE ]
64.3%
PERCENT IN LABOR FORCE
9.4%
UNEMPLOYMENT RATE
Income in Shiloh borough
Income Overview in Shiloh borough
Per Capita Income in Shiloh borough is $36,910, while median incomes of families and households are $99,375 and $87,917 respectively.
| Characteristic | Number | Measure |
| Per Capita Income | 305 | $36,910 |
| Median Family Income | 75 | $99,375 |
| Mean Family Income | 75 | $102,325 |
| Median Household Income | 115 | $87,917 |
| Mean Household Income | 115 | $92,706 |
| Income Deficit | 75 | $0 |
| Wage / Income Gap (%) | 305 | 2.47% |
| Wage / Income Gap ($) | 305 | 97.53¢ per $1 |
| Gini / Inequality Index | 305 | 0.31 |
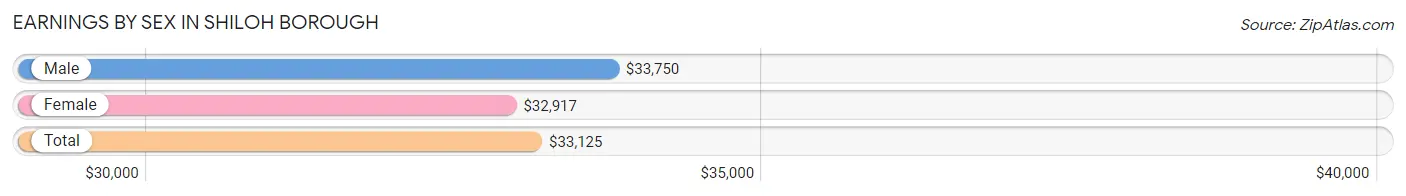
Earnings by Sex in Shiloh borough
Average Earnings in Shiloh borough are $33,125, $33,750 for men and $32,917 for women, a difference of 2.5%.
| Sex | Number | Average Earnings |
| Male | 74 (45.7%) | $33,750 |
| Female | 88 (54.3%) | $32,917 |
| Total | 162 (100.0%) | $33,125 |
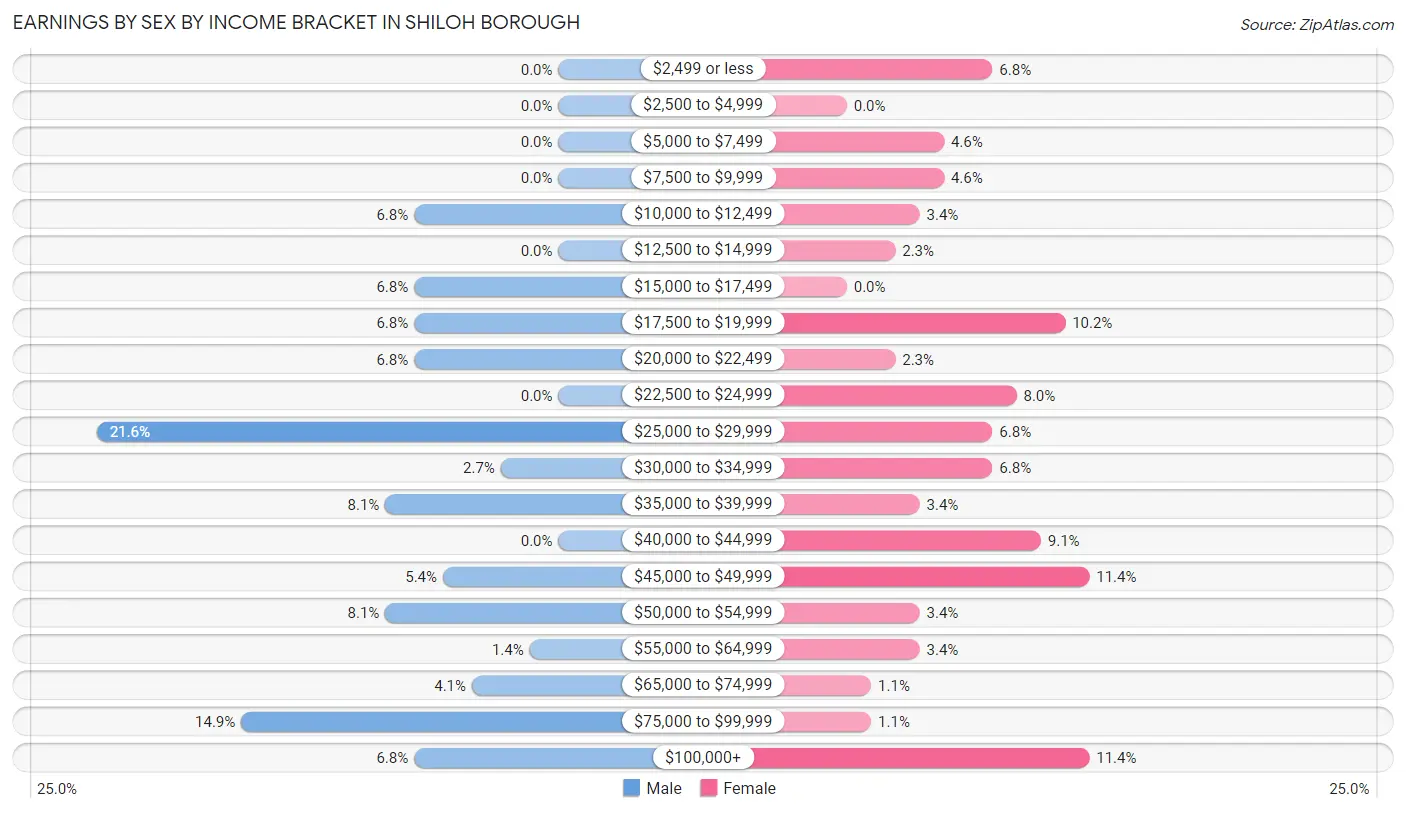
Earnings by Sex by Income Bracket in Shiloh borough
The most common earnings brackets in Shiloh borough are $25,000 to $29,999 for men (16 | 21.6%) and $45,000 to $49,999 for women (10 | 11.4%).
| Income | Male | Female |
| $2,499 or less | 0 (0.0%) | 6 (6.8%) |
| $2,500 to $4,999 | 0 (0.0%) | 0 (0.0%) |
| $5,000 to $7,499 | 0 (0.0%) | 4 (4.5%) |
| $7,500 to $9,999 | 0 (0.0%) | 4 (4.5%) |
| $10,000 to $12,499 | 5 (6.8%) | 3 (3.4%) |
| $12,500 to $14,999 | 0 (0.0%) | 2 (2.3%) |
| $15,000 to $17,499 | 5 (6.8%) | 0 (0.0%) |
| $17,500 to $19,999 | 5 (6.8%) | 9 (10.2%) |
| $20,000 to $22,499 | 5 (6.8%) | 2 (2.3%) |
| $22,500 to $24,999 | 0 (0.0%) | 7 (8.0%) |
| $25,000 to $29,999 | 16 (21.6%) | 6 (6.8%) |
| $30,000 to $34,999 | 2 (2.7%) | 6 (6.8%) |
| $35,000 to $39,999 | 6 (8.1%) | 3 (3.4%) |
| $40,000 to $44,999 | 0 (0.0%) | 8 (9.1%) |
| $45,000 to $49,999 | 4 (5.4%) | 10 (11.4%) |
| $50,000 to $54,999 | 6 (8.1%) | 3 (3.4%) |
| $55,000 to $64,999 | 1 (1.3%) | 3 (3.4%) |
| $65,000 to $74,999 | 3 (4.1%) | 1 (1.1%) |
| $75,000 to $99,999 | 11 (14.9%) | 1 (1.1%) |
| $100,000+ | 5 (6.8%) | 10 (11.4%) |
| Total | 74 (100.0%) | 88 (100.0%) |
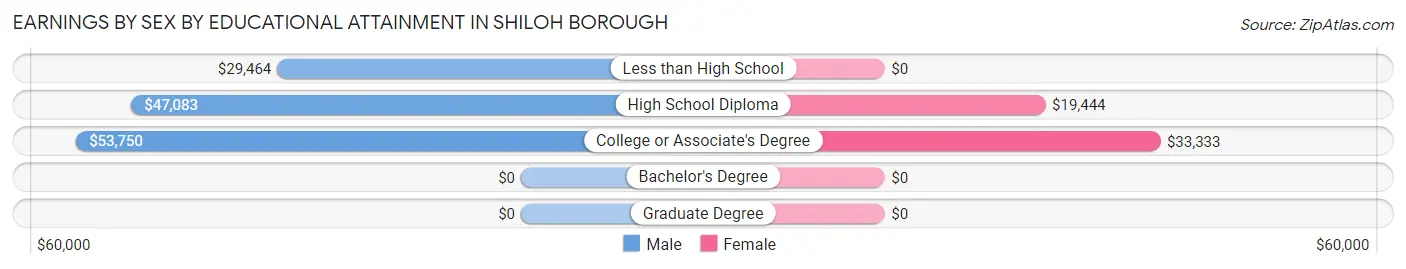
Earnings by Sex by Educational Attainment in Shiloh borough
Average earnings in Shiloh borough are $37,500 for men and $33,542 for women, a difference of 10.5%. Men with an educational attainment of college or associate's degree enjoy the highest average annual earnings of $53,750, while those with less than high school education earn the least with $29,464. Women with an educational attainment of college or associate's degree earn the most with the average annual earnings of $33,333, while those with high school diploma education have the smallest earnings of $19,444.
| Educational Attainment | Male Income | Female Income |
| Less than High School | $29,464 | $0 |
| High School Diploma | $47,083 | $19,444 |
| College or Associate's Degree | $53,750 | $33,333 |
| Bachelor's Degree | - | - |
| Graduate Degree | - | - |
| Total | $37,500 | $33,542 |
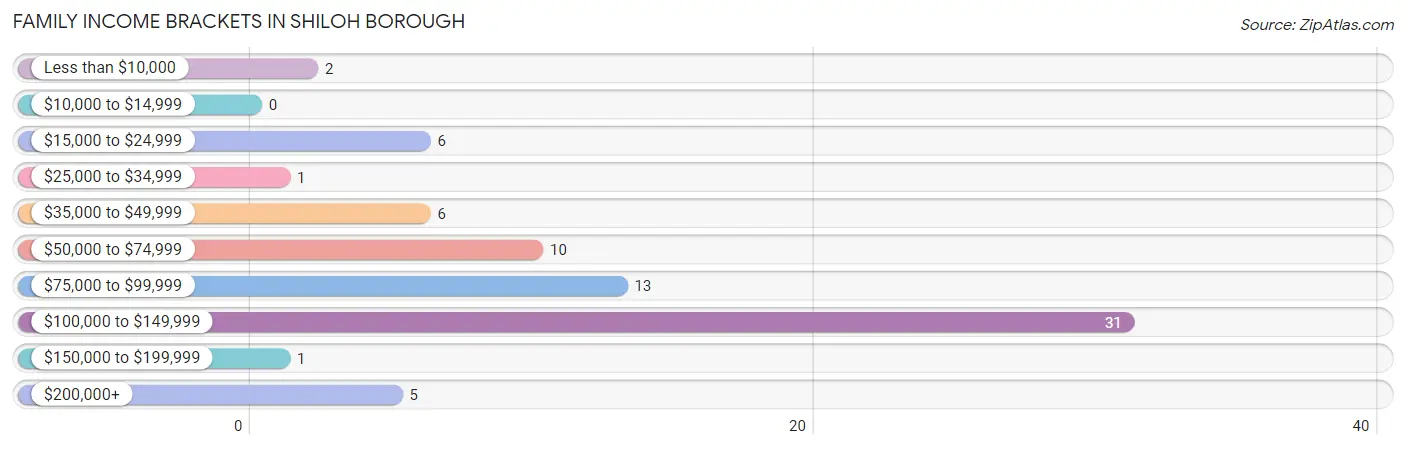
Family Income in Shiloh borough
Family Income Brackets in Shiloh borough
According to the Shiloh borough family income data, there are 31 families falling into the $100,000 to $149,999 income range, which is the most common income bracket and makes up 41.3% of all families.
| Income Bracket | # Families | % Families |
| Less than $10,000 | 2 | 2.7% |
| $10,000 to $14,999 | 0 | 0.0% |
| $15,000 to $24,999 | 6 | 8.0% |
| $25,000 to $34,999 | 1 | 1.3% |
| $35,000 to $49,999 | 6 | 8.0% |
| $50,000 to $74,999 | 10 | 13.3% |
| $75,000 to $99,999 | 13 | 17.3% |
| $100,000 to $149,999 | 31 | 41.3% |
| $150,000 to $199,999 | 1 | 1.3% |
| $200,000+ | 5 | 6.7% |
Family Income by Famaliy Size in Shiloh borough
2-person families (38 | 50.7%) account for the highest median family income in Shiloh borough with $88,750 per family, while 2-person families (38 | 50.7%) have the highest median income of $44,375 per family member.
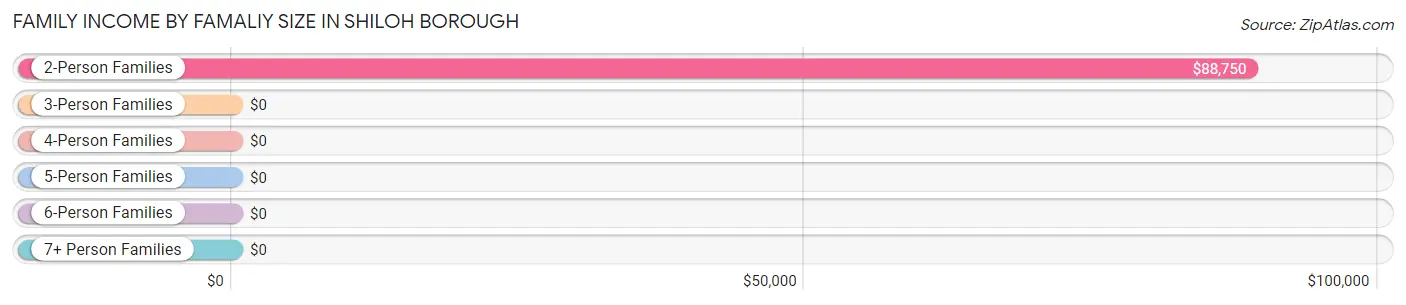
| Income Bracket | # Families | Median Income |
| 2-Person Families | 38 (50.7%) | $88,750 |
| 3-Person Families | 20 (26.7%) | $0 |
| 4-Person Families | 9 (12.0%) | $0 |
| 5-Person Families | 3 (4.0%) | $0 |
| 6-Person Families | 1 (1.3%) | $0 |
| 7+ Person Families | 4 (5.3%) | $0 |
| Total | 75 (100.0%) | $99,375 |
Family Income by Number of Earners in Shiloh borough
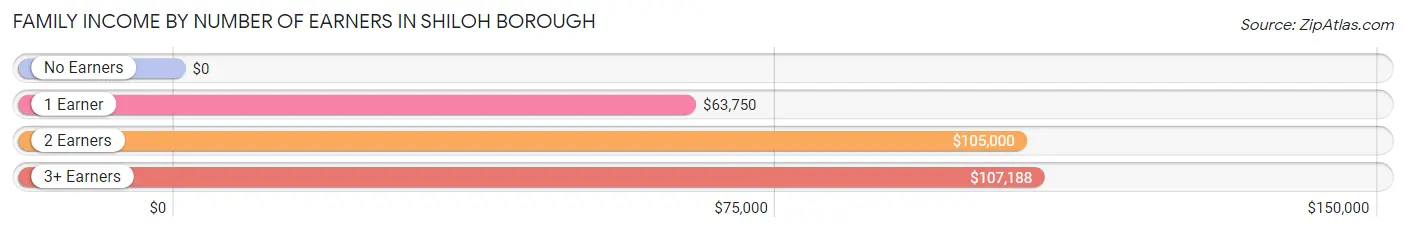
| Number of Earners | # Families | Median Income |
| No Earners | 8 (10.7%) | $0 |
| 1 Earner | 30 (40.0%) | $63,750 |
| 2 Earners | 24 (32.0%) | $105,000 |
| 3+ Earners | 13 (17.3%) | $107,188 |
| Total | 75 (100.0%) | $99,375 |
Household Income in Shiloh borough
Household Income Brackets in Shiloh borough
With 29 households falling in the category, the $50,000 to $74,999 income range is the most frequent in Shiloh borough, accounting for 25.2% of all households.
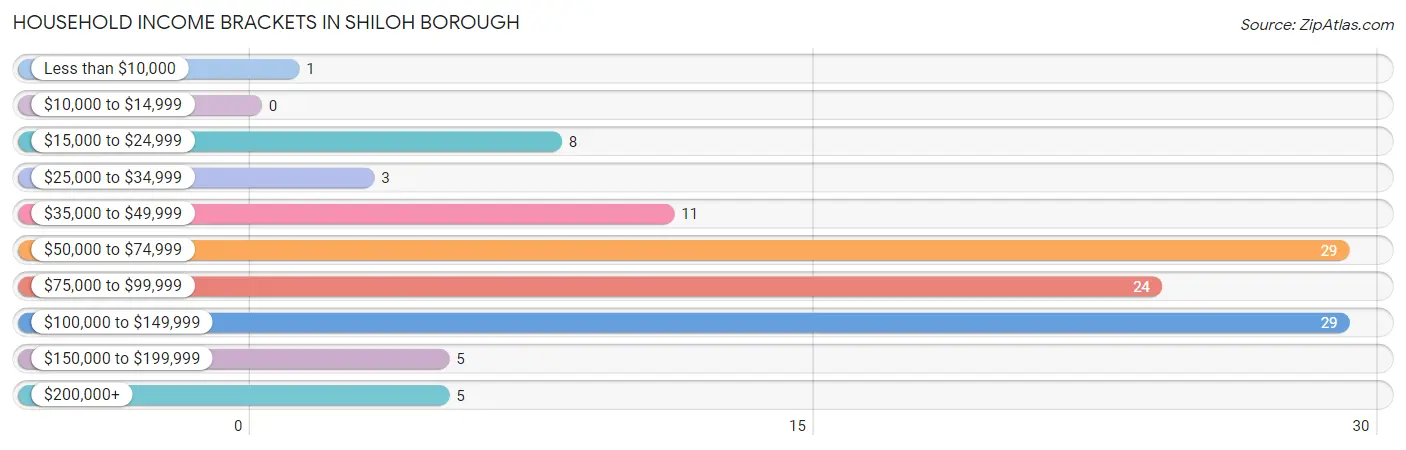
| Income Bracket | # Households | % Households |
| Less than $10,000 | 1 | 0.9% |
| $10,000 to $14,999 | 0 | 0.0% |
| $15,000 to $24,999 | 8 | 7.0% |
| $25,000 to $34,999 | 3 | 2.6% |
| $35,000 to $49,999 | 11 | 9.6% |
| $50,000 to $74,999 | 29 | 25.2% |
| $75,000 to $99,999 | 24 | 20.9% |
| $100,000 to $149,999 | 29 | 25.2% |
| $150,000 to $199,999 | 5 | 4.3% |
| $200,000+ | 5 | 4.3% |
Household Income by Householder Age in Shiloh borough
The median household income in Shiloh borough is $87,917, with the highest median household income of $98,750 found in the 45 to 64 years age bracket for the primary householder. A total of 54 households (47.0%) fall into this category.
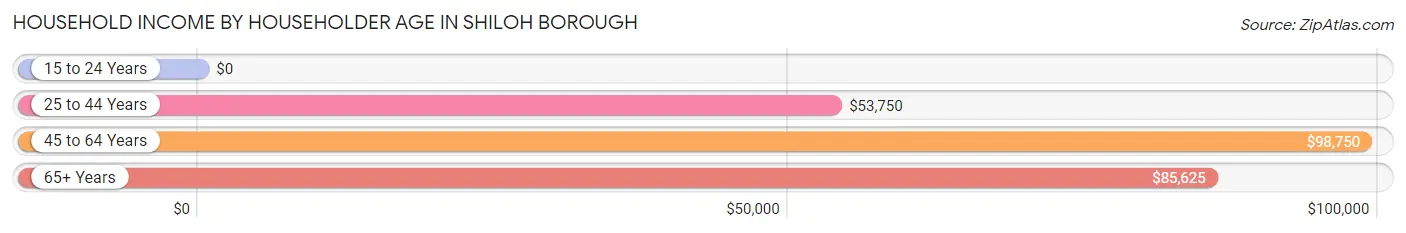
| Income Bracket | # Households | Median Income |
| 15 to 24 Years | 0 (0.0%) | $0 |
| 25 to 44 Years | 20 (17.4%) | $53,750 |
| 45 to 64 Years | 54 (47.0%) | $98,750 |
| 65+ Years | 41 (35.6%) | $85,625 |
| Total | 115 (100.0%) | $87,917 |
Poverty in Shiloh borough
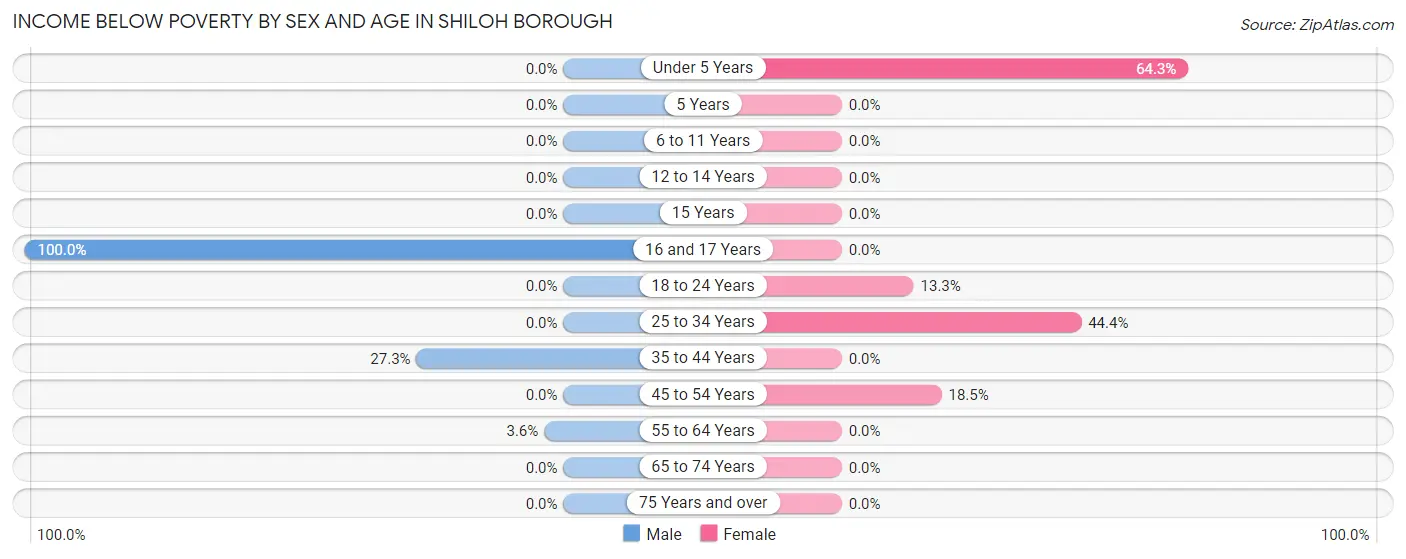
Income Below Poverty by Sex and Age in Shiloh borough
With 5.1% poverty level for males and 12.8% for females among the residents of Shiloh borough, 16 and 17 year old males and under 5 year old females are the most vulnerable to poverty, with 2 males (100.0%) and 9 females (64.3%) in their respective age groups living below the poverty level.
| Age Bracket | Male | Female |
| Under 5 Years | 0 (0.0%) | 9 (64.3%) |
| 5 Years | 0 (0.0%) | 0 (0.0%) |
| 6 to 11 Years | 0 (0.0%) | 0 (0.0%) |
| 12 to 14 Years | 0 (0.0%) | 0 (0.0%) |
| 15 Years | 0 (0.0%) | 0 (0.0%) |
| 16 and 17 Years | 2 (100.0%) | 0 (0.0%) |
| 18 to 24 Years | 0 (0.0%) | 2 (13.3%) |
| 25 to 34 Years | 0 (0.0%) | 8 (44.4%) |
| 35 to 44 Years | 3 (27.3%) | 0 (0.0%) |
| 45 to 54 Years | 0 (0.0%) | 5 (18.5%) |
| 55 to 64 Years | 1 (3.6%) | 0 (0.0%) |
| 65 to 74 Years | 0 (0.0%) | 0 (0.0%) |
| 75 Years and over | 0 (0.0%) | 0 (0.0%) |
| Total | 6 (5.1%) | 24 (12.8%) |
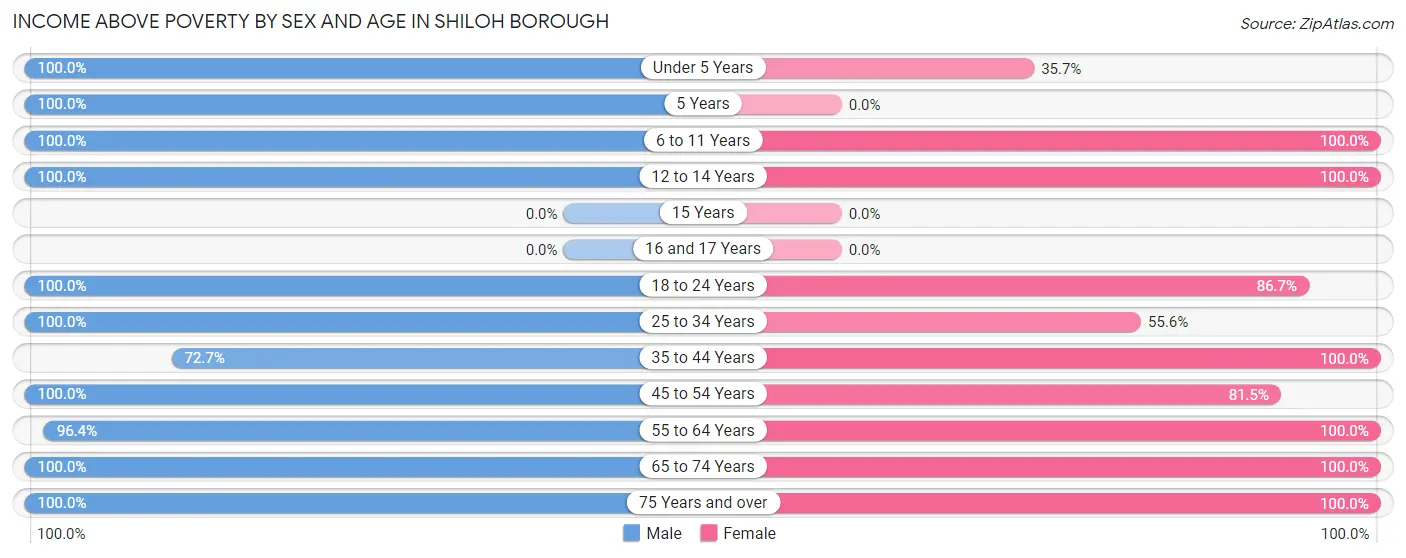
Income Above Poverty by Sex and Age in Shiloh borough
According to the poverty statistics in Shiloh borough, males aged under 5 years and females aged 6 to 11 years are the age groups that are most secure financially, with 100.0% of males and 100.0% of females in these age groups living above the poverty line.
| Age Bracket | Male | Female |
| Under 5 Years | 3 (100.0%) | 5 (35.7%) |
| 5 Years | 6 (100.0%) | 0 (0.0%) |
| 6 to 11 Years | 6 (100.0%) | 10 (100.0%) |
| 12 to 14 Years | 6 (100.0%) | 11 (100.0%) |
| 15 Years | 0 (0.0%) | 0 (0.0%) |
| 16 and 17 Years | 0 (0.0%) | 0 (0.0%) |
| 18 to 24 Years | 10 (100.0%) | 13 (86.7%) |
| 25 to 34 Years | 16 (100.0%) | 10 (55.6%) |
| 35 to 44 Years | 8 (72.7%) | 14 (100.0%) |
| 45 to 54 Years | 17 (100.0%) | 22 (81.5%) |
| 55 to 64 Years | 27 (96.4%) | 34 (100.0%) |
| 65 to 74 Years | 10 (100.0%) | 25 (100.0%) |
| 75 Years and over | 2 (100.0%) | 20 (100.0%) |
| Total | 111 (94.9%) | 164 (87.2%) |
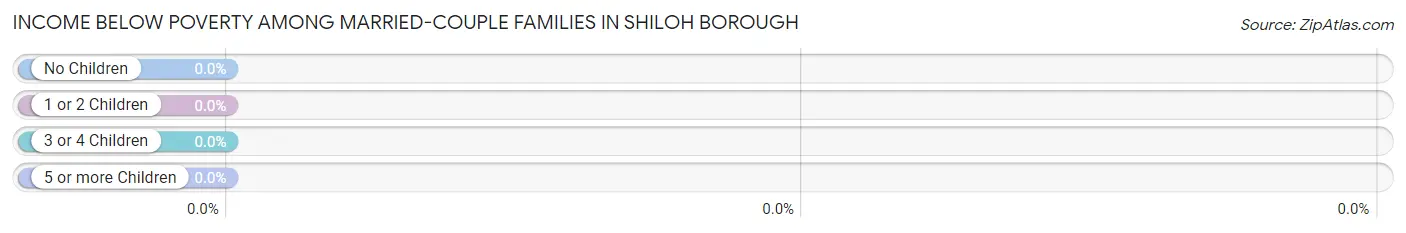
Income Below Poverty Among Married-Couple Families in Shiloh borough
| Children | Above Poverty | Below Poverty |
| No Children | 34 (100.0%) | 0 (0.0%) |
| 1 or 2 Children | 6 (100.0%) | 0 (0.0%) |
| 3 or 4 Children | 4 (100.0%) | 0 (0.0%) |
| 5 or more Children | 0 (0.0%) | 0 (0.0%) |
| Total | 44 (100.0%) | 0 (0.0%) |
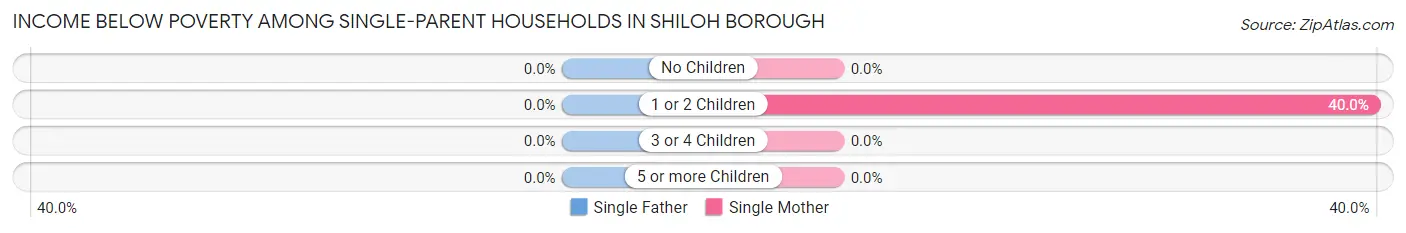
Income Below Poverty Among Single-Parent Households in Shiloh borough
| Children | Single Father | Single Mother |
| No Children | 0 (0.0%) | 0 (0.0%) |
| 1 or 2 Children | 0 (0.0%) | 8 (40.0%) |
| 3 or 4 Children | 0 (0.0%) | 0 (0.0%) |
| 5 or more Children | 0 (0.0%) | 0 (0.0%) |
| Total | 0 (0.0%) | 8 (29.6%) |
Income Below Poverty Among Married-Couple vs Single-Parent Households in Shiloh borough
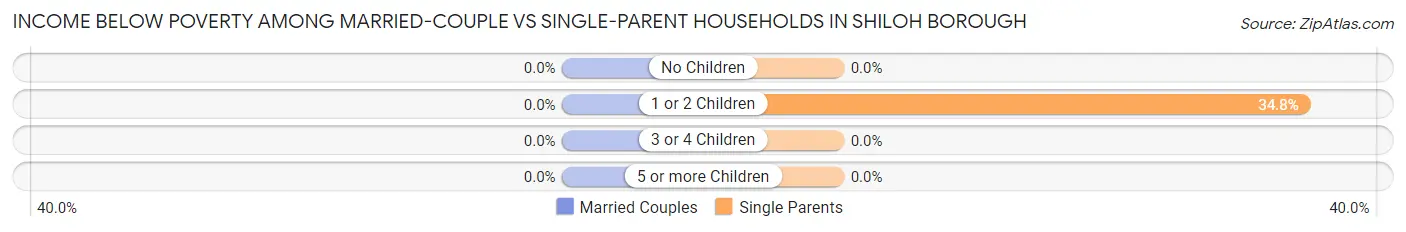
| Children | Married-Couple Families | Single-Parent Households |
| No Children | 0 (0.0%) | 0 (0.0%) |
| 1 or 2 Children | 0 (0.0%) | 8 (34.8%) |
| 3 or 4 Children | 0 (0.0%) | 0 (0.0%) |
| 5 or more Children | 0 (0.0%) | 0 (0.0%) |
| Total | 0 (0.0%) | 8 (25.8%) |
Race in Shiloh borough
The most populous races in Shiloh borough are White / Caucasian (240 | 78.7%), Asian (36 | 11.8%), and Hispanic or Latino (27 | 8.8%).
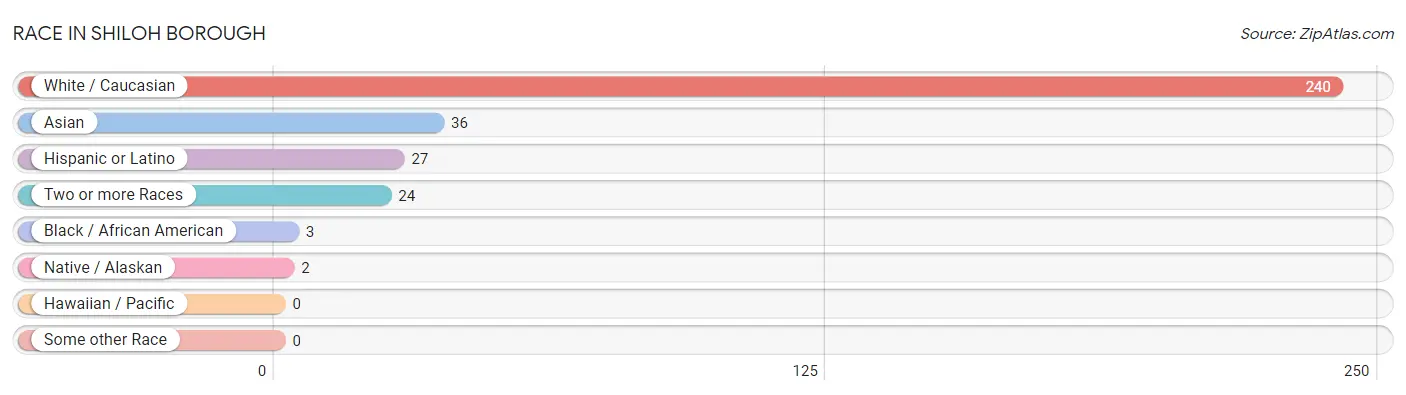
| Race | # Population | % Population |
| Asian | 36 | 11.8% |
| Black / African American | 3 | 1.0% |
| Hawaiian / Pacific | 0 | 0.0% |
| Hispanic or Latino | 27 | 8.8% |
| Native / Alaskan | 2 | 0.7% |
| White / Caucasian | 240 | 78.7% |
| Two or more Races | 24 | 7.9% |
| Some other Race | 0 | 0.0% |
| Total | 305 | 100.0% |
Ancestry in Shiloh borough
The most populous ancestries reported in Shiloh borough are English (67 | 22.0%), German (55 | 18.0%), Irish (50 | 16.4%), Italian (47 | 15.4%), and Mexican (25 | 8.2%), together accounting for 80.0% of all Shiloh borough residents.
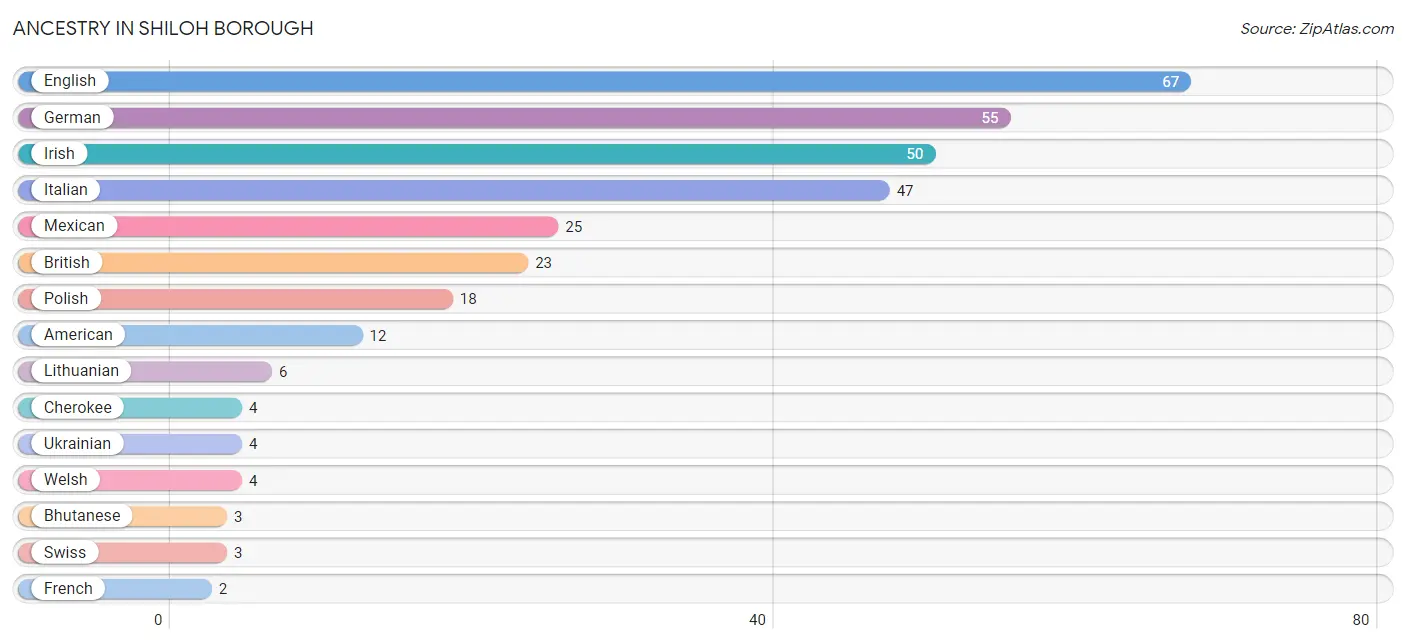
| Ancestry | # Population | % Population |
| American | 12 | 3.9% |
| Bhutanese | 3 | 1.0% |
| British | 23 | 7.5% |
| Cherokee | 4 | 1.3% |
| English | 67 | 22.0% |
| French | 2 | 0.7% |
| German | 55 | 18.0% |
| Irish | 50 | 16.4% |
| Italian | 47 | 15.4% |
| Lithuanian | 6 | 2.0% |
| Mexican | 25 | 8.2% |
| Polish | 18 | 5.9% |
| Puerto Rican | 2 | 0.7% |
| Swiss | 3 | 1.0% |
| Ukrainian | 4 | 1.3% |
| Welsh | 4 | 1.3% | View All 16 Rows |
Immigrants in Shiloh borough
The most numerous immigrant groups reported in Shiloh borough came from Central America (25 | 8.2%), Latin America (25 | 8.2%), and Mexico (25 | 8.2%), together accounting for 24.6% of all Shiloh borough residents.
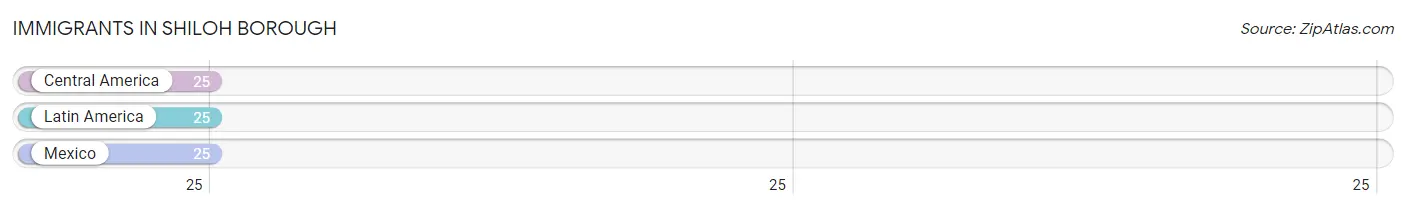
| Immigration Origin | # Population | % Population |
| Central America | 25 | 8.2% |
| Latin America | 25 | 8.2% |
| Mexico | 25 | 8.2% | View All 3 Rows |
Sex and Age in Shiloh borough
Sex and Age in Shiloh borough
The most populous age groups in Shiloh borough are 55 to 59 Years (18 | 15.4%) for men and 55 to 59 Years (25 | 13.3%) for women.
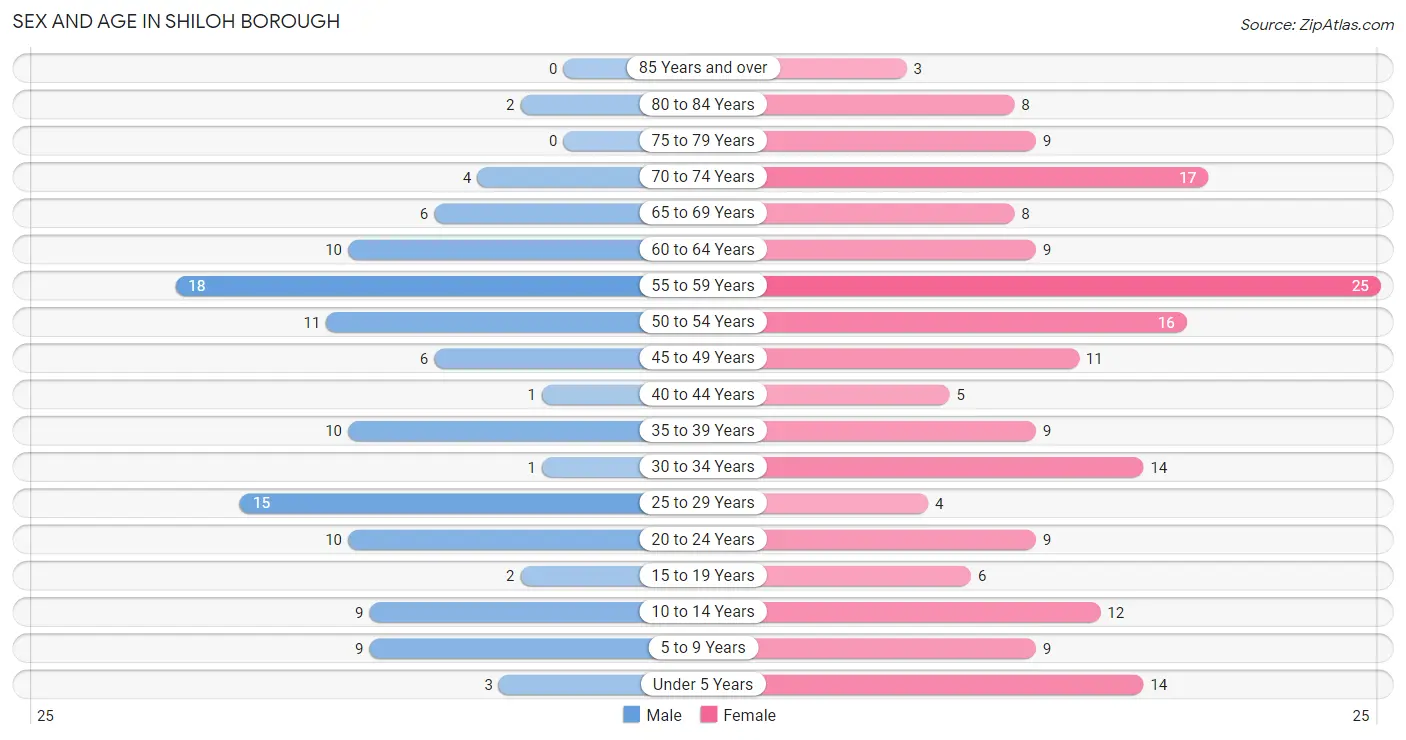
| Age Bracket | Male | Female |
| Under 5 Years | 3 (2.6%) | 14 (7.4%) |
| 5 to 9 Years | 9 (7.7%) | 9 (4.8%) |
| 10 to 14 Years | 9 (7.7%) | 12 (6.4%) |
| 15 to 19 Years | 2 (1.7%) | 6 (3.2%) |
| 20 to 24 Years | 10 (8.6%) | 9 (4.8%) |
| 25 to 29 Years | 15 (12.8%) | 4 (2.1%) |
| 30 to 34 Years | 1 (0.9%) | 14 (7.4%) |
| 35 to 39 Years | 10 (8.6%) | 9 (4.8%) |
| 40 to 44 Years | 1 (0.9%) | 5 (2.7%) |
| 45 to 49 Years | 6 (5.1%) | 11 (5.9%) |
| 50 to 54 Years | 11 (9.4%) | 16 (8.5%) |
| 55 to 59 Years | 18 (15.4%) | 25 (13.3%) |
| 60 to 64 Years | 10 (8.6%) | 9 (4.8%) |
| 65 to 69 Years | 6 (5.1%) | 8 (4.3%) |
| 70 to 74 Years | 4 (3.4%) | 17 (9.0%) |
| 75 to 79 Years | 0 (0.0%) | 9 (4.8%) |
| 80 to 84 Years | 2 (1.7%) | 8 (4.3%) |
| 85 Years and over | 0 (0.0%) | 3 (1.6%) |
| Total | 117 (100.0%) | 188 (100.0%) |
Families and Households in Shiloh borough
Median Family Size in Shiloh borough
The median family size in Shiloh borough is 3.21 persons per family, with married-couple families (44 | 58.7%) accounting for the largest median family size of 3.57 persons per family. On the other hand, single male/father families (4 | 5.3%) represent the smallest median family size with 1.75 persons per family.
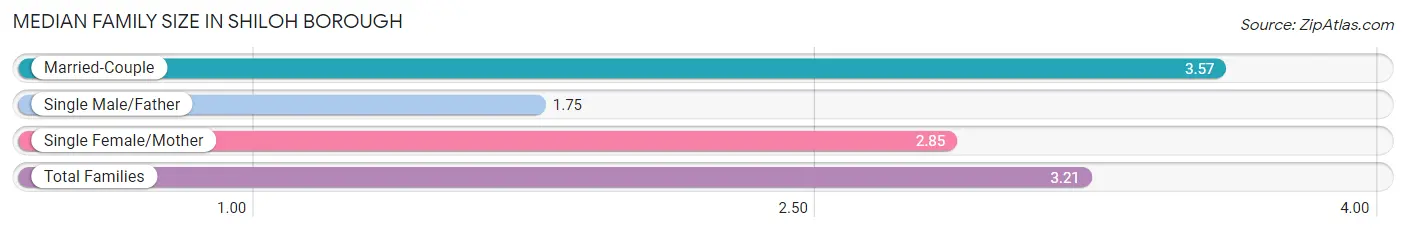
| Family Type | # Families | Family Size |
| Married-Couple | 44 (58.7%) | 3.57 |
| Single Male/Father | 4 (5.3%) | 1.75 |
| Single Female/Mother | 27 (36.0%) | 2.85 |
| Total Families | 75 (100.0%) | 3.21 |
Median Household Size in Shiloh borough
The median household size in Shiloh borough is 2.65 persons per household, with married-couple households (44 | 38.3%) accounting for the largest median household size of 3.73 persons per household. non-family households (40 | 34.8%) represent the smallest median household size with 1.20 persons per household.
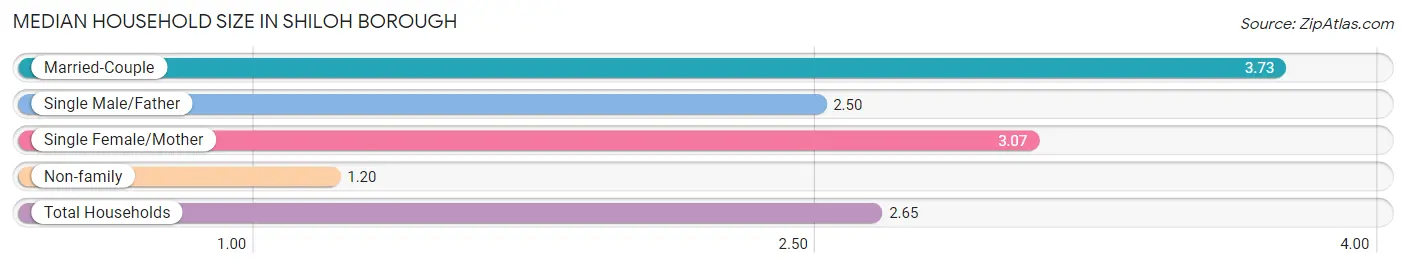
| Household Type | # Households | Household Size |
| Married-Couple | 44 (38.3%) | 3.73 |
| Single Male/Father | 4 (3.5%) | 2.50 |
| Single Female/Mother | 27 (23.5%) | 3.07 |
| Non-family | 40 (34.8%) | 1.20 |
| Total Households | 115 (100.0%) | 2.65 |
Household Size by Marriage Status in Shiloh borough
Out of a total of 115 households in Shiloh borough, 75 (65.2%) are family households, while 40 (34.8%) are nonfamily households. The most numerous type of family households are 2-person households, comprising 30, and the most common type of nonfamily households are 1-person households, comprising 32.
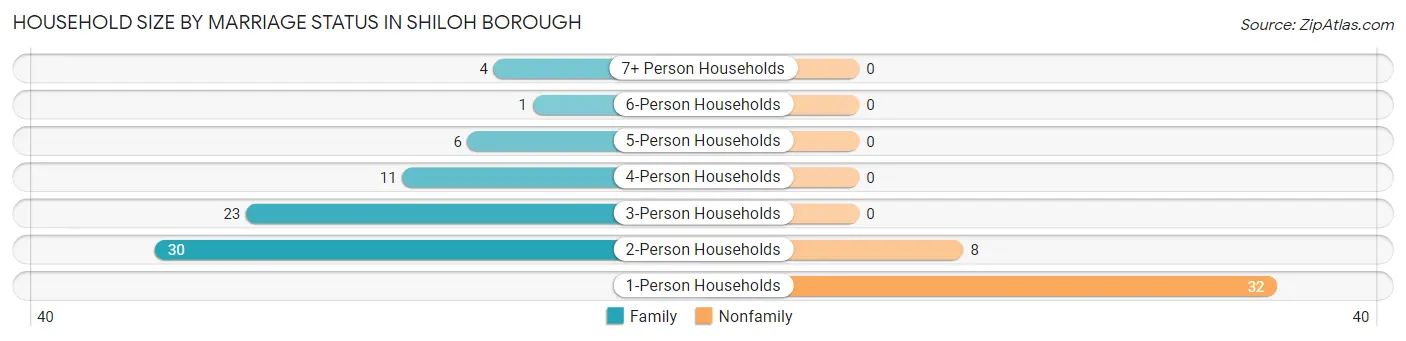
| Household Size | Family Households | Nonfamily Households |
| 1-Person Households | - | 32 (27.8%) |
| 2-Person Households | 30 (26.1%) | 8 (7.0%) |
| 3-Person Households | 23 (20.0%) | 0 (0.0%) |
| 4-Person Households | 11 (9.6%) | 0 (0.0%) |
| 5-Person Households | 6 (5.2%) | 0 (0.0%) |
| 6-Person Households | 1 (0.9%) | 0 (0.0%) |
| 7+ Person Households | 4 (3.5%) | 0 (0.0%) |
| Total | 75 (65.2%) | 40 (34.8%) |
Female Fertility in Shiloh borough
Fertility by Age in Shiloh borough
Average fertility rate in Shiloh borough is 47.0 births per 1,000 women. Women in the age bracket of 20 to 34 years have the highest fertility rate with 111.0 births per 1,000 women. Women in the age bracket of 20 to 34 years acount for 100.0% of all women with births.
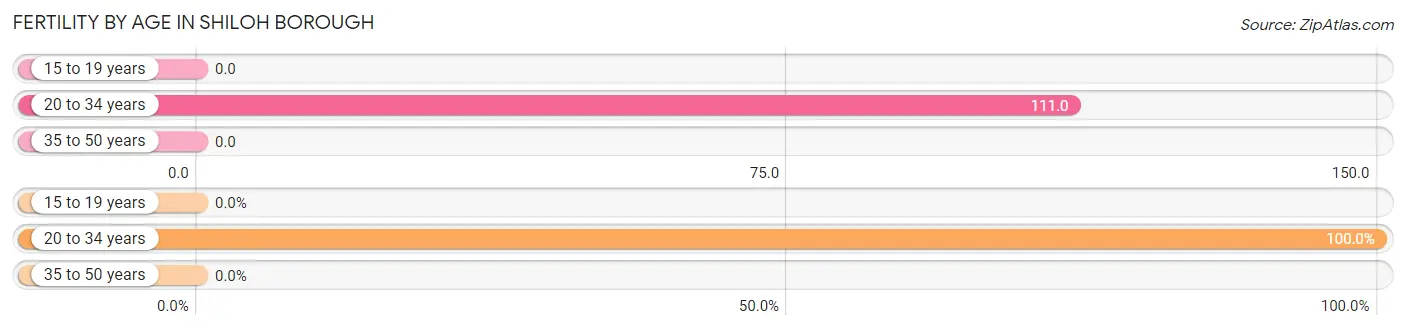
| Age Bracket | Women with Births | Births / 1,000 Women |
| 15 to 19 years | 0 (0.0%) | 0.0 |
| 20 to 34 years | 3 (100.0%) | 111.0 |
| 35 to 50 years | 0 (0.0%) | 0.0 |
| Total | 3 (100.0%) | 47.0 |
Fertility by Age by Marriage Status in Shiloh borough
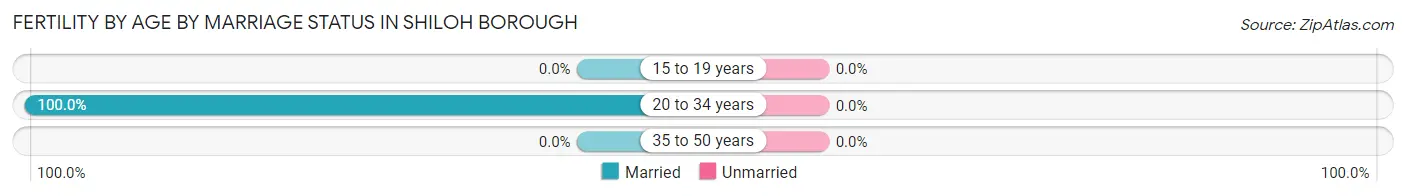
| Age Bracket | Married | Unmarried |
| 15 to 19 years | 0 (0.0%) | 0 (0.0%) |
| 20 to 34 years | 3 (100.0%) | 0 (0.0%) |
| 35 to 50 years | 0 (0.0%) | 0 (0.0%) |
| Total | 3 (100.0%) | 0 (0.0%) |
Fertility by Education in Shiloh borough
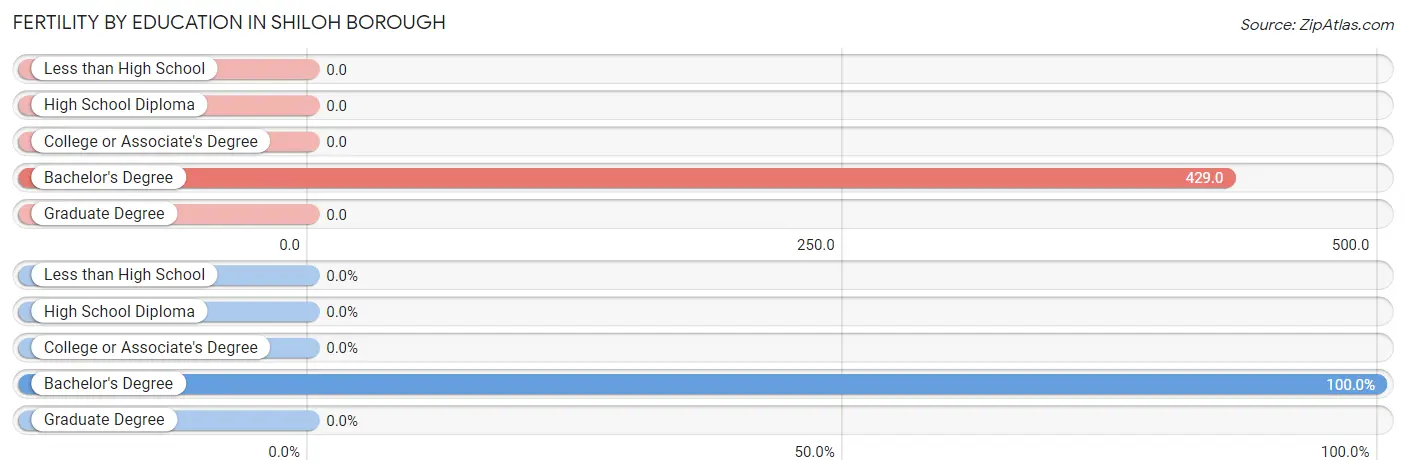
| Educational Attainment | Women with Births | Births / 1,000 Women |
| Less than High School | 0 (0.0%) | 0.0 |
| High School Diploma | 0 (0.0%) | 0.0 |
| College or Associate's Degree | 0 (0.0%) | 0.0 |
| Bachelor's Degree | 3 (100.0%) | 429.0 |
| Graduate Degree | 0 (0.0%) | 0.0 |
| Total | 3 (100.0%) | 47.0 |
Fertility by Education by Marriage Status in Shiloh borough
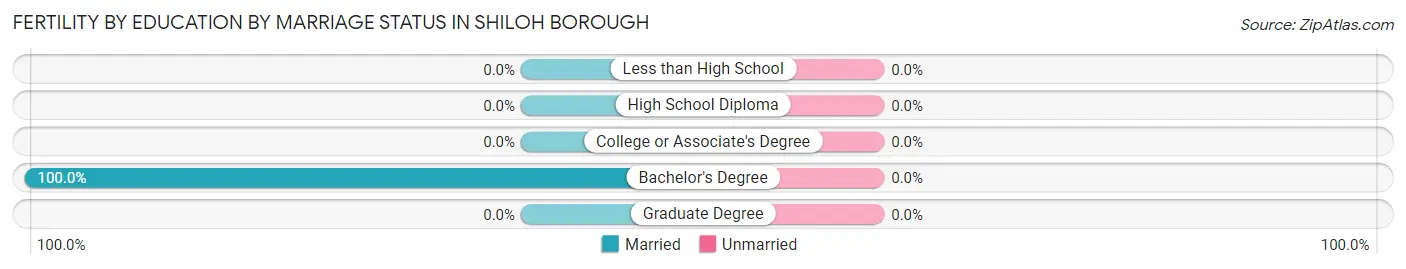
| Educational Attainment | Married | Unmarried |
| Less than High School | 0 (0.0%) | 0 (0.0%) |
| High School Diploma | 0 (0.0%) | 0 (0.0%) |
| College or Associate's Degree | 0 (0.0%) | 0 (0.0%) |
| Bachelor's Degree | 3 (100.0%) | 0 (0.0%) |
| Graduate Degree | 0 (0.0%) | 0 (0.0%) |
| Total | 3 (100.0%) | 0 (0.0%) |
Employment Characteristics in Shiloh borough
Employment by Class of Employer in Shiloh borough
Among the 141 employed individuals in Shiloh borough, private company employees (102 | 72.3%), local government employees (20 | 14.2%), and self-employed (not incorporated) (9 | 6.4%) make up the most common classes of employment.
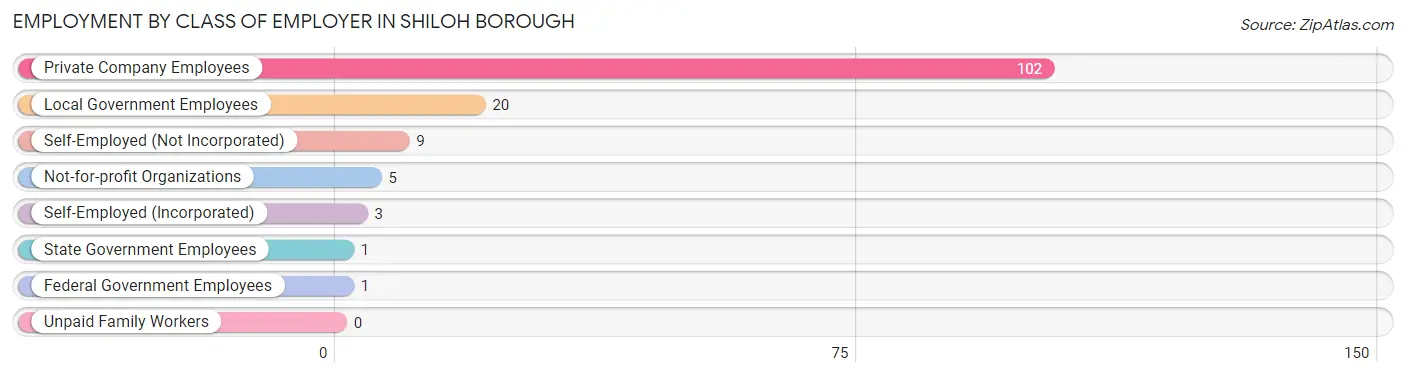
| Employer Class | # Employees | % Employees |
| Private Company Employees | 102 | 72.3% |
| Self-Employed (Incorporated) | 3 | 2.1% |
| Self-Employed (Not Incorporated) | 9 | 6.4% |
| Not-for-profit Organizations | 5 | 3.5% |
| Local Government Employees | 20 | 14.2% |
| State Government Employees | 1 | 0.7% |
| Federal Government Employees | 1 | 0.7% |
| Unpaid Family Workers | 0 | 0.0% |
| Total | 141 | 100.0% |
Employment Status by Age in Shiloh borough
According to the labor force statistics for Shiloh borough, out of the total population over 16 years of age (249), 64.3% or 160 individuals are in the labor force, with 9.4% or 15 of them unemployed. The age group with the highest labor force participation rate is 35 to 44 years, with 92.0% or 23 individuals in the labor force. Within the labor force, the 55 to 59 years age range has the highest percentage of unemployed individuals, with 17.1% or 6 of them being unemployed.
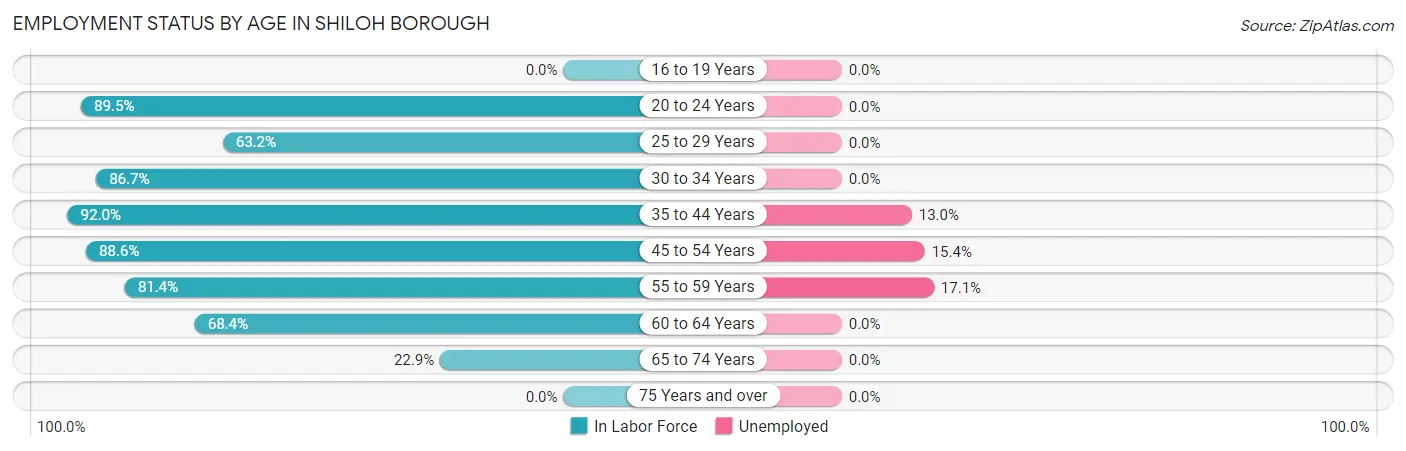
| Age Bracket | In Labor Force | Unemployed |
| 16 to 19 Years | 0 (0.0%) | 0 (0.0%) |
| 20 to 24 Years | 17 (89.5%) | 0 (0.0%) |
| 25 to 29 Years | 12 (63.2%) | 0 (0.0%) |
| 30 to 34 Years | 13 (86.7%) | 0 (0.0%) |
| 35 to 44 Years | 23 (92.0%) | 3 (13.0%) |
| 45 to 54 Years | 39 (88.6%) | 6 (15.4%) |
| 55 to 59 Years | 35 (81.4%) | 6 (17.1%) |
| 60 to 64 Years | 13 (68.4%) | 0 (0.0%) |
| 65 to 74 Years | 8 (22.9%) | 0 (0.0%) |
| 75 Years and over | 0 (0.0%) | 0 (0.0%) |
| Total | 160 (64.3%) | 15 (9.4%) |
Employment Status by Educational Attainment in Shiloh borough
According to labor force statistics for Shiloh borough, 81.8% of individuals (135) out of the total population between 25 and 64 years of age (165) are in the labor force, with 11.1% or 15 of them being unemployed. The group with the highest labor force participation rate are those with the educational attainment of less than high school, with 90.0% or 27 individuals in the labor force. Within the labor force, individuals with less than high school education have the highest percentage of unemployment, with 29.6% or 8 of them being unemployed.
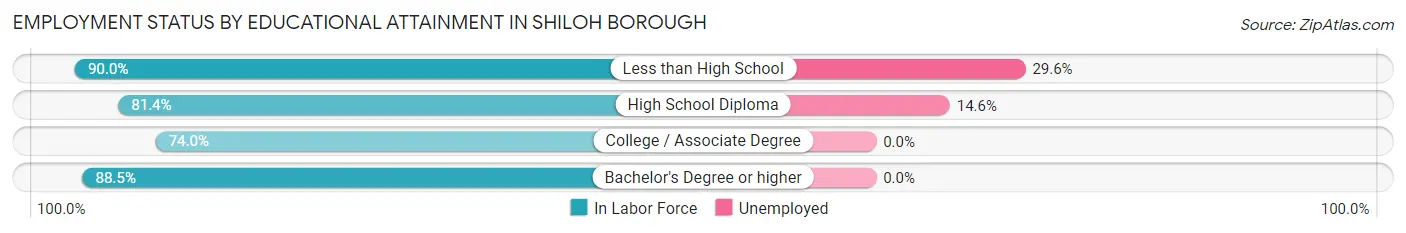
| Educational Attainment | In Labor Force | Unemployed |
| Less than High School | 27 (90.0%) | 9 (29.6%) |
| High School Diploma | 48 (81.4%) | 9 (14.6%) |
| College / Associate Degree | 37 (74.0%) | 0 (0.0%) |
| Bachelor's Degree or higher | 23 (88.5%) | 0 (0.0%) |
| Total | 135 (81.8%) | 18 (11.1%) |
Employment Occupations by Sex in Shiloh borough
Management, Business, Science and Arts Occupations
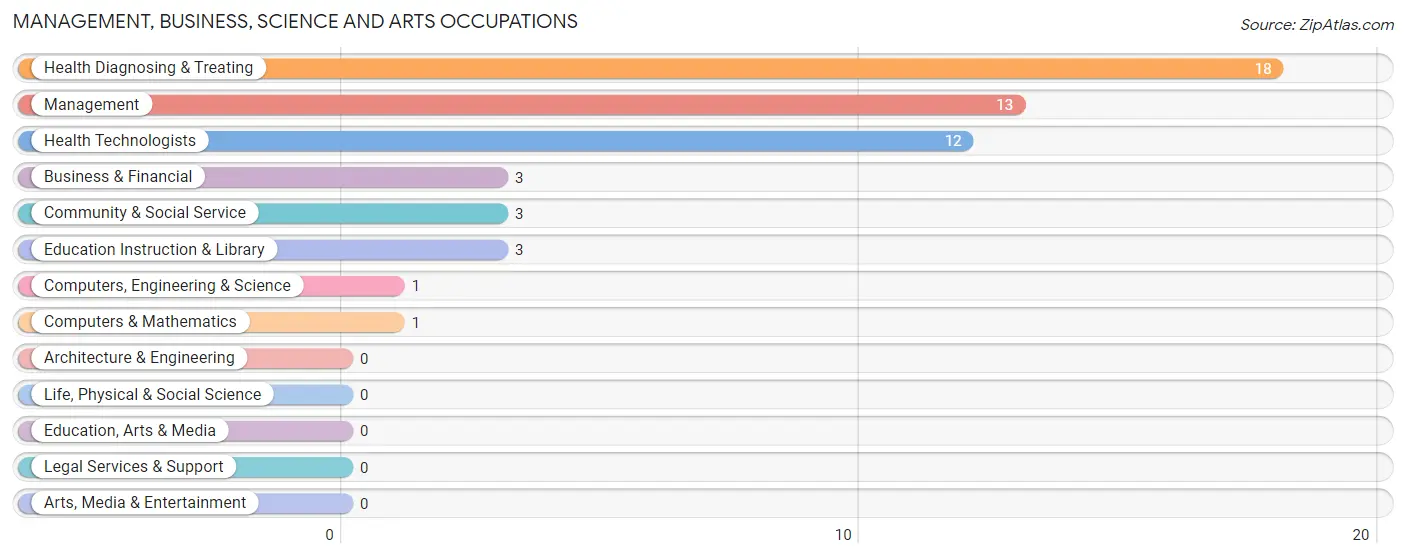
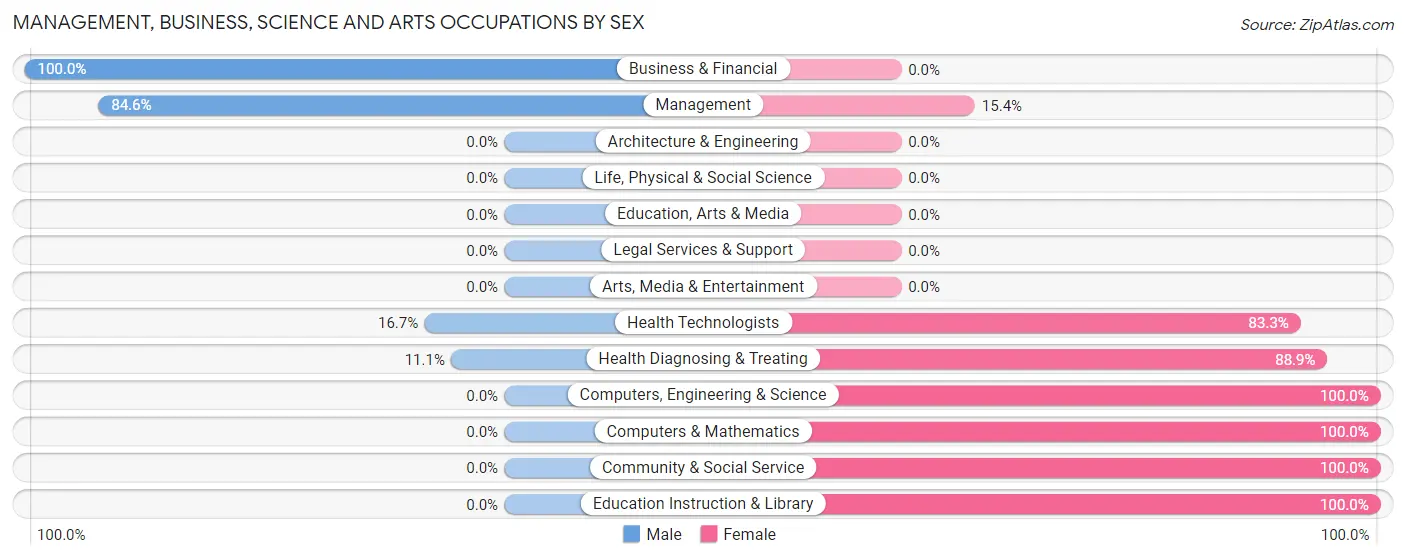
The most common Management, Business, Science and Arts occupations in Shiloh borough are Health Diagnosing & Treating (18 | 12.4%), Management (13 | 9.0%), Health Technologists (12 | 8.3%), Business & Financial (3 | 2.1%), and Community & Social Service (3 | 2.1%).
Management, Business, Science and Arts Occupations by Sex
Within the Management, Business, Science and Arts occupations in Shiloh borough, the most male-oriented occupations are Business & Financial (100.0%), Management (84.6%), and Health Technologists (16.7%), while the most female-oriented occupations are Computers, Engineering & Science (100.0%), Computers & Mathematics (100.0%), and Community & Social Service (100.0%).
| Occupation | Male | Female |
| Management | 11 (84.6%) | 2 (15.4%) |
| Business & Financial | 3 (100.0%) | 0 (0.0%) |
| Computers, Engineering & Science | 0 (0.0%) | 1 (100.0%) |
| Computers & Mathematics | 0 (0.0%) | 1 (100.0%) |
| Architecture & Engineering | 0 (0.0%) | 0 (0.0%) |
| Life, Physical & Social Science | 0 (0.0%) | 0 (0.0%) |
| Community & Social Service | 0 (0.0%) | 3 (100.0%) |
| Education, Arts & Media | 0 (0.0%) | 0 (0.0%) |
| Legal Services & Support | 0 (0.0%) | 0 (0.0%) |
| Education Instruction & Library | 0 (0.0%) | 3 (100.0%) |
| Arts, Media & Entertainment | 0 (0.0%) | 0 (0.0%) |
| Health Diagnosing & Treating | 2 (11.1%) | 16 (88.9%) |
| Health Technologists | 2 (16.7%) | 10 (83.3%) |
| Total (Category) | 16 (42.1%) | 22 (57.9%) |
| Total (Overall) | 69 (47.6%) | 76 (52.4%) |
Services Occupations
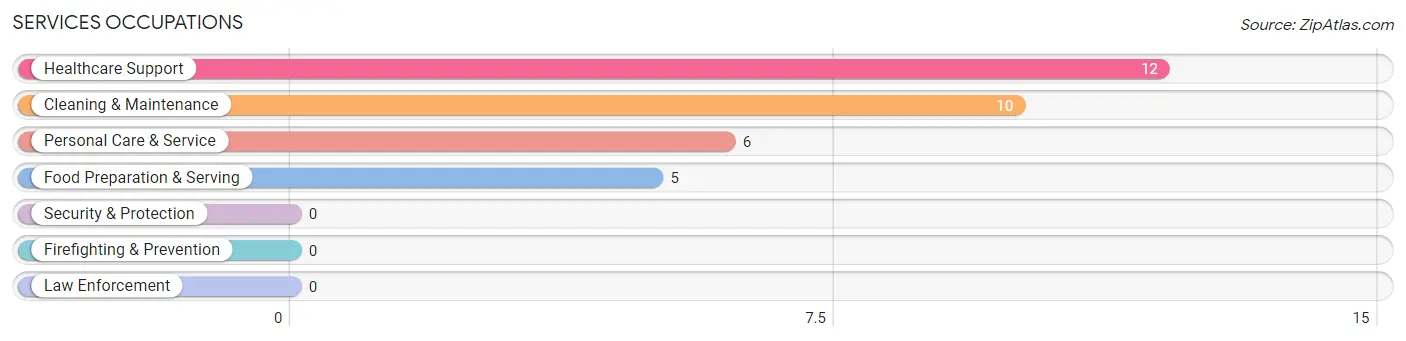
The most common Services occupations in Shiloh borough are Healthcare Support (12 | 8.3%), Cleaning & Maintenance (10 | 6.9%), Personal Care & Service (6 | 4.1%), and Food Preparation & Serving (5 | 3.5%).
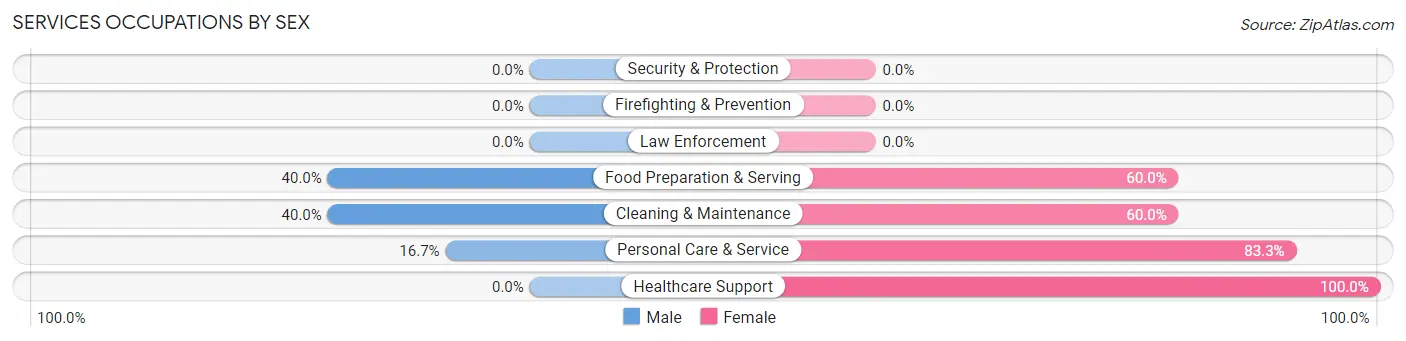
Services Occupations by Sex
Within the Services occupations in Shiloh borough, the most male-oriented occupations are Food Preparation & Serving (40.0%), Cleaning & Maintenance (40.0%), and Personal Care & Service (16.7%), while the most female-oriented occupations are Healthcare Support (100.0%), Personal Care & Service (83.3%), and Food Preparation & Serving (60.0%).
| Occupation | Male | Female |
| Healthcare Support | 0 (0.0%) | 12 (100.0%) |
| Security & Protection | 0 (0.0%) | 0 (0.0%) |
| Firefighting & Prevention | 0 (0.0%) | 0 (0.0%) |
| Law Enforcement | 0 (0.0%) | 0 (0.0%) |
| Food Preparation & Serving | 2 (40.0%) | 3 (60.0%) |
| Cleaning & Maintenance | 4 (40.0%) | 6 (60.0%) |
| Personal Care & Service | 1 (16.7%) | 5 (83.3%) |
| Total (Category) | 7 (21.2%) | 26 (78.8%) |
| Total (Overall) | 69 (47.6%) | 76 (52.4%) |
Sales and Office Occupations
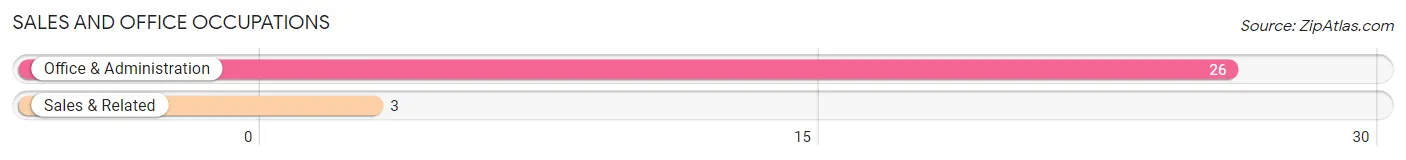
The most common Sales and Office occupations in Shiloh borough are Office & Administration (26 | 17.9%), and Sales & Related (3 | 2.1%).
Sales and Office Occupations by Sex
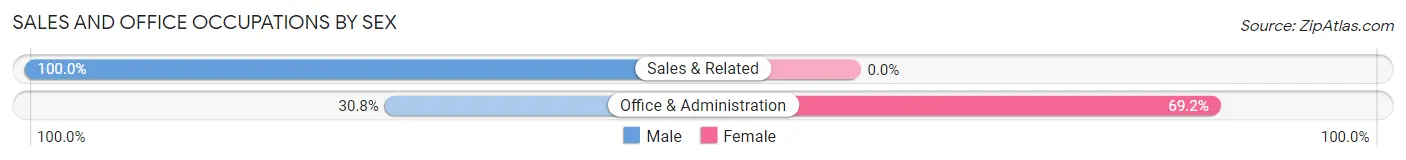
| Occupation | Male | Female |
| Sales & Related | 3 (100.0%) | 0 (0.0%) |
| Office & Administration | 8 (30.8%) | 18 (69.2%) |
| Total (Category) | 11 (37.9%) | 18 (62.1%) |
| Total (Overall) | 69 (47.6%) | 76 (52.4%) |
Natural Resources, Construction and Maintenance Occupations
The most common Natural Resources, Construction and Maintenance occupations in Shiloh borough are Construction & Extraction (9 | 6.2%), Installation, Maintenance & Repair (9 | 6.2%), and Farming, Fishing & Forestry (3 | 2.1%).

Natural Resources, Construction and Maintenance Occupations by Sex
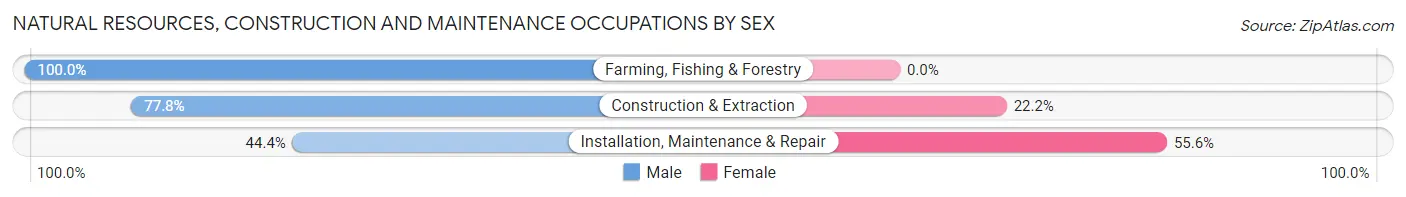
| Occupation | Male | Female |
| Farming, Fishing & Forestry | 3 (100.0%) | 0 (0.0%) |
| Construction & Extraction | 7 (77.8%) | 2 (22.2%) |
| Installation, Maintenance & Repair | 4 (44.4%) | 5 (55.6%) |
| Total (Category) | 14 (66.7%) | 7 (33.3%) |
| Total (Overall) | 69 (47.6%) | 76 (52.4%) |
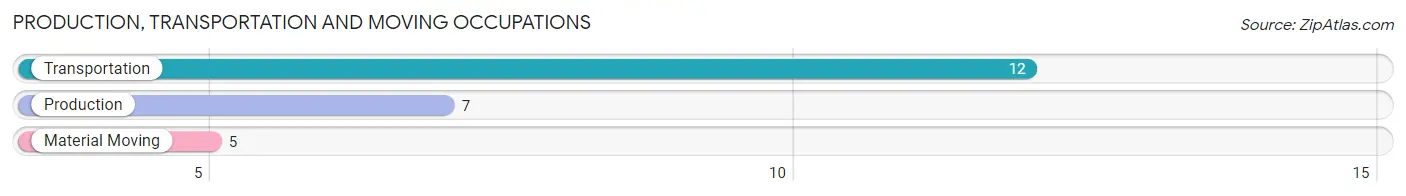
Production, Transportation and Moving Occupations
The most common Production, Transportation and Moving occupations in Shiloh borough are Transportation (12 | 8.3%), Production (7 | 4.8%), and Material Moving (5 | 3.5%).
Production, Transportation and Moving Occupations by Sex
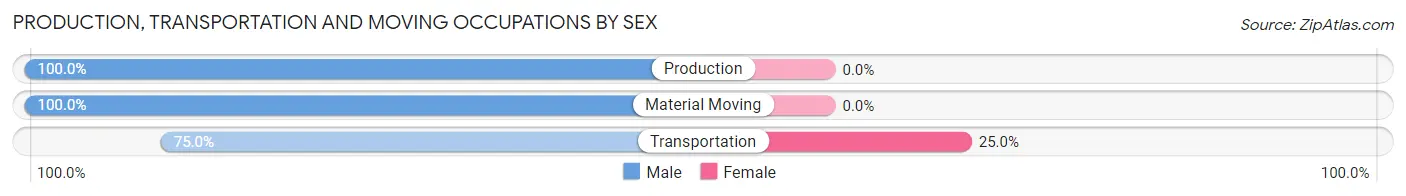
| Occupation | Male | Female |
| Production | 7 (100.0%) | 0 (0.0%) |
| Transportation | 9 (75.0%) | 3 (25.0%) |
| Material Moving | 5 (100.0%) | 0 (0.0%) |
| Total (Category) | 21 (87.5%) | 3 (12.5%) |
| Total (Overall) | 69 (47.6%) | 76 (52.4%) |
Employment Industries by Sex in Shiloh borough
Employment Industries in Shiloh borough
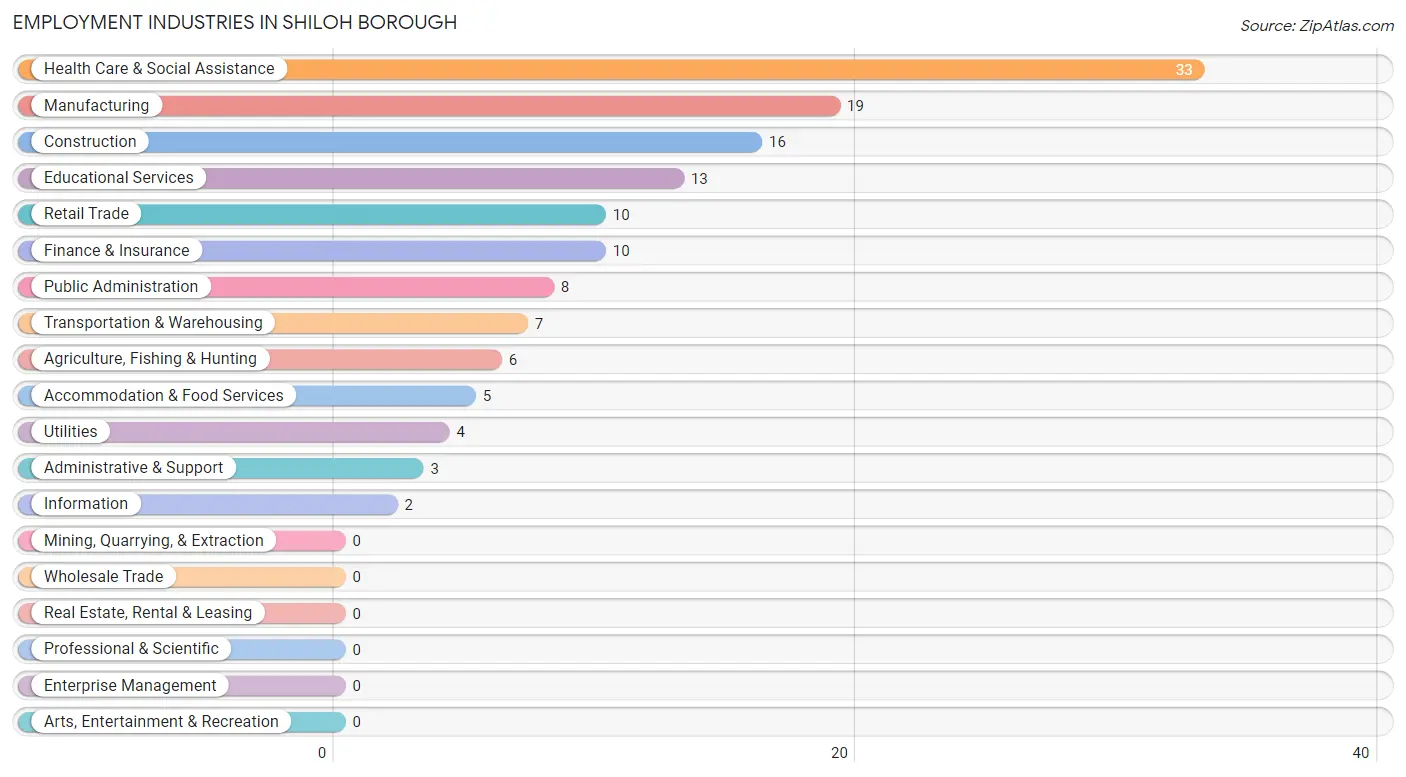
The major employment industries in Shiloh borough include Health Care & Social Assistance (33 | 22.8%), Manufacturing (19 | 13.1%), Construction (16 | 11.0%), Educational Services (13 | 9.0%), and Retail Trade (10 | 6.9%).
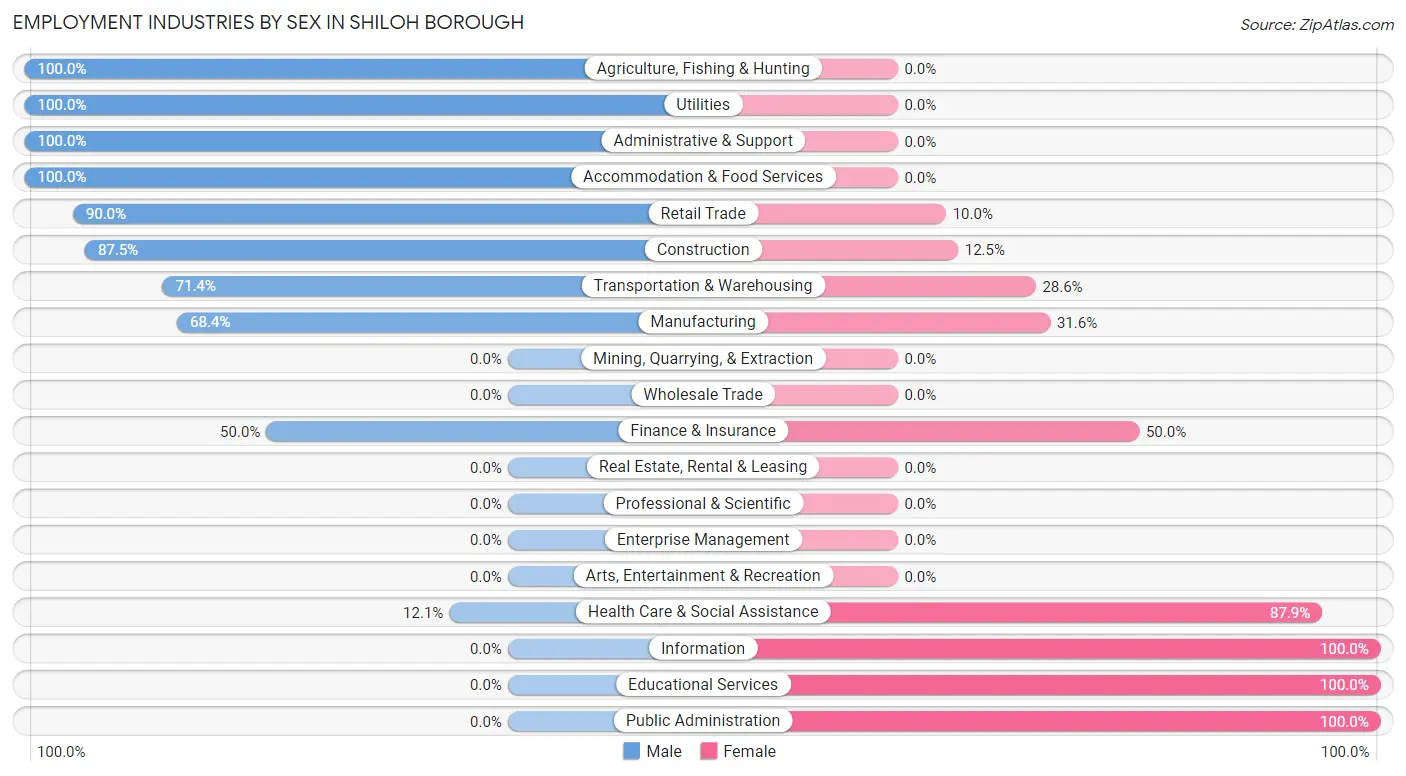
Employment Industries by Sex in Shiloh borough
The Shiloh borough industries that see more men than women are Agriculture, Fishing & Hunting (100.0%), Utilities (100.0%), and Administrative & Support (100.0%), whereas the industries that tend to have a higher number of women are Information (100.0%), Educational Services (100.0%), and Public Administration (100.0%).
| Industry | Male | Female |
| Agriculture, Fishing & Hunting | 6 (100.0%) | 0 (0.0%) |
| Mining, Quarrying, & Extraction | 0 (0.0%) | 0 (0.0%) |
| Construction | 14 (87.5%) | 2 (12.5%) |
| Manufacturing | 13 (68.4%) | 6 (31.6%) |
| Wholesale Trade | 0 (0.0%) | 0 (0.0%) |
| Retail Trade | 9 (90.0%) | 1 (10.0%) |
| Transportation & Warehousing | 5 (71.4%) | 2 (28.6%) |
| Utilities | 4 (100.0%) | 0 (0.0%) |
| Information | 0 (0.0%) | 2 (100.0%) |
| Finance & Insurance | 5 (50.0%) | 5 (50.0%) |
| Real Estate, Rental & Leasing | 0 (0.0%) | 0 (0.0%) |
| Professional & Scientific | 0 (0.0%) | 0 (0.0%) |
| Enterprise Management | 0 (0.0%) | 0 (0.0%) |
| Administrative & Support | 3 (100.0%) | 0 (0.0%) |
| Educational Services | 0 (0.0%) | 13 (100.0%) |
| Health Care & Social Assistance | 4 (12.1%) | 29 (87.9%) |
| Arts, Entertainment & Recreation | 0 (0.0%) | 0 (0.0%) |
| Accommodation & Food Services | 5 (100.0%) | 0 (0.0%) |
| Public Administration | 0 (0.0%) | 8 (100.0%) |
| Total | 69 (47.6%) | 76 (52.4%) |
Education in Shiloh borough
School Enrollment in Shiloh borough
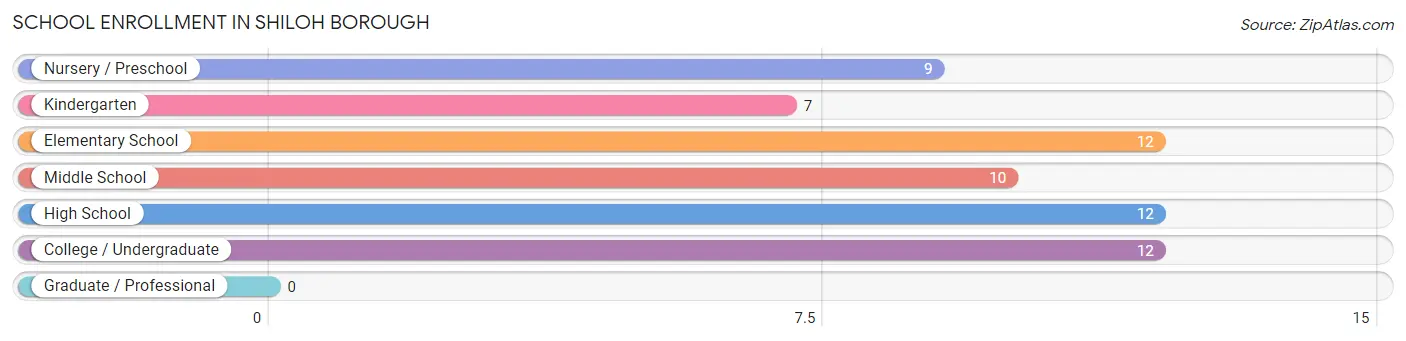
The most common levels of schooling among the 62 students in Shiloh borough are elementary school (12 | 19.4%), high school (12 | 19.4%), and college / undergraduate (12 | 19.4%).
| School Level | # Students | % Students |
| Nursery / Preschool | 9 | 14.5% |
| Kindergarten | 7 | 11.3% |
| Elementary School | 12 | 19.4% |
| Middle School | 10 | 16.1% |
| High School | 12 | 19.4% |
| College / Undergraduate | 12 | 19.4% |
| Graduate / Professional | 0 | 0.0% |
| Total | 62 | 100.0% |
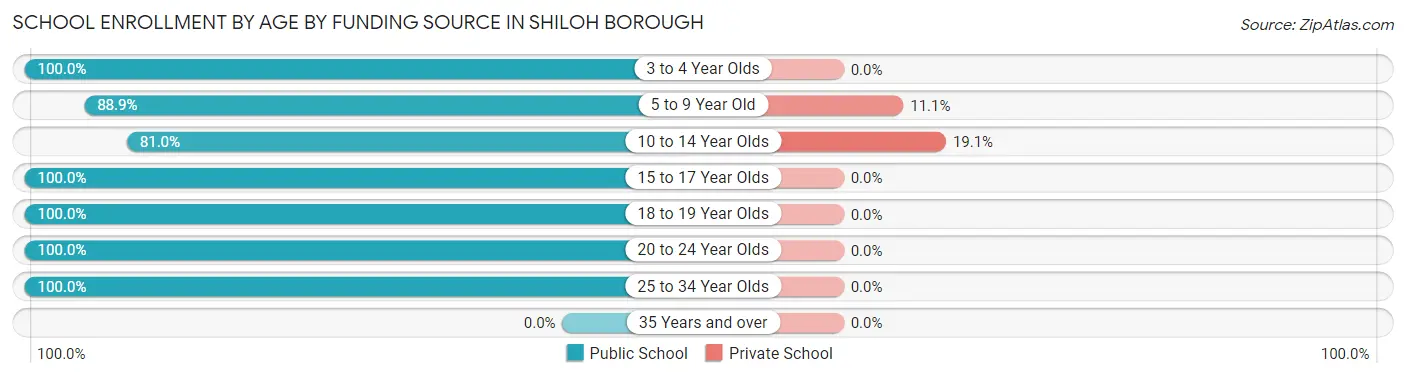
School Enrollment by Age by Funding Source in Shiloh borough
Out of a total of 62 students who are enrolled in schools in Shiloh borough, 6 (9.7%) attend a private institution, while the remaining 56 (90.3%) are enrolled in public schools. The age group of 10 to 14 year olds has the highest likelihood of being enrolled in private schools, with 4 (19.1% in the age bracket) enrolled. Conversely, the age group of 3 to 4 year olds has the lowest likelihood of being enrolled in a private school, with 9 (100.0% in the age bracket) attending a public institution.
| Age Bracket | Public School | Private School |
| 3 to 4 Year Olds | 9 (100.0%) | 0 (0.0%) |
| 5 to 9 Year Old | 16 (88.9%) | 2 (11.1%) |
| 10 to 14 Year Olds | 17 (80.9%) | 4 (19.1%) |
| 15 to 17 Year Olds | 2 (100.0%) | 0 (0.0%) |
| 18 to 19 Year Olds | 6 (100.0%) | 0 (0.0%) |
| 20 to 24 Year Olds | 2 (100.0%) | 0 (0.0%) |
| 25 to 34 Year Olds | 4 (100.0%) | 0 (0.0%) |
| 35 Years and over | 0 (0.0%) | 0 (0.0%) |
| Total | 56 (90.3%) | 6 (9.7%) |
Educational Attainment by Field of Study in Shiloh borough
Education (19 | 44.2%), science & technology (10 | 23.3%), business (7 | 16.3%), bio, nature & agricultural (2 | 4.6%), and liberal arts & history (2 | 4.6%) are the most common fields of study among 43 individuals in Shiloh borough who have obtained a bachelor's degree or higher.
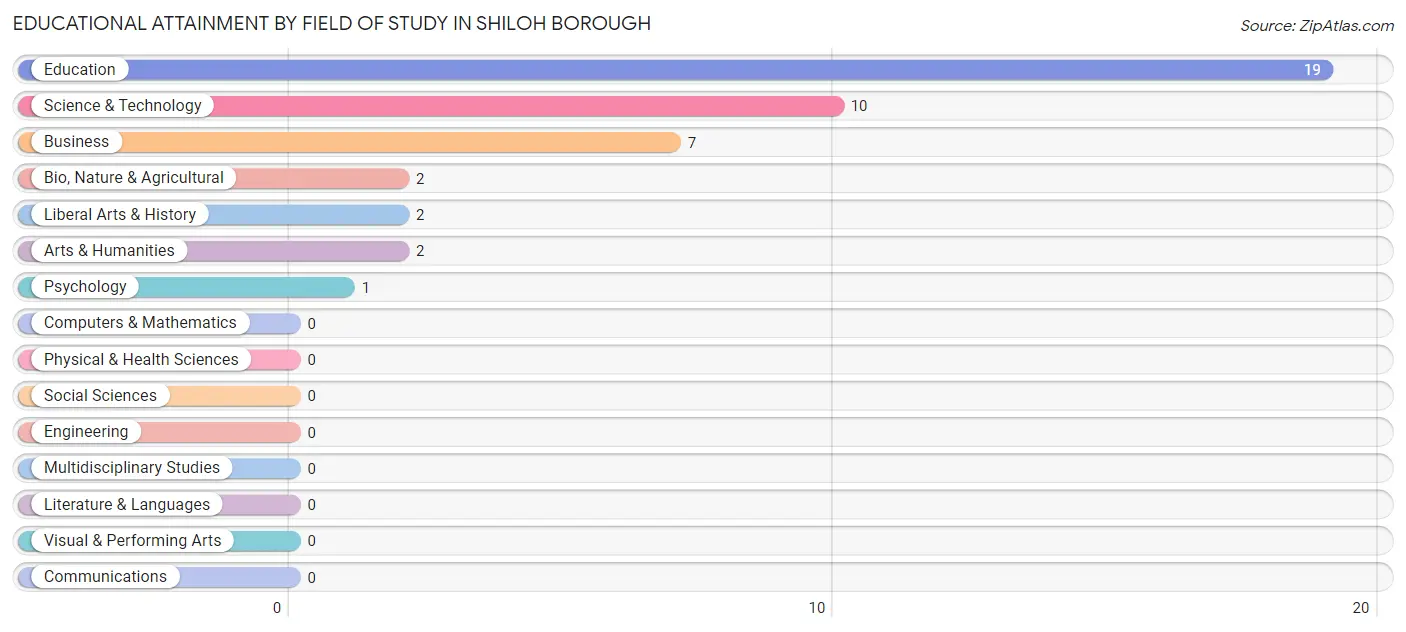
| Field of Study | # Graduates | % Graduates |
| Computers & Mathematics | 0 | 0.0% |
| Bio, Nature & Agricultural | 2 | 4.6% |
| Physical & Health Sciences | 0 | 0.0% |
| Psychology | 1 | 2.3% |
| Social Sciences | 0 | 0.0% |
| Engineering | 0 | 0.0% |
| Multidisciplinary Studies | 0 | 0.0% |
| Science & Technology | 10 | 23.3% |
| Business | 7 | 16.3% |
| Education | 19 | 44.2% |
| Literature & Languages | 0 | 0.0% |
| Liberal Arts & History | 2 | 4.6% |
| Visual & Performing Arts | 0 | 0.0% |
| Communications | 0 | 0.0% |
| Arts & Humanities | 2 | 4.6% |
| Total | 43 | 100.0% |
Transportation & Commute in Shiloh borough
Vehicle Availability by Sex in Shiloh borough
The most prevalent vehicle ownership categories in Shiloh borough are males with 5 or more vehicles (21, accounting for 32.3%) and females with 5 or more vehicles (4, making up 27.6%).
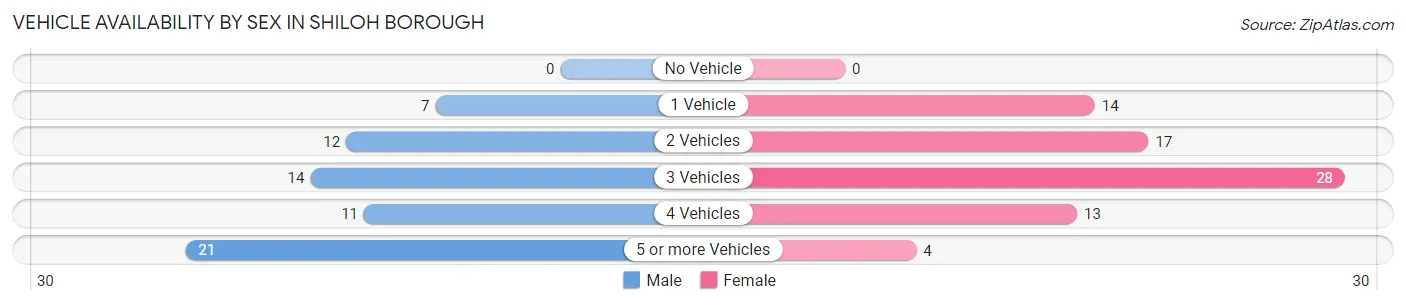
| Vehicles Available | Male | Female |
| No Vehicle | 0 (0.0%) | 0 (0.0%) |
| 1 Vehicle | 7 (10.8%) | 14 (18.4%) |
| 2 Vehicles | 12 (18.5%) | 17 (22.4%) |
| 3 Vehicles | 14 (21.5%) | 28 (36.8%) |
| 4 Vehicles | 11 (16.9%) | 13 (17.1%) |
| 5 or more Vehicles | 21 (32.3%) | 4 (5.3%) |
| Total | 65 (100.0%) | 76 (100.0%) |
Commute Time in Shiloh borough
The most frequently occuring commute durations in Shiloh borough are 10 to 14 minutes (22 commuters, 15.6%), 20 to 24 minutes (19 commuters, 13.5%), and 30 to 34 minutes (17 commuters, 12.1%).
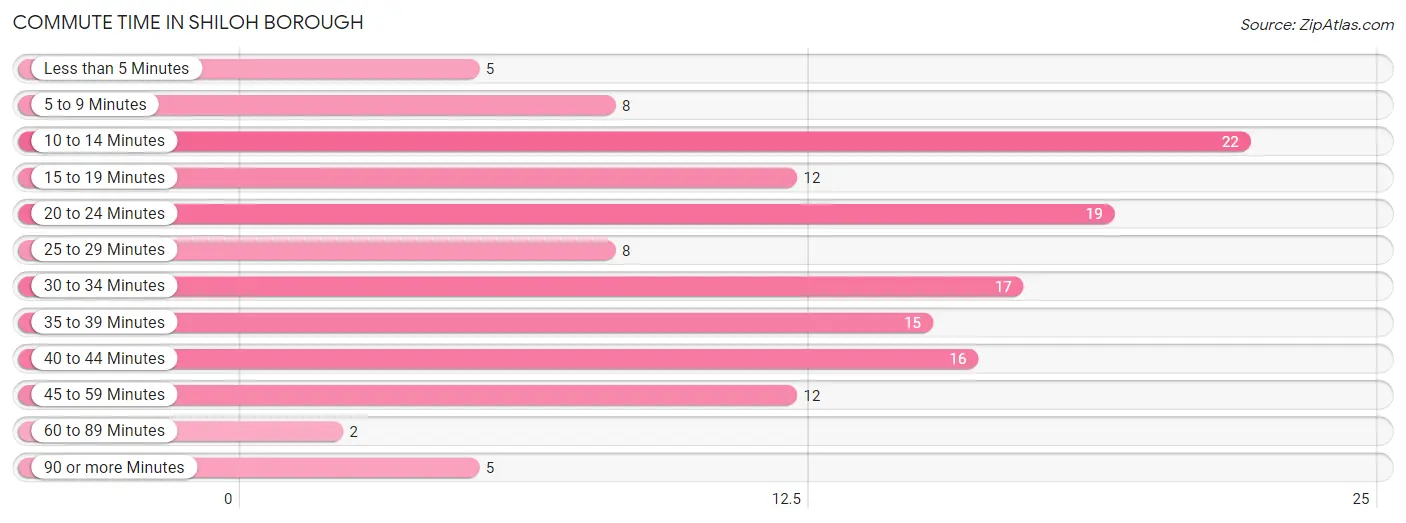
| Commute Time | # Commuters | % Commuters |
| Less than 5 Minutes | 5 | 3.5% |
| 5 to 9 Minutes | 8 | 5.7% |
| 10 to 14 Minutes | 22 | 15.6% |
| 15 to 19 Minutes | 12 | 8.5% |
| 20 to 24 Minutes | 19 | 13.5% |
| 25 to 29 Minutes | 8 | 5.7% |
| 30 to 34 Minutes | 17 | 12.1% |
| 35 to 39 Minutes | 15 | 10.6% |
| 40 to 44 Minutes | 16 | 11.4% |
| 45 to 59 Minutes | 12 | 8.5% |
| 60 to 89 Minutes | 2 | 1.4% |
| 90 or more Minutes | 5 | 3.5% |
Commute Time by Sex in Shiloh borough
The most common commute times in Shiloh borough are 35 to 39 minutes (15 commuters, 23.1%) for males and 20 to 24 minutes (17 commuters, 22.4%) for females.
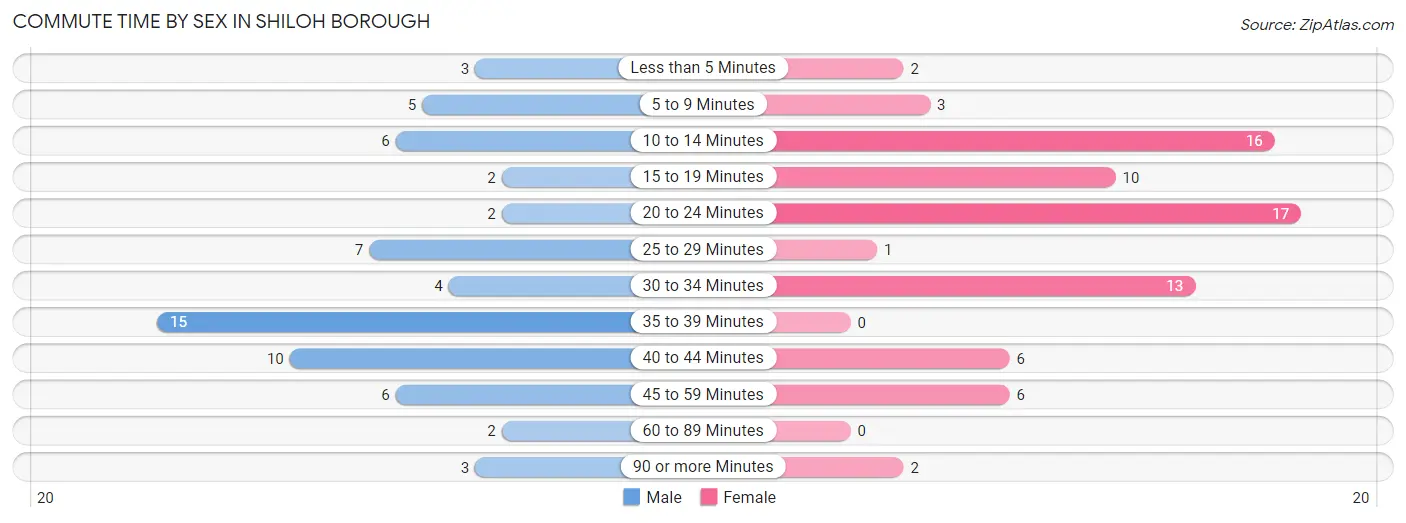
| Commute Time | Male | Female |
| Less than 5 Minutes | 3 (4.6%) | 2 (2.6%) |
| 5 to 9 Minutes | 5 (7.7%) | 3 (4.0%) |
| 10 to 14 Minutes | 6 (9.2%) | 16 (21.0%) |
| 15 to 19 Minutes | 2 (3.1%) | 10 (13.2%) |
| 20 to 24 Minutes | 2 (3.1%) | 17 (22.4%) |
| 25 to 29 Minutes | 7 (10.8%) | 1 (1.3%) |
| 30 to 34 Minutes | 4 (6.1%) | 13 (17.1%) |
| 35 to 39 Minutes | 15 (23.1%) | 0 (0.0%) |
| 40 to 44 Minutes | 10 (15.4%) | 6 (7.9%) |
| 45 to 59 Minutes | 6 (9.2%) | 6 (7.9%) |
| 60 to 89 Minutes | 2 (3.1%) | 0 (0.0%) |
| 90 or more Minutes | 3 (4.6%) | 2 (2.6%) |
Time of Departure to Work by Sex in Shiloh borough
The most frequent times of departure to work in Shiloh borough are 5:00 AM to 5:29 AM (19, 29.2%) for males and 5:00 AM to 5:29 AM (18, 23.7%) for females.
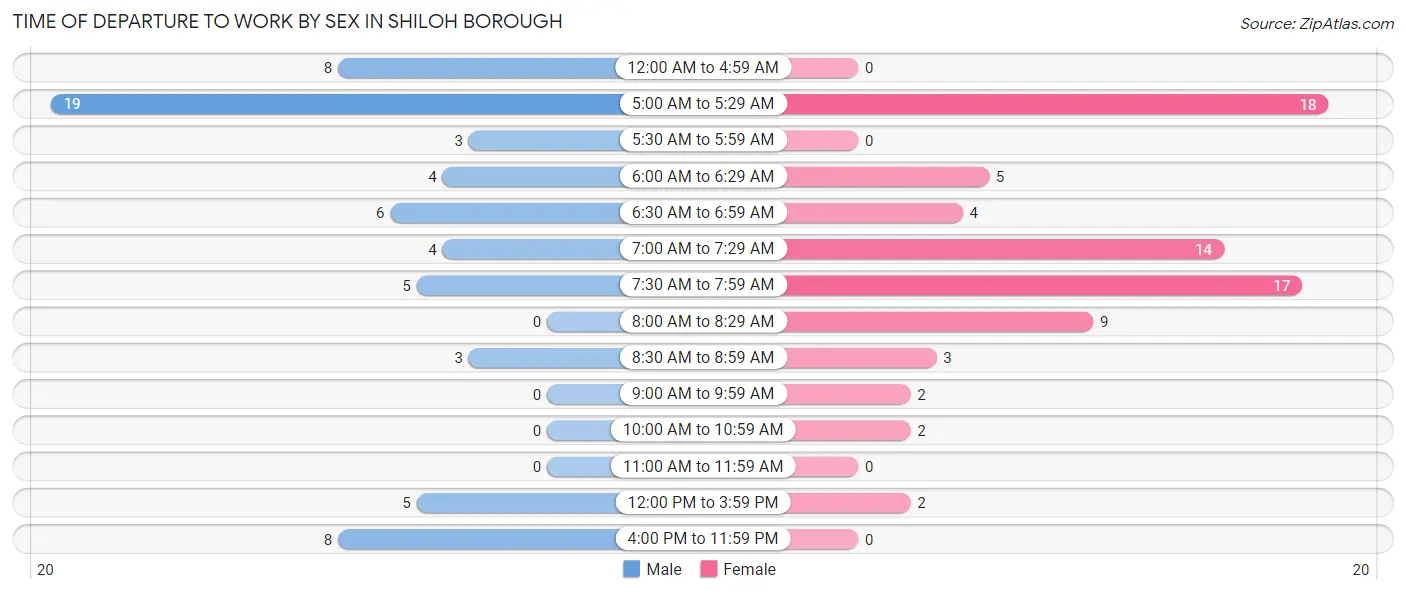
| Time of Departure | Male | Female |
| 12:00 AM to 4:59 AM | 8 (12.3%) | 0 (0.0%) |
| 5:00 AM to 5:29 AM | 19 (29.2%) | 18 (23.7%) |
| 5:30 AM to 5:59 AM | 3 (4.6%) | 0 (0.0%) |
| 6:00 AM to 6:29 AM | 4 (6.1%) | 5 (6.6%) |
| 6:30 AM to 6:59 AM | 6 (9.2%) | 4 (5.3%) |
| 7:00 AM to 7:29 AM | 4 (6.1%) | 14 (18.4%) |
| 7:30 AM to 7:59 AM | 5 (7.7%) | 17 (22.4%) |
| 8:00 AM to 8:29 AM | 0 (0.0%) | 9 (11.8%) |
| 8:30 AM to 8:59 AM | 3 (4.6%) | 3 (4.0%) |
| 9:00 AM to 9:59 AM | 0 (0.0%) | 2 (2.6%) |
| 10:00 AM to 10:59 AM | 0 (0.0%) | 2 (2.6%) |
| 11:00 AM to 11:59 AM | 0 (0.0%) | 0 (0.0%) |
| 12:00 PM to 3:59 PM | 5 (7.7%) | 2 (2.6%) |
| 4:00 PM to 11:59 PM | 8 (12.3%) | 0 (0.0%) |
| Total | 65 (100.0%) | 76 (100.0%) |
Housing Occupancy in Shiloh borough
Occupancy by Ownership in Shiloh borough
Of the total 115 dwellings in Shiloh borough, owner-occupied units account for 90 (78.3%), while renter-occupied units make up 25 (21.7%).
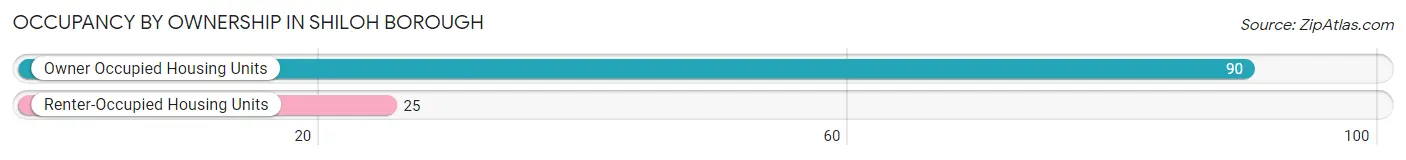
| Occupancy | # Housing Units | % Housing Units |
| Owner Occupied Housing Units | 90 | 78.3% |
| Renter-Occupied Housing Units | 25 | 21.7% |
| Total Occupied Housing Units | 115 | 100.0% |
Occupancy by Household Size in Shiloh borough
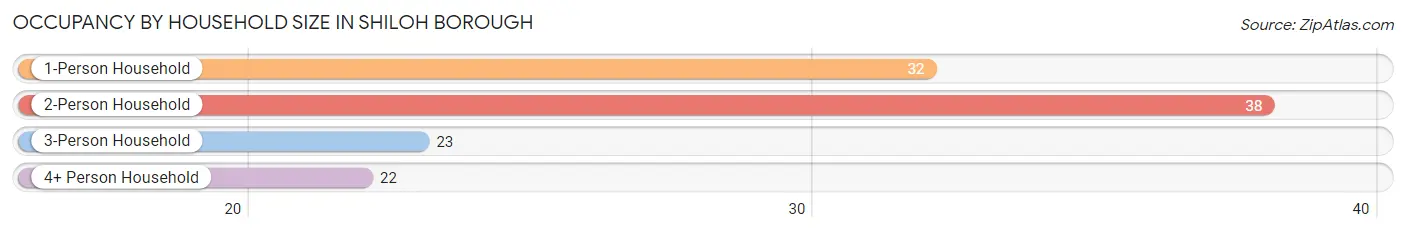
| Household Size | # Housing Units | % Housing Units |
| 1-Person Household | 32 | 27.8% |
| 2-Person Household | 38 | 33.0% |
| 3-Person Household | 23 | 20.0% |
| 4+ Person Household | 22 | 19.1% |
| Total Housing Units | 115 | 100.0% |
Occupancy by Ownership by Household Size in Shiloh borough
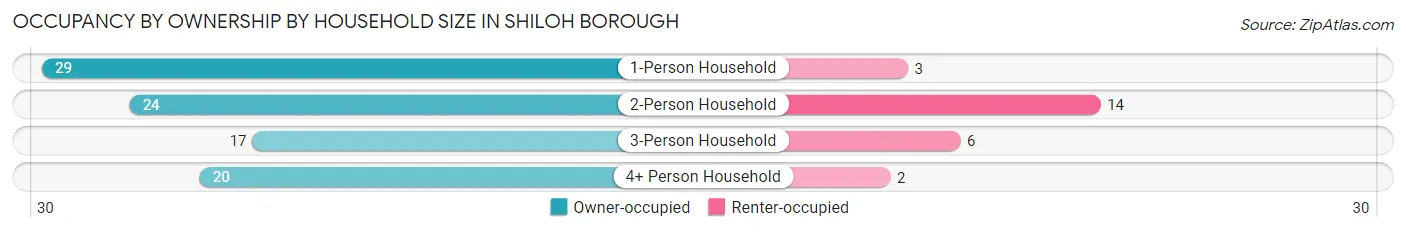
| Household Size | Owner-occupied | Renter-occupied |
| 1-Person Household | 29 (90.6%) | 3 (9.4%) |
| 2-Person Household | 24 (63.2%) | 14 (36.8%) |
| 3-Person Household | 17 (73.9%) | 6 (26.1%) |
| 4+ Person Household | 20 (90.9%) | 2 (9.1%) |
| Total Housing Units | 90 (78.3%) | 25 (21.7%) |
Occupancy by Educational Attainment in Shiloh borough
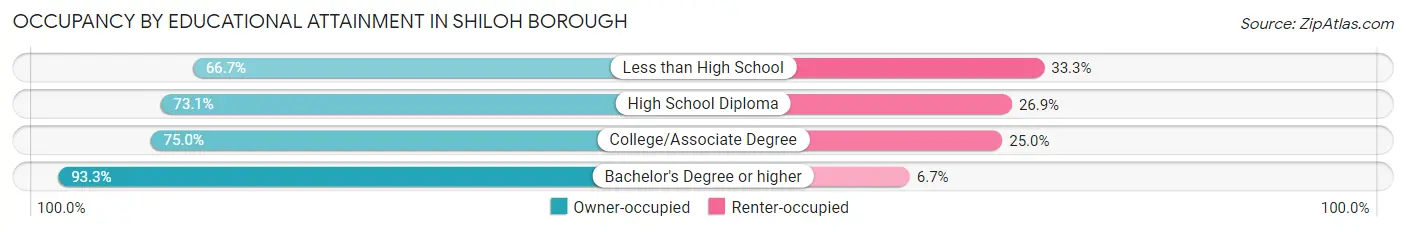
| Household Size | Owner-occupied | Renter-occupied |
| Less than High School | 6 (66.7%) | 3 (33.3%) |
| High School Diploma | 38 (73.1%) | 14 (26.9%) |
| College/Associate Degree | 18 (75.0%) | 6 (25.0%) |
| Bachelor's Degree or higher | 28 (93.3%) | 2 (6.7%) |
Occupancy by Age of Householder in Shiloh borough
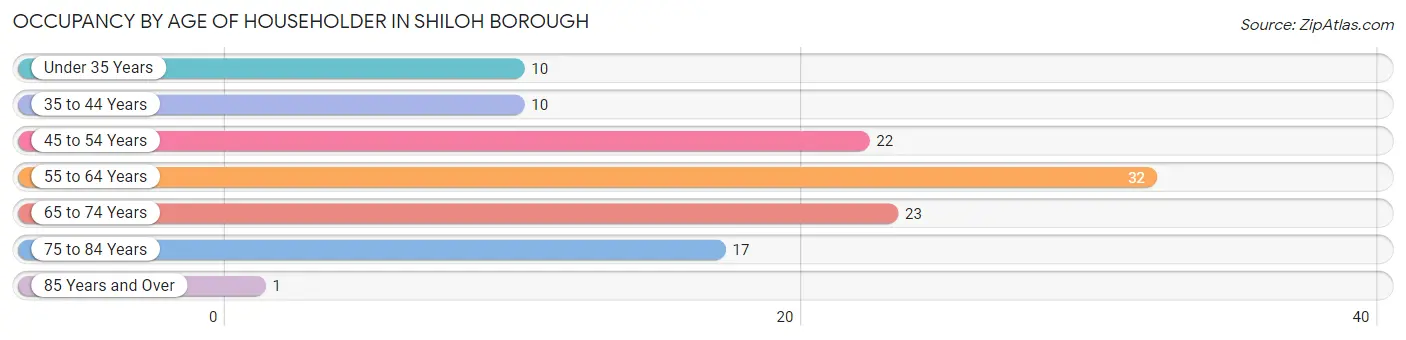
| Age Bracket | # Households | % Households |
| Under 35 Years | 10 | 8.7% |
| 35 to 44 Years | 10 | 8.7% |
| 45 to 54 Years | 22 | 19.1% |
| 55 to 64 Years | 32 | 27.8% |
| 65 to 74 Years | 23 | 20.0% |
| 75 to 84 Years | 17 | 14.8% |
| 85 Years and Over | 1 | 0.9% |
| Total | 115 | 100.0% |
Housing Finances in Shiloh borough
Median Income by Occupancy in Shiloh borough
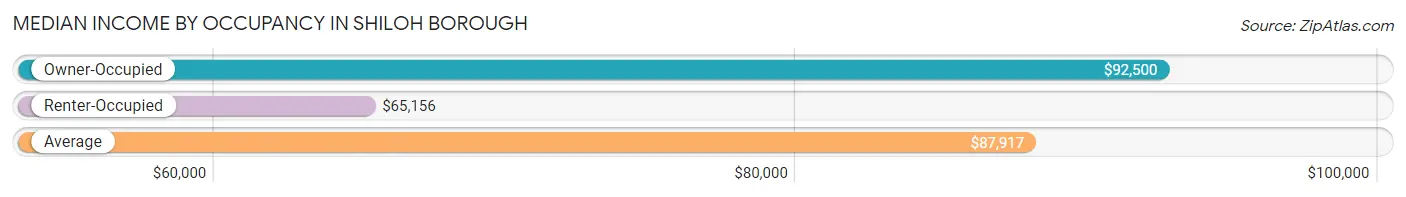
| Occupancy Type | # Households | Median Income |
| Owner-Occupied | 90 (78.3%) | $92,500 |
| Renter-Occupied | 25 (21.7%) | $65,156 |
| Average | 115 (100.0%) | $87,917 |
Occupancy by Householder Income Bracket in Shiloh borough
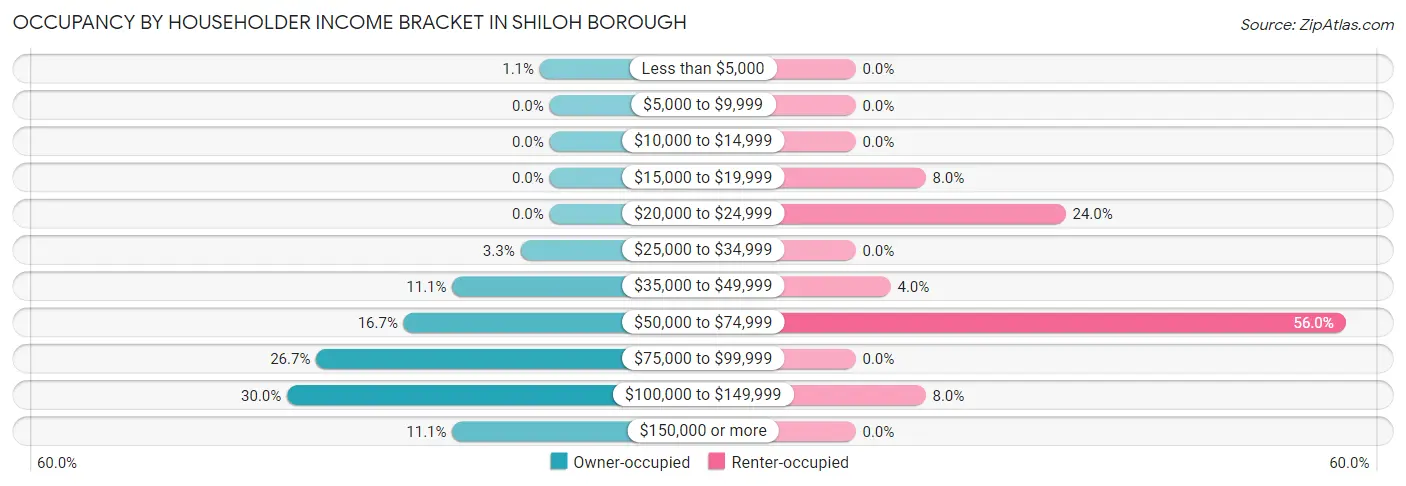
| Income Bracket | Owner-occupied | Renter-occupied |
| Less than $5,000 | 1 (1.1%) | 0 (0.0%) |
| $5,000 to $9,999 | 0 (0.0%) | 0 (0.0%) |
| $10,000 to $14,999 | 0 (0.0%) | 0 (0.0%) |
| $15,000 to $19,999 | 0 (0.0%) | 2 (8.0%) |
| $20,000 to $24,999 | 0 (0.0%) | 6 (24.0%) |
| $25,000 to $34,999 | 3 (3.3%) | 0 (0.0%) |
| $35,000 to $49,999 | 10 (11.1%) | 1 (4.0%) |
| $50,000 to $74,999 | 15 (16.7%) | 14 (56.0%) |
| $75,000 to $99,999 | 24 (26.7%) | 0 (0.0%) |
| $100,000 to $149,999 | 27 (30.0%) | 2 (8.0%) |
| $150,000 or more | 10 (11.1%) | 0 (0.0%) |
| Total | 90 (100.0%) | 25 (100.0%) |
Monthly Housing Cost Tiers in Shiloh borough
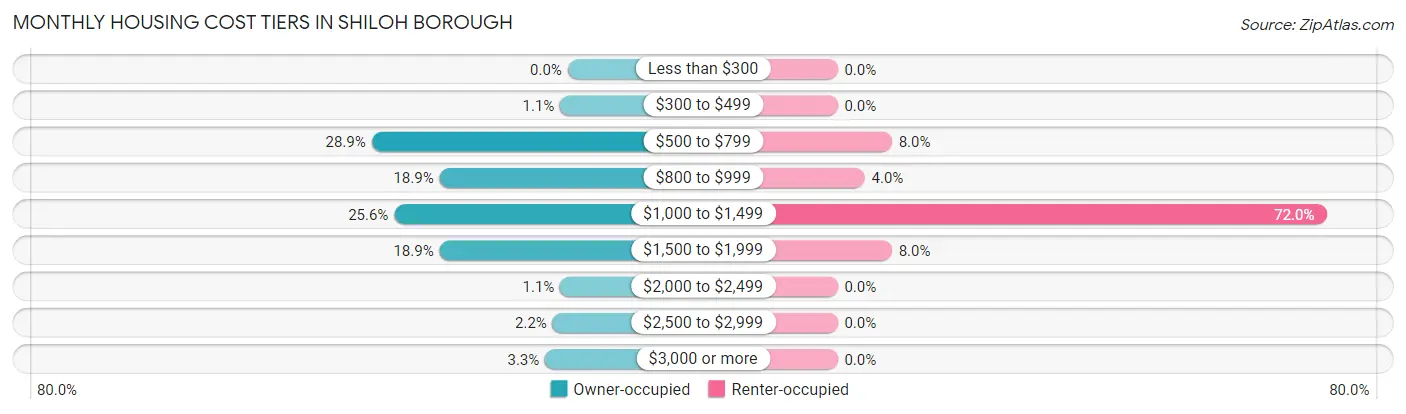
| Monthly Cost | Owner-occupied | Renter-occupied |
| Less than $300 | 0 (0.0%) | 0 (0.0%) |
| $300 to $499 | 1 (1.1%) | 0 (0.0%) |
| $500 to $799 | 26 (28.9%) | 2 (8.0%) |
| $800 to $999 | 17 (18.9%) | 1 (4.0%) |
| $1,000 to $1,499 | 23 (25.6%) | 18 (72.0%) |
| $1,500 to $1,999 | 17 (18.9%) | 2 (8.0%) |
| $2,000 to $2,499 | 1 (1.1%) | 0 (0.0%) |
| $2,500 to $2,999 | 2 (2.2%) | 0 (0.0%) |
| $3,000 or more | 3 (3.3%) | 0 (0.0%) |
| Total | 90 (100.0%) | 25 (100.0%) |
Physical Housing Characteristics in Shiloh borough
Housing Structures in Shiloh borough
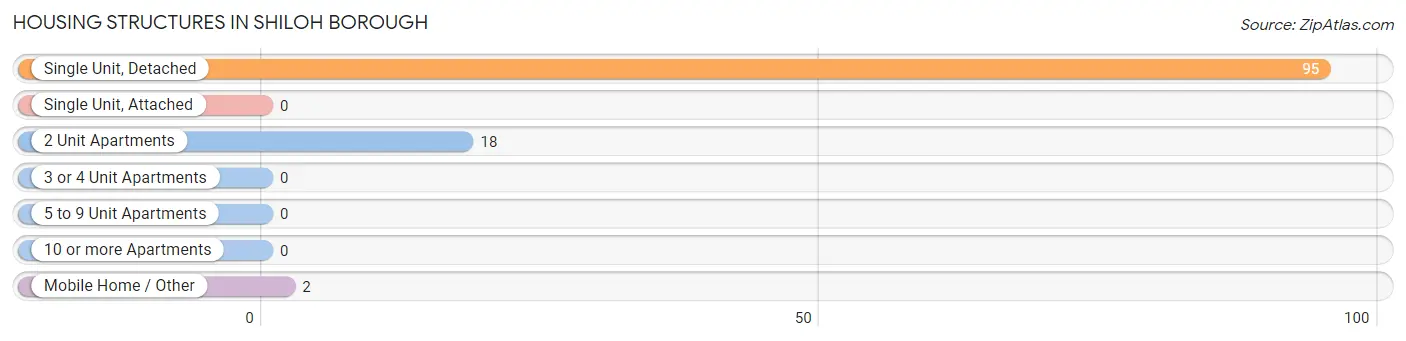
| Structure Type | # Housing Units | % Housing Units |
| Single Unit, Detached | 95 | 82.6% |
| Single Unit, Attached | 0 | 0.0% |
| 2 Unit Apartments | 18 | 15.7% |
| 3 or 4 Unit Apartments | 0 | 0.0% |
| 5 to 9 Unit Apartments | 0 | 0.0% |
| 10 or more Apartments | 0 | 0.0% |
| Mobile Home / Other | 2 | 1.7% |
| Total | 115 | 100.0% |
Housing Structures by Occupancy in Shiloh borough
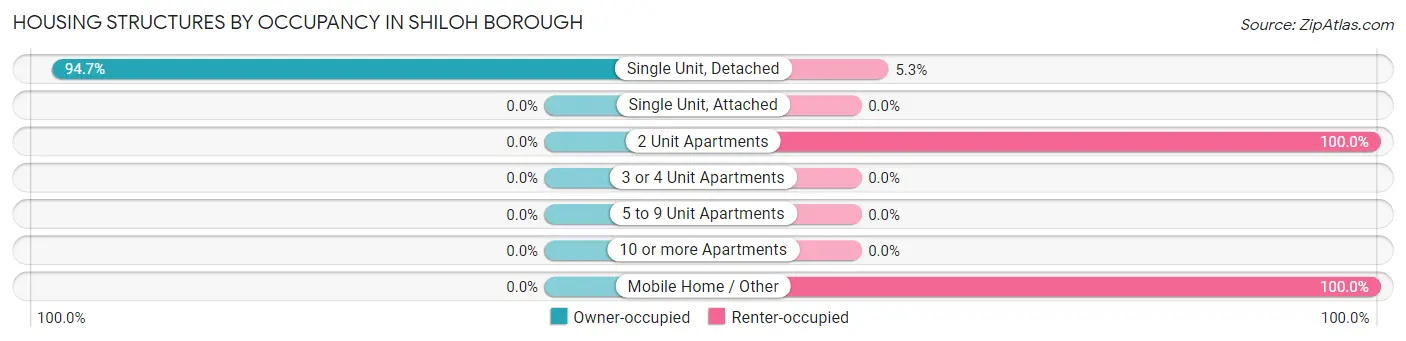
| Structure Type | Owner-occupied | Renter-occupied |
| Single Unit, Detached | 90 (94.7%) | 5 (5.3%) |
| Single Unit, Attached | 0 (0.0%) | 0 (0.0%) |
| 2 Unit Apartments | 0 (0.0%) | 18 (100.0%) |
| 3 or 4 Unit Apartments | 0 (0.0%) | 0 (0.0%) |
| 5 to 9 Unit Apartments | 0 (0.0%) | 0 (0.0%) |
| 10 or more Apartments | 0 (0.0%) | 0 (0.0%) |
| Mobile Home / Other | 0 (0.0%) | 2 (100.0%) |
| Total | 90 (78.3%) | 25 (21.7%) |
Housing Structures by Number of Rooms in Shiloh borough
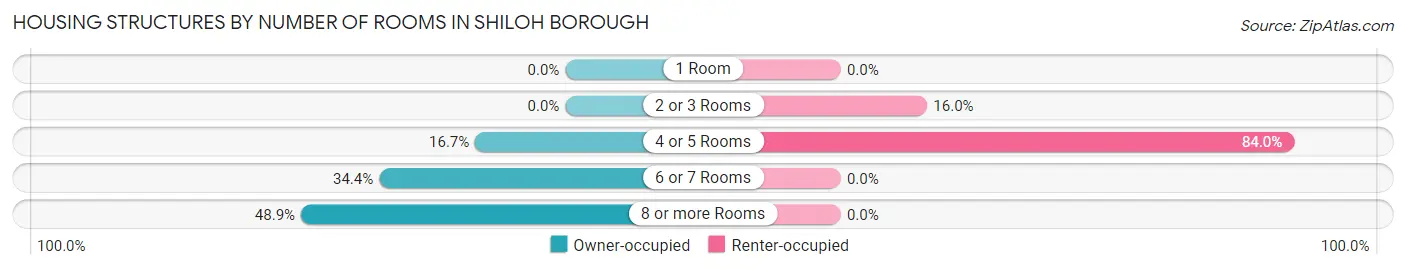
| Number of Rooms | Owner-occupied | Renter-occupied |
| 1 Room | 0 (0.0%) | 0 (0.0%) |
| 2 or 3 Rooms | 0 (0.0%) | 4 (16.0%) |
| 4 or 5 Rooms | 15 (16.7%) | 21 (84.0%) |
| 6 or 7 Rooms | 31 (34.4%) | 0 (0.0%) |
| 8 or more Rooms | 44 (48.9%) | 0 (0.0%) |
| Total | 90 (100.0%) | 25 (100.0%) |
Housing Structure by Heating Type in Shiloh borough
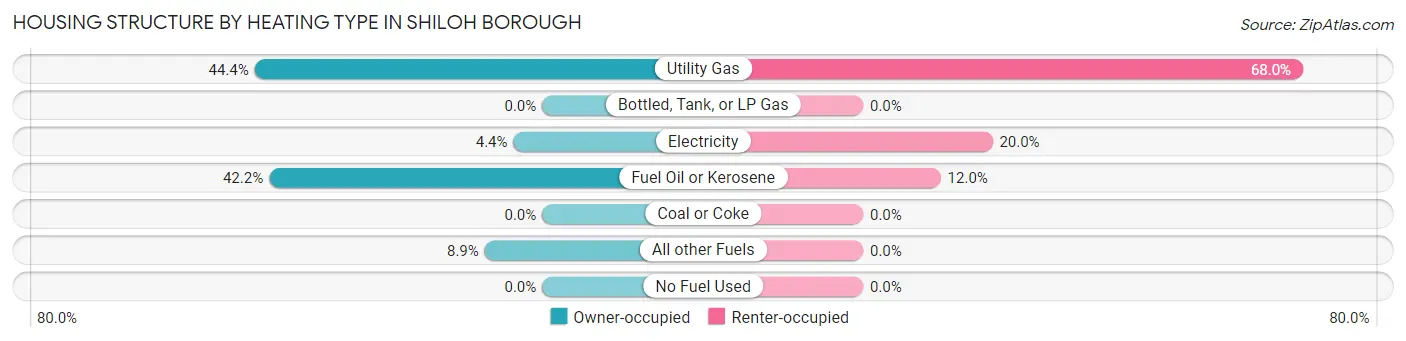
| Heating Type | Owner-occupied | Renter-occupied |
| Utility Gas | 40 (44.4%) | 17 (68.0%) |
| Bottled, Tank, or LP Gas | 0 (0.0%) | 0 (0.0%) |
| Electricity | 4 (4.4%) | 5 (20.0%) |
| Fuel Oil or Kerosene | 38 (42.2%) | 3 (12.0%) |
| Coal or Coke | 0 (0.0%) | 0 (0.0%) |
| All other Fuels | 8 (8.9%) | 0 (0.0%) |
| No Fuel Used | 0 (0.0%) | 0 (0.0%) |
| Total | 90 (100.0%) | 25 (100.0%) |
Household Vehicle Usage in Shiloh borough
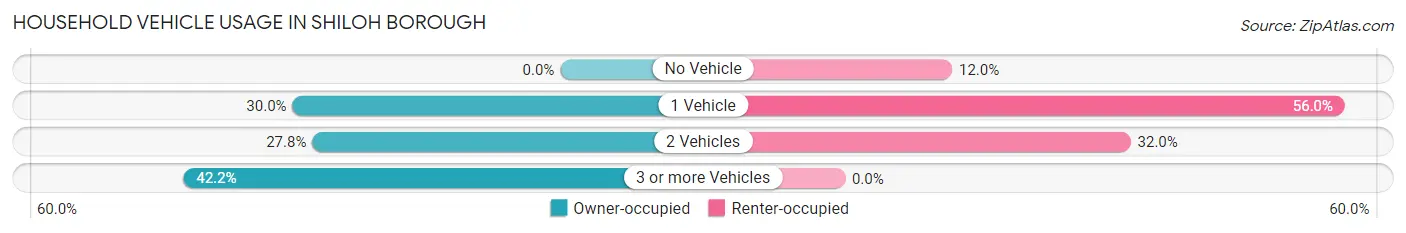
| Vehicles per Household | Owner-occupied | Renter-occupied |
| No Vehicle | 0 (0.0%) | 3 (12.0%) |
| 1 Vehicle | 27 (30.0%) | 14 (56.0%) |
| 2 Vehicles | 25 (27.8%) | 8 (32.0%) |
| 3 or more Vehicles | 38 (42.2%) | 0 (0.0%) |
| Total | 90 (100.0%) | 25 (100.0%) |
Real Estate & Mortgages in Shiloh borough
Real Estate and Mortgage Overview in Shiloh borough
| Characteristic | Without Mortgage | With Mortgage |
| Housing Units | 49 | 41 |
| Median Property Value | $211,500 | $169,300 |
| Median Household Income | $88,125 | $3 |
| Monthly Housing Costs | $775 | $3 |
| Real Estate Taxes | $5,063 | $0 |
Property Value by Mortgage Status in Shiloh borough
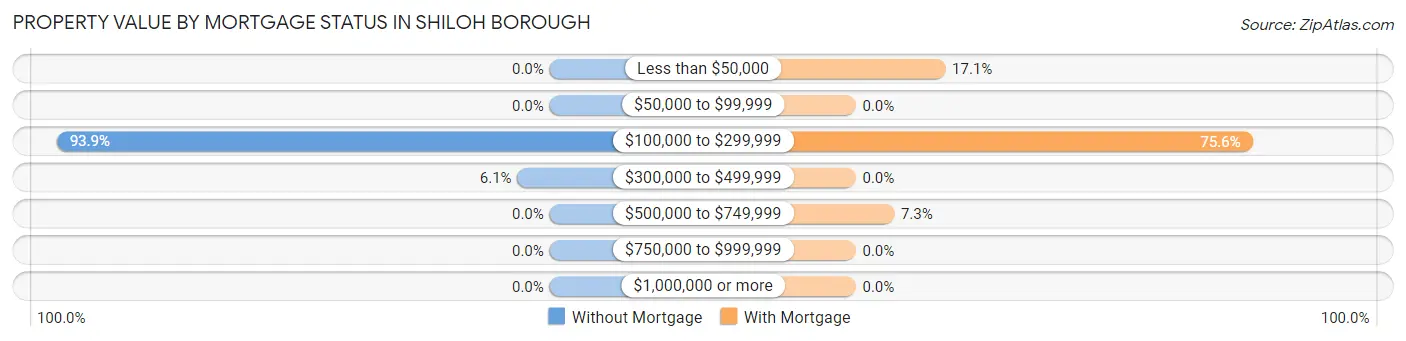
| Property Value | Without Mortgage | With Mortgage |
| Less than $50,000 | 0 (0.0%) | 7 (17.1%) |
| $50,000 to $99,999 | 0 (0.0%) | 0 (0.0%) |
| $100,000 to $299,999 | 46 (93.9%) | 31 (75.6%) |
| $300,000 to $499,999 | 3 (6.1%) | 0 (0.0%) |
| $500,000 to $749,999 | 0 (0.0%) | 3 (7.3%) |
| $750,000 to $999,999 | 0 (0.0%) | 0 (0.0%) |
| $1,000,000 or more | 0 (0.0%) | 0 (0.0%) |
| Total | 49 (100.0%) | 41 (100.0%) |
Household Income by Mortgage Status in Shiloh borough
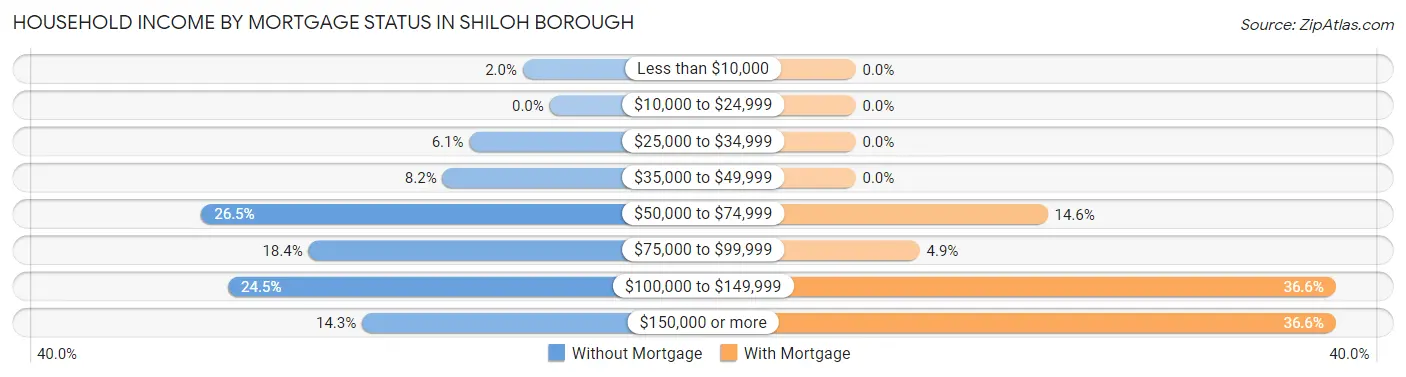
| Household Income | Without Mortgage | With Mortgage |
| Less than $10,000 | 1 (2.0%) | 0 (0.0%) |
| $10,000 to $24,999 | 0 (0.0%) | 0 (0.0%) |
| $25,000 to $34,999 | 3 (6.1%) | 0 (0.0%) |
| $35,000 to $49,999 | 4 (8.2%) | 0 (0.0%) |
| $50,000 to $74,999 | 13 (26.5%) | 6 (14.6%) |
| $75,000 to $99,999 | 9 (18.4%) | 2 (4.9%) |
| $100,000 to $149,999 | 12 (24.5%) | 15 (36.6%) |
| $150,000 or more | 7 (14.3%) | 15 (36.6%) |
| Total | 49 (100.0%) | 41 (100.0%) |
Property Value to Household Income Ratio in Shiloh borough
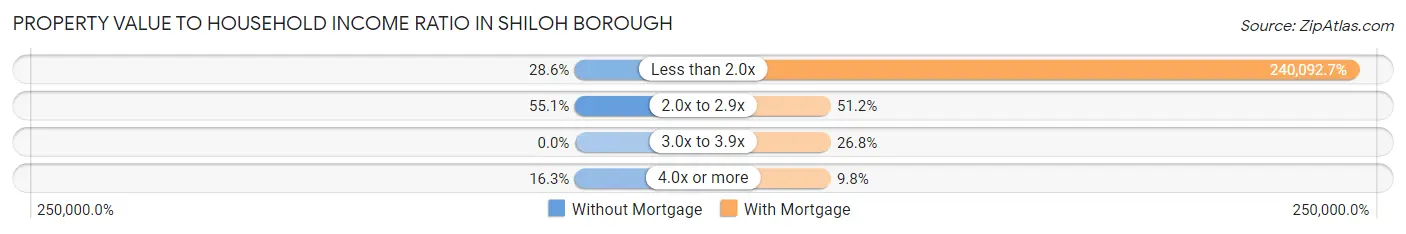
| Value-to-Income Ratio | Without Mortgage | With Mortgage |
| Less than 2.0x | 14 (28.6%) | 98,438 (240,092.7%) |
| 2.0x to 2.9x | 27 (55.1%) | 21 (51.2%) |
| 3.0x to 3.9x | 0 (0.0%) | 11 (26.8%) |
| 4.0x or more | 8 (16.3%) | 4 (9.8%) |
| Total | 49 (100.0%) | 41 (100.0%) |
Real Estate Taxes by Mortgage Status in Shiloh borough
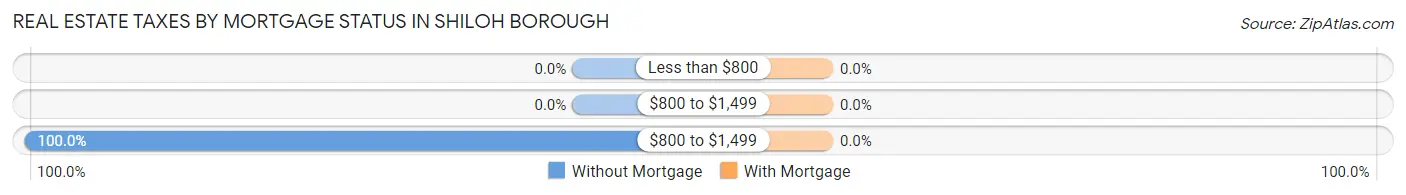
| Property Taxes | Without Mortgage | With Mortgage |
| Less than $800 | 0 (0.0%) | 0 (0.0%) |
| $800 to $1,499 | 0 (0.0%) | 0 (0.0%) |
| $800 to $1,499 | 49 (100.0%) | 0 (0.0%) |
| Total | 49 (100.0%) | 41 (100.0%) |
Health & Disability in Shiloh borough
Health Insurance Coverage by Age in Shiloh borough
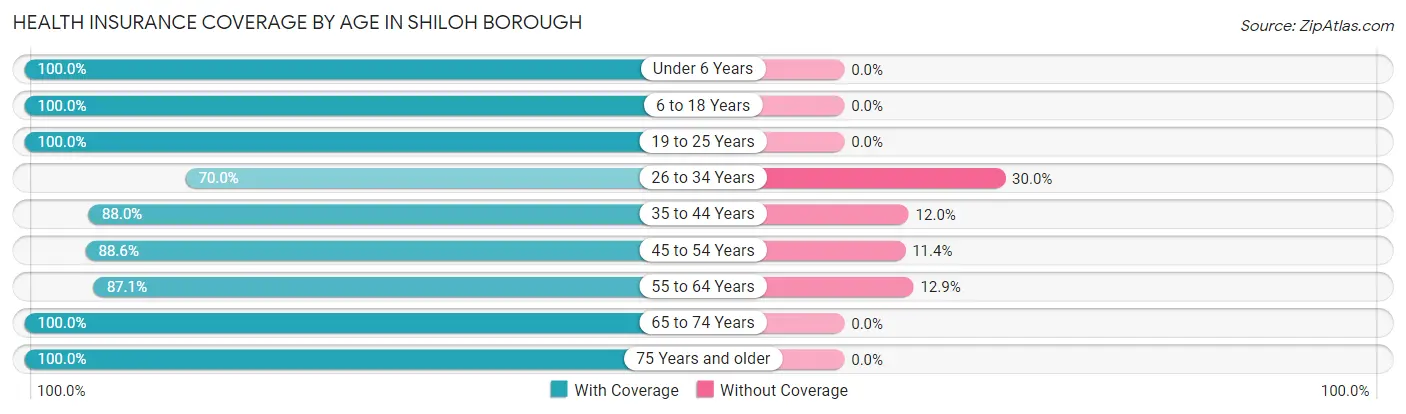
| Age Bracket | With Coverage | Without Coverage |
| Under 6 Years | 23 (100.0%) | 0 (0.0%) |
| 6 to 18 Years | 35 (100.0%) | 0 (0.0%) |
| 19 to 25 Years | 29 (100.0%) | 0 (0.0%) |
| 26 to 34 Years | 21 (70.0%) | 9 (30.0%) |
| 35 to 44 Years | 22 (88.0%) | 3 (12.0%) |
| 45 to 54 Years | 39 (88.6%) | 5 (11.4%) |
| 55 to 64 Years | 54 (87.1%) | 8 (12.9%) |
| 65 to 74 Years | 35 (100.0%) | 0 (0.0%) |
| 75 Years and older | 22 (100.0%) | 0 (0.0%) |
| Total | 280 (91.8%) | 25 (8.2%) |
Health Insurance Coverage by Citizenship Status in Shiloh borough
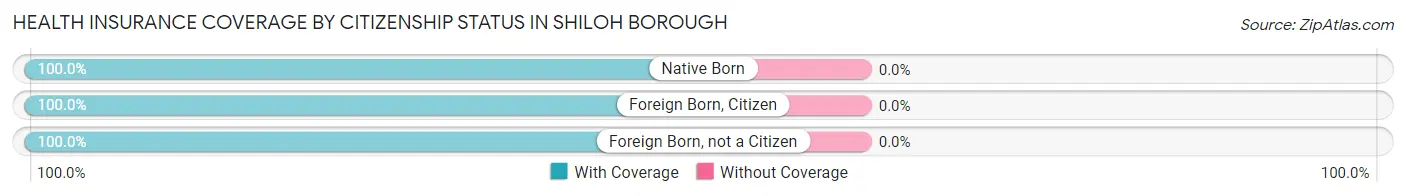
| Citizenship Status | With Coverage | Without Coverage |
| Native Born | 23 (100.0%) | 0 (0.0%) |
| Foreign Born, Citizen | 35 (100.0%) | 0 (0.0%) |
| Foreign Born, not a Citizen | 29 (100.0%) | 0 (0.0%) |
Health Insurance Coverage by Household Income in Shiloh borough
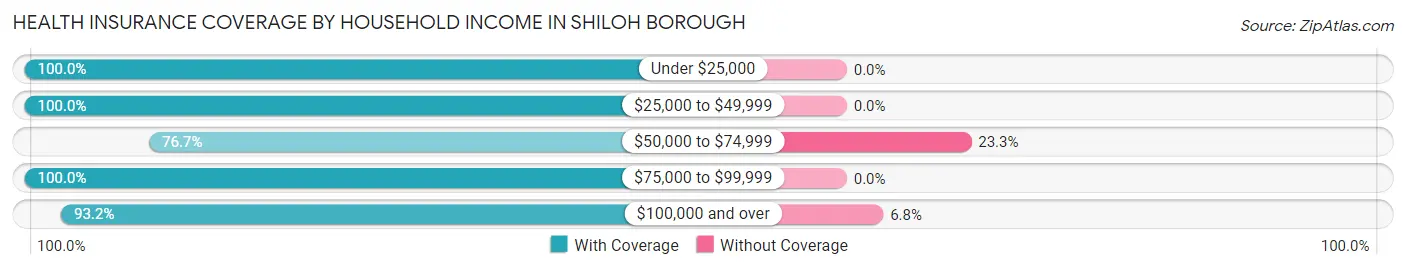
| Household Income | With Coverage | Without Coverage |
| Under $25,000 | 18 (100.0%) | 0 (0.0%) |
| $25,000 to $49,999 | 26 (100.0%) | 0 (0.0%) |
| $50,000 to $74,999 | 46 (76.7%) | 14 (23.3%) |
| $75,000 to $99,999 | 40 (100.0%) | 0 (0.0%) |
| $100,000 and over | 150 (93.2%) | 11 (6.8%) |
Public vs Private Health Insurance Coverage by Age in Shiloh borough
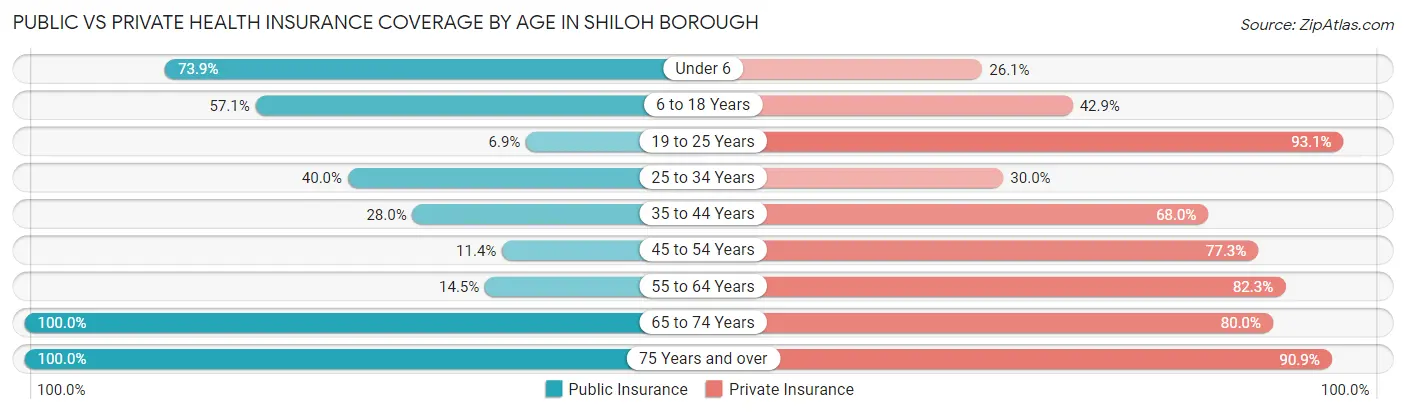
| Age Bracket | Public Insurance | Private Insurance |
| Under 6 | 17 (73.9%) | 6 (26.1%) |
| 6 to 18 Years | 20 (57.1%) | 15 (42.9%) |
| 19 to 25 Years | 2 (6.9%) | 27 (93.1%) |
| 25 to 34 Years | 12 (40.0%) | 9 (30.0%) |
| 35 to 44 Years | 7 (28.0%) | 17 (68.0%) |
| 45 to 54 Years | 5 (11.4%) | 34 (77.3%) |
| 55 to 64 Years | 9 (14.5%) | 51 (82.3%) |
| 65 to 74 Years | 35 (100.0%) | 28 (80.0%) |
| 75 Years and over | 22 (100.0%) | 20 (90.9%) |
| Total | 129 (42.3%) | 207 (67.9%) |
Disability Status by Sex by Age in Shiloh borough
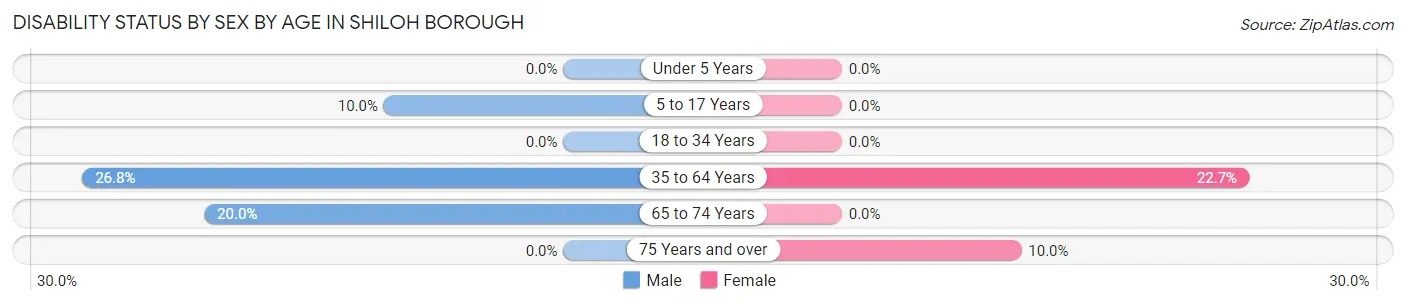
| Age Bracket | Male | Female |
| Under 5 Years | 0 (0.0%) | 0 (0.0%) |
| 5 to 17 Years | 2 (10.0%) | 0 (0.0%) |
| 18 to 34 Years | 0 (0.0%) | 0 (0.0%) |
| 35 to 64 Years | 15 (26.8%) | 17 (22.7%) |
| 65 to 74 Years | 2 (20.0%) | 0 (0.0%) |
| 75 Years and over | 0 (0.0%) | 2 (10.0%) |
Disability Class by Sex by Age in Shiloh borough
Disability Class: Hearing Difficulty
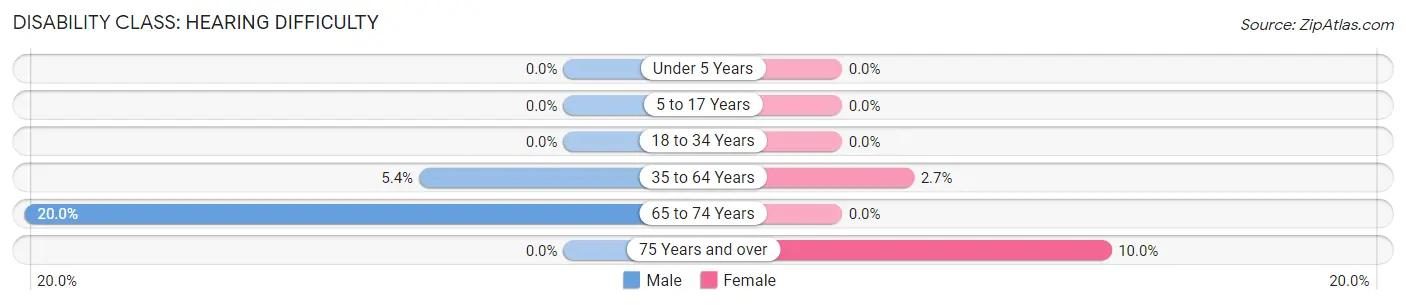
| Age Bracket | Male | Female |
| Under 5 Years | 0 (0.0%) | 0 (0.0%) |
| 5 to 17 Years | 0 (0.0%) | 0 (0.0%) |
| 18 to 34 Years | 0 (0.0%) | 0 (0.0%) |
| 35 to 64 Years | 3 (5.4%) | 2 (2.7%) |
| 65 to 74 Years | 2 (20.0%) | 0 (0.0%) |
| 75 Years and over | 0 (0.0%) | 2 (10.0%) |
Disability Class: Vision Difficulty
| Age Bracket | Male | Female |
| Under 5 Years | 0 (0.0%) | 0 (0.0%) |
| 5 to 17 Years | 0 (0.0%) | 0 (0.0%) |
| 18 to 34 Years | 0 (0.0%) | 0 (0.0%) |
| 35 to 64 Years | 0 (0.0%) | 0 (0.0%) |
| 65 to 74 Years | 0 (0.0%) | 0 (0.0%) |
| 75 Years and over | 0 (0.0%) | 0 (0.0%) |
Disability Class: Cognitive Difficulty
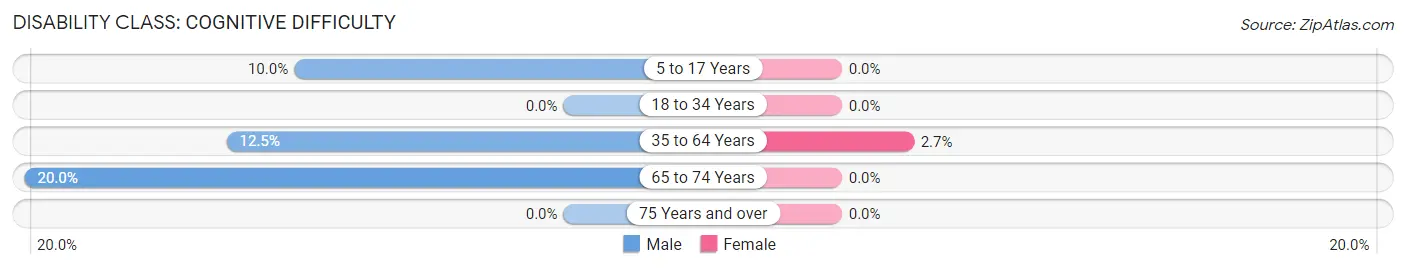
| Age Bracket | Male | Female |
| 5 to 17 Years | 2 (10.0%) | 0 (0.0%) |
| 18 to 34 Years | 0 (0.0%) | 0 (0.0%) |
| 35 to 64 Years | 7 (12.5%) | 2 (2.7%) |
| 65 to 74 Years | 2 (20.0%) | 0 (0.0%) |
| 75 Years and over | 0 (0.0%) | 0 (0.0%) |
Disability Class: Ambulatory Difficulty
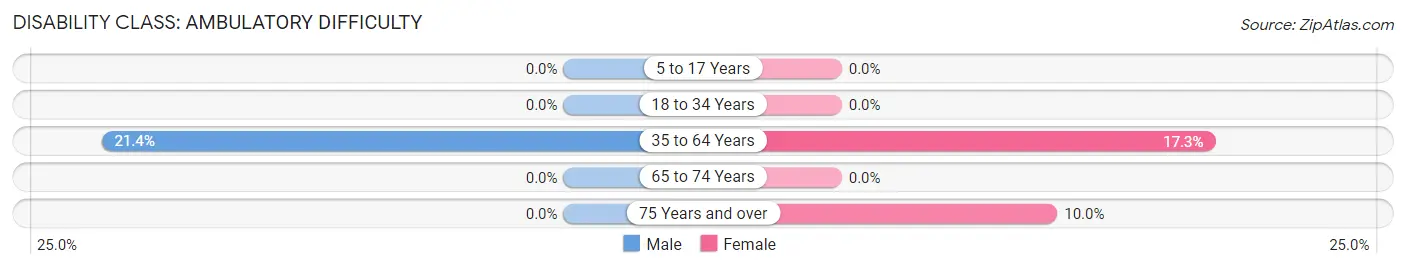
| Age Bracket | Male | Female |
| 5 to 17 Years | 0 (0.0%) | 0 (0.0%) |
| 18 to 34 Years | 0 (0.0%) | 0 (0.0%) |
| 35 to 64 Years | 12 (21.4%) | 13 (17.3%) |
| 65 to 74 Years | 0 (0.0%) | 0 (0.0%) |
| 75 Years and over | 0 (0.0%) | 2 (10.0%) |
Disability Class: Self-Care Difficulty
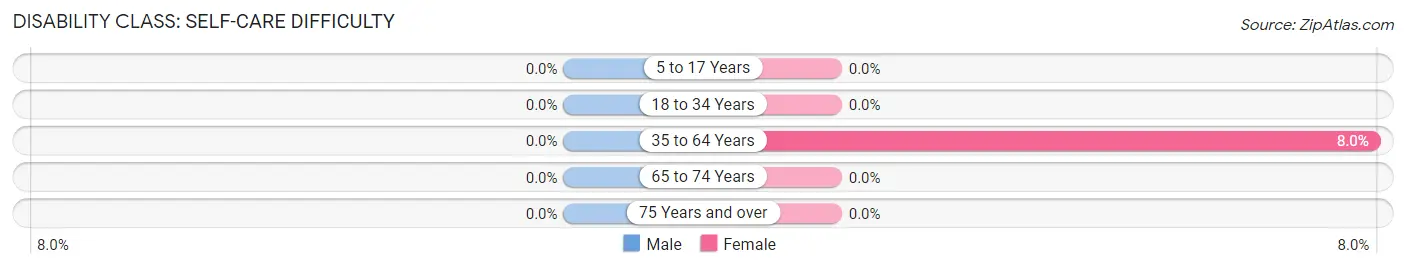
| Age Bracket | Male | Female |
| 5 to 17 Years | 0 (0.0%) | 0 (0.0%) |
| 18 to 34 Years | 0 (0.0%) | 0 (0.0%) |
| 35 to 64 Years | 0 (0.0%) | 6 (8.0%) |
| 65 to 74 Years | 0 (0.0%) | 0 (0.0%) |
| 75 Years and over | 0 (0.0%) | 0 (0.0%) |
Technology Access in Shiloh borough
Computing Device Access in Shiloh borough
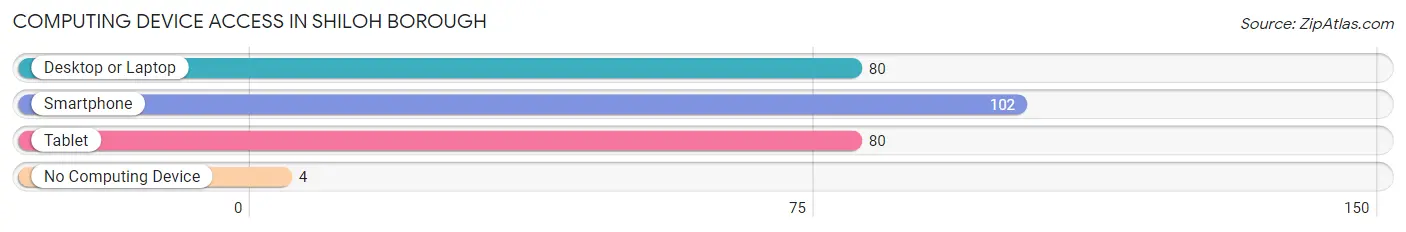
| Device Type | # Households | % Households |
| Desktop or Laptop | 80 | 69.6% |
| Smartphone | 102 | 88.7% |
| Tablet | 80 | 69.6% |
| No Computing Device | 4 | 3.5% |
| Total | 115 | 100.0% |
Internet Access in Shiloh borough
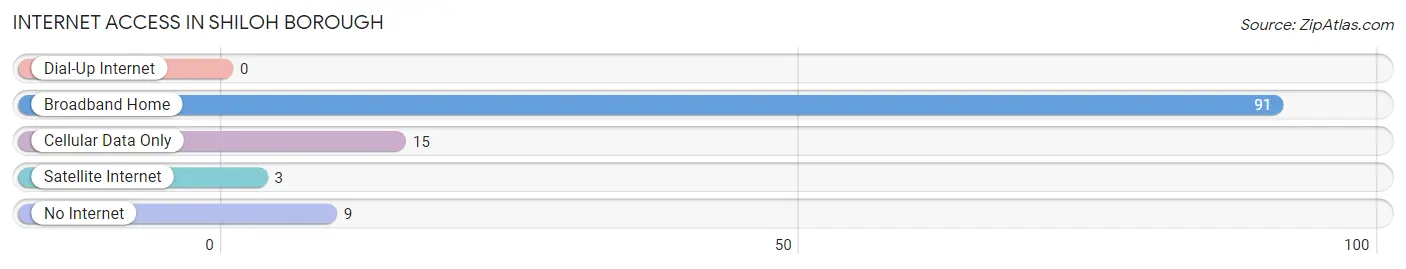
| Internet Type | # Households | % Households |
| Dial-Up Internet | 0 | 0.0% |
| Broadband Home | 91 | 79.1% |
| Cellular Data Only | 15 | 13.0% |
| Satellite Internet | 3 | 2.6% |
| No Internet | 9 | 7.8% |
| Total | 115 | 100.0% |
Shiloh borough Summary
Shiloh Borough is a small borough located in Salem County, New Jersey. It is situated in the southwestern part of the state, about 25 miles from Philadelphia. The borough was incorporated in 1891 and has a population of 1,845 as of the 2010 census.
Geography
Shiloh Borough is located at 39°33'N 75°17'W. It is situated in the southwestern part of Salem County, about 25 miles from Philadelphia. The borough is bordered by Upper Pittsgrove Township to the north, Elmer Borough to the east, Pittsgrove Township to the south, and Alloway Township to the west. The total area of the borough is 1.2 square miles, all of which is land.
The borough is located in the Delaware Valley, which is characterized by rolling hills and flat plains. The climate is humid subtropical, with hot, humid summers and cold, wet winters. The average annual temperature is around 55°F, and the average annual precipitation is around 43 inches.
History
Shiloh Borough was originally part of Upper Pittsgrove Township. It was incorporated as a borough in 1891. The name of the borough is derived from the Bible, specifically the Book of Joshua, which mentions the city of Shiloh.
The borough was originally a farming community, and the main crops were corn, wheat, and oats. In the late 19th century, the borough began to develop into a small industrial center, with several factories and mills being built. The borough also became a popular summer resort destination, with several hotels and resorts being built in the area.
Economy
The economy of Shiloh Borough is largely based on agriculture and manufacturing. The main crops grown in the area are corn, wheat, and oats. There are also several factories and mills in the borough, which produce a variety of products, including paper, textiles, and furniture.
The borough also has a thriving tourism industry, with several hotels and resorts located in the area. The borough is also home to several restaurants, bars, and shops.
Demographics
As of the 2010 census, the population of Shiloh Borough was 1,845. The racial makeup of the borough was 94.3% White, 2.2% African American, 0.3% Native American, 0.7% Asian, 0.1% Pacific Islander, 0.9% from other races, and 1.5% from two or more races. Hispanic or Latino of any race were 3.2% of the population.
The median household income in the borough was $50,972, and the median family income was $60,972. The per capita income was $22,972. About 8.3% of the population was below the poverty line.
The population of Shiloh Borough is largely made up of families, with the majority of households consisting of married couples. The borough is also home to a large number of retirees, with about 25% of the population over the age of 65. The borough is also home to a large number of veterans, with about 10% of the population having served in the military.
Common Questions
What is Per Capita Income in Shiloh borough?
Per Capita income in Shiloh borough is $36,910.
What is the Median Family Income in Shiloh borough?
Median Family Income in Shiloh borough is $99,375.
What is the Median Household income in Shiloh borough?
Median Household Income in Shiloh borough is $87,917.
What is Income or Wage Gap in Shiloh borough?
Income or Wage Gap in Shiloh borough is 2.5%.
Women in Shiloh borough earn 97.5 cents for every dollar earned by a man.
What is Inequality or Gini Index in Shiloh borough?
Inequality or Gini Index in Shiloh borough is 0.31.
What is the Total Population of Shiloh borough?
Total Population of Shiloh borough is 305.
What is the Total Male Population of Shiloh borough?
Total Male Population of Shiloh borough is 117.
What is the Total Female Population of Shiloh borough?
Total Female Population of Shiloh borough is 188.
What is the Ratio of Males per 100 Females in Shiloh borough?
There are 62.23 Males per 100 Females in Shiloh borough.
What is the Ratio of Females per 100 Males in Shiloh borough?
There are 160.68 Females per 100 Males in Shiloh borough.
What is the Median Population Age in Shiloh borough?
Median Population Age in Shiloh borough is 47.9 Years.
What is the Average Family Size in Shiloh borough
Average Family Size in Shiloh borough is 3.2 People.
What is the Average Household Size in Shiloh borough
Average Household Size in Shiloh borough is 2.6 People.
How Large is the Labor Force in Shiloh borough?
There are 160 People in the Labor Forcein in Shiloh borough.
What is the Percentage of People in the Labor Force in Shiloh borough?
64.3% of People are in the Labor Force in Shiloh borough.
What is the Unemployment Rate in Shiloh borough?
Unemployment Rate in Shiloh borough is 9.4%.