Pemberton borough, NJ Map & Demographics
Pemberton borough Overview
$38,637
PER CAPITA INCOME
$86,563
AVG FAMILY INCOME
$85,701
AVG HOUSEHOLD INCOME
19.6%
WAGE / INCOME GAP [ % ]
80.4¢/ $1
WAGE / INCOME GAP [ $ ]
0.38
INEQUALITY / GINI INDEX
1,338
TOTAL POPULATION
609
MALE POPULATION
729
FEMALE POPULATION
83.54
MALES / 100 FEMALES
119.70
FEMALES / 100 MALES
43.7
MEDIAN AGE
2.9
AVG FAMILY SIZE
2.5
AVG HOUSEHOLD SIZE
735
LABOR FORCE [ PEOPLE ]
64.4%
PERCENT IN LABOR FORCE
5.8%
UNEMPLOYMENT RATE
Income in Pemberton borough
Income Overview in Pemberton borough
Per Capita Income in Pemberton borough is $38,637, while median incomes of families and households are $86,563 and $85,701 respectively.
| Characteristic | Number | Measure |
| Per Capita Income | 1,338 | $38,637 |
| Median Family Income | 353 | $86,563 |
| Mean Family Income | 353 | $105,850 |
| Median Household Income | 539 | $85,701 |
| Mean Household Income | 539 | $92,551 |
| Income Deficit | 353 | $0 |
| Wage / Income Gap (%) | 1,338 | 19.56% |
| Wage / Income Gap ($) | 1,338 | 80.44¢ per $1 |
| Gini / Inequality Index | 1,338 | 0.38 |
Earnings by Sex in Pemberton borough
Average Earnings in Pemberton borough are $39,909, $47,169 for men and $37,944 for women, a difference of 19.6%.
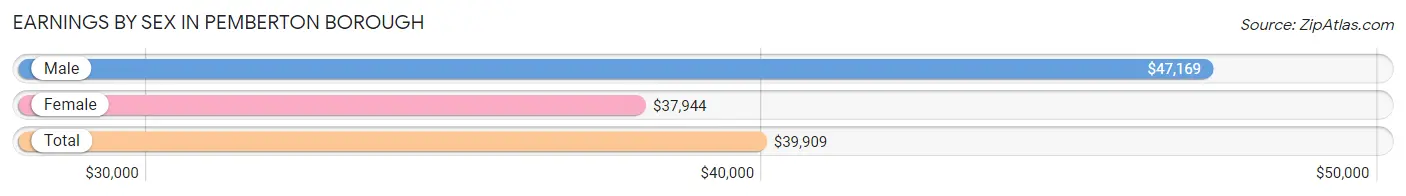
| Sex | Number | Average Earnings |
| Male | 323 (45.2%) | $47,169 |
| Female | 392 (54.8%) | $37,944 |
| Total | 715 (100.0%) | $39,909 |
Earnings by Sex by Income Bracket in Pemberton borough
The most common earnings brackets in Pemberton borough are $75,000 to $99,999 for men (56 | 17.3%) and $35,000 to $39,999 for women (73 | 18.6%).
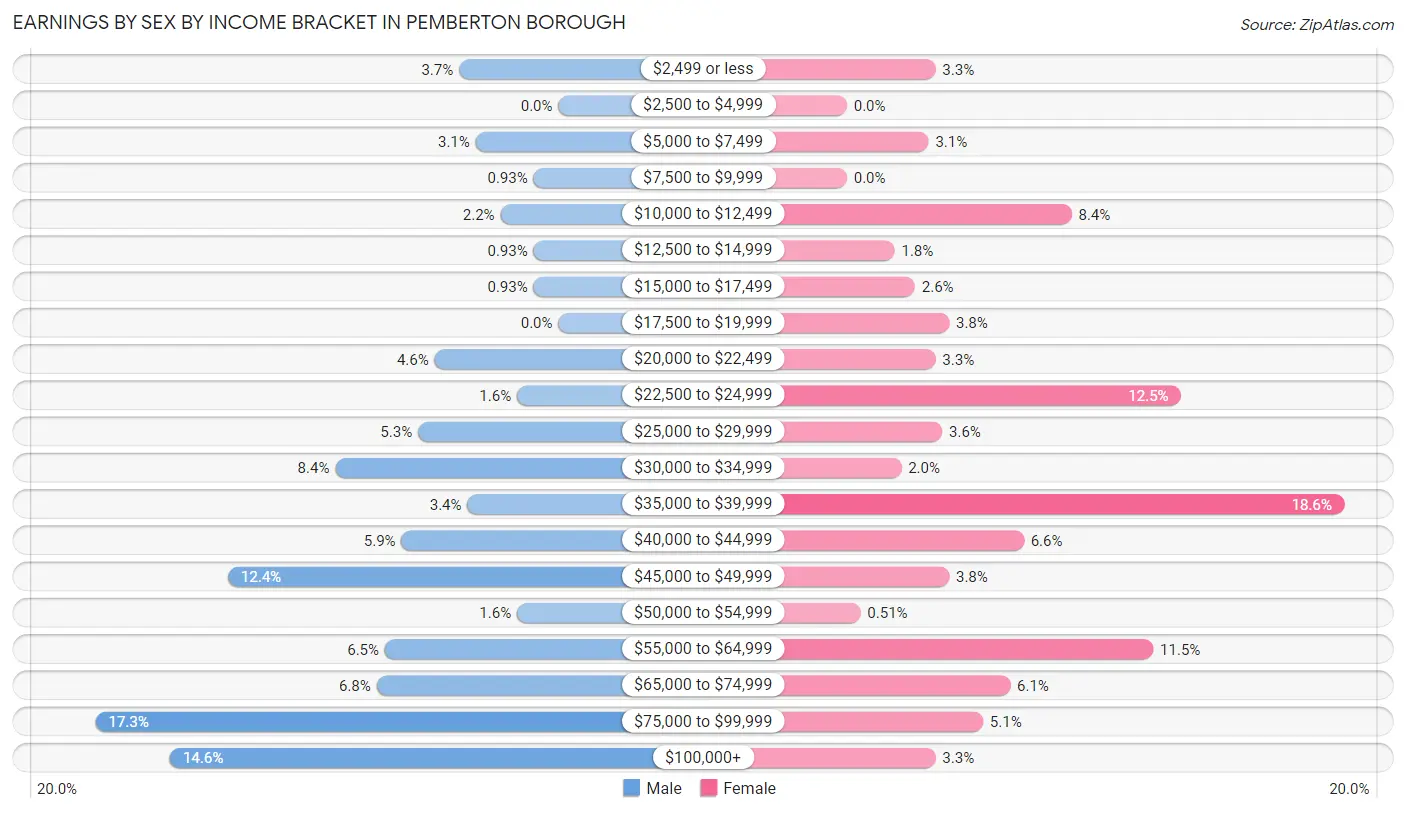
| Income | Male | Female |
| $2,499 or less | 12 (3.7%) | 13 (3.3%) |
| $2,500 to $4,999 | 0 (0.0%) | 0 (0.0%) |
| $5,000 to $7,499 | 10 (3.1%) | 12 (3.1%) |
| $7,500 to $9,999 | 3 (0.9%) | 0 (0.0%) |
| $10,000 to $12,499 | 7 (2.2%) | 33 (8.4%) |
| $12,500 to $14,999 | 3 (0.9%) | 7 (1.8%) |
| $15,000 to $17,499 | 3 (0.9%) | 10 (2.5%) |
| $17,500 to $19,999 | 0 (0.0%) | 15 (3.8%) |
| $20,000 to $22,499 | 15 (4.6%) | 13 (3.3%) |
| $22,500 to $24,999 | 5 (1.5%) | 49 (12.5%) |
| $25,000 to $29,999 | 17 (5.3%) | 14 (3.6%) |
| $30,000 to $34,999 | 27 (8.4%) | 8 (2.0%) |
| $35,000 to $39,999 | 11 (3.4%) | 73 (18.6%) |
| $40,000 to $44,999 | 19 (5.9%) | 26 (6.6%) |
| $45,000 to $49,999 | 40 (12.4%) | 15 (3.8%) |
| $50,000 to $54,999 | 5 (1.5%) | 2 (0.5%) |
| $55,000 to $64,999 | 21 (6.5%) | 45 (11.5%) |
| $65,000 to $74,999 | 22 (6.8%) | 24 (6.1%) |
| $75,000 to $99,999 | 56 (17.3%) | 20 (5.1%) |
| $100,000+ | 47 (14.5%) | 13 (3.3%) |
| Total | 323 (100.0%) | 392 (100.0%) |
Earnings by Sex by Educational Attainment in Pemberton borough
Average earnings in Pemberton borough are $53,750 for men and $39,839 for women, a difference of 25.9%. Men with an educational attainment of graduate degree enjoy the highest average annual earnings of $130,833, while those with less than high school education earn the least with $33,500. Women with an educational attainment of graduate degree earn the most with the average annual earnings of $97,083, while those with college or associate's degree education have the smallest earnings of $38,625.
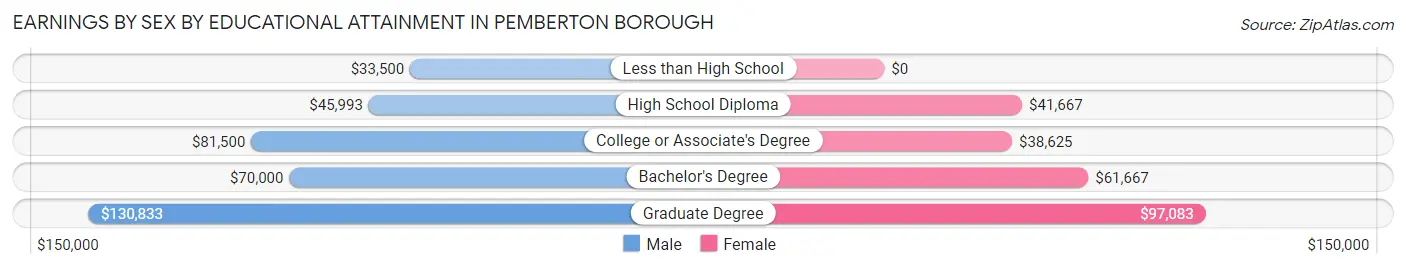
| Educational Attainment | Male Income | Female Income |
| Less than High School | $33,500 | $0 |
| High School Diploma | $45,993 | $41,667 |
| College or Associate's Degree | $81,500 | $38,625 |
| Bachelor's Degree | $70,000 | $61,667 |
| Graduate Degree | $130,833 | $97,083 |
| Total | $53,750 | $39,839 |
Family Income in Pemberton borough
Family Income Brackets in Pemberton borough
According to the Pemberton borough family income data, there are 74 families falling into the $75,000 to $99,999 income range, which is the most common income bracket and makes up 21.0% of all families. Conversely, the less than $10,000 income bracket is the least frequent group with only 8 families (2.3%) belonging to this category.
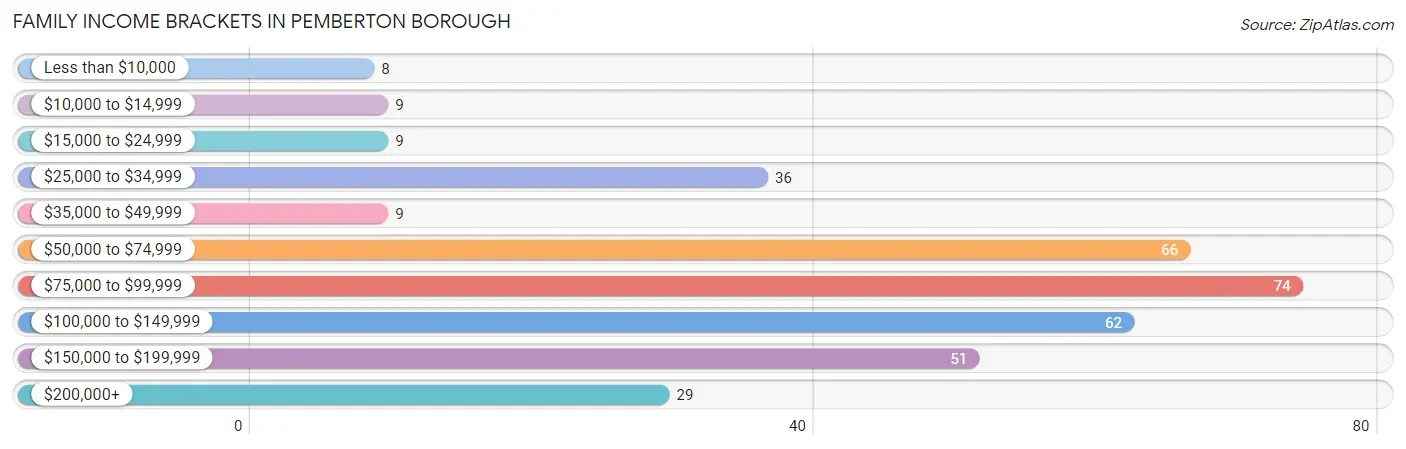
| Income Bracket | # Families | % Families |
| Less than $10,000 | 8 | 2.3% |
| $10,000 to $14,999 | 9 | 2.5% |
| $15,000 to $24,999 | 9 | 2.5% |
| $25,000 to $34,999 | 36 | 10.2% |
| $35,000 to $49,999 | 9 | 2.5% |
| $50,000 to $74,999 | 66 | 18.7% |
| $75,000 to $99,999 | 74 | 21.0% |
| $100,000 to $149,999 | 62 | 17.6% |
| $150,000 to $199,999 | 51 | 14.4% |
| $200,000+ | 29 | 8.2% |
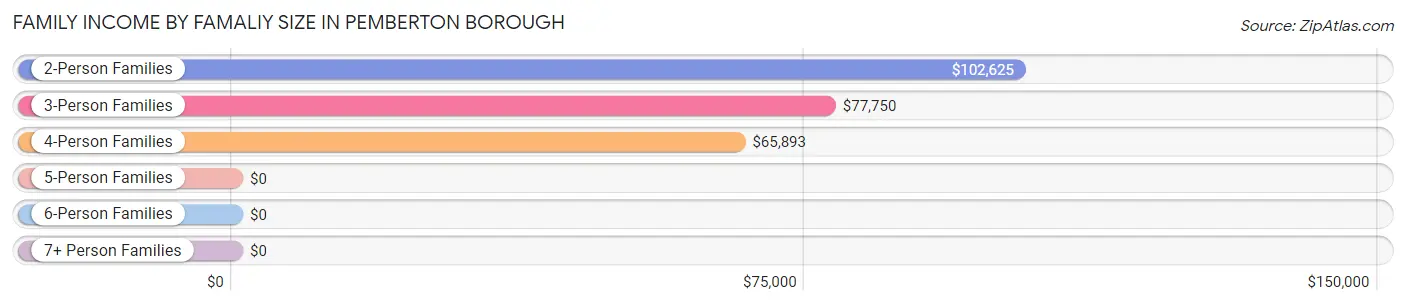
Family Income by Famaliy Size in Pemberton borough
2-person families (185 | 52.4%) account for the highest median family income in Pemberton borough with $102,625 per family, while 2-person families (185 | 52.4%) have the highest median income of $51,312 per family member.
| Income Bracket | # Families | Median Income |
| 2-Person Families | 185 (52.4%) | $102,625 |
| 3-Person Families | 82 (23.2%) | $77,750 |
| 4-Person Families | 73 (20.7%) | $65,893 |
| 5-Person Families | 7 (2.0%) | $0 |
| 6-Person Families | 6 (1.7%) | $0 |
| 7+ Person Families | 0 (0.0%) | $0 |
| Total | 353 (100.0%) | $86,563 |
Family Income by Number of Earners in Pemberton borough
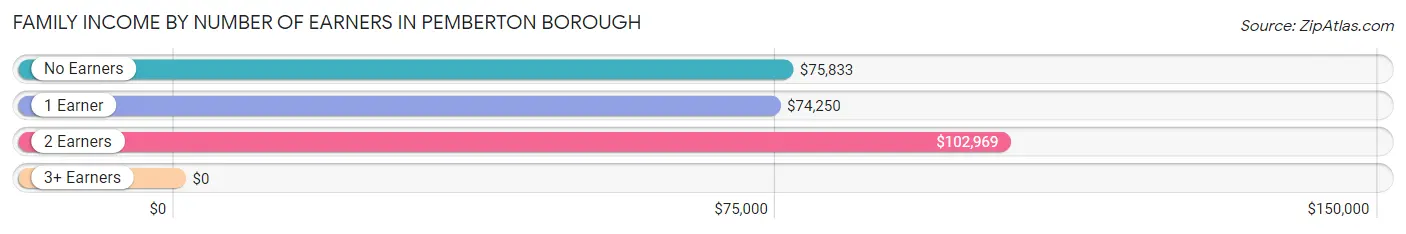
| Number of Earners | # Families | Median Income |
| No Earners | 70 (19.8%) | $75,833 |
| 1 Earner | 123 (34.8%) | $74,250 |
| 2 Earners | 127 (36.0%) | $102,969 |
| 3+ Earners | 33 (9.3%) | $0 |
| Total | 353 (100.0%) | $86,563 |
Household Income in Pemberton borough
Household Income Brackets in Pemberton borough
With 157 households falling in the category, the $75,000 to $99,999 income range is the most frequent in Pemberton borough, accounting for 29.1% of all households. In contrast, only 13 households (2.4%) fall into the $10,000 to $14,999 income bracket, making it the least populous group.
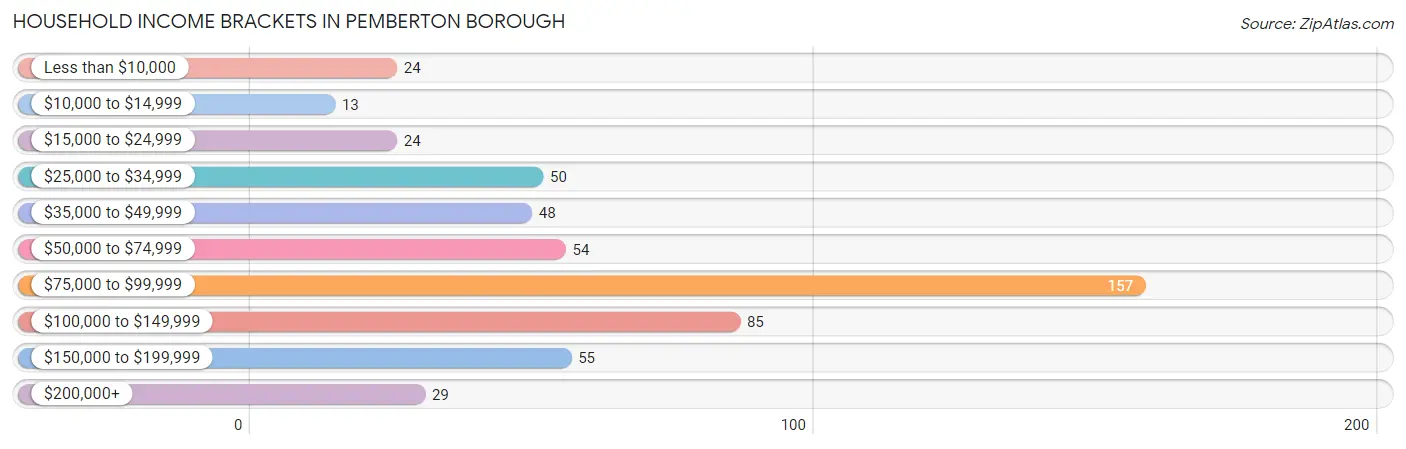
| Income Bracket | # Households | % Households |
| Less than $10,000 | 24 | 4.5% |
| $10,000 to $14,999 | 13 | 2.4% |
| $15,000 to $24,999 | 24 | 4.5% |
| $25,000 to $34,999 | 50 | 9.3% |
| $35,000 to $49,999 | 48 | 8.9% |
| $50,000 to $74,999 | 54 | 10.0% |
| $75,000 to $99,999 | 157 | 29.1% |
| $100,000 to $149,999 | 85 | 15.8% |
| $150,000 to $199,999 | 55 | 10.2% |
| $200,000+ | 29 | 5.4% |
Household Income by Householder Age in Pemberton borough
The median household income in Pemberton borough is $85,701, with the highest median household income of $116,094 found in the 45 to 64 years age bracket for the primary householder. A total of 163 households (30.2%) fall into this category. Meanwhile, the 15 to 24 years age bracket for the primary householder has the lowest median household income of $63,750, with 20 households (3.7%) in this group.
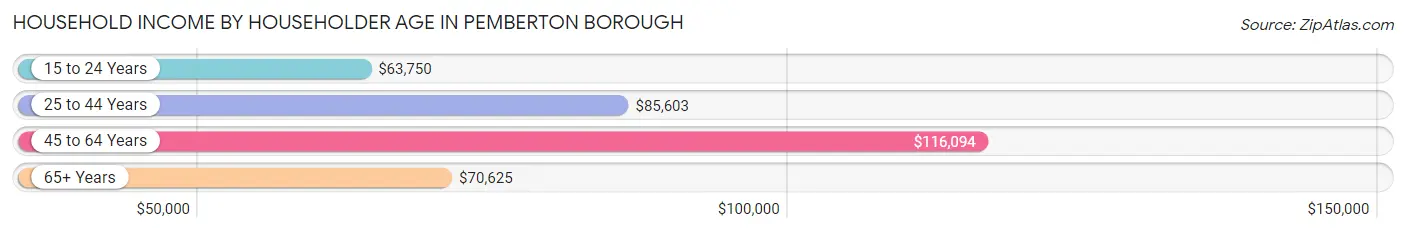
| Income Bracket | # Households | Median Income |
| 15 to 24 Years | 20 (3.7%) | $63,750 |
| 25 to 44 Years | 141 (26.2%) | $85,603 |
| 45 to 64 Years | 163 (30.2%) | $116,094 |
| 65+ Years | 215 (39.9%) | $70,625 |
| Total | 539 (100.0%) | $85,701 |
Poverty in Pemberton borough
Income Below Poverty by Sex and Age in Pemberton borough
With 6.4% poverty level for males and 10.6% for females among the residents of Pemberton borough, 16 and 17 year old males and under 5 year old females are the most vulnerable to poverty, with 6 males (60.0%) and 15 females (44.1%) in their respective age groups living below the poverty level.
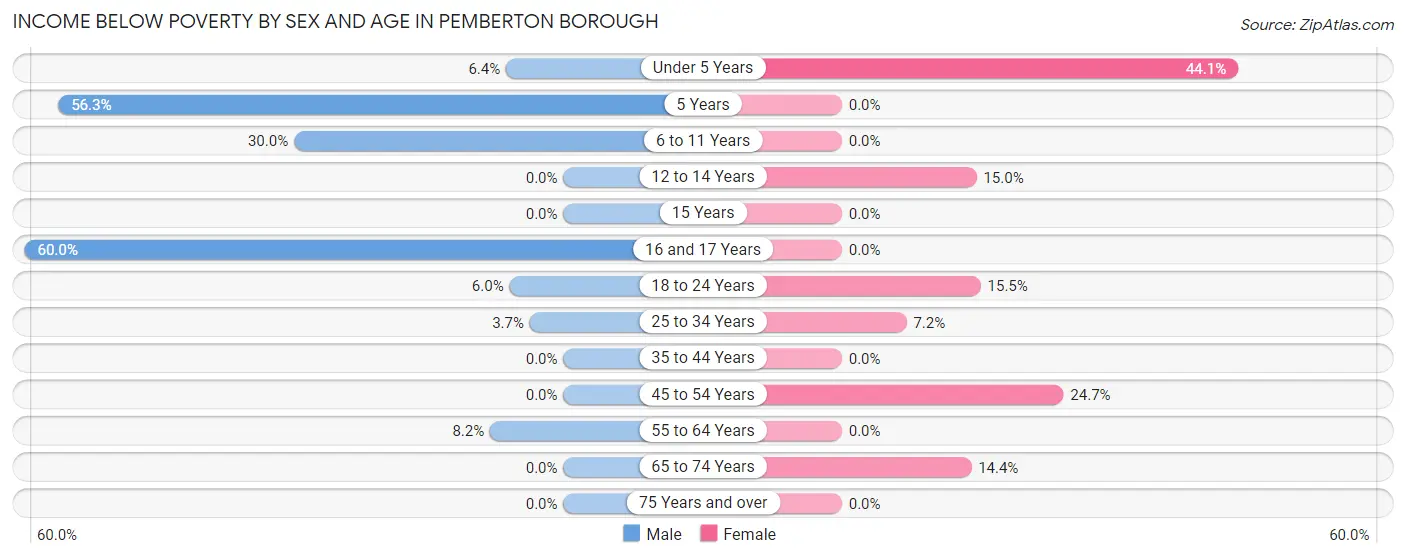
| Age Bracket | Male | Female |
| Under 5 Years | 3 (6.4%) | 15 (44.1%) |
| 5 Years | 9 (56.2%) | 0 (0.0%) |
| 6 to 11 Years | 6 (30.0%) | 0 (0.0%) |
| 12 to 14 Years | 0 (0.0%) | 3 (15.0%) |
| 15 Years | 0 (0.0%) | 0 (0.0%) |
| 16 and 17 Years | 6 (60.0%) | 0 (0.0%) |
| 18 to 24 Years | 3 (6.0%) | 15 (15.5%) |
| 25 to 34 Years | 4 (3.7%) | 9 (7.2%) |
| 35 to 44 Years | 0 (0.0%) | 0 (0.0%) |
| 45 to 54 Years | 0 (0.0%) | 19 (24.7%) |
| 55 to 64 Years | 8 (8.2%) | 0 (0.0%) |
| 65 to 74 Years | 0 (0.0%) | 16 (14.4%) |
| 75 Years and over | 0 (0.0%) | 0 (0.0%) |
| Total | 39 (6.4%) | 77 (10.6%) |
Income Above Poverty by Sex and Age in Pemberton borough
According to the poverty statistics in Pemberton borough, males aged 12 to 14 years and females aged 6 to 11 years are the age groups that are most secure financially, with 100.0% of males and 100.0% of females in these age groups living above the poverty line.
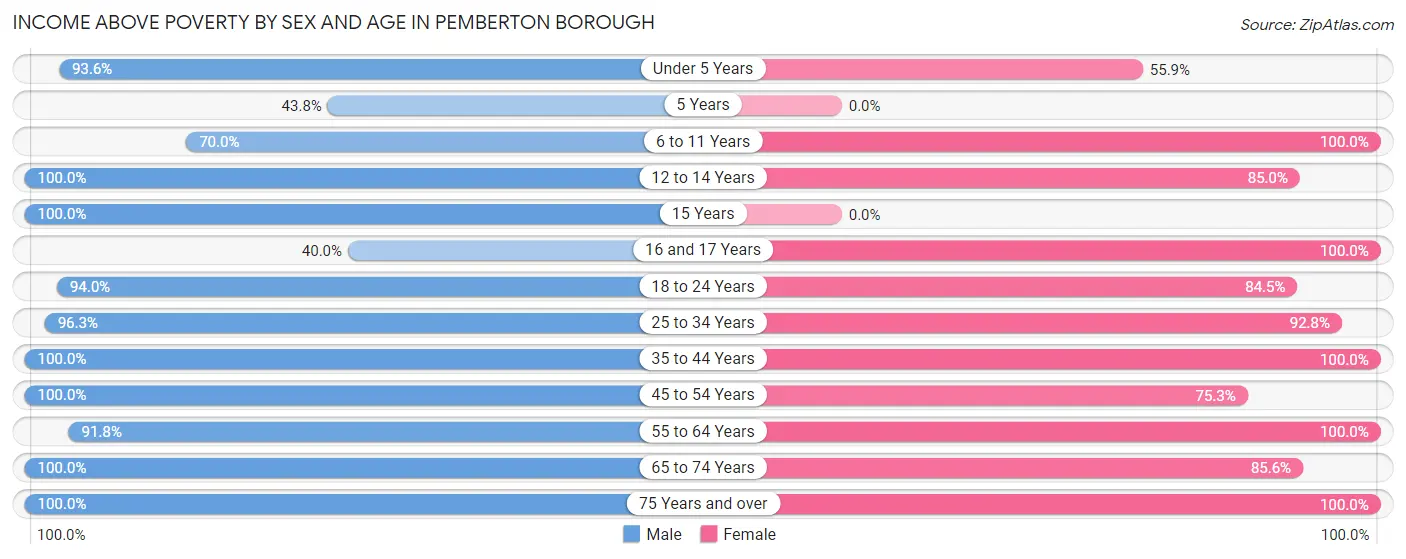
| Age Bracket | Male | Female |
| Under 5 Years | 44 (93.6%) | 19 (55.9%) |
| 5 Years | 7 (43.8%) | 0 (0.0%) |
| 6 to 11 Years | 14 (70.0%) | 49 (100.0%) |
| 12 to 14 Years | 1 (100.0%) | 17 (85.0%) |
| 15 Years | 6 (100.0%) | 0 (0.0%) |
| 16 and 17 Years | 4 (40.0%) | 3 (100.0%) |
| 18 to 24 Years | 47 (94.0%) | 82 (84.5%) |
| 25 to 34 Years | 103 (96.3%) | 116 (92.8%) |
| 35 to 44 Years | 56 (100.0%) | 40 (100.0%) |
| 45 to 54 Years | 56 (100.0%) | 58 (75.3%) |
| 55 to 64 Years | 90 (91.8%) | 110 (100.0%) |
| 65 to 74 Years | 87 (100.0%) | 95 (85.6%) |
| 75 Years and over | 55 (100.0%) | 59 (100.0%) |
| Total | 570 (93.6%) | 648 (89.4%) |
Income Below Poverty Among Married-Couple Families in Pemberton borough
The poverty statistics for married-couple families in Pemberton borough show that 2.4% or 6 of the total 249 families live below the poverty line. Families with 1 or 2 children have the highest poverty rate of 3.7%, comprising of 3 families. On the other hand, families with 3 or 4 children have the lowest poverty rate of 0.0%, which includes 0 families.
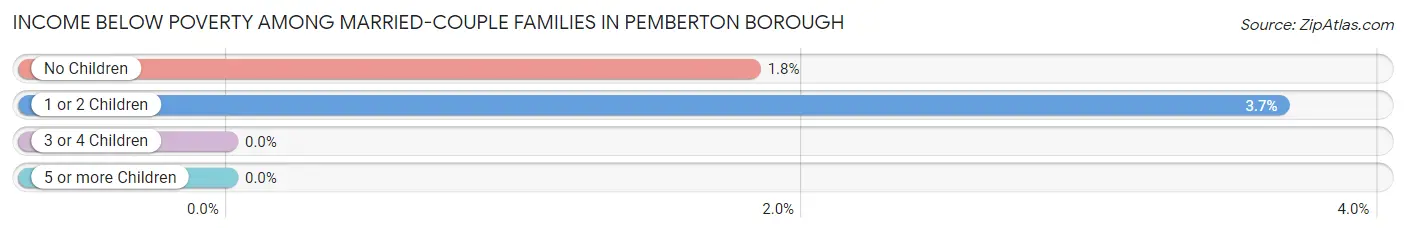
| Children | Above Poverty | Below Poverty |
| No Children | 162 (98.2%) | 3 (1.8%) |
| 1 or 2 Children | 79 (96.3%) | 3 (3.7%) |
| 3 or 4 Children | 2 (100.0%) | 0 (0.0%) |
| 5 or more Children | 0 (0.0%) | 0 (0.0%) |
| Total | 243 (97.6%) | 6 (2.4%) |
Income Below Poverty Among Single-Parent Households in Pemberton borough
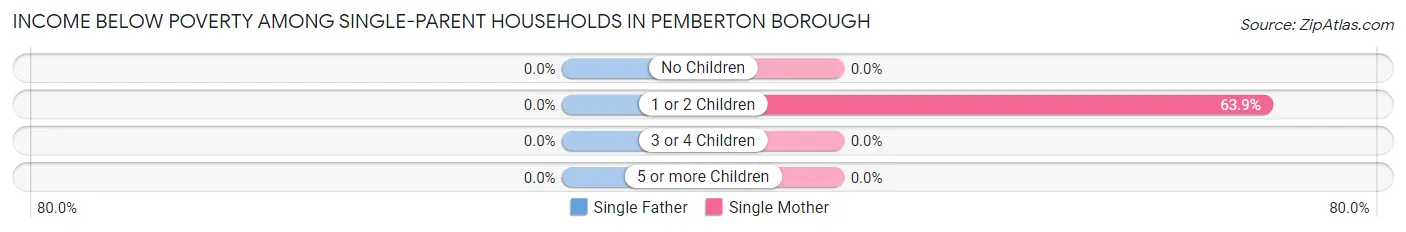
| Children | Single Father | Single Mother |
| No Children | 0 (0.0%) | 0 (0.0%) |
| 1 or 2 Children | 0 (0.0%) | 23 (63.9%) |
| 3 or 4 Children | 0 (0.0%) | 0 (0.0%) |
| 5 or more Children | 0 (0.0%) | 0 (0.0%) |
| Total | 0 (0.0%) | 23 (34.8%) |
Income Below Poverty Among Married-Couple vs Single-Parent Households in Pemberton borough
The poverty data for Pemberton borough shows that 6 of the married-couple family households (2.4%) and 23 of the single-parent households (22.1%) are living below the poverty level. Within the married-couple family households, those with 1 or 2 children have the highest poverty rate, with 3 households (3.7%) falling below the poverty line. Among the single-parent households, those with 1 or 2 children have the highest poverty rate, with 23 household (48.9%) living below poverty.
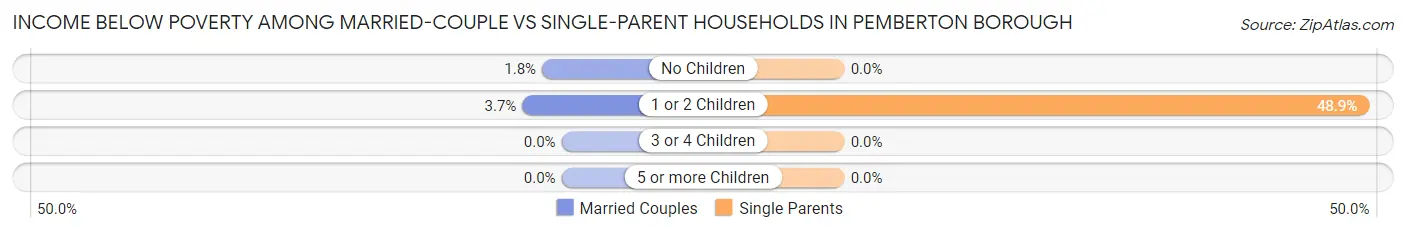
| Children | Married-Couple Families | Single-Parent Households |
| No Children | 3 (1.8%) | 0 (0.0%) |
| 1 or 2 Children | 3 (3.7%) | 23 (48.9%) |
| 3 or 4 Children | 0 (0.0%) | 0 (0.0%) |
| 5 or more Children | 0 (0.0%) | 0 (0.0%) |
| Total | 6 (2.4%) | 23 (22.1%) |
Race in Pemberton borough
The most populous races in Pemberton borough are White / Caucasian (828 | 61.9%), Hispanic or Latino (254 | 19.0%), and Two or more Races (210 | 15.7%).
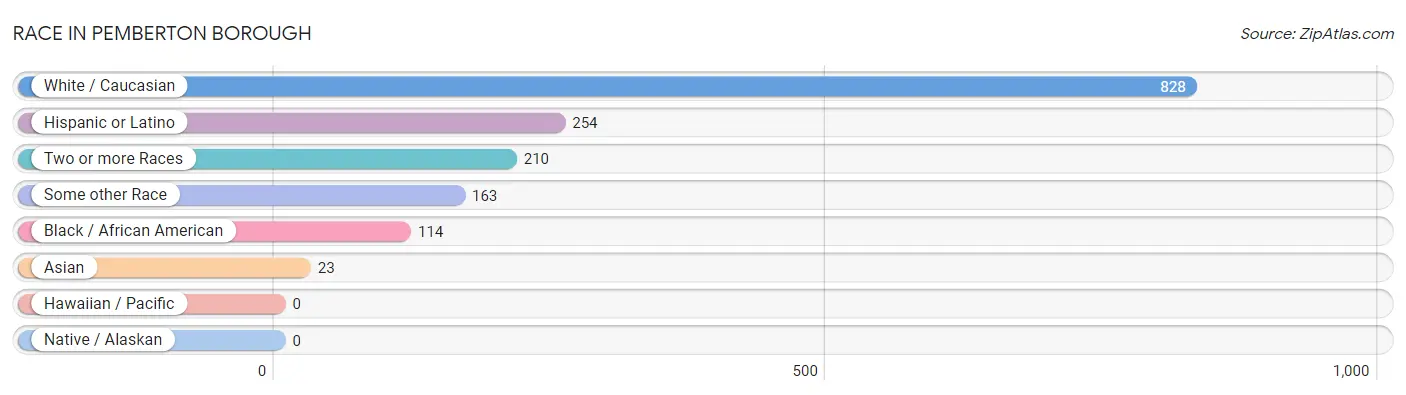
| Race | # Population | % Population |
| Asian | 23 | 1.7% |
| Black / African American | 114 | 8.5% |
| Hawaiian / Pacific | 0 | 0.0% |
| Hispanic or Latino | 254 | 19.0% |
| Native / Alaskan | 0 | 0.0% |
| White / Caucasian | 828 | 61.9% |
| Two or more Races | 210 | 15.7% |
| Some other Race | 163 | 12.2% |
| Total | 1,338 | 100.0% |
Ancestry in Pemberton borough
The most populous ancestries reported in Pemberton borough are English (260 | 19.4%), Irish (199 | 14.9%), Mexican (137 | 10.2%), German (129 | 9.6%), and French (107 | 8.0%), together accounting for 62.2% of all Pemberton borough residents.
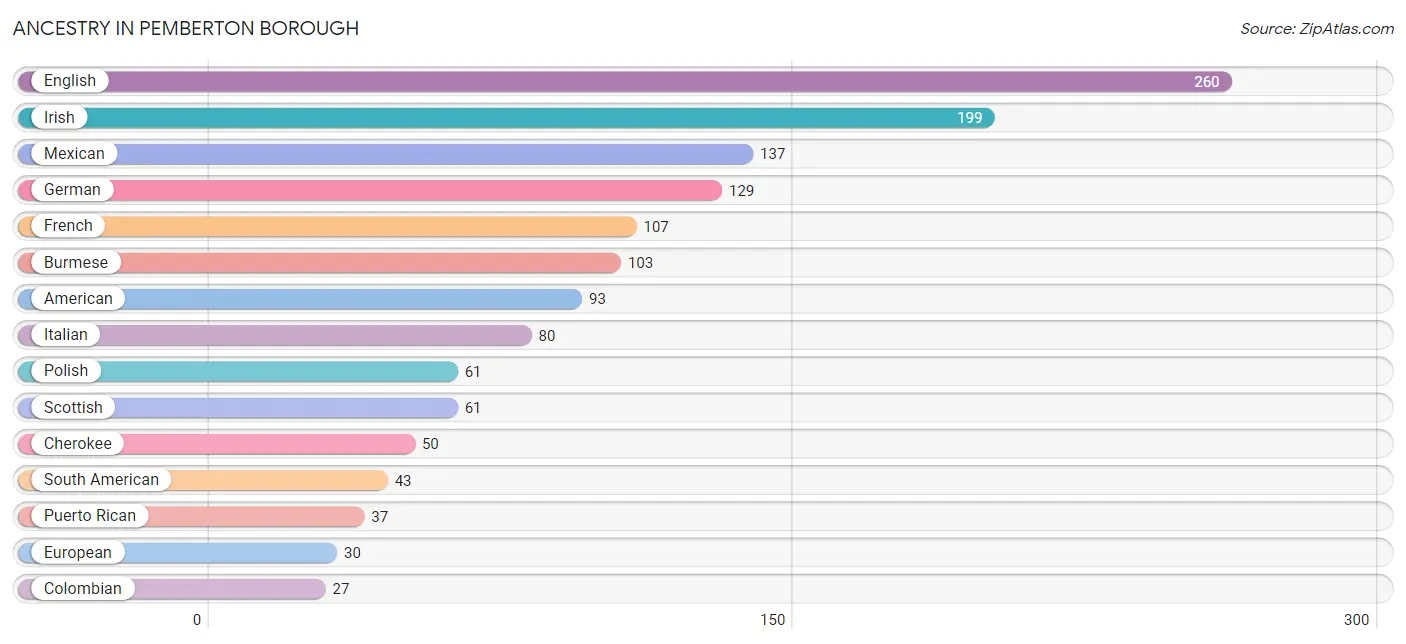
| Ancestry | # Population | % Population |
| American | 93 | 7.0% |
| Argentinean | 2 | 0.2% |
| Bhutanese | 12 | 0.9% |
| British | 8 | 0.6% |
| British West Indian | 4 | 0.3% |
| Burmese | 103 | 7.7% |
| Cajun | 3 | 0.2% |
| Canadian | 2 | 0.2% |
| Central American | 21 | 1.6% |
| Central American Indian | 3 | 0.2% |
| Cherokee | 50 | 3.7% |
| Colombian | 27 | 2.0% |
| Danish | 8 | 0.6% |
| Dominican | 13 | 1.0% |
| English | 260 | 19.4% |
| European | 30 | 2.2% |
| French | 107 | 8.0% |
| French Canadian | 9 | 0.7% |
| German | 129 | 9.6% |
| Greek | 9 | 0.7% |
| Guatemalan | 21 | 1.6% |
| Hungarian | 7 | 0.5% |
| Indian (Asian) | 3 | 0.2% |
| Irish | 199 | 14.9% |
| Italian | 80 | 6.0% |
| Jamaican | 7 | 0.5% |
| Korean | 2 | 0.2% |
| Lithuanian | 12 | 0.9% |
| Mexican | 137 | 10.2% |
| Native Hawaiian | 2 | 0.2% |
| Peruvian | 14 | 1.1% |
| Polish | 61 | 4.6% |
| Portuguese | 3 | 0.2% |
| Puerto Rican | 37 | 2.8% |
| Russian | 7 | 0.5% |
| Scotch-Irish | 6 | 0.4% |
| Scottish | 61 | 4.6% |
| Seminole | 3 | 0.2% |
| South American | 43 | 3.2% |
| Spanish | 3 | 0.2% |
| Swiss | 2 | 0.2% |
| Trinidadian and Tobagonian | 6 | 0.4% |
| Ukrainian | 9 | 0.7% |
| Welsh | 3 | 0.2% |
| Yaqui | 3 | 0.2% | View All 45 Rows |
Immigrants in Pemberton borough
The most numerous immigrant groups reported in Pemberton borough came from Latin America (78 | 5.8%), Central America (47 | 3.5%), Mexico (38 | 2.8%), Asia (23 | 1.7%), and South America (18 | 1.3%), together accounting for 15.2% of all Pemberton borough residents.
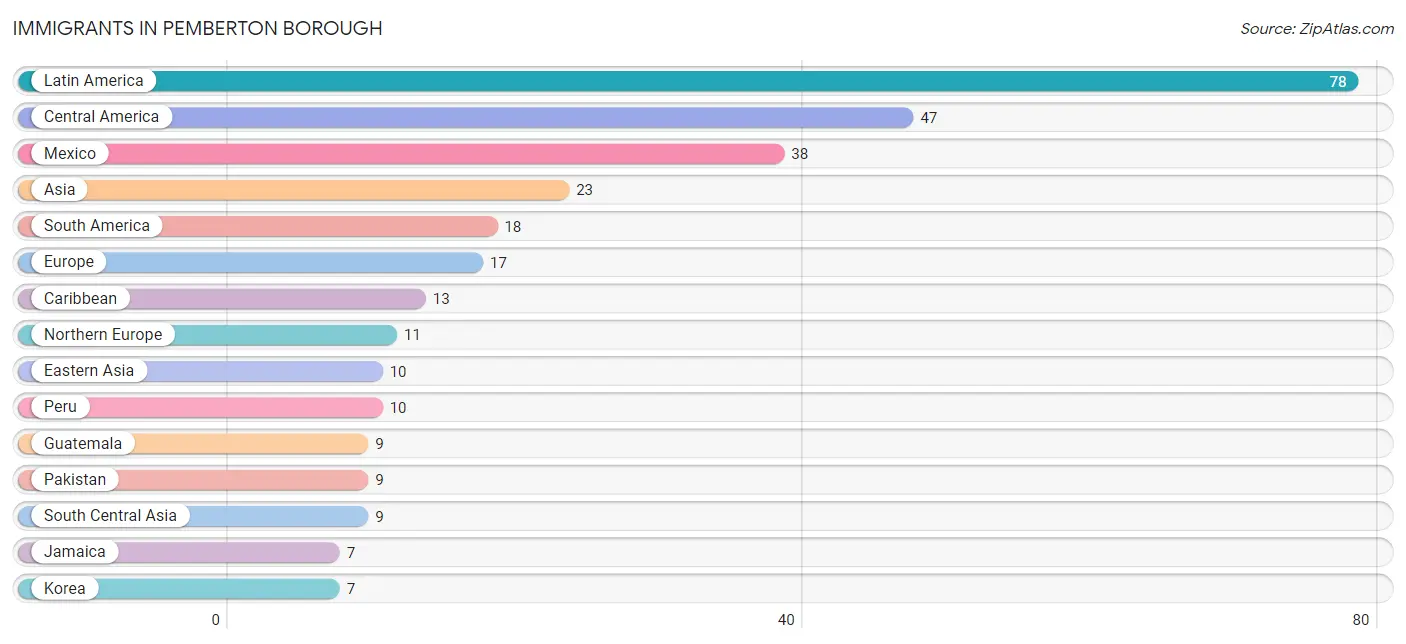
| Immigration Origin | # Population | % Population |
| Argentina | 2 | 0.2% |
| Asia | 23 | 1.7% |
| Caribbean | 13 | 1.0% |
| Central America | 47 | 3.5% |
| Colombia | 6 | 0.4% |
| Eastern Asia | 10 | 0.7% |
| Eastern Europe | 6 | 0.4% |
| England | 3 | 0.2% |
| Europe | 17 | 1.3% |
| Guatemala | 9 | 0.7% |
| Jamaica | 7 | 0.5% |
| Japan | 3 | 0.2% |
| Korea | 7 | 0.5% |
| Latin America | 78 | 5.8% |
| Mexico | 38 | 2.8% |
| Northern Europe | 11 | 0.8% |
| Pakistan | 9 | 0.7% |
| Peru | 10 | 0.7% |
| Philippines | 4 | 0.3% |
| Poland | 6 | 0.4% |
| South America | 18 | 1.3% |
| South Central Asia | 9 | 0.7% |
| South Eastern Asia | 4 | 0.3% |
| Trinidad and Tobago | 6 | 0.4% | View All 24 Rows |
Sex and Age in Pemberton borough
Sex and Age in Pemberton borough
The most populous age groups in Pemberton borough are 25 to 29 Years (64 | 10.5%) for men and 20 to 24 Years (92 | 12.6%) for women.
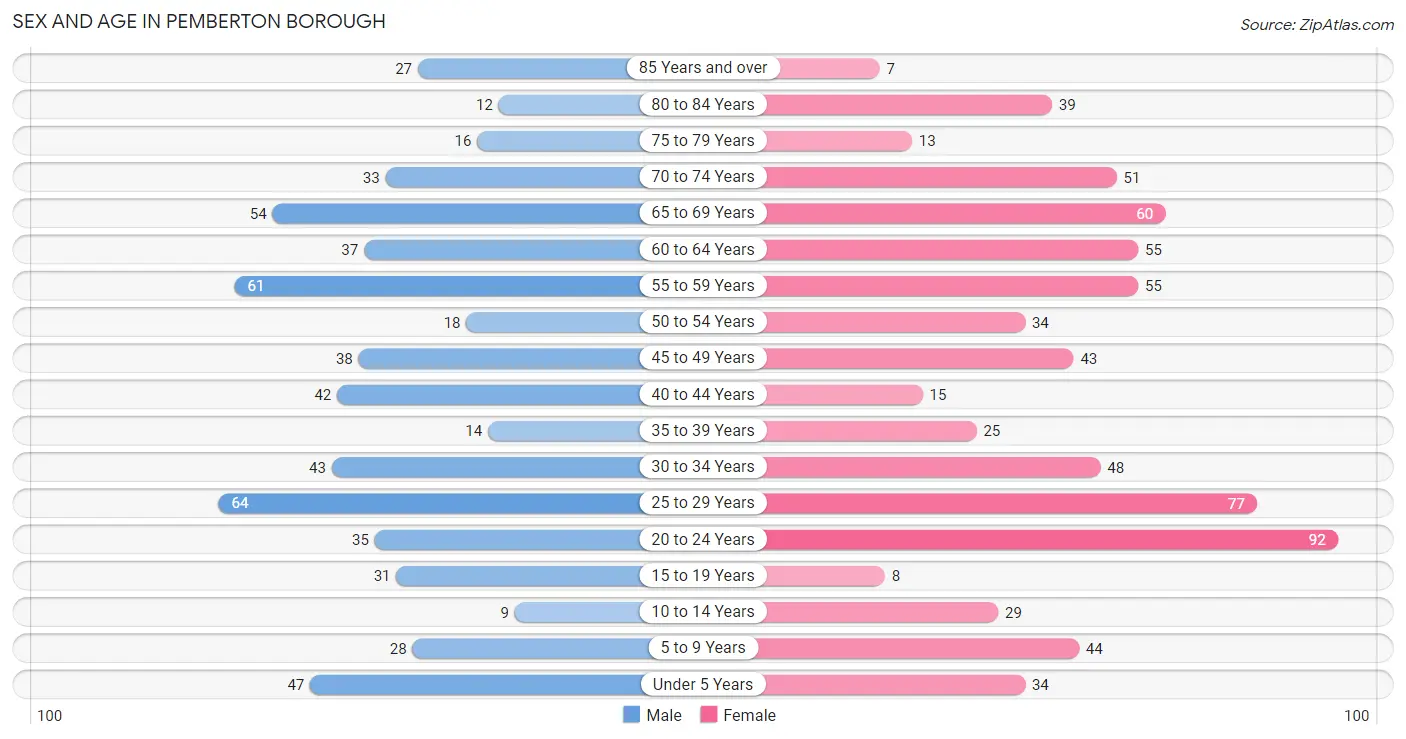
| Age Bracket | Male | Female |
| Under 5 Years | 47 (7.7%) | 34 (4.7%) |
| 5 to 9 Years | 28 (4.6%) | 44 (6.0%) |
| 10 to 14 Years | 9 (1.5%) | 29 (4.0%) |
| 15 to 19 Years | 31 (5.1%) | 8 (1.1%) |
| 20 to 24 Years | 35 (5.8%) | 92 (12.6%) |
| 25 to 29 Years | 64 (10.5%) | 77 (10.6%) |
| 30 to 34 Years | 43 (7.1%) | 48 (6.6%) |
| 35 to 39 Years | 14 (2.3%) | 25 (3.4%) |
| 40 to 44 Years | 42 (6.9%) | 15 (2.1%) |
| 45 to 49 Years | 38 (6.2%) | 43 (5.9%) |
| 50 to 54 Years | 18 (3.0%) | 34 (4.7%) |
| 55 to 59 Years | 61 (10.0%) | 55 (7.5%) |
| 60 to 64 Years | 37 (6.1%) | 55 (7.5%) |
| 65 to 69 Years | 54 (8.9%) | 60 (8.2%) |
| 70 to 74 Years | 33 (5.4%) | 51 (7.0%) |
| 75 to 79 Years | 16 (2.6%) | 13 (1.8%) |
| 80 to 84 Years | 12 (2.0%) | 39 (5.3%) |
| 85 Years and over | 27 (4.4%) | 7 (1.0%) |
| Total | 609 (100.0%) | 729 (100.0%) |
Families and Households in Pemberton borough
Median Family Size in Pemberton borough
The median family size in Pemberton borough is 2.92 persons per family, with single male/father families (38 | 10.8%) accounting for the largest median family size of 3.55 persons per family. On the other hand, single female/mother families (66 | 18.7%) represent the smallest median family size with 2.80 persons per family.
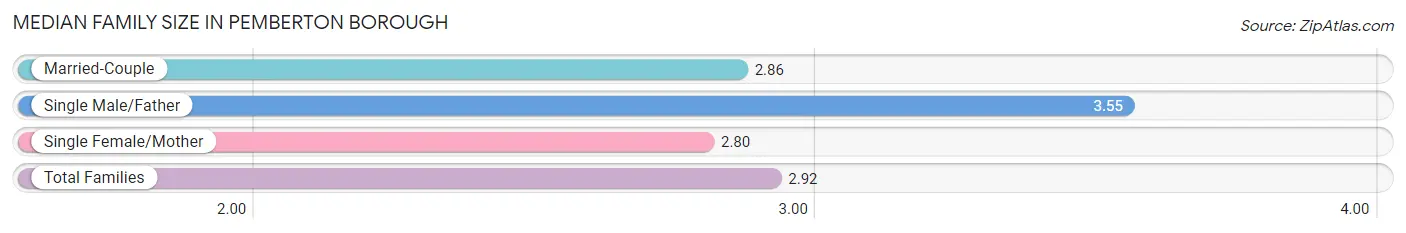
| Family Type | # Families | Family Size |
| Married-Couple | 249 (70.5%) | 2.86 |
| Single Male/Father | 38 (10.8%) | 3.55 |
| Single Female/Mother | 66 (18.7%) | 2.80 |
| Total Families | 353 (100.0%) | 2.92 |
Median Household Size in Pemberton borough
The median household size in Pemberton borough is 2.47 persons per household, with single male/father households (38 | 7.0%) accounting for the largest median household size of 4.61 persons per household. non-family households (186 | 34.5%) represent the smallest median household size with 1.29 persons per household.
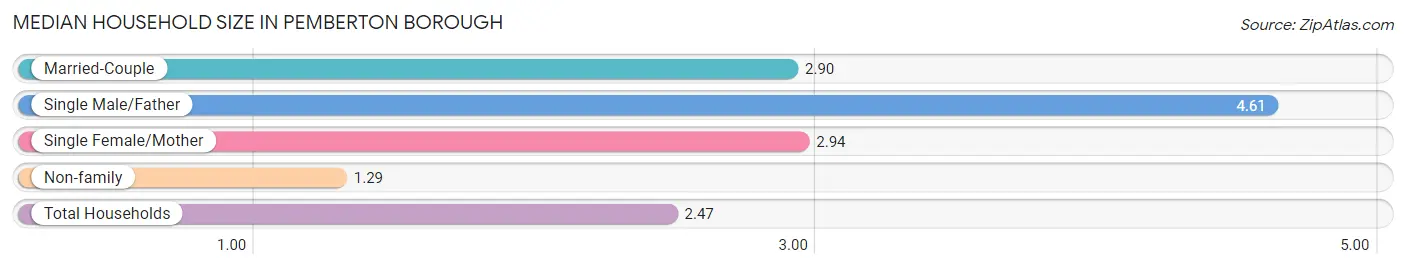
| Household Type | # Households | Household Size |
| Married-Couple | 249 (46.2%) | 2.90 |
| Single Male/Father | 38 (7.0%) | 4.61 |
| Single Female/Mother | 66 (12.2%) | 2.94 |
| Non-family | 186 (34.5%) | 1.29 |
| Total Households | 539 (100.0%) | 2.47 |
Household Size by Marriage Status in Pemberton borough
Out of a total of 539 households in Pemberton borough, 353 (65.5%) are family households, while 186 (34.5%) are nonfamily households. The most numerous type of family households are 2-person households, comprising 182, and the most common type of nonfamily households are 1-person households, comprising 116.
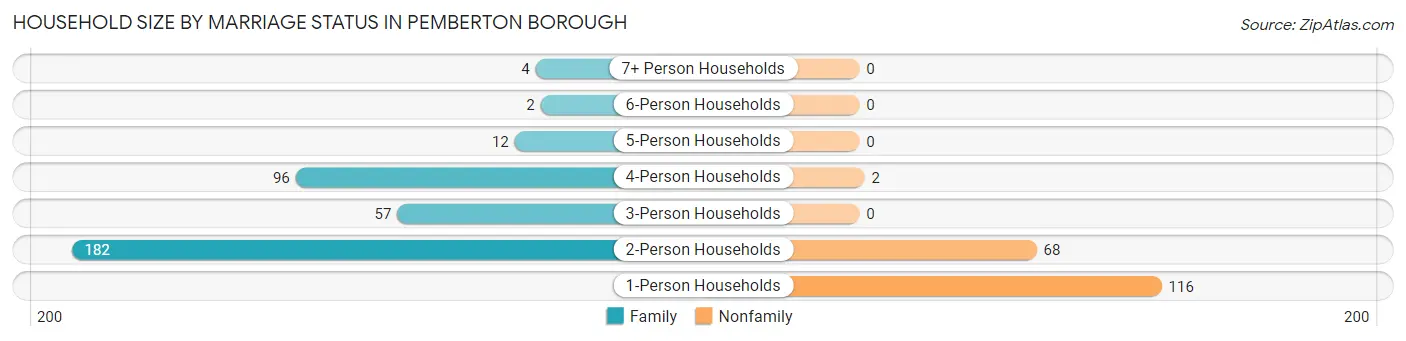
| Household Size | Family Households | Nonfamily Households |
| 1-Person Households | - | 116 (21.5%) |
| 2-Person Households | 182 (33.8%) | 68 (12.6%) |
| 3-Person Households | 57 (10.6%) | 0 (0.0%) |
| 4-Person Households | 96 (17.8%) | 2 (0.4%) |
| 5-Person Households | 12 (2.2%) | 0 (0.0%) |
| 6-Person Households | 2 (0.4%) | 0 (0.0%) |
| 7+ Person Households | 4 (0.7%) | 0 (0.0%) |
| Total | 353 (65.5%) | 186 (34.5%) |
Female Fertility in Pemberton borough
Fertility by Age in Pemberton borough
Average fertility rate in Pemberton borough is 19.0 births per 1,000 women. Women in the age bracket of 20 to 34 years have the highest fertility rate with 28.0 births per 1,000 women. Women in the age bracket of 20 to 34 years acount for 100.0% of all women with births.
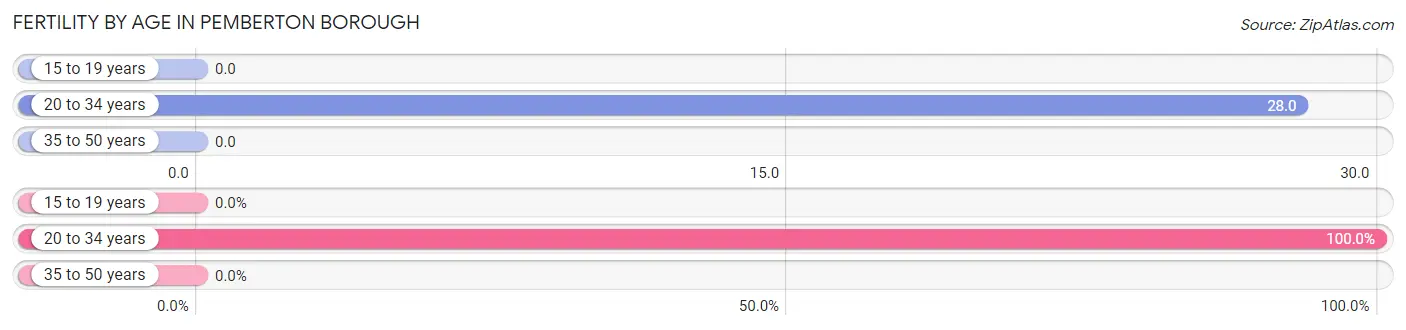
| Age Bracket | Women with Births | Births / 1,000 Women |
| 15 to 19 years | 0 (0.0%) | 0.0 |
| 20 to 34 years | 6 (100.0%) | 28.0 |
| 35 to 50 years | 0 (0.0%) | 0.0 |
| Total | 6 (100.0%) | 19.0 |
Fertility by Age by Marriage Status in Pemberton borough
66.7% of women with births (6) in Pemberton borough are married. The highest percentage of unmarried women with births falls into 20 to 34 years age bracket with 33.3% of them unmarried at the time of birth, while the lowest percentage of unmarried women with births belong to 20 to 34 years age bracket with 33.3% of them unmarried.
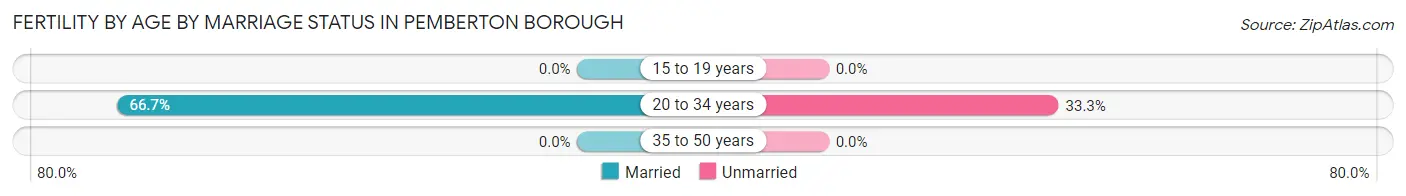
| Age Bracket | Married | Unmarried |
| 15 to 19 years | 0 (0.0%) | 0 (0.0%) |
| 20 to 34 years | 4 (66.7%) | 2 (33.3%) |
| 35 to 50 years | 0 (0.0%) | 0 (0.0%) |
| Total | 4 (66.7%) | 2 (33.3%) |
Fertility by Education in Pemberton borough
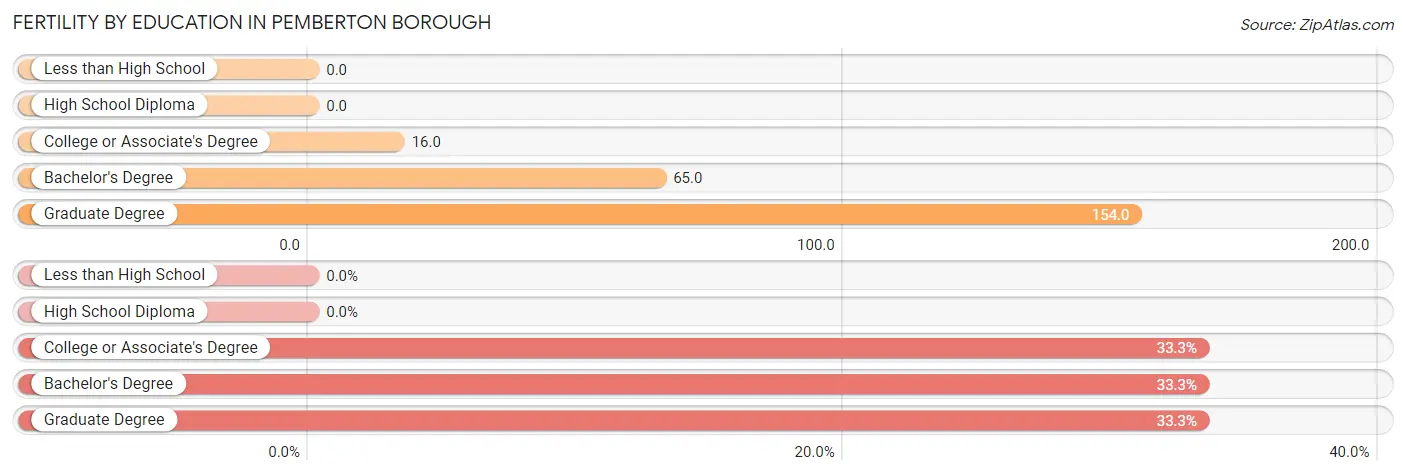
| Educational Attainment | Women with Births | Births / 1,000 Women |
| Less than High School | 0 (0.0%) | 0.0 |
| High School Diploma | 0 (0.0%) | 0.0 |
| College or Associate's Degree | 2 (33.3%) | 16.0 |
| Bachelor's Degree | 2 (33.3%) | 65.0 |
| Graduate Degree | 2 (33.3%) | 154.0 |
| Total | 6 (100.0%) | 19.0 |
Fertility by Education by Marriage Status in Pemberton borough
33.3% of women with births in Pemberton borough are unmarried. Women with the educational attainment of bachelor's degree are most likely to be married with 100.0% of them married at childbirth, while women with the educational attainment of college or associate's degree are least likely to be married with 100.0% of them unmarried at childbirth.
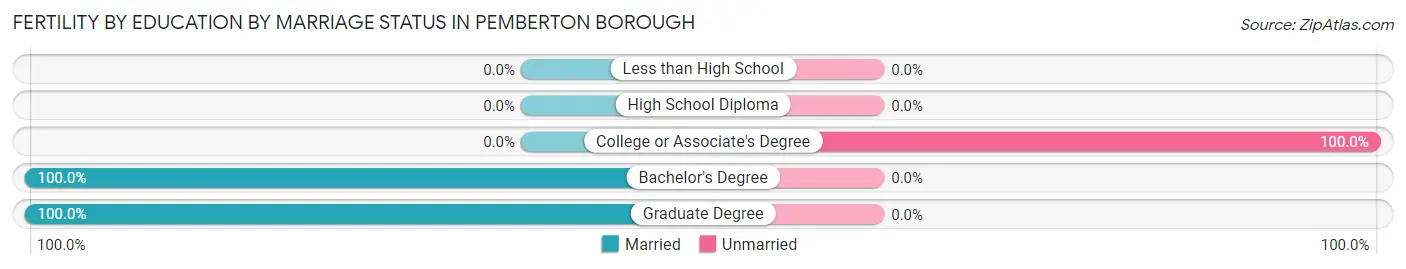
| Educational Attainment | Married | Unmarried |
| Less than High School | 0 (0.0%) | 0 (0.0%) |
| High School Diploma | 0 (0.0%) | 0 (0.0%) |
| College or Associate's Degree | 0 (0.0%) | 2 (100.0%) |
| Bachelor's Degree | 2 (100.0%) | 0 (0.0%) |
| Graduate Degree | 2 (100.0%) | 0 (0.0%) |
| Total | 4 (66.7%) | 2 (33.3%) |
Employment Characteristics in Pemberton borough
Employment by Class of Employer in Pemberton borough
Among the 625 employed individuals in Pemberton borough, private company employees (367 | 58.7%), federal government employees (100 | 16.0%), and local government employees (71 | 11.4%) make up the most common classes of employment.
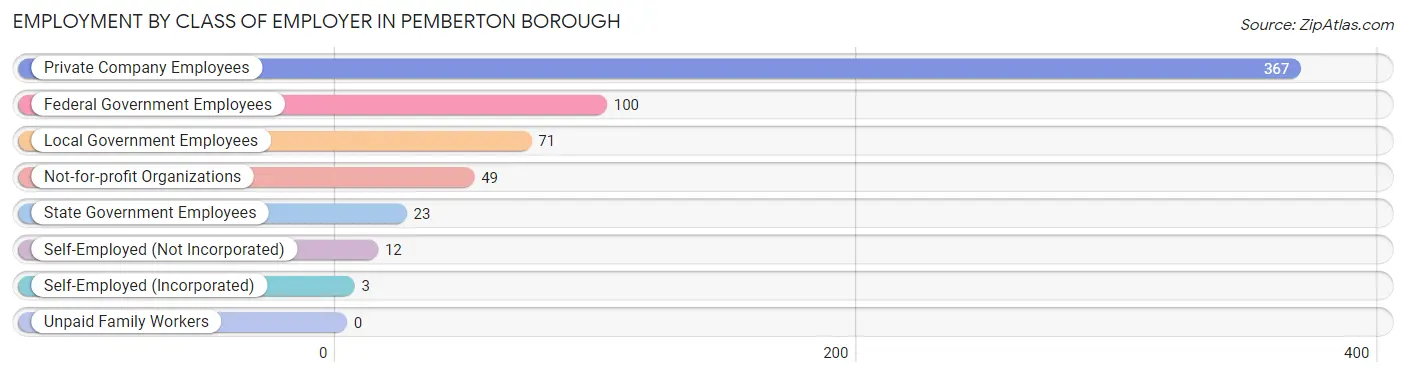
| Employer Class | # Employees | % Employees |
| Private Company Employees | 367 | 58.7% |
| Self-Employed (Incorporated) | 3 | 0.5% |
| Self-Employed (Not Incorporated) | 12 | 1.9% |
| Not-for-profit Organizations | 49 | 7.8% |
| Local Government Employees | 71 | 11.4% |
| State Government Employees | 23 | 3.7% |
| Federal Government Employees | 100 | 16.0% |
| Unpaid Family Workers | 0 | 0.0% |
| Total | 625 | 100.0% |
Employment Status by Age in Pemberton borough
According to the labor force statistics for Pemberton borough, out of the total population over 16 years of age (1,141), 64.4% or 735 individuals are in the labor force, with 5.8% or 43 of them unemployed. The age group with the highest labor force participation rate is 20 to 24 years, with 96.9% or 123 individuals in the labor force. Within the labor force, the 45 to 54 years age range has the highest percentage of unemployed individuals, with 13.4% or 15 of them being unemployed.
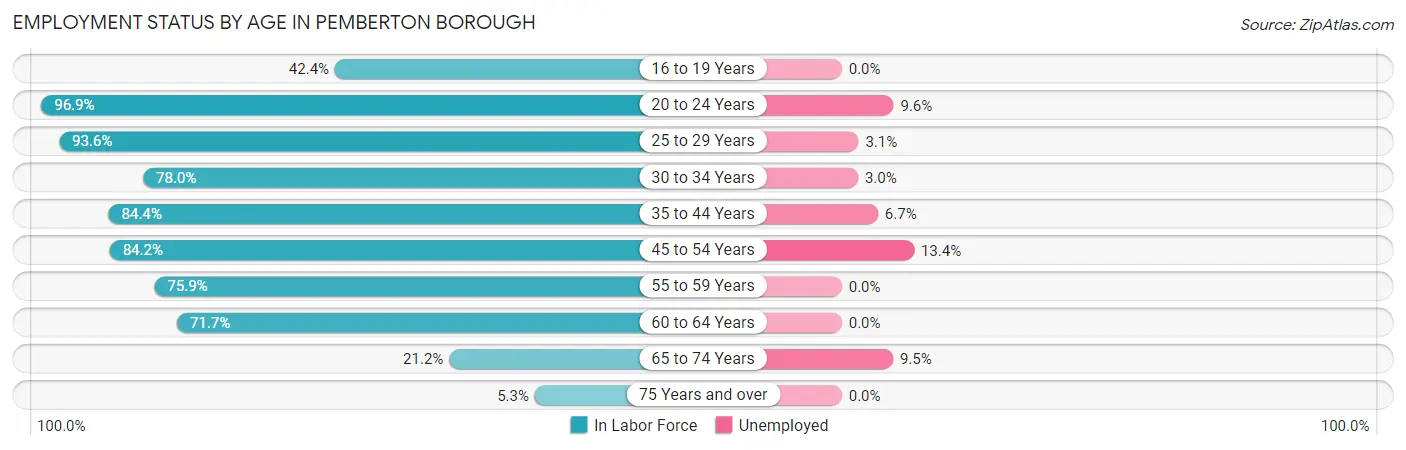
| Age Bracket | In Labor Force | Unemployed |
| 16 to 19 Years | 14 (42.4%) | 0 (0.0%) |
| 20 to 24 Years | 123 (96.9%) | 12 (9.6%) |
| 25 to 29 Years | 132 (93.6%) | 4 (3.1%) |
| 30 to 34 Years | 71 (78.0%) | 2 (3.0%) |
| 35 to 44 Years | 81 (84.4%) | 5 (6.7%) |
| 45 to 54 Years | 112 (84.2%) | 15 (13.4%) |
| 55 to 59 Years | 88 (75.9%) | 0 (0.0%) |
| 60 to 64 Years | 66 (71.7%) | 0 (0.0%) |
| 65 to 74 Years | 42 (21.2%) | 4 (9.5%) |
| 75 Years and over | 6 (5.3%) | 0 (0.0%) |
| Total | 735 (64.4%) | 43 (5.8%) |
Employment Status by Educational Attainment in Pemberton borough
According to labor force statistics for Pemberton borough, 82.2% of individuals (550) out of the total population between 25 and 64 years of age (669) are in the labor force, with 4.9% or 27 of them being unemployed. The group with the highest labor force participation rate are those with the educational attainment of bachelor's degree or higher, with 87.2% or 109 individuals in the labor force. Within the labor force, individuals with college / associate degree education have the highest percentage of unemployment, with 5.7% or 15 of them being unemployed.
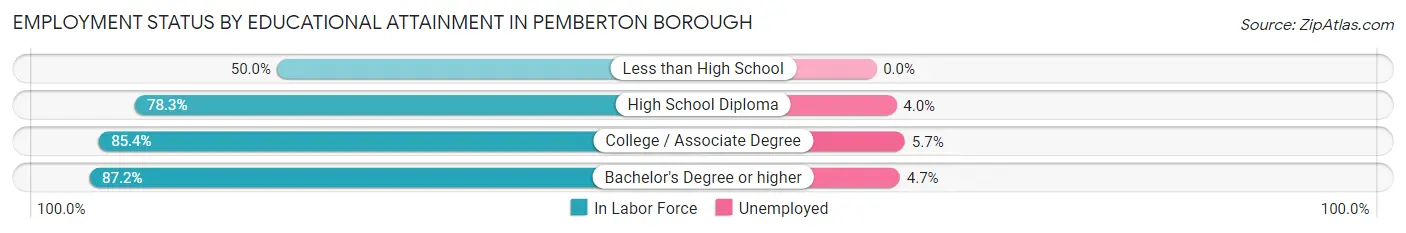
| Educational Attainment | In Labor Force | Unemployed |
| Less than High School | 11 (50.0%) | 0 (0.0%) |
| High School Diploma | 173 (78.3%) | 9 (4.0%) |
| College / Associate Degree | 257 (85.4%) | 17 (5.7%) |
| Bachelor's Degree or higher | 109 (87.2%) | 6 (4.7%) |
| Total | 550 (82.2%) | 33 (4.9%) |
Employment Occupations by Sex in Pemberton borough
Management, Business, Science and Arts Occupations
The most common Management, Business, Science and Arts occupations in Pemberton borough are Management (60 | 9.0%), Community & Social Service (45 | 6.7%), Education Instruction & Library (34 | 5.1%), Business & Financial (24 | 3.6%), and Computers, Engineering & Science (15 | 2.2%).
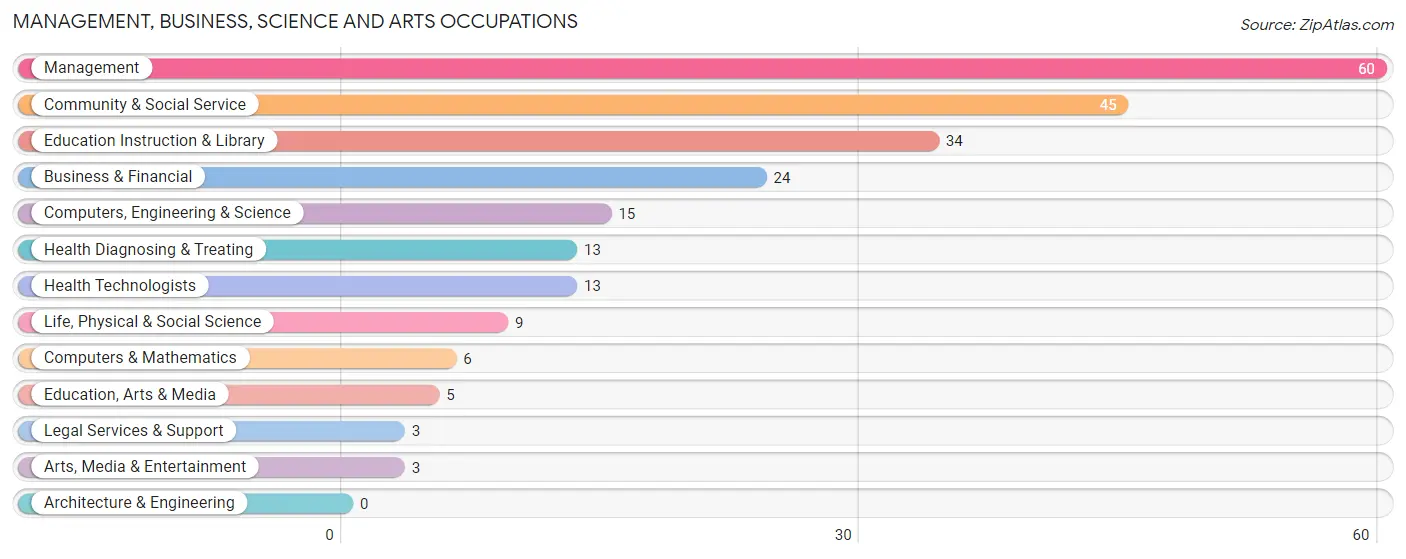
Management, Business, Science and Arts Occupations by Sex
Within the Management, Business, Science and Arts occupations in Pemberton borough, the most male-oriented occupations are Education, Arts & Media (100.0%), Legal Services & Support (100.0%), and Arts, Media & Entertainment (100.0%), while the most female-oriented occupations are Life, Physical & Social Science (100.0%), Education Instruction & Library (85.3%), and Computers, Engineering & Science (80.0%).
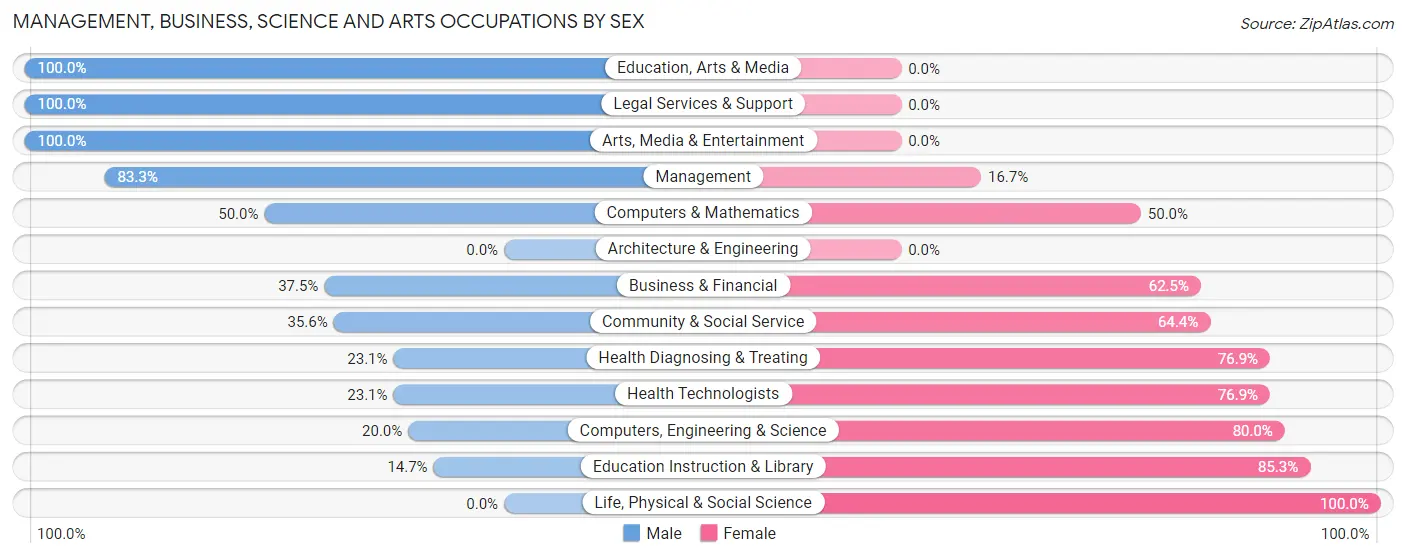
| Occupation | Male | Female |
| Management | 50 (83.3%) | 10 (16.7%) |
| Business & Financial | 9 (37.5%) | 15 (62.5%) |
| Computers, Engineering & Science | 3 (20.0%) | 12 (80.0%) |
| Computers & Mathematics | 3 (50.0%) | 3 (50.0%) |
| Architecture & Engineering | 0 (0.0%) | 0 (0.0%) |
| Life, Physical & Social Science | 0 (0.0%) | 9 (100.0%) |
| Community & Social Service | 16 (35.6%) | 29 (64.4%) |
| Education, Arts & Media | 5 (100.0%) | 0 (0.0%) |
| Legal Services & Support | 3 (100.0%) | 0 (0.0%) |
| Education Instruction & Library | 5 (14.7%) | 29 (85.3%) |
| Arts, Media & Entertainment | 3 (100.0%) | 0 (0.0%) |
| Health Diagnosing & Treating | 3 (23.1%) | 10 (76.9%) |
| Health Technologists | 3 (23.1%) | 10 (76.9%) |
| Total (Category) | 81 (51.6%) | 76 (48.4%) |
| Total (Overall) | 296 (44.2%) | 374 (55.8%) |
Services Occupations
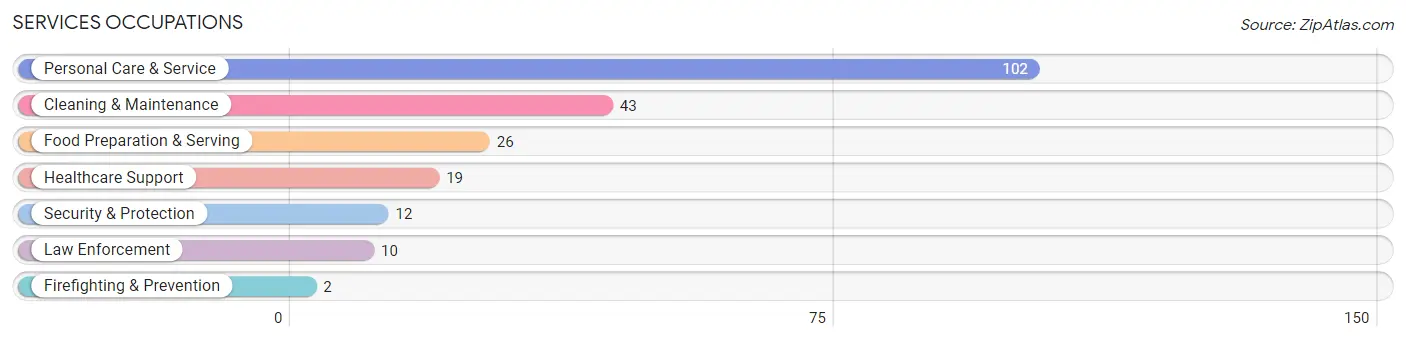
The most common Services occupations in Pemberton borough are Personal Care & Service (102 | 15.2%), Cleaning & Maintenance (43 | 6.4%), Food Preparation & Serving (26 | 3.9%), Healthcare Support (19 | 2.8%), and Security & Protection (12 | 1.8%).
Services Occupations by Sex
Within the Services occupations in Pemberton borough, the most male-oriented occupations are Law Enforcement (100.0%), Security & Protection (83.3%), and Food Preparation & Serving (76.9%), while the most female-oriented occupations are Healthcare Support (100.0%), Firefighting & Prevention (100.0%), and Personal Care & Service (100.0%).
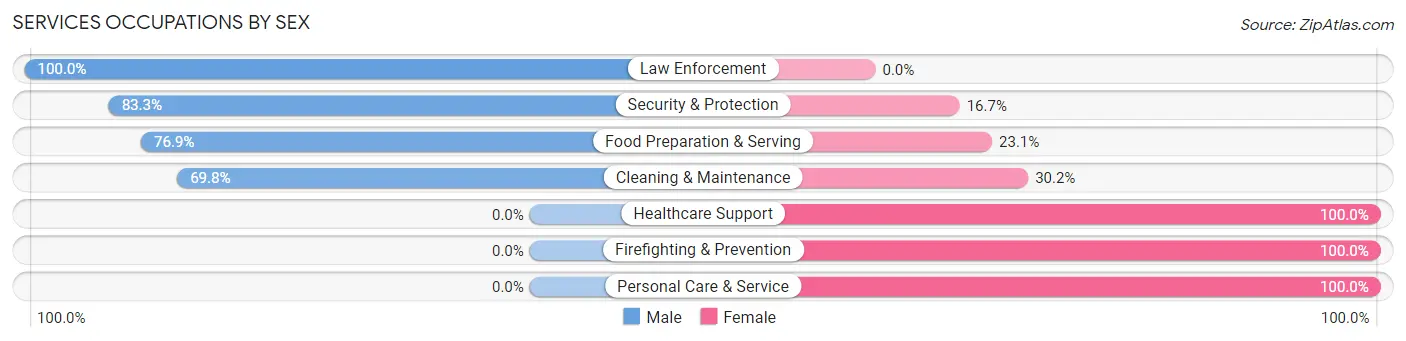
| Occupation | Male | Female |
| Healthcare Support | 0 (0.0%) | 19 (100.0%) |
| Security & Protection | 10 (83.3%) | 2 (16.7%) |
| Firefighting & Prevention | 0 (0.0%) | 2 (100.0%) |
| Law Enforcement | 10 (100.0%) | 0 (0.0%) |
| Food Preparation & Serving | 20 (76.9%) | 6 (23.1%) |
| Cleaning & Maintenance | 30 (69.8%) | 13 (30.2%) |
| Personal Care & Service | 0 (0.0%) | 102 (100.0%) |
| Total (Category) | 60 (29.7%) | 142 (70.3%) |
| Total (Overall) | 296 (44.2%) | 374 (55.8%) |
Sales and Office Occupations
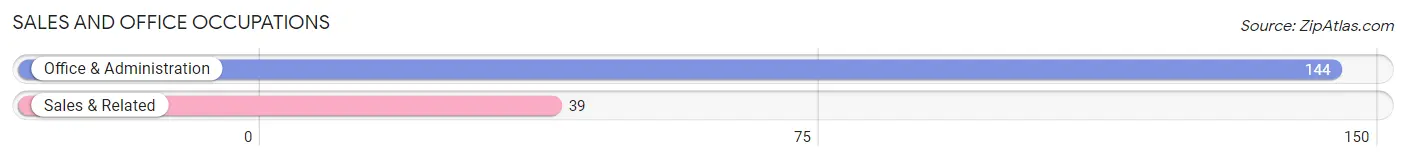
The most common Sales and Office occupations in Pemberton borough are Office & Administration (144 | 21.5%), and Sales & Related (39 | 5.8%).
Sales and Office Occupations by Sex
| Occupation | Male | Female |
| Sales & Related | 19 (48.7%) | 20 (51.3%) |
| Office & Administration | 13 (9.0%) | 131 (91.0%) |
| Total (Category) | 32 (17.5%) | 151 (82.5%) |
| Total (Overall) | 296 (44.2%) | 374 (55.8%) |
Natural Resources, Construction and Maintenance Occupations
The most common Natural Resources, Construction and Maintenance occupations in Pemberton borough are Construction & Extraction (45 | 6.7%), and Installation, Maintenance & Repair (40 | 6.0%).
Natural Resources, Construction and Maintenance Occupations by Sex
| Occupation | Male | Female |
| Farming, Fishing & Forestry | 0 (0.0%) | 0 (0.0%) |
| Construction & Extraction | 45 (100.0%) | 0 (0.0%) |
| Installation, Maintenance & Repair | 40 (100.0%) | 0 (0.0%) |
| Total (Category) | 85 (100.0%) | 0 (0.0%) |
| Total (Overall) | 296 (44.2%) | 374 (55.8%) |
Production, Transportation and Moving Occupations
The most common Production, Transportation and Moving occupations in Pemberton borough are Transportation (19 | 2.8%), Production (13 | 1.9%), and Material Moving (11 | 1.6%).
Production, Transportation and Moving Occupations by Sex
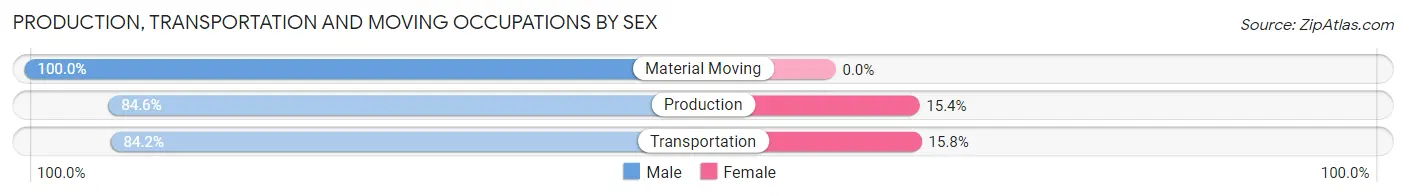
| Occupation | Male | Female |
| Production | 11 (84.6%) | 2 (15.4%) |
| Transportation | 16 (84.2%) | 3 (15.8%) |
| Material Moving | 11 (100.0%) | 0 (0.0%) |
| Total (Category) | 38 (88.4%) | 5 (11.6%) |
| Total (Overall) | 296 (44.2%) | 374 (55.8%) |
Employment Industries by Sex in Pemberton borough
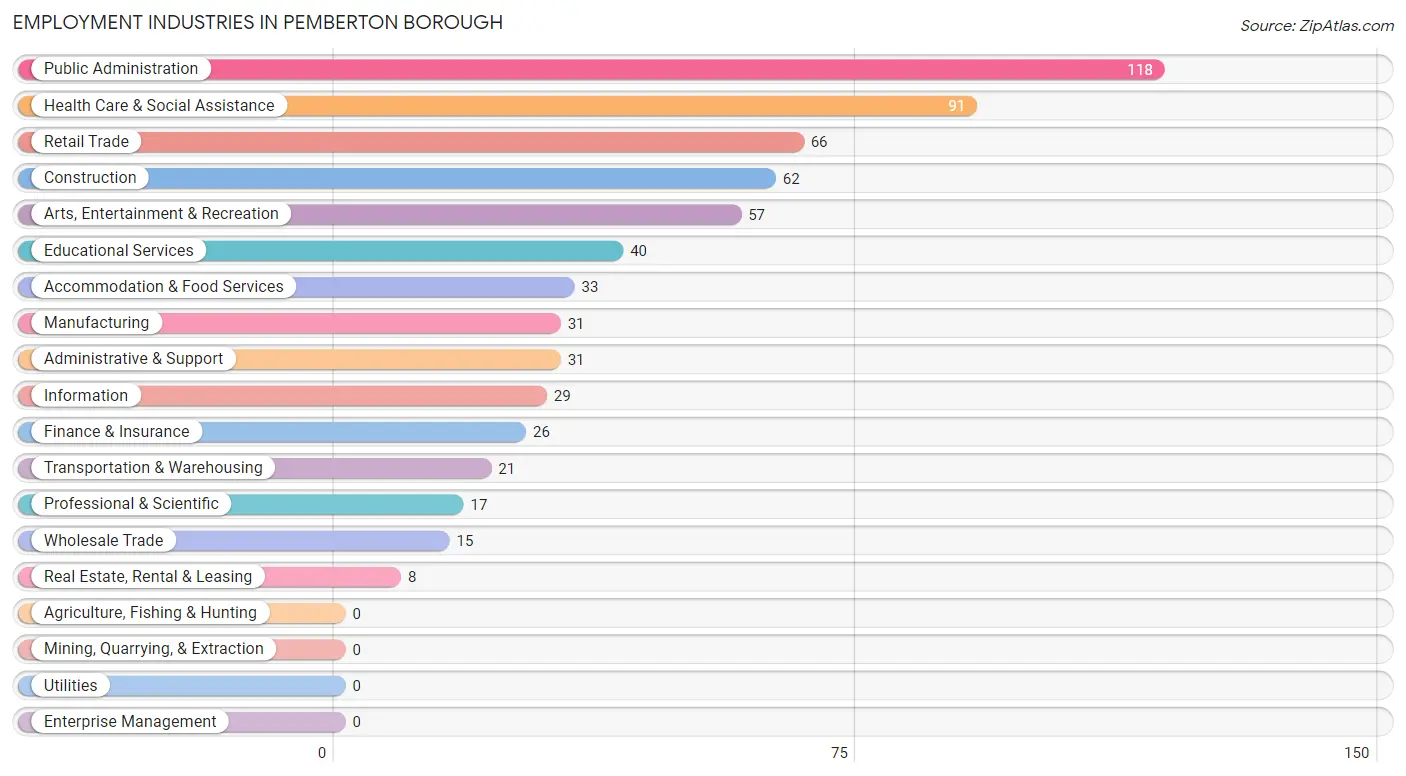
Employment Industries in Pemberton borough
The major employment industries in Pemberton borough include Public Administration (118 | 17.6%), Health Care & Social Assistance (91 | 13.6%), Retail Trade (66 | 9.9%), Construction (62 | 9.2%), and Arts, Entertainment & Recreation (57 | 8.5%).
Employment Industries by Sex in Pemberton borough
The Pemberton borough industries that see more men than women are Accommodation & Food Services (90.9%), Construction (90.3%), and Information (89.7%), whereas the industries that tend to have a higher number of women are Finance & Insurance (100.0%), Health Care & Social Assistance (96.7%), and Arts, Entertainment & Recreation (94.7%).
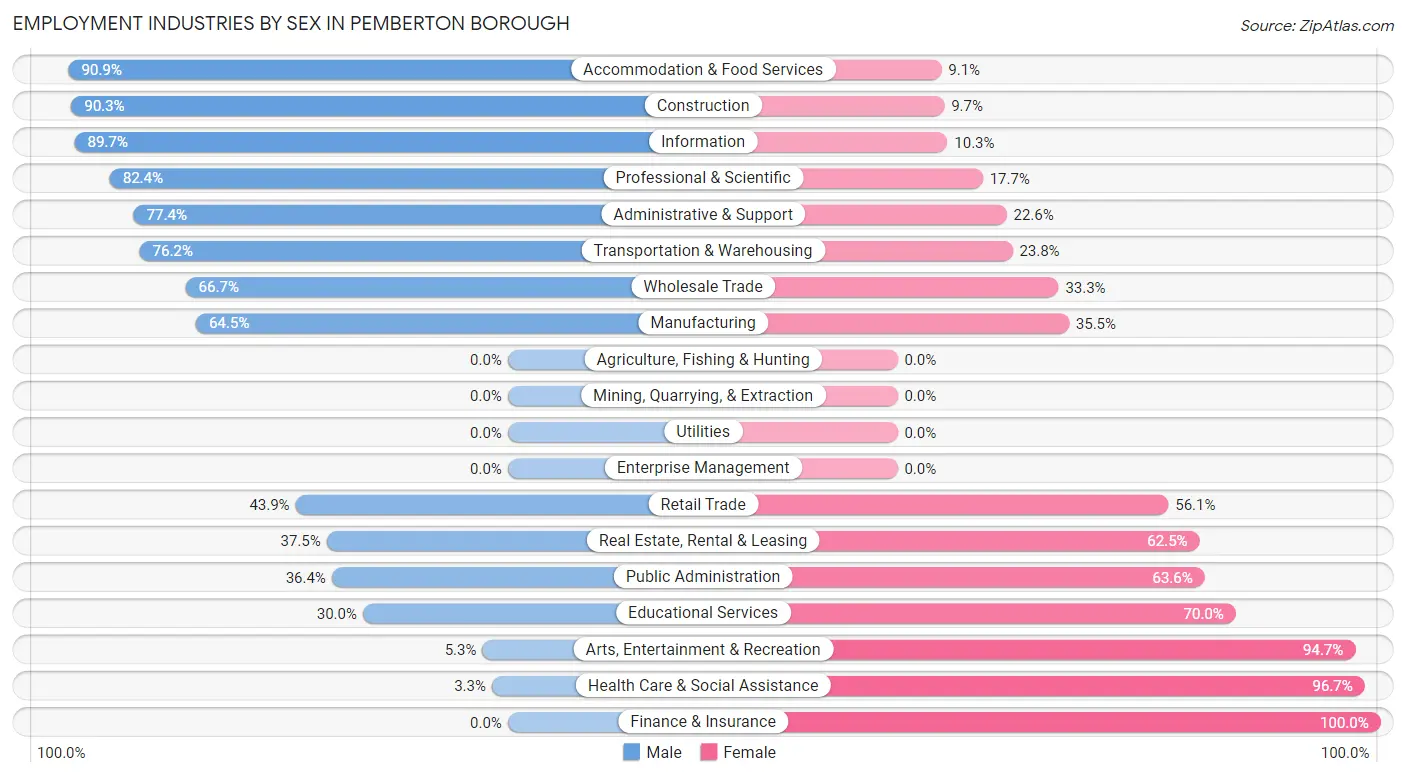
| Industry | Male | Female |
| Agriculture, Fishing & Hunting | 0 (0.0%) | 0 (0.0%) |
| Mining, Quarrying, & Extraction | 0 (0.0%) | 0 (0.0%) |
| Construction | 56 (90.3%) | 6 (9.7%) |
| Manufacturing | 20 (64.5%) | 11 (35.5%) |
| Wholesale Trade | 10 (66.7%) | 5 (33.3%) |
| Retail Trade | 29 (43.9%) | 37 (56.1%) |
| Transportation & Warehousing | 16 (76.2%) | 5 (23.8%) |
| Utilities | 0 (0.0%) | 0 (0.0%) |
| Information | 26 (89.7%) | 3 (10.3%) |
| Finance & Insurance | 0 (0.0%) | 26 (100.0%) |
| Real Estate, Rental & Leasing | 3 (37.5%) | 5 (62.5%) |
| Professional & Scientific | 14 (82.4%) | 3 (17.6%) |
| Enterprise Management | 0 (0.0%) | 0 (0.0%) |
| Administrative & Support | 24 (77.4%) | 7 (22.6%) |
| Educational Services | 12 (30.0%) | 28 (70.0%) |
| Health Care & Social Assistance | 3 (3.3%) | 88 (96.7%) |
| Arts, Entertainment & Recreation | 3 (5.3%) | 54 (94.7%) |
| Accommodation & Food Services | 30 (90.9%) | 3 (9.1%) |
| Public Administration | 43 (36.4%) | 75 (63.6%) |
| Total | 296 (44.2%) | 374 (55.8%) |
Education in Pemberton borough
School Enrollment in Pemberton borough
The most common levels of schooling among the 238 students in Pemberton borough are college / undergraduate (79 | 33.2%), elementary school (69 | 29.0%), and high school (36 | 15.1%).
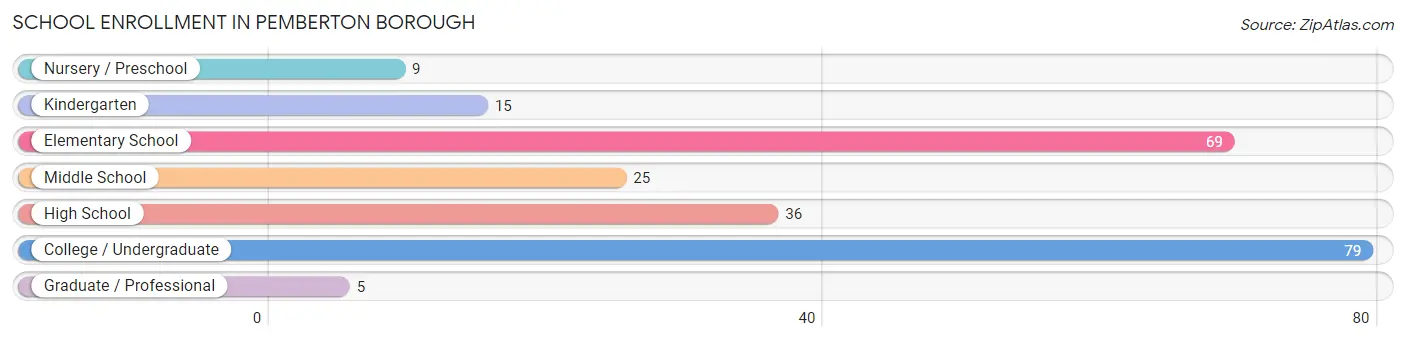
| School Level | # Students | % Students |
| Nursery / Preschool | 9 | 3.8% |
| Kindergarten | 15 | 6.3% |
| Elementary School | 69 | 29.0% |
| Middle School | 25 | 10.5% |
| High School | 36 | 15.1% |
| College / Undergraduate | 79 | 33.2% |
| Graduate / Professional | 5 | 2.1% |
| Total | 238 | 100.0% |
School Enrollment by Age by Funding Source in Pemberton borough
Out of a total of 238 students who are enrolled in schools in Pemberton borough, 72 (30.3%) attend a private institution, while the remaining 166 (69.7%) are enrolled in public schools. The age group of 25 to 34 year olds has the highest likelihood of being enrolled in private schools, with 54 (96.4% in the age bracket) enrolled. Conversely, the age group of 3 to 4 year olds has the lowest likelihood of being enrolled in a private school, with 8 (100.0% in the age bracket) attending a public institution.
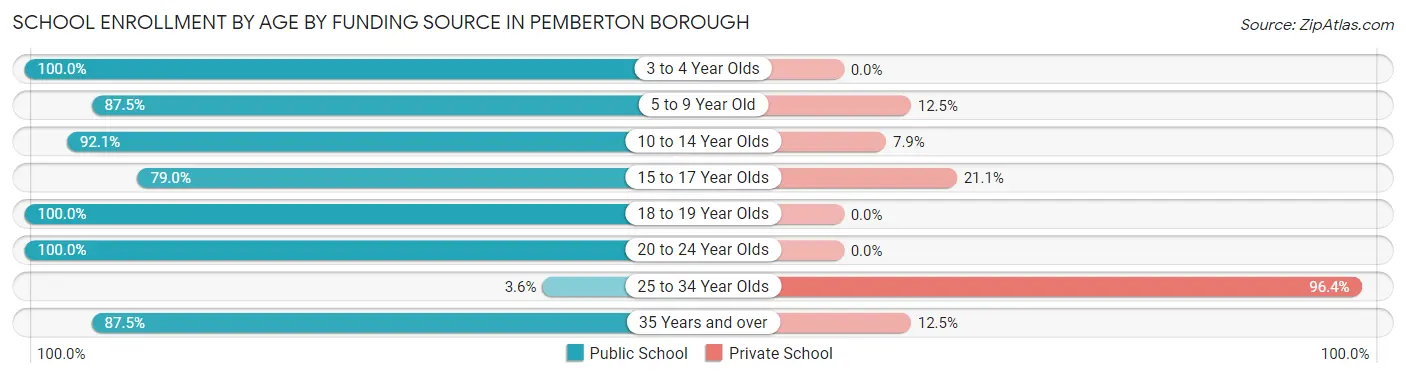
| Age Bracket | Public School | Private School |
| 3 to 4 Year Olds | 8 (100.0%) | 0 (0.0%) |
| 5 to 9 Year Old | 63 (87.5%) | 9 (12.5%) |
| 10 to 14 Year Olds | 35 (92.1%) | 3 (7.9%) |
| 15 to 17 Year Olds | 15 (78.9%) | 4 (21.0%) |
| 18 to 19 Year Olds | 17 (100.0%) | 0 (0.0%) |
| 20 to 24 Year Olds | 12 (100.0%) | 0 (0.0%) |
| 25 to 34 Year Olds | 2 (3.6%) | 54 (96.4%) |
| 35 Years and over | 14 (87.5%) | 2 (12.5%) |
| Total | 166 (69.7%) | 72 (30.3%) |
Educational Attainment by Field of Study in Pemberton borough
Education (33 | 15.8%), science & technology (23 | 11.0%), bio, nature & agricultural (21 | 10.1%), arts & humanities (21 | 10.1%), and business (20 | 9.6%) are the most common fields of study among 209 individuals in Pemberton borough who have obtained a bachelor's degree or higher.
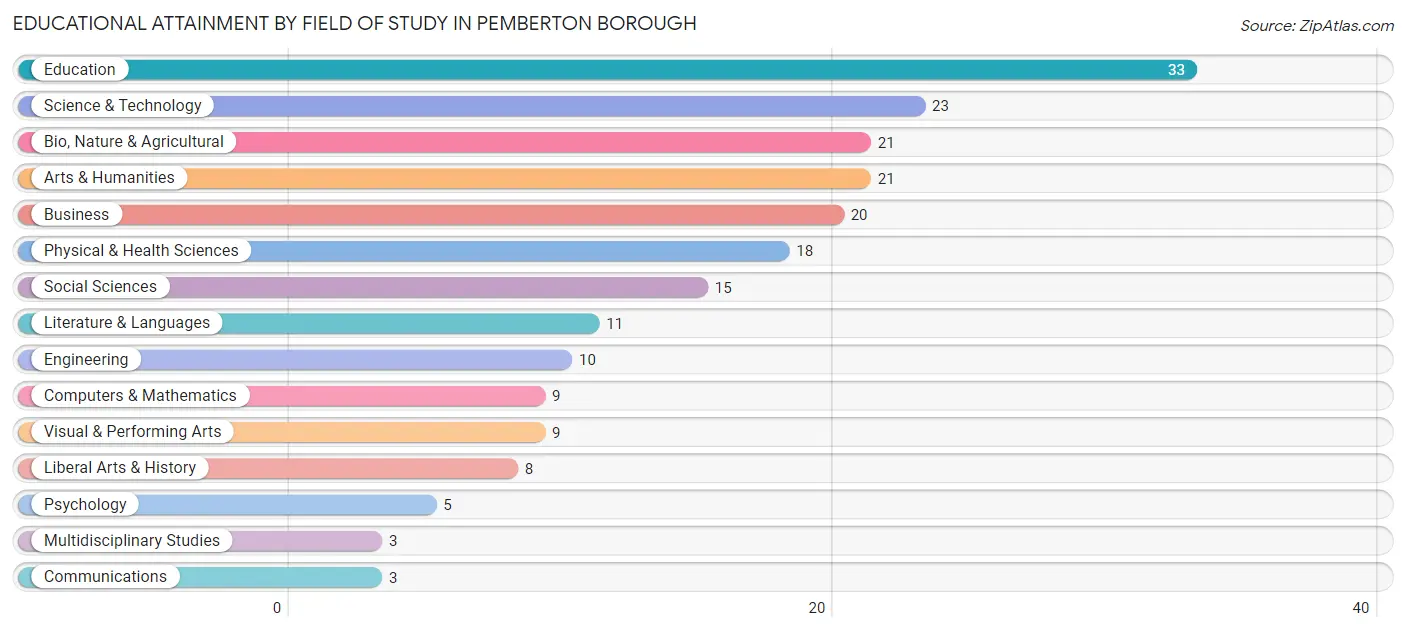
| Field of Study | # Graduates | % Graduates |
| Computers & Mathematics | 9 | 4.3% |
| Bio, Nature & Agricultural | 21 | 10.1% |
| Physical & Health Sciences | 18 | 8.6% |
| Psychology | 5 | 2.4% |
| Social Sciences | 15 | 7.2% |
| Engineering | 10 | 4.8% |
| Multidisciplinary Studies | 3 | 1.4% |
| Science & Technology | 23 | 11.0% |
| Business | 20 | 9.6% |
| Education | 33 | 15.8% |
| Literature & Languages | 11 | 5.3% |
| Liberal Arts & History | 8 | 3.8% |
| Visual & Performing Arts | 9 | 4.3% |
| Communications | 3 | 1.4% |
| Arts & Humanities | 21 | 10.1% |
| Total | 209 | 100.0% |
Transportation & Commute in Pemberton borough
Vehicle Availability by Sex in Pemberton borough
The most prevalent vehicle ownership categories in Pemberton borough are males with 2 vehicles (159, accounting for 50.5%) and females with 2 vehicles (134, making up 51.3%).
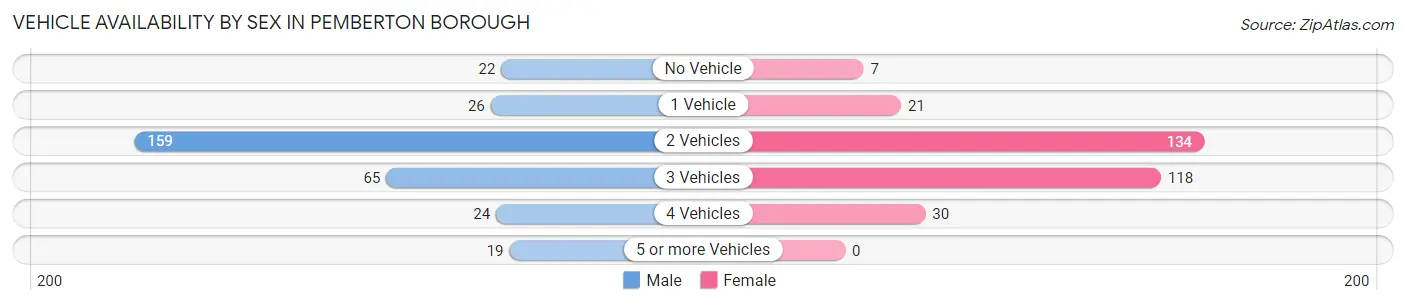
| Vehicles Available | Male | Female |
| No Vehicle | 22 (7.0%) | 7 (2.3%) |
| 1 Vehicle | 26 (8.3%) | 21 (6.8%) |
| 2 Vehicles | 159 (50.5%) | 134 (43.2%) |
| 3 Vehicles | 65 (20.6%) | 118 (38.1%) |
| 4 Vehicles | 24 (7.6%) | 30 (9.7%) |
| 5 or more Vehicles | 19 (6.0%) | 0 (0.0%) |
| Total | 315 (100.0%) | 310 (100.0%) |
Commute Time in Pemberton borough
The most frequently occuring commute durations in Pemberton borough are 45 to 59 minutes (126 commuters, 22.9%), 20 to 24 minutes (97 commuters, 17.6%), and 15 to 19 minutes (76 commuters, 13.8%).
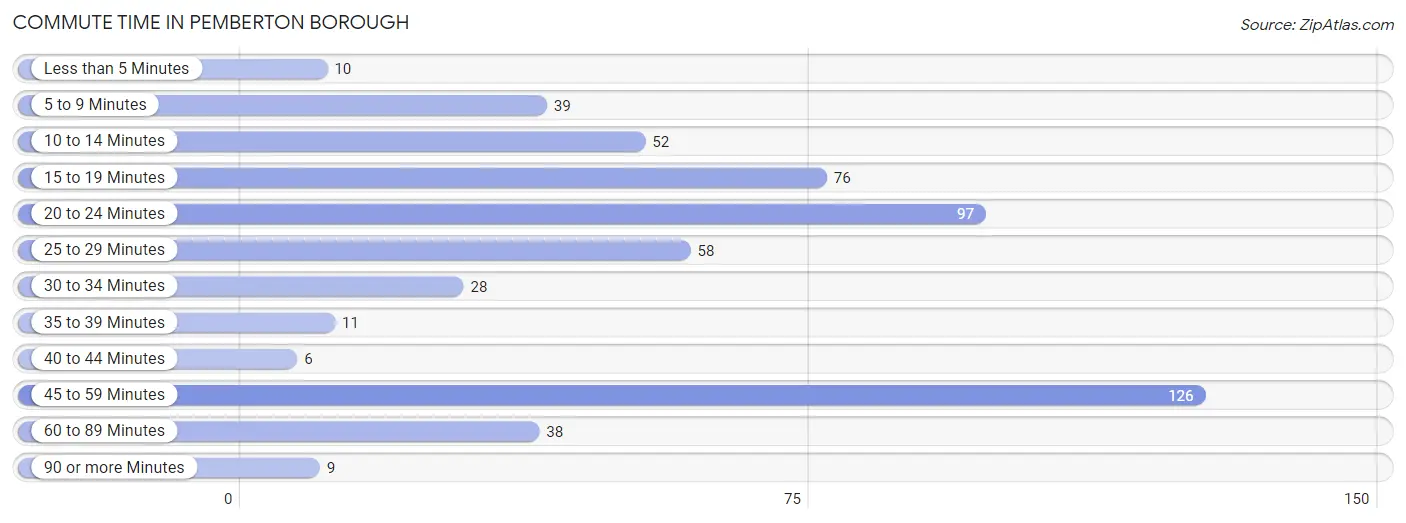
| Commute Time | # Commuters | % Commuters |
| Less than 5 Minutes | 10 | 1.8% |
| 5 to 9 Minutes | 39 | 7.1% |
| 10 to 14 Minutes | 52 | 9.5% |
| 15 to 19 Minutes | 76 | 13.8% |
| 20 to 24 Minutes | 97 | 17.6% |
| 25 to 29 Minutes | 58 | 10.5% |
| 30 to 34 Minutes | 28 | 5.1% |
| 35 to 39 Minutes | 11 | 2.0% |
| 40 to 44 Minutes | 6 | 1.1% |
| 45 to 59 Minutes | 126 | 22.9% |
| 60 to 89 Minutes | 38 | 6.9% |
| 90 or more Minutes | 9 | 1.6% |
Commute Time by Sex in Pemberton borough
The most common commute times in Pemberton borough are 20 to 24 minutes (65 commuters, 22.7%) for males and 45 to 59 minutes (80 commuters, 30.3%) for females.
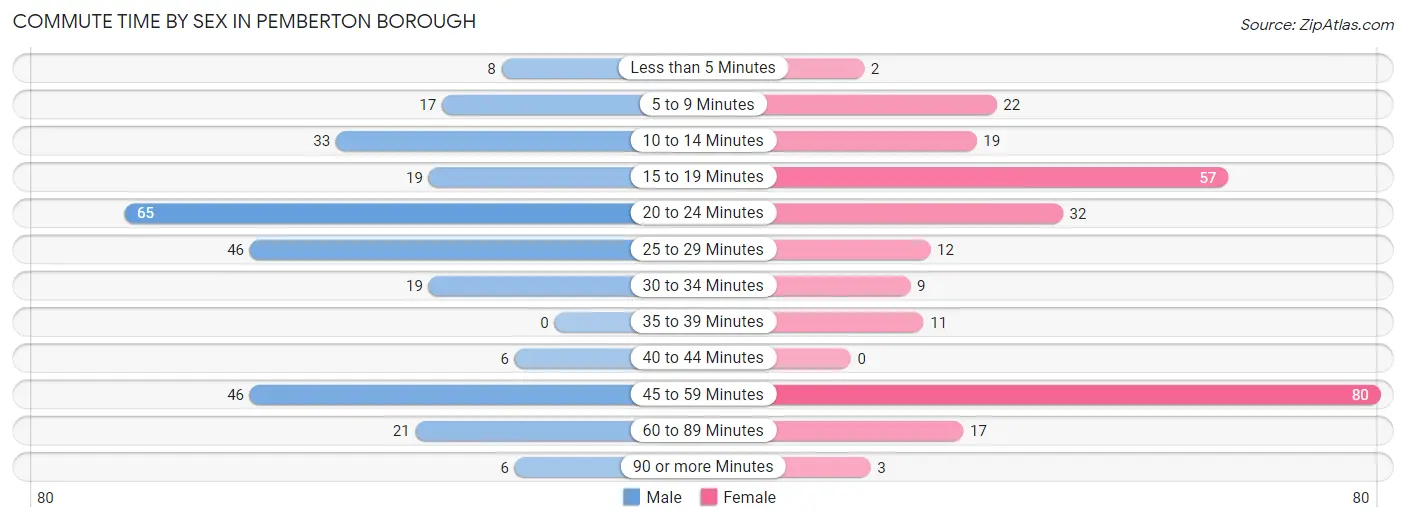
| Commute Time | Male | Female |
| Less than 5 Minutes | 8 (2.8%) | 2 (0.8%) |
| 5 to 9 Minutes | 17 (5.9%) | 22 (8.3%) |
| 10 to 14 Minutes | 33 (11.5%) | 19 (7.2%) |
| 15 to 19 Minutes | 19 (6.6%) | 57 (21.6%) |
| 20 to 24 Minutes | 65 (22.7%) | 32 (12.1%) |
| 25 to 29 Minutes | 46 (16.1%) | 12 (4.5%) |
| 30 to 34 Minutes | 19 (6.6%) | 9 (3.4%) |
| 35 to 39 Minutes | 0 (0.0%) | 11 (4.2%) |
| 40 to 44 Minutes | 6 (2.1%) | 0 (0.0%) |
| 45 to 59 Minutes | 46 (16.1%) | 80 (30.3%) |
| 60 to 89 Minutes | 21 (7.3%) | 17 (6.4%) |
| 90 or more Minutes | 6 (2.1%) | 3 (1.1%) |
Time of Departure to Work by Sex in Pemberton borough
The most frequent times of departure to work in Pemberton borough are 7:30 AM to 7:59 AM (80, 28.0%) for males and 7:00 AM to 7:29 AM (58, 22.0%) for females.
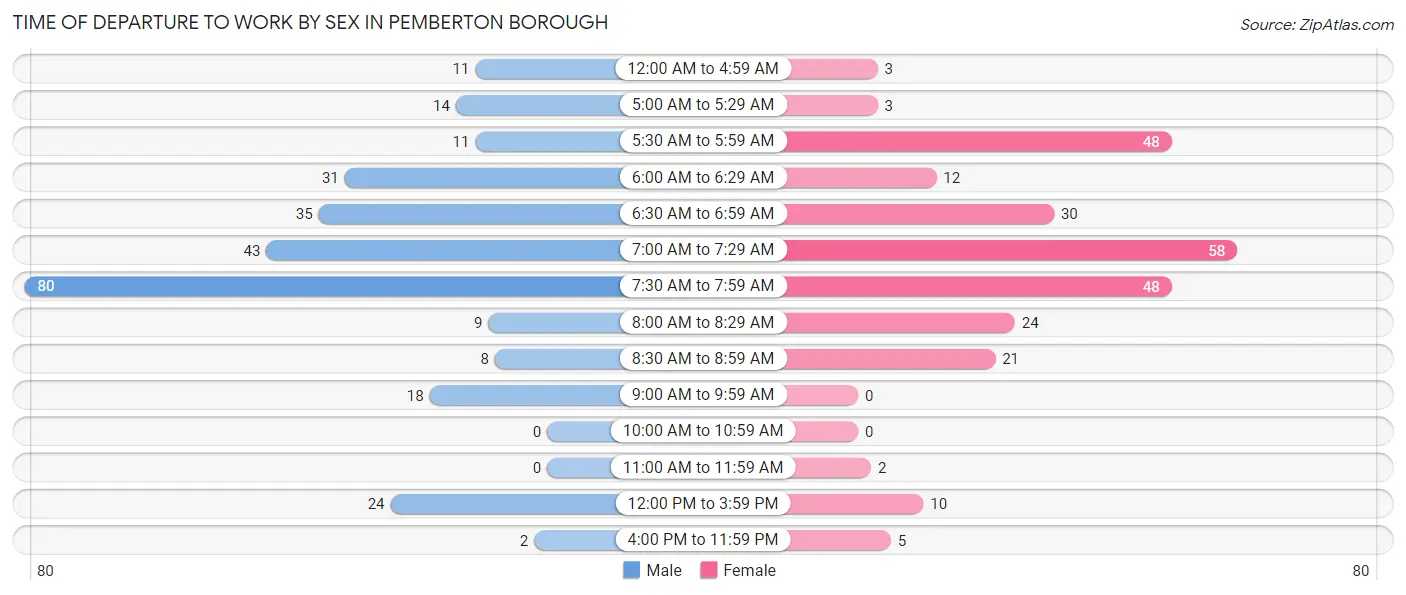
| Time of Departure | Male | Female |
| 12:00 AM to 4:59 AM | 11 (3.8%) | 3 (1.1%) |
| 5:00 AM to 5:29 AM | 14 (4.9%) | 3 (1.1%) |
| 5:30 AM to 5:59 AM | 11 (3.8%) | 48 (18.2%) |
| 6:00 AM to 6:29 AM | 31 (10.8%) | 12 (4.5%) |
| 6:30 AM to 6:59 AM | 35 (12.2%) | 30 (11.4%) |
| 7:00 AM to 7:29 AM | 43 (15.0%) | 58 (22.0%) |
| 7:30 AM to 7:59 AM | 80 (28.0%) | 48 (18.2%) |
| 8:00 AM to 8:29 AM | 9 (3.2%) | 24 (9.1%) |
| 8:30 AM to 8:59 AM | 8 (2.8%) | 21 (8.0%) |
| 9:00 AM to 9:59 AM | 18 (6.3%) | 0 (0.0%) |
| 10:00 AM to 10:59 AM | 0 (0.0%) | 0 (0.0%) |
| 11:00 AM to 11:59 AM | 0 (0.0%) | 2 (0.8%) |
| 12:00 PM to 3:59 PM | 24 (8.4%) | 10 (3.8%) |
| 4:00 PM to 11:59 PM | 2 (0.7%) | 5 (1.9%) |
| Total | 286 (100.0%) | 264 (100.0%) |
Housing Occupancy in Pemberton borough
Occupancy by Ownership in Pemberton borough
Of the total 539 dwellings in Pemberton borough, owner-occupied units account for 364 (67.5%), while renter-occupied units make up 175 (32.5%).
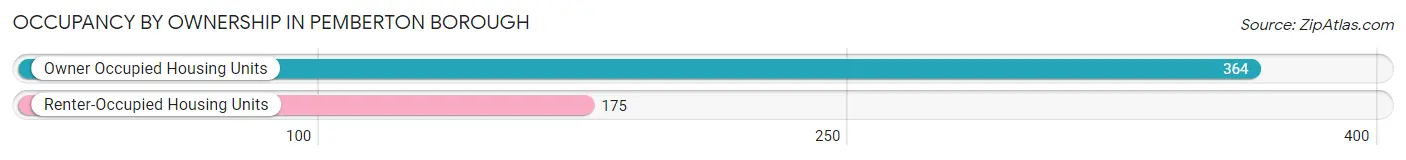
| Occupancy | # Housing Units | % Housing Units |
| Owner Occupied Housing Units | 364 | 67.5% |
| Renter-Occupied Housing Units | 175 | 32.5% |
| Total Occupied Housing Units | 539 | 100.0% |
Occupancy by Household Size in Pemberton borough
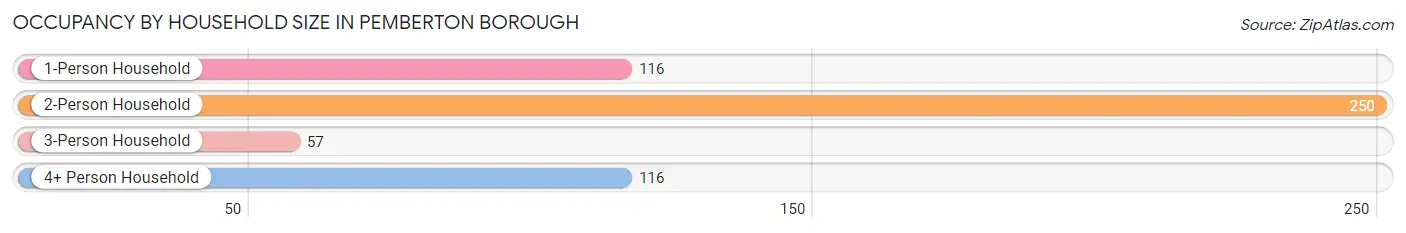
| Household Size | # Housing Units | % Housing Units |
| 1-Person Household | 116 | 21.5% |
| 2-Person Household | 250 | 46.4% |
| 3-Person Household | 57 | 10.6% |
| 4+ Person Household | 116 | 21.5% |
| Total Housing Units | 539 | 100.0% |
Occupancy by Ownership by Household Size in Pemberton borough
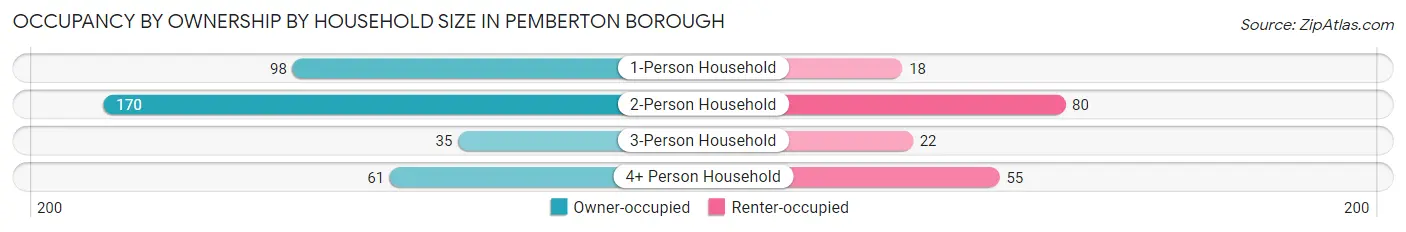
| Household Size | Owner-occupied | Renter-occupied |
| 1-Person Household | 98 (84.5%) | 18 (15.5%) |
| 2-Person Household | 170 (68.0%) | 80 (32.0%) |
| 3-Person Household | 35 (61.4%) | 22 (38.6%) |
| 4+ Person Household | 61 (52.6%) | 55 (47.4%) |
| Total Housing Units | 364 (67.5%) | 175 (32.5%) |
Occupancy by Educational Attainment in Pemberton borough
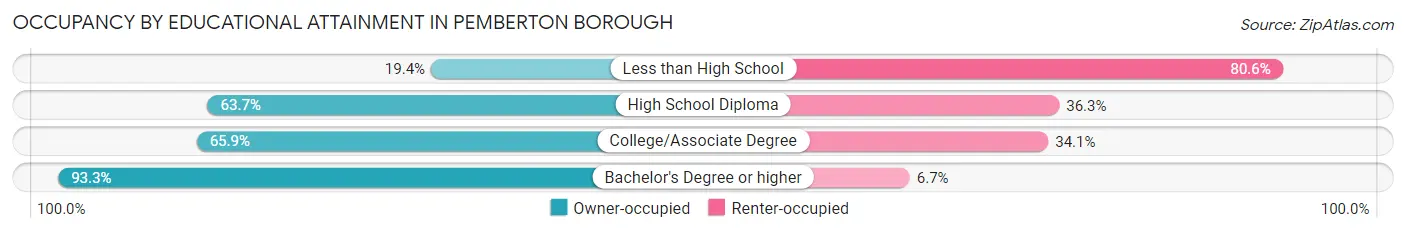
| Household Size | Owner-occupied | Renter-occupied |
| Less than High School | 7 (19.4%) | 29 (80.6%) |
| High School Diploma | 93 (63.7%) | 53 (36.3%) |
| College/Associate Degree | 166 (65.9%) | 86 (34.1%) |
| Bachelor's Degree or higher | 98 (93.3%) | 7 (6.7%) |
Occupancy by Age of Householder in Pemberton borough
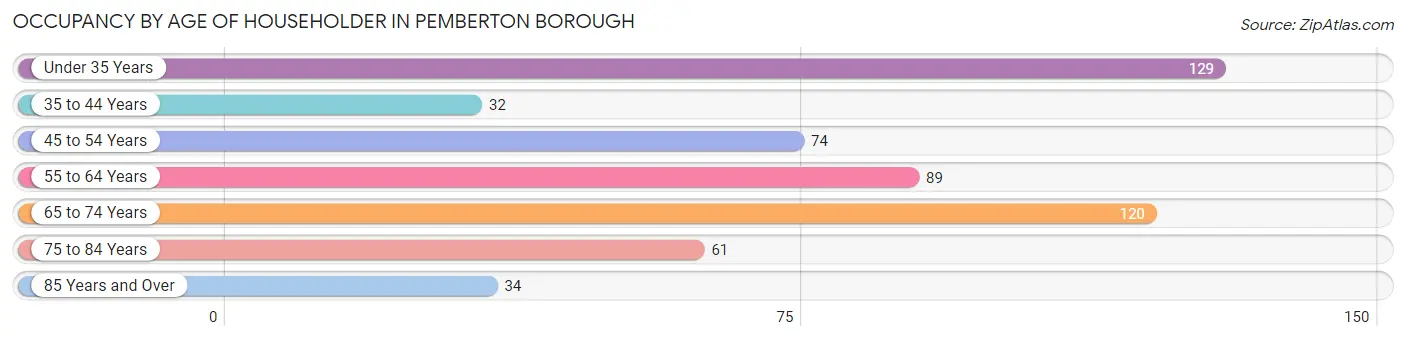
| Age Bracket | # Households | % Households |
| Under 35 Years | 129 | 23.9% |
| 35 to 44 Years | 32 | 5.9% |
| 45 to 54 Years | 74 | 13.7% |
| 55 to 64 Years | 89 | 16.5% |
| 65 to 74 Years | 120 | 22.3% |
| 75 to 84 Years | 61 | 11.3% |
| 85 Years and Over | 34 | 6.3% |
| Total | 539 | 100.0% |
Housing Finances in Pemberton borough
Median Income by Occupancy in Pemberton borough
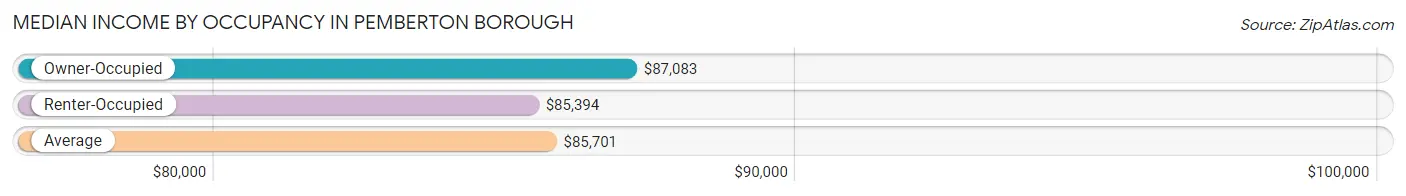
| Occupancy Type | # Households | Median Income |
| Owner-Occupied | 364 (67.5%) | $87,083 |
| Renter-Occupied | 175 (32.5%) | $85,394 |
| Average | 539 (100.0%) | $85,701 |
Occupancy by Householder Income Bracket in Pemberton borough
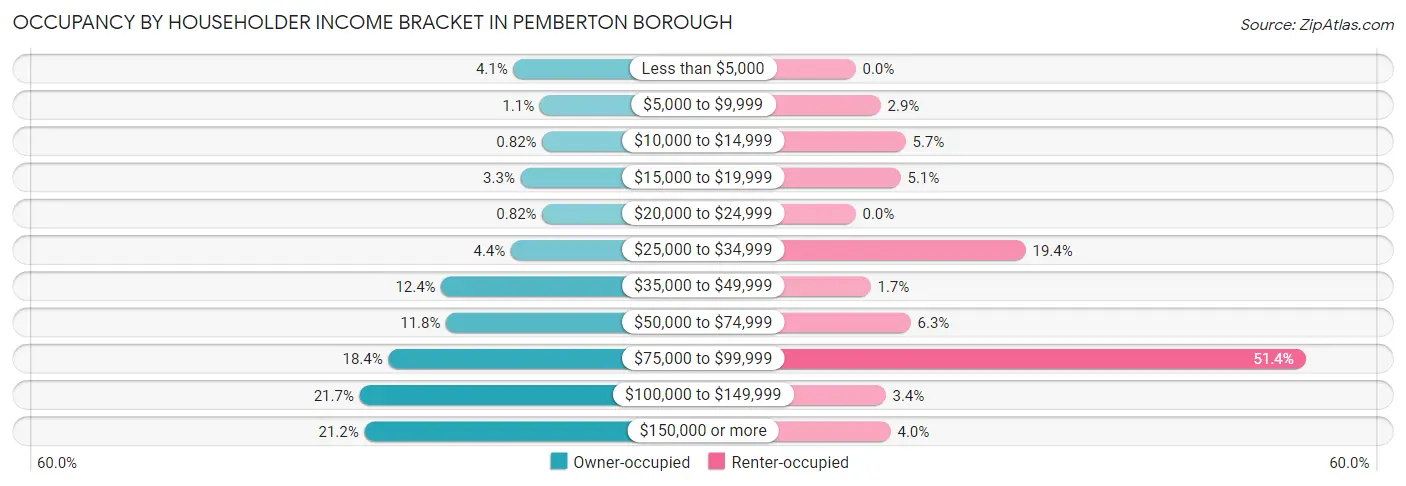
| Income Bracket | Owner-occupied | Renter-occupied |
| Less than $5,000 | 15 (4.1%) | 0 (0.0%) |
| $5,000 to $9,999 | 4 (1.1%) | 5 (2.9%) |
| $10,000 to $14,999 | 3 (0.8%) | 10 (5.7%) |
| $15,000 to $19,999 | 12 (3.3%) | 9 (5.1%) |
| $20,000 to $24,999 | 3 (0.8%) | 0 (0.0%) |
| $25,000 to $34,999 | 16 (4.4%) | 34 (19.4%) |
| $35,000 to $49,999 | 45 (12.4%) | 3 (1.7%) |
| $50,000 to $74,999 | 43 (11.8%) | 11 (6.3%) |
| $75,000 to $99,999 | 67 (18.4%) | 90 (51.4%) |
| $100,000 to $149,999 | 79 (21.7%) | 6 (3.4%) |
| $150,000 or more | 77 (21.1%) | 7 (4.0%) |
| Total | 364 (100.0%) | 175 (100.0%) |
Monthly Housing Cost Tiers in Pemberton borough
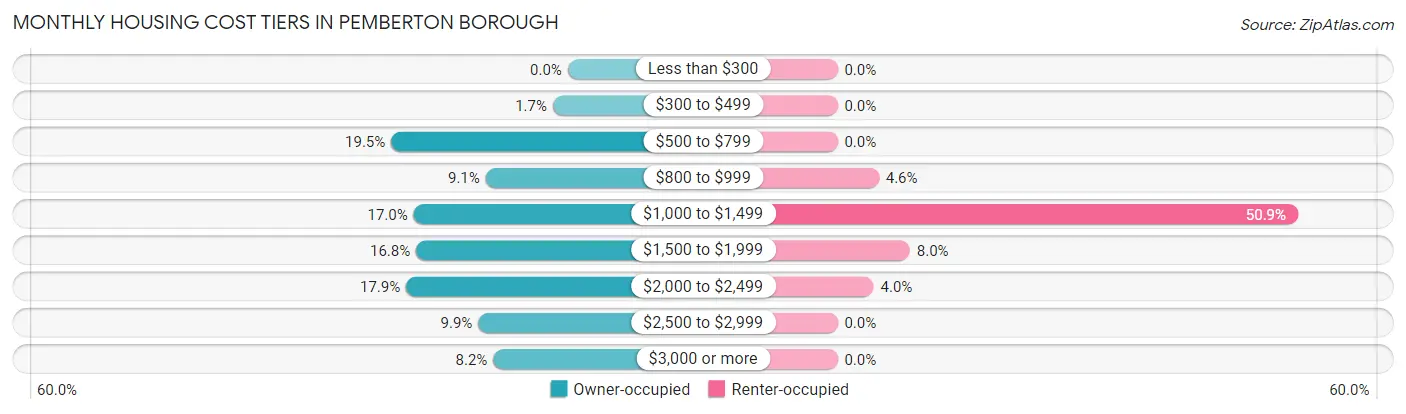
| Monthly Cost | Owner-occupied | Renter-occupied |
| Less than $300 | 0 (0.0%) | 0 (0.0%) |
| $300 to $499 | 6 (1.7%) | 0 (0.0%) |
| $500 to $799 | 71 (19.5%) | 0 (0.0%) |
| $800 to $999 | 33 (9.1%) | 8 (4.6%) |
| $1,000 to $1,499 | 62 (17.0%) | 89 (50.9%) |
| $1,500 to $1,999 | 61 (16.8%) | 14 (8.0%) |
| $2,000 to $2,499 | 65 (17.9%) | 7 (4.0%) |
| $2,500 to $2,999 | 36 (9.9%) | 0 (0.0%) |
| $3,000 or more | 30 (8.2%) | 0 (0.0%) |
| Total | 364 (100.0%) | 175 (100.0%) |
Physical Housing Characteristics in Pemberton borough
Housing Structures in Pemberton borough
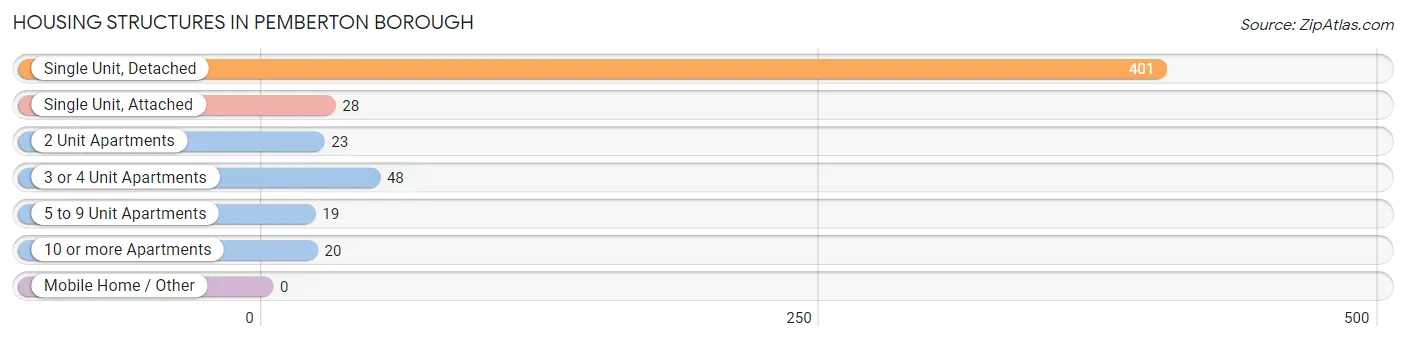
| Structure Type | # Housing Units | % Housing Units |
| Single Unit, Detached | 401 | 74.4% |
| Single Unit, Attached | 28 | 5.2% |
| 2 Unit Apartments | 23 | 4.3% |
| 3 or 4 Unit Apartments | 48 | 8.9% |
| 5 to 9 Unit Apartments | 19 | 3.5% |
| 10 or more Apartments | 20 | 3.7% |
| Mobile Home / Other | 0 | 0.0% |
| Total | 539 | 100.0% |
Housing Structures by Occupancy in Pemberton borough
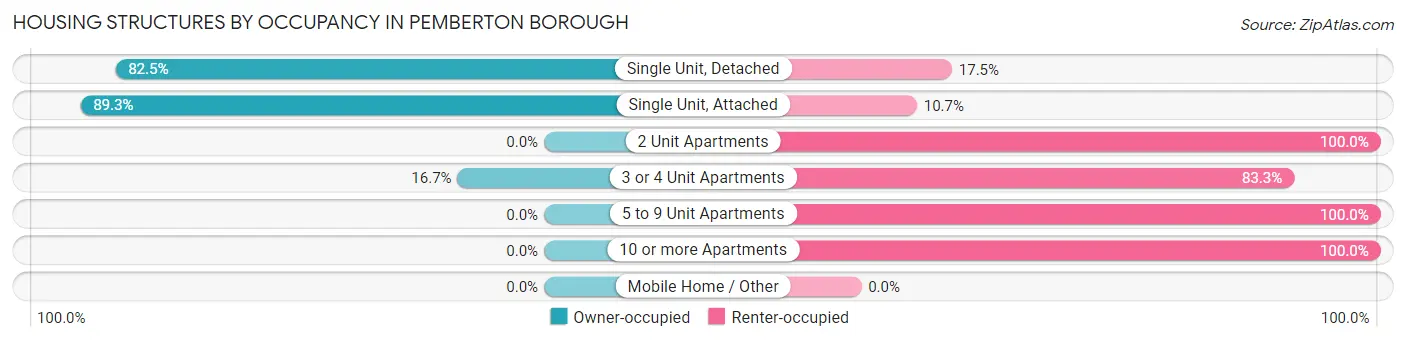
| Structure Type | Owner-occupied | Renter-occupied |
| Single Unit, Detached | 331 (82.5%) | 70 (17.5%) |
| Single Unit, Attached | 25 (89.3%) | 3 (10.7%) |
| 2 Unit Apartments | 0 (0.0%) | 23 (100.0%) |
| 3 or 4 Unit Apartments | 8 (16.7%) | 40 (83.3%) |
| 5 to 9 Unit Apartments | 0 (0.0%) | 19 (100.0%) |
| 10 or more Apartments | 0 (0.0%) | 20 (100.0%) |
| Mobile Home / Other | 0 (0.0%) | 0 (0.0%) |
| Total | 364 (67.5%) | 175 (32.5%) |
Housing Structures by Number of Rooms in Pemberton borough
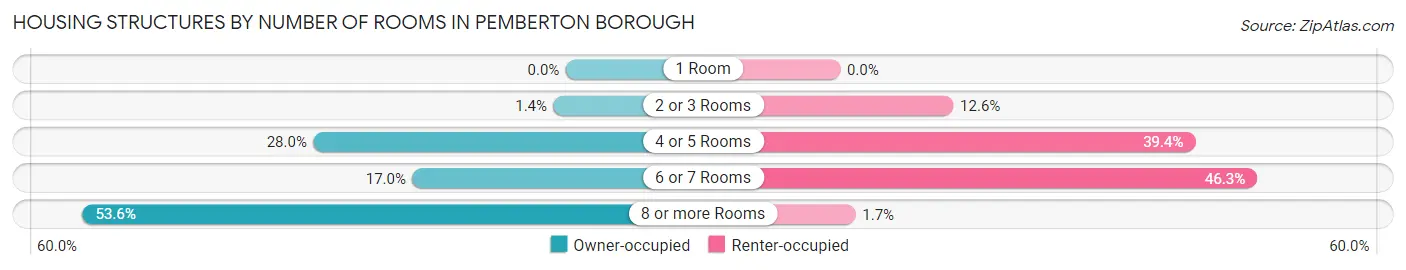
| Number of Rooms | Owner-occupied | Renter-occupied |
| 1 Room | 0 (0.0%) | 0 (0.0%) |
| 2 or 3 Rooms | 5 (1.4%) | 22 (12.6%) |
| 4 or 5 Rooms | 102 (28.0%) | 69 (39.4%) |
| 6 or 7 Rooms | 62 (17.0%) | 81 (46.3%) |
| 8 or more Rooms | 195 (53.6%) | 3 (1.7%) |
| Total | 364 (100.0%) | 175 (100.0%) |
Housing Structure by Heating Type in Pemberton borough
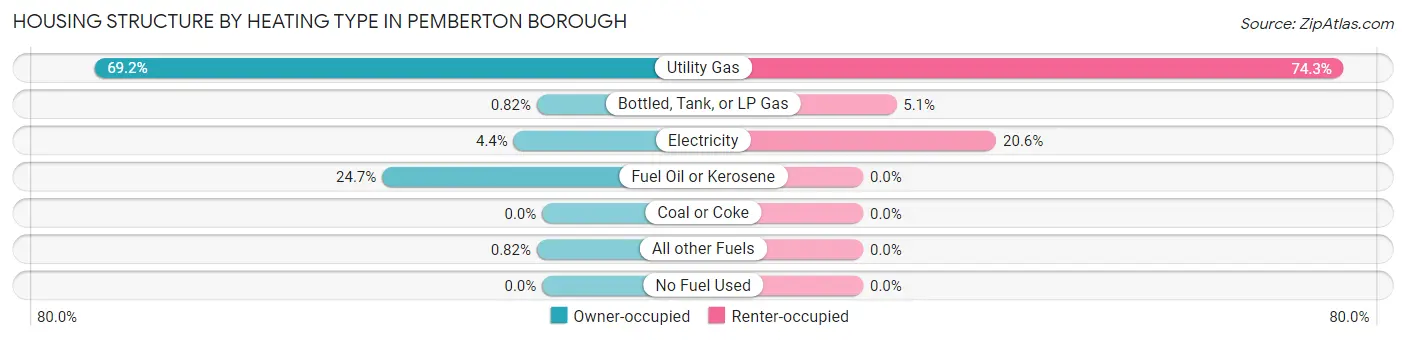
| Heating Type | Owner-occupied | Renter-occupied |
| Utility Gas | 252 (69.2%) | 130 (74.3%) |
| Bottled, Tank, or LP Gas | 3 (0.8%) | 9 (5.1%) |
| Electricity | 16 (4.4%) | 36 (20.6%) |
| Fuel Oil or Kerosene | 90 (24.7%) | 0 (0.0%) |
| Coal or Coke | 0 (0.0%) | 0 (0.0%) |
| All other Fuels | 3 (0.8%) | 0 (0.0%) |
| No Fuel Used | 0 (0.0%) | 0 (0.0%) |
| Total | 364 (100.0%) | 175 (100.0%) |
Household Vehicle Usage in Pemberton borough
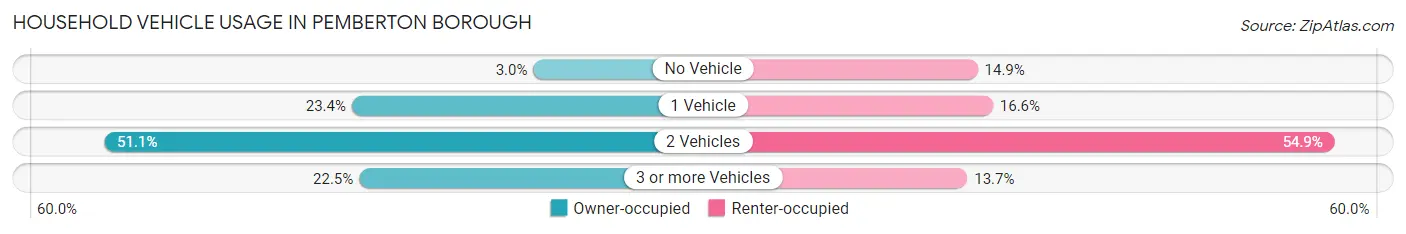
| Vehicles per Household | Owner-occupied | Renter-occupied |
| No Vehicle | 11 (3.0%) | 26 (14.9%) |
| 1 Vehicle | 85 (23.4%) | 29 (16.6%) |
| 2 Vehicles | 186 (51.1%) | 96 (54.9%) |
| 3 or more Vehicles | 82 (22.5%) | 24 (13.7%) |
| Total | 364 (100.0%) | 175 (100.0%) |
Real Estate & Mortgages in Pemberton borough
Real Estate and Mortgage Overview in Pemberton borough
| Characteristic | Without Mortgage | With Mortgage |
| Housing Units | 135 | 229 |
| Median Property Value | $275,000 | $314,500 |
| Median Household Income | $65,125 | $67 |
| Monthly Housing Costs | $775 | $30 |
| Real Estate Taxes | $4,737 | $0 |
Property Value by Mortgage Status in Pemberton borough
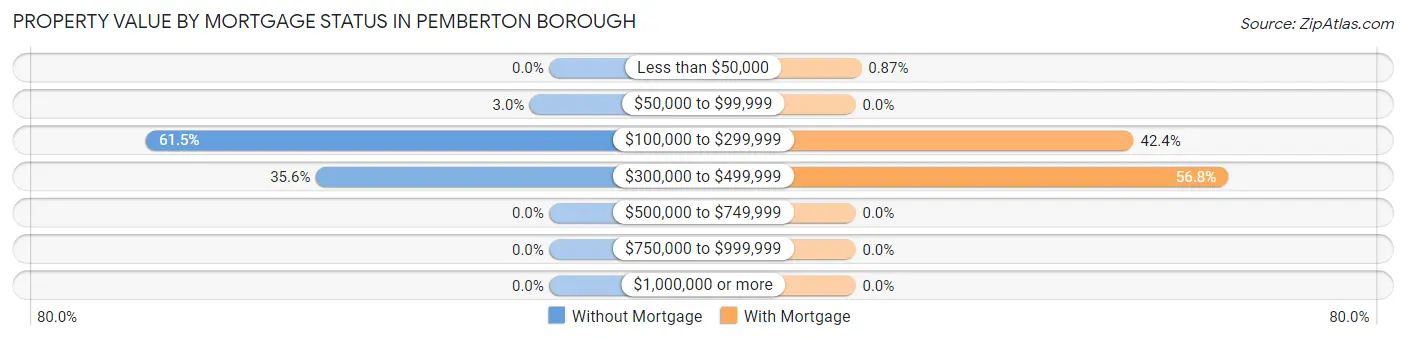
| Property Value | Without Mortgage | With Mortgage |
| Less than $50,000 | 0 (0.0%) | 2 (0.9%) |
| $50,000 to $99,999 | 4 (3.0%) | 0 (0.0%) |
| $100,000 to $299,999 | 83 (61.5%) | 97 (42.4%) |
| $300,000 to $499,999 | 48 (35.6%) | 130 (56.8%) |
| $500,000 to $749,999 | 0 (0.0%) | 0 (0.0%) |
| $750,000 to $999,999 | 0 (0.0%) | 0 (0.0%) |
| $1,000,000 or more | 0 (0.0%) | 0 (0.0%) |
| Total | 135 (100.0%) | 229 (100.0%) |
Household Income by Mortgage Status in Pemberton borough
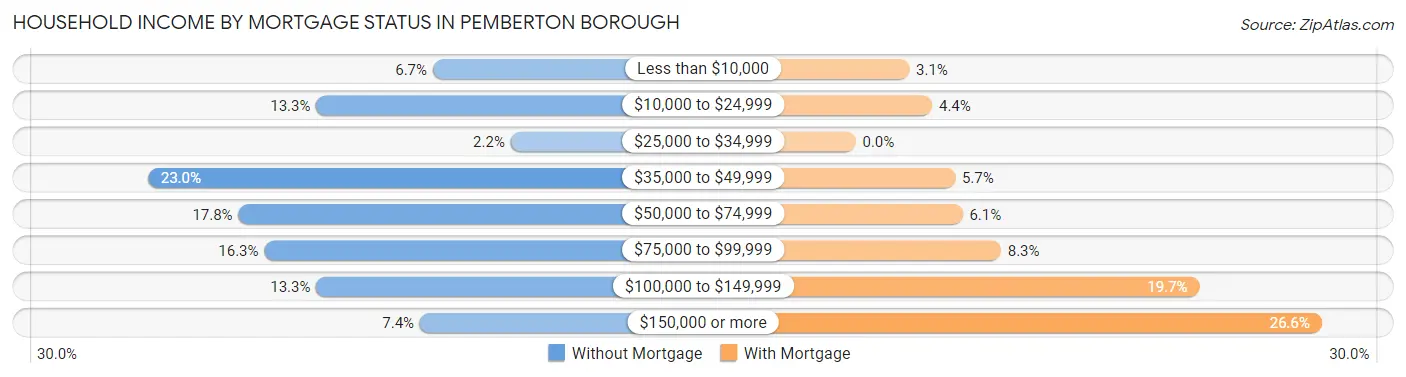
| Household Income | Without Mortgage | With Mortgage |
| Less than $10,000 | 9 (6.7%) | 7 (3.1%) |
| $10,000 to $24,999 | 18 (13.3%) | 10 (4.4%) |
| $25,000 to $34,999 | 3 (2.2%) | 0 (0.0%) |
| $35,000 to $49,999 | 31 (23.0%) | 13 (5.7%) |
| $50,000 to $74,999 | 24 (17.8%) | 14 (6.1%) |
| $75,000 to $99,999 | 22 (16.3%) | 19 (8.3%) |
| $100,000 to $149,999 | 18 (13.3%) | 45 (19.7%) |
| $150,000 or more | 10 (7.4%) | 61 (26.6%) |
| Total | 135 (100.0%) | 229 (100.0%) |
Property Value to Household Income Ratio in Pemberton borough
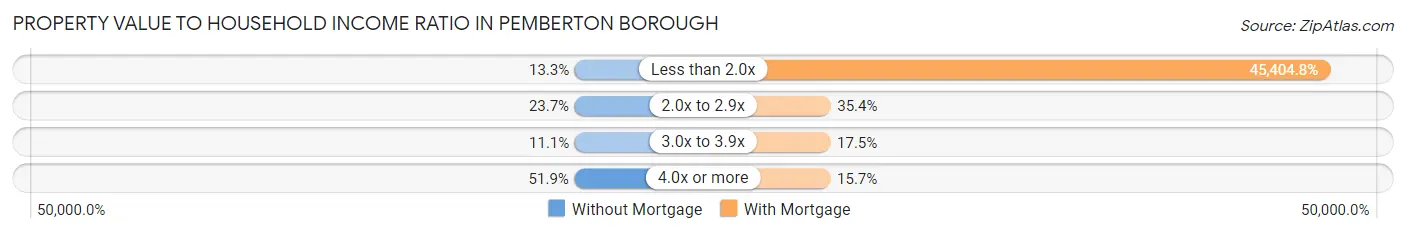
| Value-to-Income Ratio | Without Mortgage | With Mortgage |
| Less than 2.0x | 18 (13.3%) | 103,977 (45,404.8%) |
| 2.0x to 2.9x | 32 (23.7%) | 81 (35.4%) |
| 3.0x to 3.9x | 15 (11.1%) | 40 (17.5%) |
| 4.0x or more | 70 (51.8%) | 36 (15.7%) |
| Total | 135 (100.0%) | 229 (100.0%) |
Real Estate Taxes by Mortgage Status in Pemberton borough
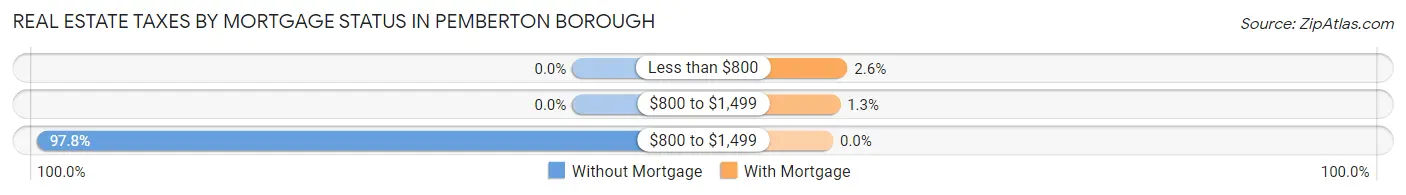
| Property Taxes | Without Mortgage | With Mortgage |
| Less than $800 | 0 (0.0%) | 6 (2.6%) |
| $800 to $1,499 | 0 (0.0%) | 3 (1.3%) |
| $800 to $1,499 | 132 (97.8%) | 0 (0.0%) |
| Total | 135 (100.0%) | 229 (100.0%) |
Health & Disability in Pemberton borough
Health Insurance Coverage by Age in Pemberton borough
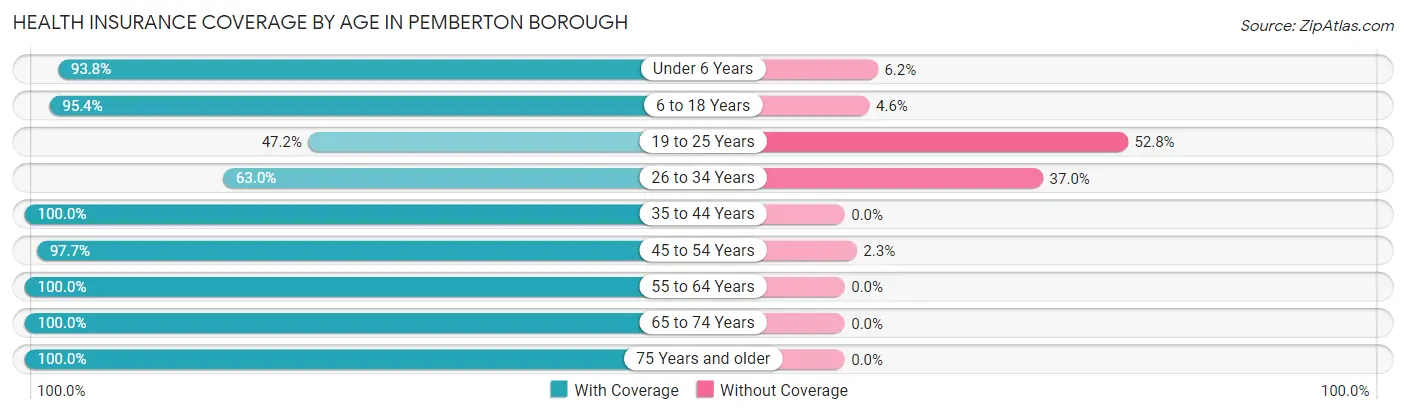
| Age Bracket | With Coverage | Without Coverage |
| Under 6 Years | 91 (93.8%) | 6 (6.2%) |
| 6 to 18 Years | 124 (95.4%) | 6 (4.6%) |
| 19 to 25 Years | 59 (47.2%) | 66 (52.8%) |
| 26 to 34 Years | 138 (63.0%) | 81 (37.0%) |
| 35 to 44 Years | 90 (100.0%) | 0 (0.0%) |
| 45 to 54 Years | 130 (97.7%) | 3 (2.3%) |
| 55 to 64 Years | 208 (100.0%) | 0 (0.0%) |
| 65 to 74 Years | 198 (100.0%) | 0 (0.0%) |
| 75 Years and older | 114 (100.0%) | 0 (0.0%) |
| Total | 1,152 (87.7%) | 162 (12.3%) |
Health Insurance Coverage by Citizenship Status in Pemberton borough
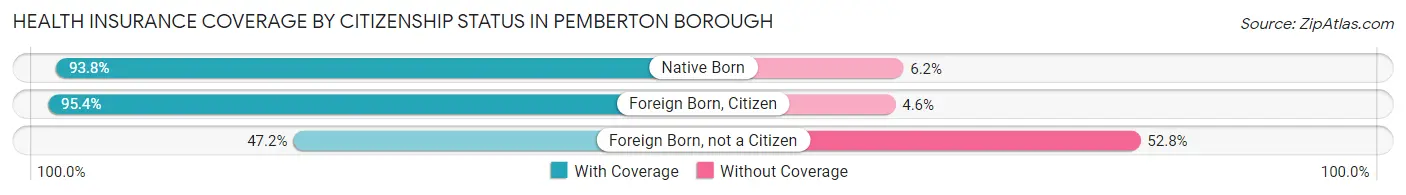
| Citizenship Status | With Coverage | Without Coverage |
| Native Born | 91 (93.8%) | 6 (6.2%) |
| Foreign Born, Citizen | 124 (95.4%) | 6 (4.6%) |
| Foreign Born, not a Citizen | 59 (47.2%) | 66 (52.8%) |
Health Insurance Coverage by Household Income in Pemberton borough
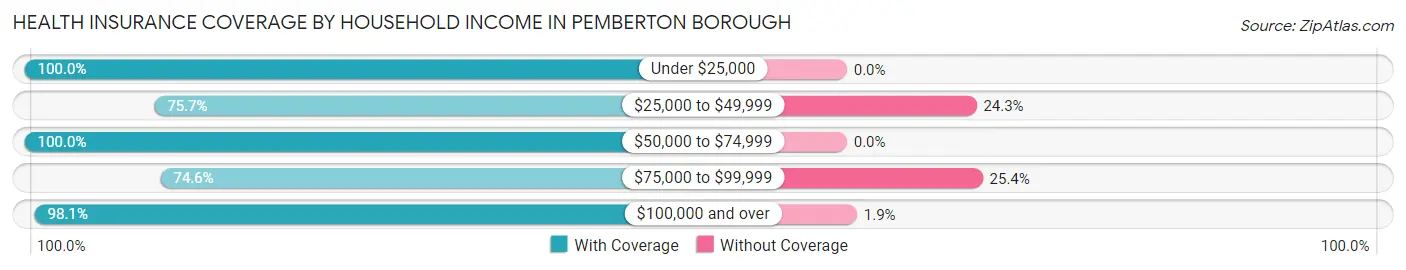
| Household Income | With Coverage | Without Coverage |
| Under $25,000 | 113 (100.0%) | 0 (0.0%) |
| $25,000 to $49,999 | 159 (75.7%) | 51 (24.3%) |
| $50,000 to $74,999 | 105 (100.0%) | 0 (0.0%) |
| $75,000 to $99,999 | 299 (74.6%) | 102 (25.4%) |
| $100,000 and over | 469 (98.1%) | 9 (1.9%) |
Public vs Private Health Insurance Coverage by Age in Pemberton borough
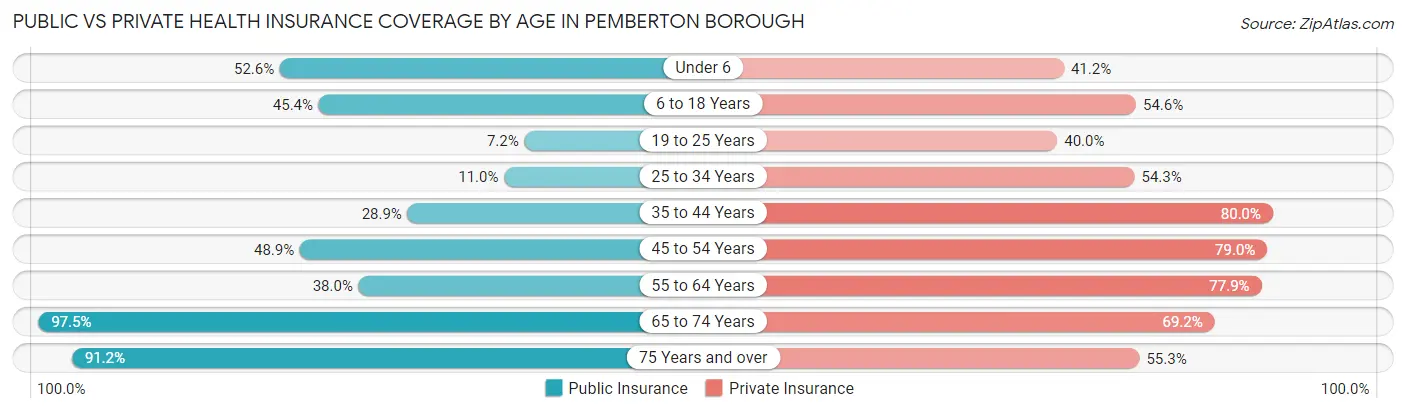
| Age Bracket | Public Insurance | Private Insurance |
| Under 6 | 51 (52.6%) | 40 (41.2%) |
| 6 to 18 Years | 59 (45.4%) | 71 (54.6%) |
| 19 to 25 Years | 9 (7.2%) | 50 (40.0%) |
| 25 to 34 Years | 24 (11.0%) | 119 (54.3%) |
| 35 to 44 Years | 26 (28.9%) | 72 (80.0%) |
| 45 to 54 Years | 65 (48.9%) | 105 (78.9%) |
| 55 to 64 Years | 79 (38.0%) | 162 (77.9%) |
| 65 to 74 Years | 193 (97.5%) | 137 (69.2%) |
| 75 Years and over | 104 (91.2%) | 63 (55.3%) |
| Total | 610 (46.4%) | 819 (62.3%) |
Disability Status by Sex by Age in Pemberton borough
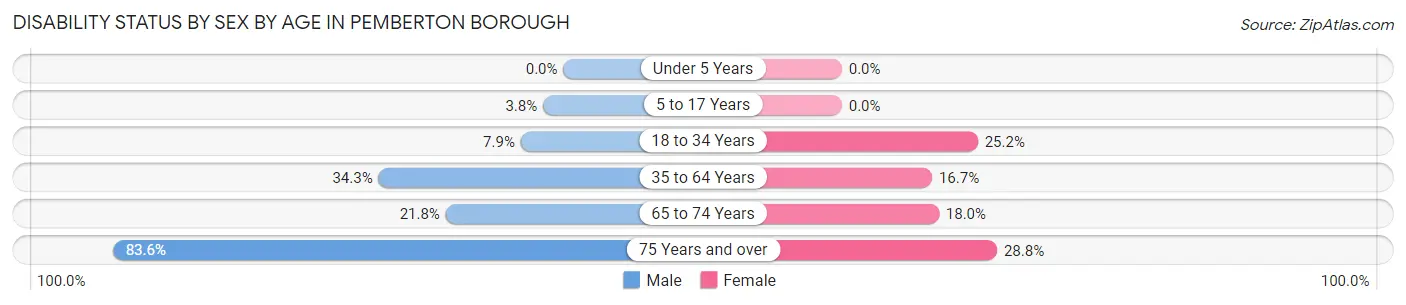
| Age Bracket | Male | Female |
| Under 5 Years | 0 (0.0%) | 0 (0.0%) |
| 5 to 17 Years | 2 (3.8%) | 0 (0.0%) |
| 18 to 34 Years | 11 (7.9%) | 56 (25.2%) |
| 35 to 64 Years | 70 (34.3%) | 38 (16.7%) |
| 65 to 74 Years | 19 (21.8%) | 20 (18.0%) |
| 75 Years and over | 46 (83.6%) | 17 (28.8%) |
Disability Class by Sex by Age in Pemberton borough
Disability Class: Hearing Difficulty
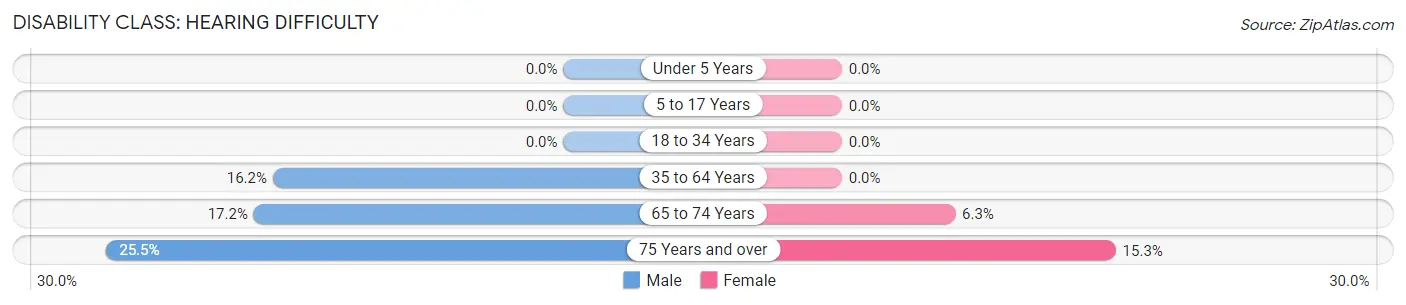
| Age Bracket | Male | Female |
| Under 5 Years | 0 (0.0%) | 0 (0.0%) |
| 5 to 17 Years | 0 (0.0%) | 0 (0.0%) |
| 18 to 34 Years | 0 (0.0%) | 0 (0.0%) |
| 35 to 64 Years | 33 (16.2%) | 0 (0.0%) |
| 65 to 74 Years | 15 (17.2%) | 7 (6.3%) |
| 75 Years and over | 14 (25.5%) | 9 (15.2%) |
Disability Class: Vision Difficulty
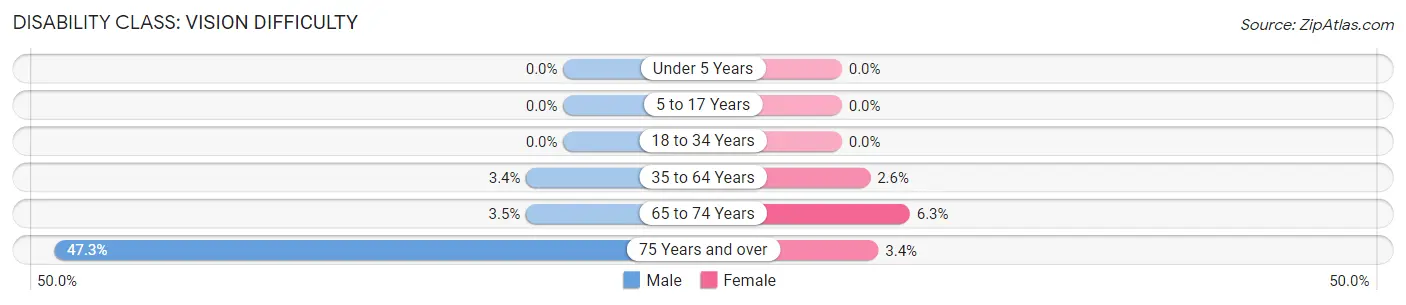
| Age Bracket | Male | Female |
| Under 5 Years | 0 (0.0%) | 0 (0.0%) |
| 5 to 17 Years | 0 (0.0%) | 0 (0.0%) |
| 18 to 34 Years | 0 (0.0%) | 0 (0.0%) |
| 35 to 64 Years | 7 (3.4%) | 6 (2.6%) |
| 65 to 74 Years | 3 (3.5%) | 7 (6.3%) |
| 75 Years and over | 26 (47.3%) | 2 (3.4%) |
Disability Class: Cognitive Difficulty
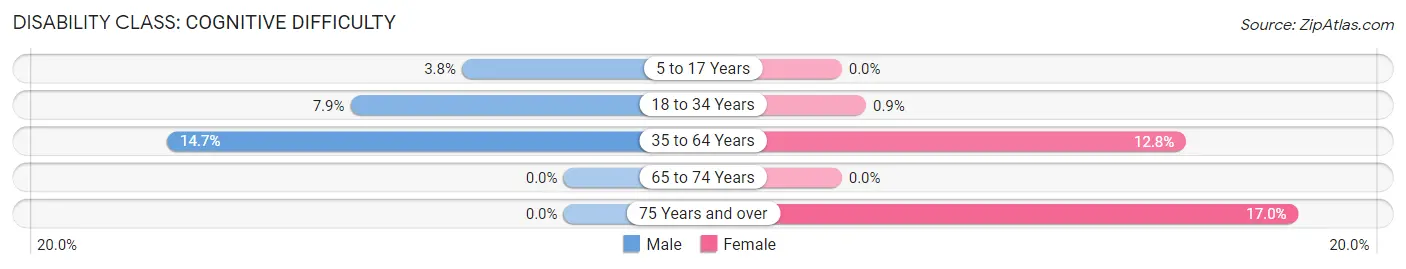
| Age Bracket | Male | Female |
| 5 to 17 Years | 2 (3.8%) | 0 (0.0%) |
| 18 to 34 Years | 11 (7.9%) | 2 (0.9%) |
| 35 to 64 Years | 30 (14.7%) | 29 (12.8%) |
| 65 to 74 Years | 0 (0.0%) | 0 (0.0%) |
| 75 Years and over | 0 (0.0%) | 10 (17.0%) |
Disability Class: Ambulatory Difficulty
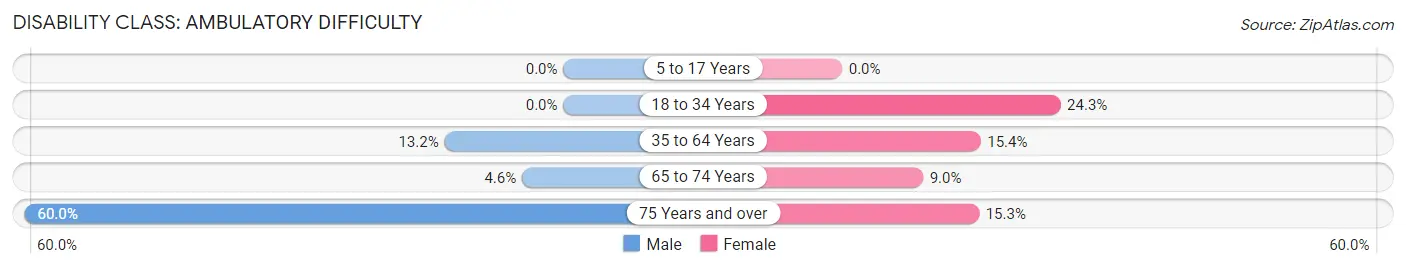
| Age Bracket | Male | Female |
| 5 to 17 Years | 0 (0.0%) | 0 (0.0%) |
| 18 to 34 Years | 0 (0.0%) | 54 (24.3%) |
| 35 to 64 Years | 27 (13.2%) | 35 (15.4%) |
| 65 to 74 Years | 4 (4.6%) | 10 (9.0%) |
| 75 Years and over | 33 (60.0%) | 9 (15.2%) |
Disability Class: Self-Care Difficulty
| Age Bracket | Male | Female |
| 5 to 17 Years | 0 (0.0%) | 0 (0.0%) |
| 18 to 34 Years | 0 (0.0%) | 0 (0.0%) |
| 35 to 64 Years | 3 (1.5%) | 32 (14.1%) |
| 65 to 74 Years | 0 (0.0%) | 3 (2.7%) |
| 75 Years and over | 27 (49.1%) | 6 (10.2%) |
Technology Access in Pemberton borough
Computing Device Access in Pemberton borough
| Device Type | # Households | % Households |
| Desktop or Laptop | 412 | 76.4% |
| Smartphone | 432 | 80.1% |
| Tablet | 360 | 66.8% |
| No Computing Device | 62 | 11.5% |
| Total | 539 | 100.0% |
Internet Access in Pemberton borough
| Internet Type | # Households | % Households |
| Dial-Up Internet | 3 | 0.6% |
| Broadband Home | 363 | 67.3% |
| Cellular Data Only | 58 | 10.8% |
| Satellite Internet | 31 | 5.8% |
| No Internet | 100 | 18.5% |
| Total | 539 | 100.0% |
Pemberton borough Summary
Pemberton Borough is a small borough located in Burlington County, New Jersey. It is situated in the southern part of the state, about 25 miles east of Philadelphia. The borough is bordered by Pemberton Township to the north, Eastampton Township to the east, and North Hanover Township to the south. The population of Pemberton Borough was 4,845 as of the 2010 census.
History
Pemberton Borough was originally part of Northampton Township, which was established in 1688. In 1723, the area was divided into two townships, Northampton and Pemberton. The town of Pemberton was named after the Pemberton family, who were early settlers in the area. The town was incorporated as a borough in 1826.
In the 19th century, Pemberton Borough was a rural farming community. The town was known for its cranberry bogs, which were a major source of income for the local farmers. The cranberry industry was so successful that the town was nicknamed “Cranberry Capital of the World.”
In the early 20th century, Pemberton Borough began to experience rapid growth. The town was connected to the rest of the state by the Pennsylvania Railroad in 1906, and the population increased from 1,000 in 1910 to 4,000 in 1920. The town continued to grow throughout the 20th century, and the population reached 4,845 in 2010.
Geography
Pemberton Borough is located in the southern part of Burlington County, New Jersey. It is situated about 25 miles east of Philadelphia. The borough is bordered by Pemberton Township to the north, Eastampton Township to the east, and North Hanover Township to the south.
The borough has a total area of 2.2 square miles, all of which is land. The terrain is mostly flat, with some rolling hills in the northern part of the borough. The highest point in the borough is located at the intersection of Pemberton-Browns Mills Road and Pemberton-Fort Dix Road, which is about 200 feet above sea level.
Economy
The economy of Pemberton Borough is largely based on agriculture and manufacturing. The town is home to several cranberry bogs, which are a major source of income for the local farmers. The town is also home to several manufacturing companies, including a paper mill, a plastics factory, and a metal fabrication plant.
The borough also has a thriving retail sector, with several stores and restaurants located in the downtown area. The town is also home to several small businesses, including a bakery, a florist, and a hardware store.
Demographics
As of the 2010 census, the population of Pemberton Borough was 4,845. The racial makeup of the borough was 79.3% White, 14.2% African American, 0.5% Native American, 1.2% Asian, and 4.8% from other races. Hispanic or Latino of any race were 8.2% of the population.
The median household income in Pemberton Borough was $50,945, and the median family income was $60,917. About 11.2% of families and 13.3% of the population were below the poverty line, including 17.2% of those under age 18 and 8.2% of those age 65 or over.
Common Questions
What is Per Capita Income in Pemberton borough?
Per Capita income in Pemberton borough is $38,637.
What is the Median Family Income in Pemberton borough?
Median Family Income in Pemberton borough is $86,563.
What is the Median Household income in Pemberton borough?
Median Household Income in Pemberton borough is $85,701.
What is Income or Wage Gap in Pemberton borough?
Income or Wage Gap in Pemberton borough is 19.6%.
Women in Pemberton borough earn 80.4 cents for every dollar earned by a man.
What is Inequality or Gini Index in Pemberton borough?
Inequality or Gini Index in Pemberton borough is 0.38.
What is the Total Population of Pemberton borough?
Total Population of Pemberton borough is 1,338.
What is the Total Male Population of Pemberton borough?
Total Male Population of Pemberton borough is 609.
What is the Total Female Population of Pemberton borough?
Total Female Population of Pemberton borough is 729.
What is the Ratio of Males per 100 Females in Pemberton borough?
There are 83.54 Males per 100 Females in Pemberton borough.
What is the Ratio of Females per 100 Males in Pemberton borough?
There are 119.70 Females per 100 Males in Pemberton borough.
What is the Median Population Age in Pemberton borough?
Median Population Age in Pemberton borough is 43.7 Years.
What is the Average Family Size in Pemberton borough
Average Family Size in Pemberton borough is 2.9 People.
What is the Average Household Size in Pemberton borough
Average Household Size in Pemberton borough is 2.5 People.
How Large is the Labor Force in Pemberton borough?
There are 735 People in the Labor Forcein in Pemberton borough.
What is the Percentage of People in the Labor Force in Pemberton borough?
64.4% of People are in the Labor Force in Pemberton borough.
What is the Unemployment Rate in Pemberton borough?
Unemployment Rate in Pemberton borough is 5.8%.