Pine Hill borough, NJ Map & Demographics
Pine Hill borough Overview
$41,194
PER CAPITA INCOME
$84,778
AVG FAMILY INCOME
$69,176
AVG HOUSEHOLD INCOME
22.5%
WAGE / INCOME GAP [ % ]
77.5¢/ $1
WAGE / INCOME GAP [ $ ]
0.49
INEQUALITY / GINI INDEX
10,698
TOTAL POPULATION
5,084
MALE POPULATION
5,614
FEMALE POPULATION
90.56
MALES / 100 FEMALES
110.42
FEMALES / 100 MALES
35.6
MEDIAN AGE
3.2
AVG FAMILY SIZE
2.4
AVG HOUSEHOLD SIZE
6,110
LABOR FORCE [ PEOPLE ]
70.8%
PERCENT IN LABOR FORCE
8.3%
UNEMPLOYMENT RATE
Income in Pine Hill borough
Income Overview in Pine Hill borough
Per Capita Income in Pine Hill borough is $41,194, while median incomes of families and households are $84,778 and $69,176 respectively.
| Characteristic | Number | Measure |
| Per Capita Income | 10,698 | $41,194 |
| Median Family Income | 2,474 | $84,778 |
| Mean Family Income | 2,474 | $125,136 |
| Median Household Income | 4,439 | $69,176 |
| Mean Household Income | 4,439 | $97,377 |
| Income Deficit | 2,474 | $0 |
| Wage / Income Gap (%) | 10,698 | 22.54% |
| Wage / Income Gap ($) | 10,698 | 77.46¢ per $1 |
| Gini / Inequality Index | 10,698 | 0.49 |
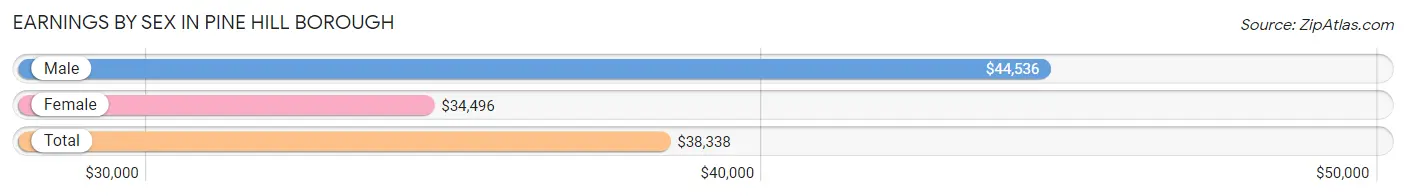
Earnings by Sex in Pine Hill borough
Average Earnings in Pine Hill borough are $38,338, $44,536 for men and $34,496 for women, a difference of 22.5%.
| Sex | Number | Average Earnings |
| Male | 2,675 (44.3%) | $44,536 |
| Female | 3,369 (55.7%) | $34,496 |
| Total | 6,044 (100.0%) | $38,338 |
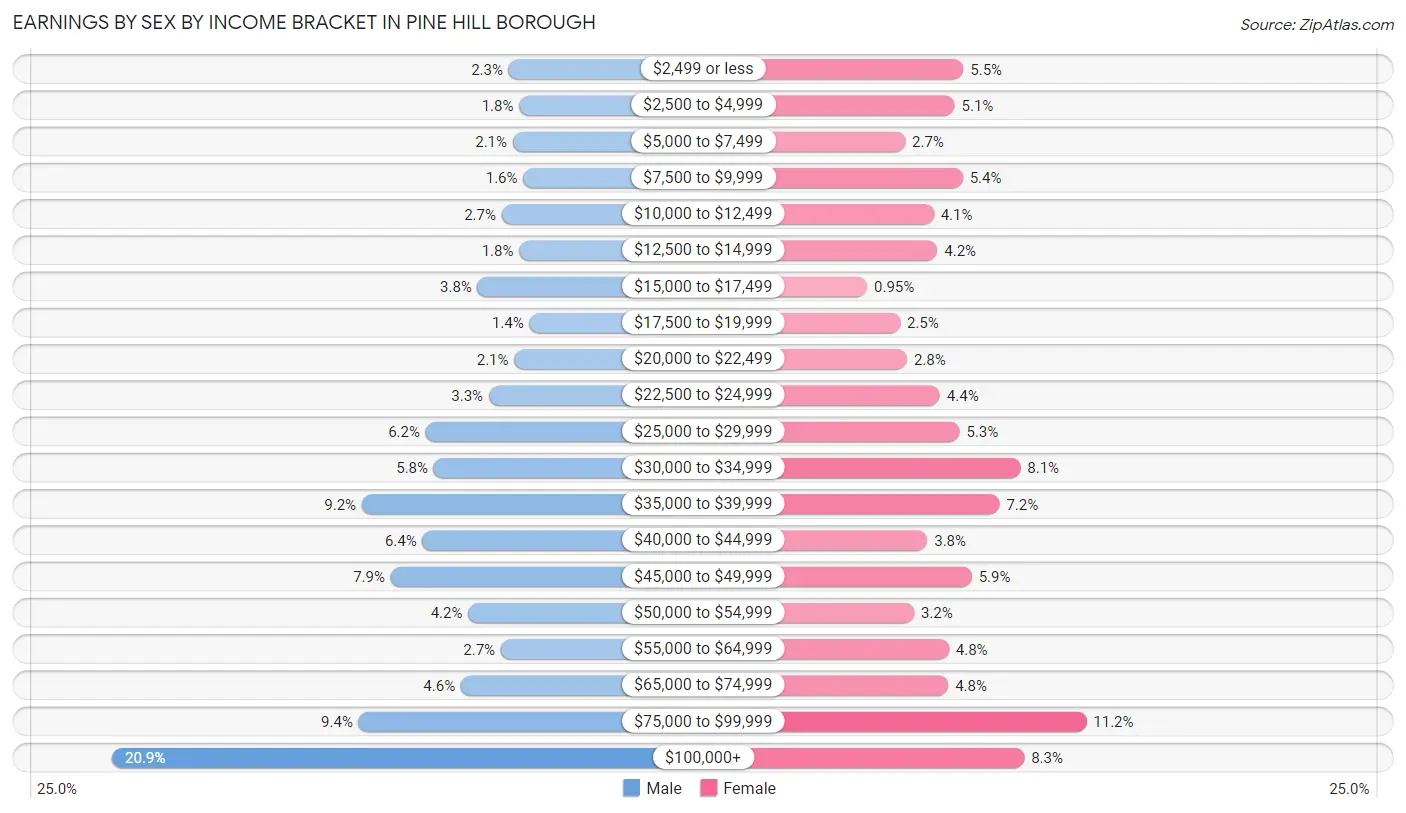
Earnings by Sex by Income Bracket in Pine Hill borough
The most common earnings brackets in Pine Hill borough are $100,000+ for men (559 | 20.9%) and $75,000 to $99,999 for women (378 | 11.2%).
| Income | Male | Female |
| $2,499 or less | 62 (2.3%) | 184 (5.5%) |
| $2,500 to $4,999 | 49 (1.8%) | 170 (5.1%) |
| $5,000 to $7,499 | 57 (2.1%) | 92 (2.7%) |
| $7,500 to $9,999 | 44 (1.6%) | 183 (5.4%) |
| $10,000 to $12,499 | 71 (2.6%) | 137 (4.1%) |
| $12,500 to $14,999 | 49 (1.8%) | 143 (4.2%) |
| $15,000 to $17,499 | 101 (3.8%) | 32 (0.9%) |
| $17,500 to $19,999 | 36 (1.3%) | 84 (2.5%) |
| $20,000 to $22,499 | 55 (2.1%) | 95 (2.8%) |
| $22,500 to $24,999 | 87 (3.3%) | 147 (4.4%) |
| $25,000 to $29,999 | 166 (6.2%) | 178 (5.3%) |
| $30,000 to $34,999 | 156 (5.8%) | 274 (8.1%) |
| $35,000 to $39,999 | 246 (9.2%) | 241 (7.1%) |
| $40,000 to $44,999 | 170 (6.4%) | 127 (3.8%) |
| $45,000 to $49,999 | 210 (7.9%) | 197 (5.9%) |
| $50,000 to $54,999 | 113 (4.2%) | 106 (3.2%) |
| $55,000 to $64,999 | 72 (2.7%) | 161 (4.8%) |
| $65,000 to $74,999 | 122 (4.6%) | 160 (4.8%) |
| $75,000 to $99,999 | 250 (9.3%) | 378 (11.2%) |
| $100,000+ | 559 (20.9%) | 280 (8.3%) |
| Total | 2,675 (100.0%) | 3,369 (100.0%) |
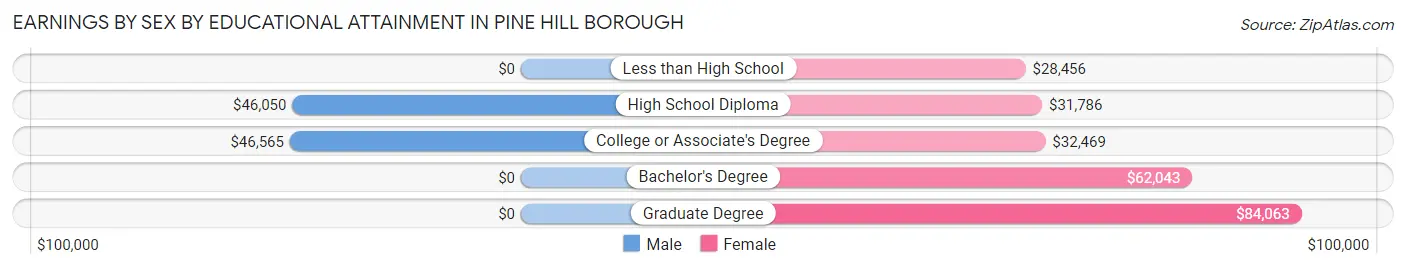
Earnings by Sex by Educational Attainment in Pine Hill borough
Average earnings in Pine Hill borough are $47,750 for men and $39,296 for women, a difference of 17.7%. Men with an educational attainment of college or associate's degree enjoy the highest average annual earnings of $46,565, while those with high school diploma education earn the least with $46,050. Women with an educational attainment of graduate degree earn the most with the average annual earnings of $84,063, while those with less than high school education have the smallest earnings of $28,456.
| Educational Attainment | Male Income | Female Income |
| Less than High School | - | - |
| High School Diploma | $46,050 | $31,786 |
| College or Associate's Degree | $46,565 | $32,469 |
| Bachelor's Degree | - | - |
| Graduate Degree | - | - |
| Total | $47,750 | $39,296 |
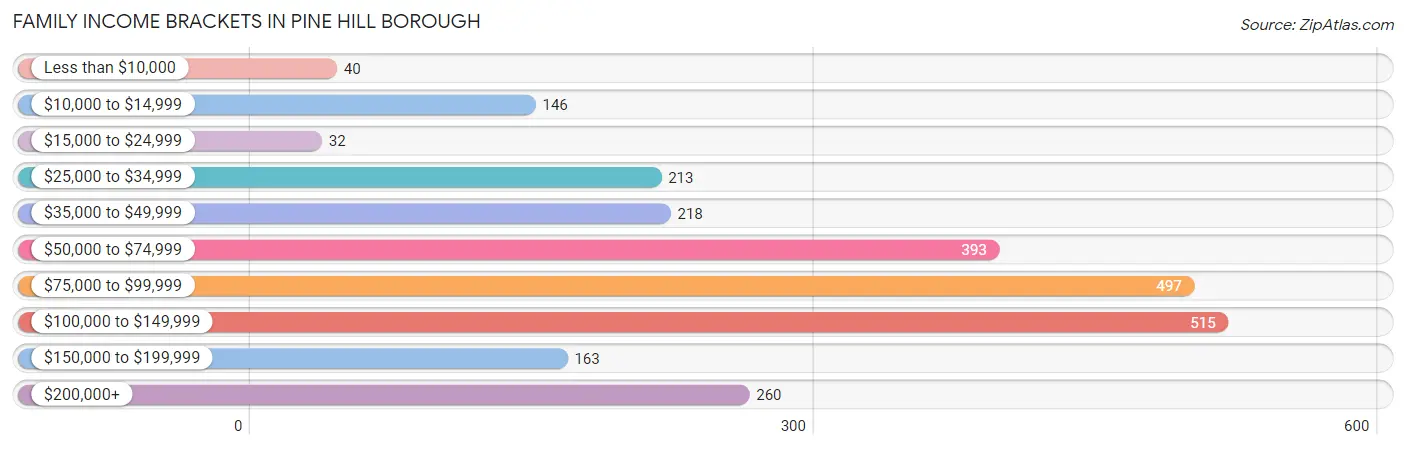
Family Income in Pine Hill borough
Family Income Brackets in Pine Hill borough
According to the Pine Hill borough family income data, there are 515 families falling into the $100,000 to $149,999 income range, which is the most common income bracket and makes up 20.8% of all families. Conversely, the $15,000 to $24,999 income bracket is the least frequent group with only 32 families (1.3%) belonging to this category.
| Income Bracket | # Families | % Families |
| Less than $10,000 | 40 | 1.6% |
| $10,000 to $14,999 | 146 | 5.9% |
| $15,000 to $24,999 | 32 | 1.3% |
| $25,000 to $34,999 | 213 | 8.6% |
| $35,000 to $49,999 | 218 | 8.8% |
| $50,000 to $74,999 | 393 | 15.9% |
| $75,000 to $99,999 | 497 | 20.1% |
| $100,000 to $149,999 | 515 | 20.8% |
| $150,000 to $199,999 | 163 | 6.6% |
| $200,000+ | 260 | 10.5% |
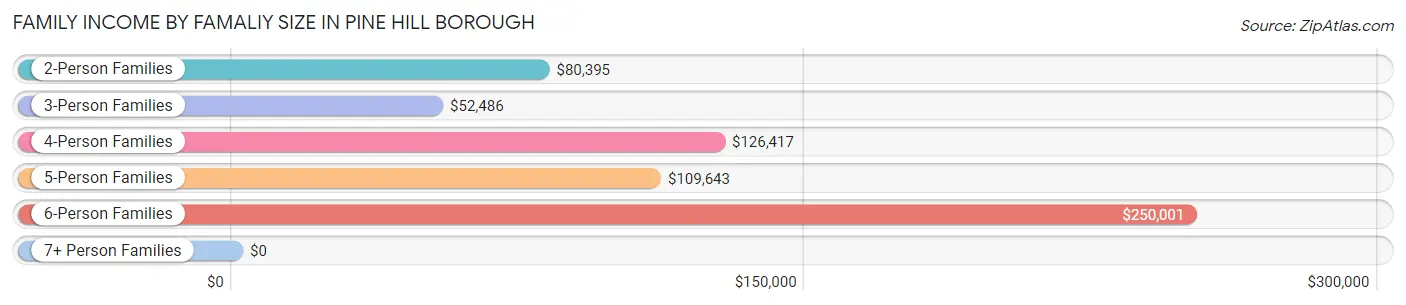
Family Income by Famaliy Size in Pine Hill borough
6-person families (80 | 3.2%) account for the highest median family income in Pine Hill borough with $250,001 per family, while 6-person families (80 | 3.2%) have the highest median income of $41,667 per family member.
| Income Bracket | # Families | Median Income |
| 2-Person Families | 978 (39.5%) | $80,395 |
| 3-Person Families | 899 (36.3%) | $52,486 |
| 4-Person Families | 365 (14.7%) | $126,417 |
| 5-Person Families | 98 (4.0%) | $109,643 |
| 6-Person Families | 80 (3.2%) | $250,001 |
| 7+ Person Families | 54 (2.2%) | $0 |
| Total | 2,474 (100.0%) | $84,778 |
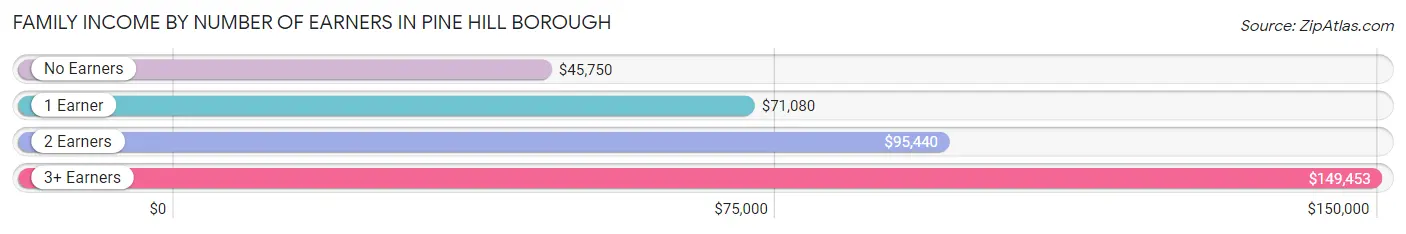
Family Income by Number of Earners in Pine Hill borough
The median family income in Pine Hill borough is $84,778, with families comprising 3+ earners (315) having the highest median family income of $149,453, while families with no earners (273) have the lowest median family income of $45,750, accounting for 12.7% and 11.0% of families, respectively.
| Number of Earners | # Families | Median Income |
| No Earners | 273 (11.0%) | $45,750 |
| 1 Earner | 939 (38.0%) | $71,080 |
| 2 Earners | 947 (38.3%) | $95,440 |
| 3+ Earners | 315 (12.7%) | $149,453 |
| Total | 2,474 (100.0%) | $84,778 |
Household Income in Pine Hill borough
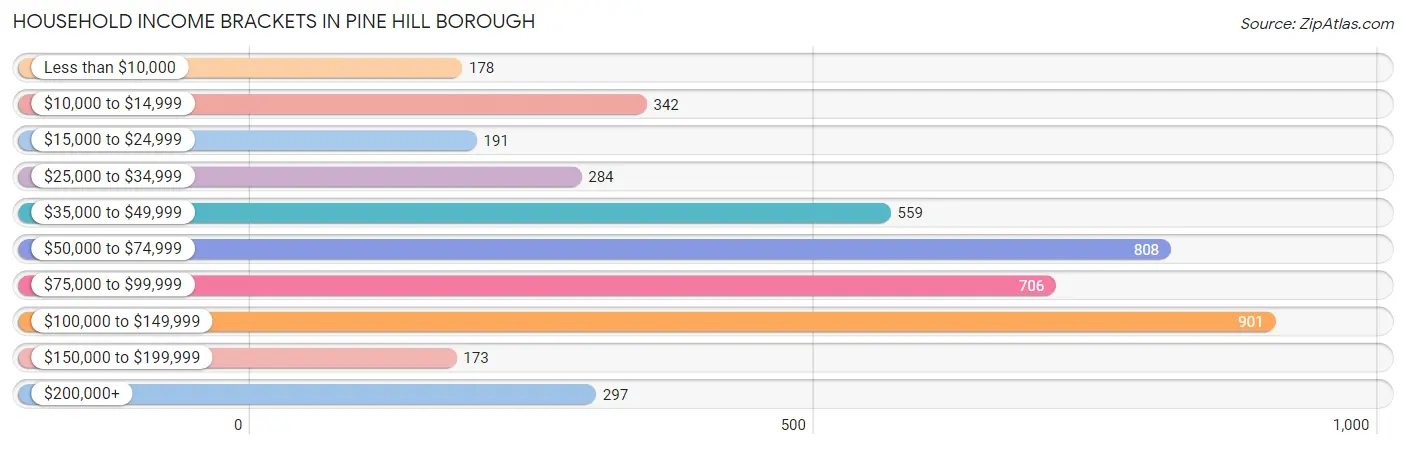
Household Income Brackets in Pine Hill borough
With 901 households falling in the category, the $100,000 to $149,999 income range is the most frequent in Pine Hill borough, accounting for 20.3% of all households. In contrast, only 173 households (3.9%) fall into the $150,000 to $199,999 income bracket, making it the least populous group.
| Income Bracket | # Households | % Households |
| Less than $10,000 | 178 | 4.0% |
| $10,000 to $14,999 | 342 | 7.7% |
| $15,000 to $24,999 | 191 | 4.3% |
| $25,000 to $34,999 | 284 | 6.4% |
| $35,000 to $49,999 | 559 | 12.6% |
| $50,000 to $74,999 | 808 | 18.2% |
| $75,000 to $99,999 | 706 | 15.9% |
| $100,000 to $149,999 | 901 | 20.3% |
| $150,000 to $199,999 | 173 | 3.9% |
| $200,000+ | 297 | 6.7% |
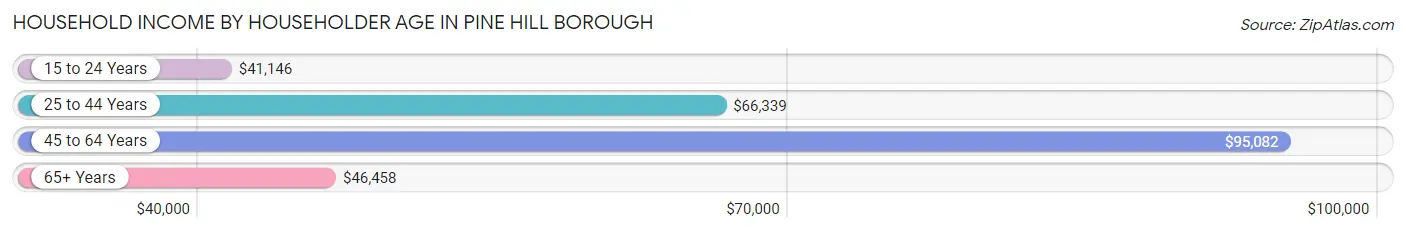
Household Income by Householder Age in Pine Hill borough
The median household income in Pine Hill borough is $69,176, with the highest median household income of $95,082 found in the 45 to 64 years age bracket for the primary householder. A total of 1,827 households (41.2%) fall into this category. Meanwhile, the 15 to 24 years age bracket for the primary householder has the lowest median household income of $41,146, with 95 households (2.1%) in this group.
| Income Bracket | # Households | Median Income |
| 15 to 24 Years | 95 (2.1%) | $41,146 |
| 25 to 44 Years | 1,716 (38.7%) | $66,339 |
| 45 to 64 Years | 1,827 (41.2%) | $95,082 |
| 65+ Years | 801 (18.0%) | $46,458 |
| Total | 4,439 (100.0%) | $69,176 |
Poverty in Pine Hill borough
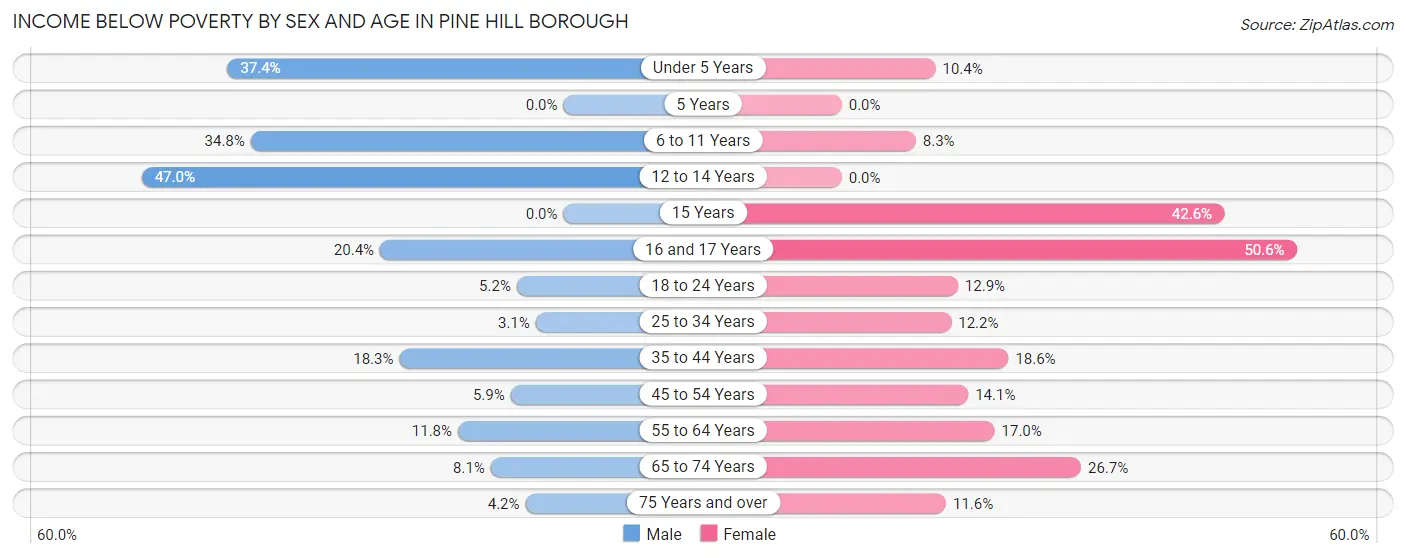
Income Below Poverty by Sex and Age in Pine Hill borough
With 15.3% poverty level for males and 15.7% for females among the residents of Pine Hill borough, 12 to 14 year old males and 16 and 17 year old females are the most vulnerable to poverty, with 100 males (46.9%) and 40 females (50.6%) in their respective age groups living below the poverty level.
| Age Bracket | Male | Female |
| Under 5 Years | 199 (37.4%) | 31 (10.4%) |
| 5 Years | 0 (0.0%) | 0 (0.0%) |
| 6 to 11 Years | 140 (34.8%) | 33 (8.3%) |
| 12 to 14 Years | 100 (46.9%) | 0 (0.0%) |
| 15 Years | 0 (0.0%) | 40 (42.5%) |
| 16 and 17 Years | 38 (20.4%) | 40 (50.6%) |
| 18 to 24 Years | 28 (5.2%) | 64 (12.9%) |
| 25 to 34 Years | 21 (3.1%) | 143 (12.2%) |
| 35 to 44 Years | 95 (18.3%) | 167 (18.6%) |
| 45 to 54 Years | 40 (5.9%) | 78 (14.1%) |
| 55 to 64 Years | 72 (11.7%) | 151 (17.0%) |
| 65 to 74 Years | 30 (8.1%) | 105 (26.7%) |
| 75 Years and over | 12 (4.2%) | 31 (11.6%) |
| Total | 775 (15.3%) | 883 (15.7%) |
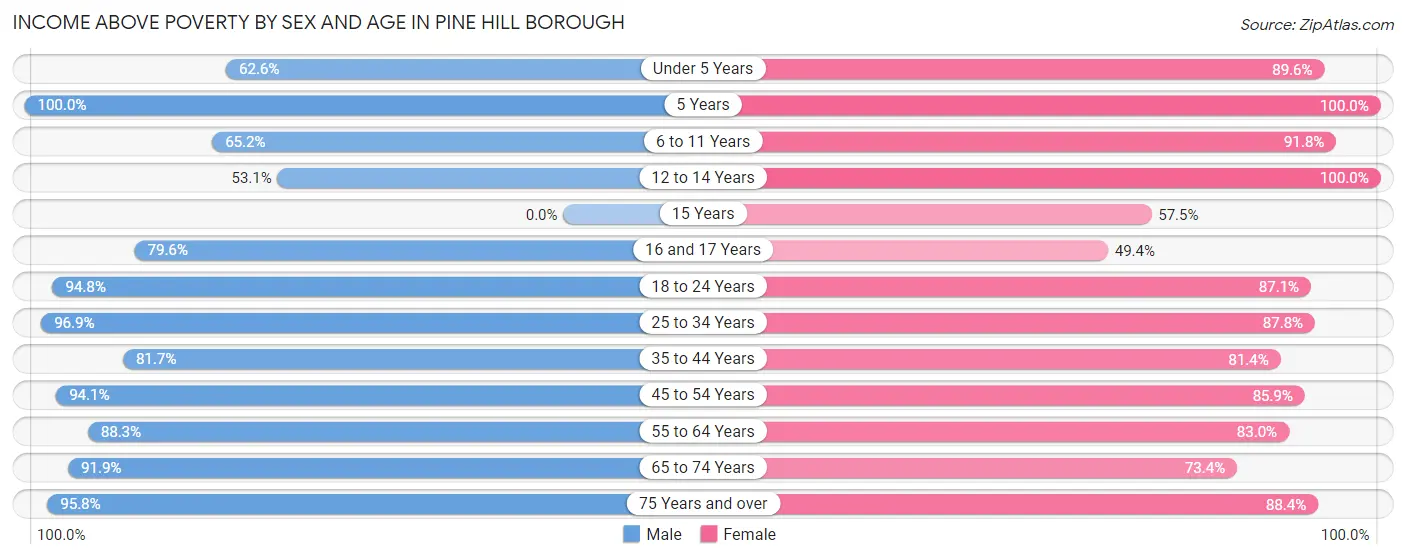
Income Above Poverty by Sex and Age in Pine Hill borough
According to the poverty statistics in Pine Hill borough, males aged 5 years and females aged 5 years are the age groups that are most secure financially, with 100.0% of males and 100.0% of females in these age groups living above the poverty line.
| Age Bracket | Male | Female |
| Under 5 Years | 333 (62.6%) | 266 (89.6%) |
| 5 Years | 59 (100.0%) | 31 (100.0%) |
| 6 to 11 Years | 262 (65.2%) | 367 (91.7%) |
| 12 to 14 Years | 113 (53.0%) | 38 (100.0%) |
| 15 Years | 0 (0.0%) | 54 (57.5%) |
| 16 and 17 Years | 148 (79.6%) | 39 (49.4%) |
| 18 to 24 Years | 512 (94.8%) | 431 (87.1%) |
| 25 to 34 Years | 659 (96.9%) | 1,030 (87.8%) |
| 35 to 44 Years | 425 (81.7%) | 733 (81.4%) |
| 45 to 54 Years | 640 (94.1%) | 476 (85.9%) |
| 55 to 64 Years | 541 (88.2%) | 736 (83.0%) |
| 65 to 74 Years | 341 (91.9%) | 289 (73.4%) |
| 75 Years and over | 272 (95.8%) | 236 (88.4%) |
| Total | 4,305 (84.7%) | 4,726 (84.3%) |
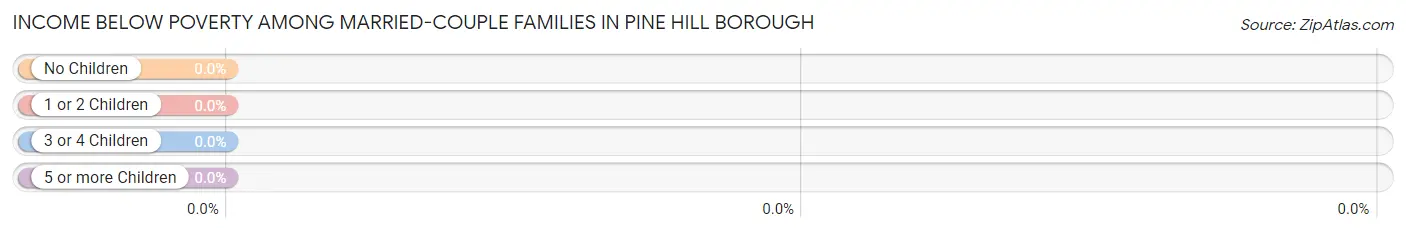
Income Below Poverty Among Married-Couple Families in Pine Hill borough
| Children | Above Poverty | Below Poverty |
| No Children | 1,013 (100.0%) | 0 (0.0%) |
| 1 or 2 Children | 343 (100.0%) | 0 (0.0%) |
| 3 or 4 Children | 79 (100.0%) | 0 (0.0%) |
| 5 or more Children | 0 (0.0%) | 0 (0.0%) |
| Total | 1,435 (100.0%) | 0 (0.0%) |
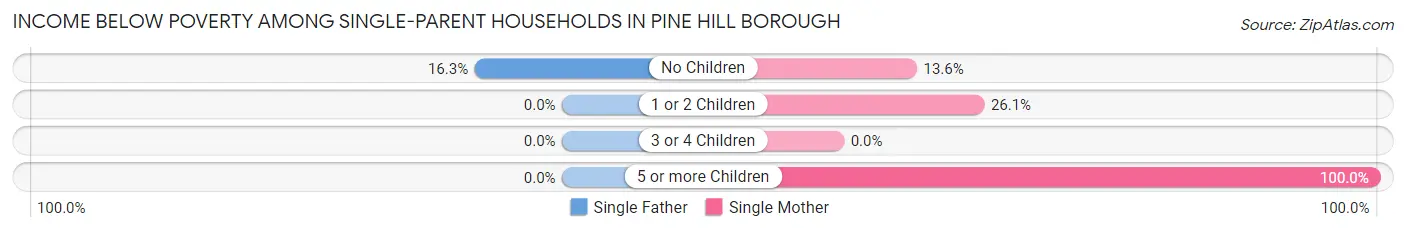
Income Below Poverty Among Single-Parent Households in Pine Hill borough
According to the poverty data in Pine Hill borough, 9.3% or 15 single-father households and 26.5% or 232 single-mother households are living below the poverty line. Among single-father households, those with no children have the highest poverty rate, with 15 households (16.3%) experiencing poverty. Likewise, among single-mother households, those with 5 or more children have the highest poverty rate, with 39 households (100.0%) falling below the poverty line.
| Children | Single Father | Single Mother |
| No Children | 15 (16.3%) | 19 (13.6%) |
| 1 or 2 Children | 0 (0.0%) | 174 (26.1%) |
| 3 or 4 Children | 0 (0.0%) | 0 (0.0%) |
| 5 or more Children | 0 (0.0%) | 39 (100.0%) |
| Total | 15 (9.3%) | 232 (26.5%) |
Income Below Poverty Among Married-Couple vs Single-Parent Households in Pine Hill borough
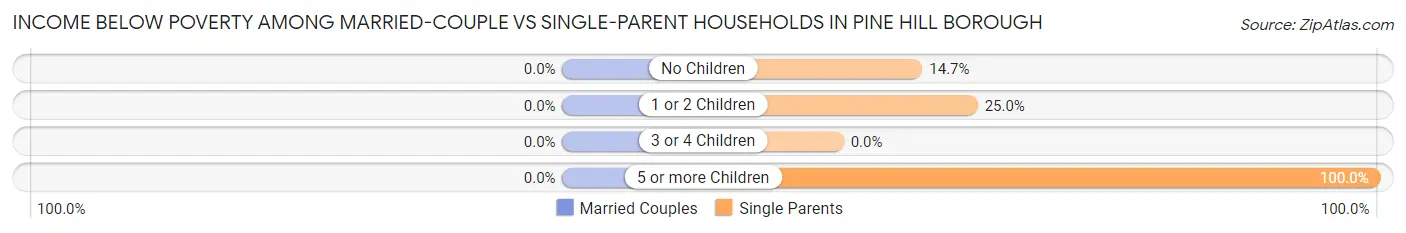
| Children | Married-Couple Families | Single-Parent Households |
| No Children | 0 (0.0%) | 34 (14.7%) |
| 1 or 2 Children | 0 (0.0%) | 174 (25.0%) |
| 3 or 4 Children | 0 (0.0%) | 0 (0.0%) |
| 5 or more Children | 0 (0.0%) | 39 (100.0%) |
| Total | 0 (0.0%) | 247 (23.8%) |
Race in Pine Hill borough
The most populous races in Pine Hill borough are White / Caucasian (5,970 | 55.8%), Black / African American (2,926 | 27.4%), and Two or more Races (1,276 | 11.9%).
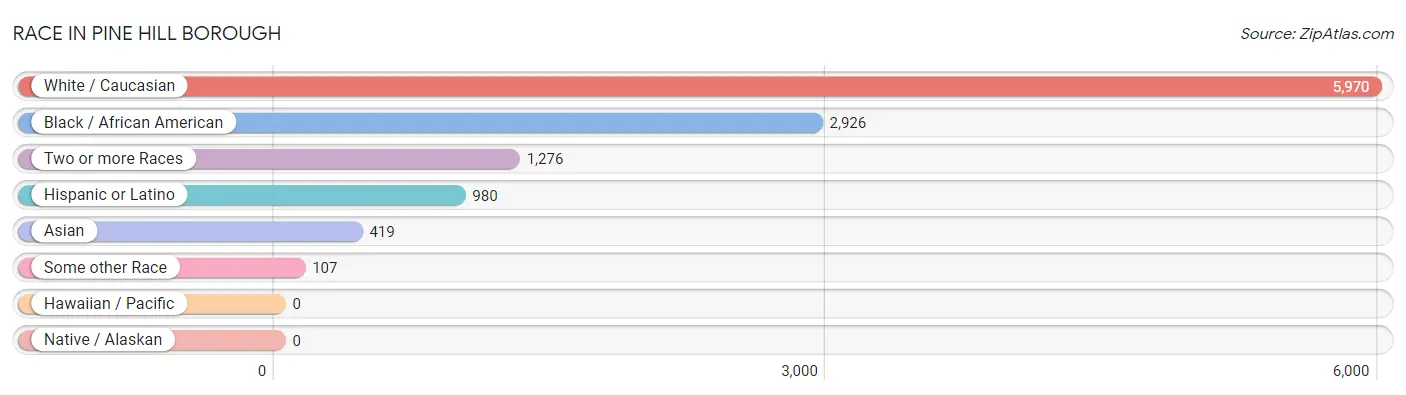
| Race | # Population | % Population |
| Asian | 419 | 3.9% |
| Black / African American | 2,926 | 27.4% |
| Hawaiian / Pacific | 0 | 0.0% |
| Hispanic or Latino | 980 | 9.2% |
| Native / Alaskan | 0 | 0.0% |
| White / Caucasian | 5,970 | 55.8% |
| Two or more Races | 1,276 | 11.9% |
| Some other Race | 107 | 1.0% |
| Total | 10,698 | 100.0% |
Ancestry in Pine Hill borough
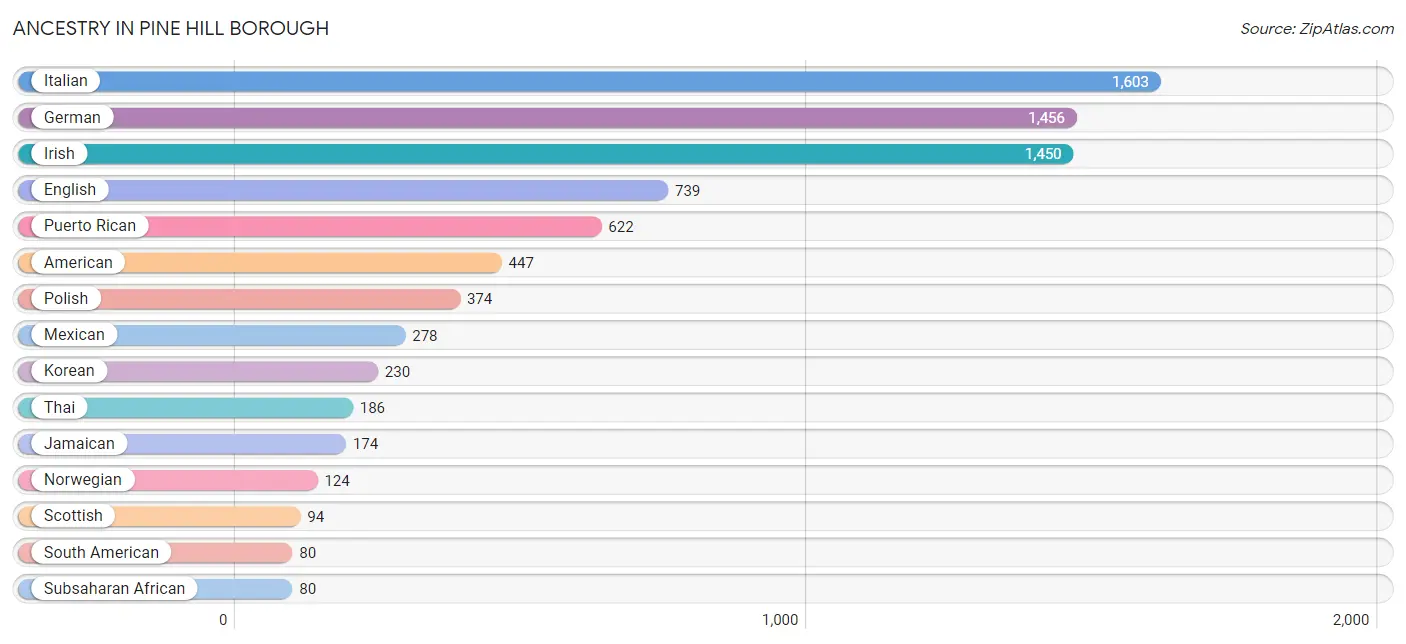
The most populous ancestries reported in Pine Hill borough are Italian (1,603 | 15.0%), German (1,456 | 13.6%), Irish (1,450 | 13.6%), English (739 | 6.9%), and Puerto Rican (622 | 5.8%), together accounting for 54.9% of all Pine Hill borough residents.
| Ancestry | # Population | % Population |
| African | 53 | 0.5% |
| American | 447 | 4.2% |
| Arab | 27 | 0.3% |
| Argentinean | 23 | 0.2% |
| Bhutanese | 7 | 0.1% |
| British | 5 | 0.1% |
| Burmese | 27 | 0.3% |
| Cherokee | 54 | 0.5% |
| Colombian | 57 | 0.5% |
| Czech | 32 | 0.3% |
| Danish | 19 | 0.2% |
| Dutch | 79 | 0.7% |
| English | 739 | 6.9% |
| European | 33 | 0.3% |
| French | 4 | 0.0% |
| French American Indian | 4 | 0.0% |
| French Canadian | 54 | 0.5% |
| German | 1,456 | 13.6% |
| Haitian | 16 | 0.2% |
| Hungarian | 41 | 0.4% |
| Indian (Asian) | 35 | 0.3% |
| Irish | 1,450 | 13.6% |
| Italian | 1,603 | 15.0% |
| Jamaican | 174 | 1.6% |
| Japanese | 16 | 0.2% |
| Korean | 230 | 2.1% |
| Lithuanian | 19 | 0.2% |
| Mexican | 278 | 2.6% |
| Northern European | 10 | 0.1% |
| Norwegian | 124 | 1.2% |
| Pennsylvania German | 32 | 0.3% |
| Polish | 374 | 3.5% |
| Portuguese | 9 | 0.1% |
| Puerto Rican | 622 | 5.8% |
| Russian | 48 | 0.4% |
| Scotch-Irish | 18 | 0.2% |
| Scottish | 94 | 0.9% |
| Serbian | 18 | 0.2% |
| South American | 80 | 0.7% |
| Subsaharan African | 80 | 0.7% |
| Swedish | 22 | 0.2% |
| Swiss | 34 | 0.3% |
| Syrian | 27 | 0.3% |
| Thai | 186 | 1.7% |
| Ukrainian | 34 | 0.3% | View All 45 Rows |
Immigrants in Pine Hill borough
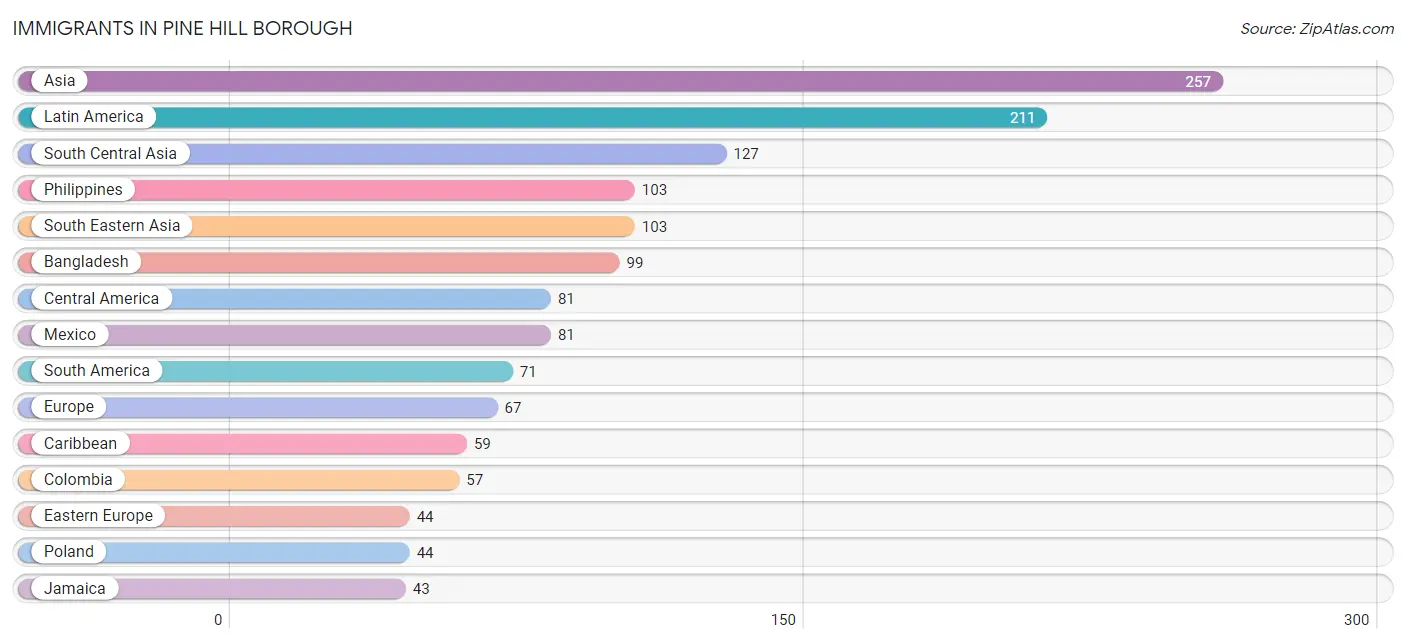
The most numerous immigrant groups reported in Pine Hill borough came from Asia (257 | 2.4%), Latin America (211 | 2.0%), South Central Asia (127 | 1.2%), Philippines (103 | 1.0%), and South Eastern Asia (103 | 1.0%), together accounting for 7.5% of all Pine Hill borough residents.
| Immigration Origin | # Population | % Population |
| Asia | 257 | 2.4% |
| Bangladesh | 99 | 0.9% |
| Caribbean | 59 | 0.5% |
| Central America | 81 | 0.8% |
| Colombia | 57 | 0.5% |
| Eastern Asia | 27 | 0.3% |
| Eastern Europe | 44 | 0.4% |
| Europe | 67 | 0.6% |
| Greece | 9 | 0.1% |
| Haiti | 16 | 0.2% |
| India | 24 | 0.2% |
| Italy | 14 | 0.1% |
| Jamaica | 43 | 0.4% |
| Korea | 27 | 0.3% |
| Latin America | 211 | 2.0% |
| Mexico | 81 | 0.8% |
| Pakistan | 4 | 0.0% |
| Philippines | 103 | 1.0% |
| Poland | 44 | 0.4% |
| South America | 71 | 0.7% |
| South Central Asia | 127 | 1.2% |
| South Eastern Asia | 103 | 1.0% |
| Southern Europe | 23 | 0.2% | View All 23 Rows |
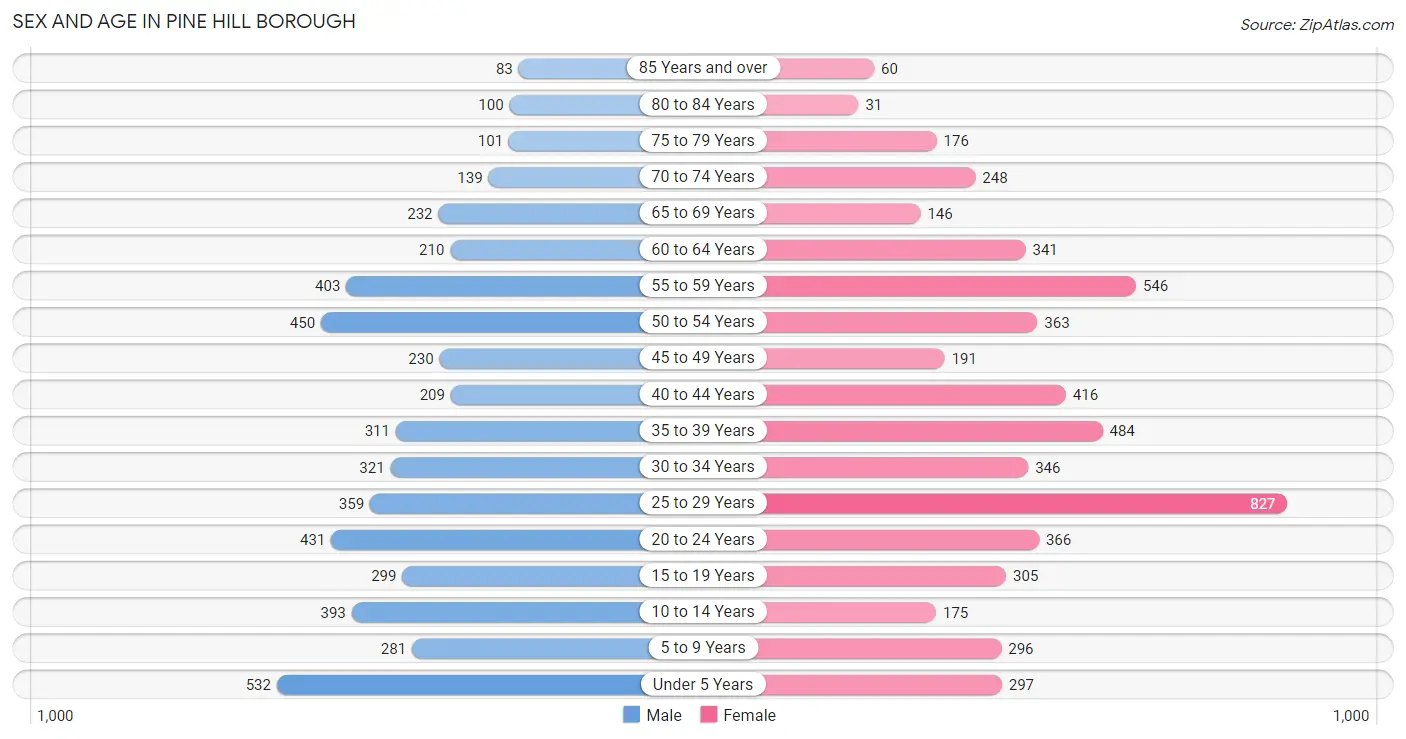
Sex and Age in Pine Hill borough
Sex and Age in Pine Hill borough
The most populous age groups in Pine Hill borough are Under 5 Years (532 | 10.5%) for men and 25 to 29 Years (827 | 14.7%) for women.
| Age Bracket | Male | Female |
| Under 5 Years | 532 (10.5%) | 297 (5.3%) |
| 5 to 9 Years | 281 (5.5%) | 296 (5.3%) |
| 10 to 14 Years | 393 (7.7%) | 175 (3.1%) |
| 15 to 19 Years | 299 (5.9%) | 305 (5.4%) |
| 20 to 24 Years | 431 (8.5%) | 366 (6.5%) |
| 25 to 29 Years | 359 (7.1%) | 827 (14.7%) |
| 30 to 34 Years | 321 (6.3%) | 346 (6.2%) |
| 35 to 39 Years | 311 (6.1%) | 484 (8.6%) |
| 40 to 44 Years | 209 (4.1%) | 416 (7.4%) |
| 45 to 49 Years | 230 (4.5%) | 191 (3.4%) |
| 50 to 54 Years | 450 (8.8%) | 363 (6.5%) |
| 55 to 59 Years | 403 (7.9%) | 546 (9.7%) |
| 60 to 64 Years | 210 (4.1%) | 341 (6.1%) |
| 65 to 69 Years | 232 (4.6%) | 146 (2.6%) |
| 70 to 74 Years | 139 (2.7%) | 248 (4.4%) |
| 75 to 79 Years | 101 (2.0%) | 176 (3.1%) |
| 80 to 84 Years | 100 (2.0%) | 31 (0.5%) |
| 85 Years and over | 83 (1.6%) | 60 (1.1%) |
| Total | 5,084 (100.0%) | 5,614 (100.0%) |
Families and Households in Pine Hill borough
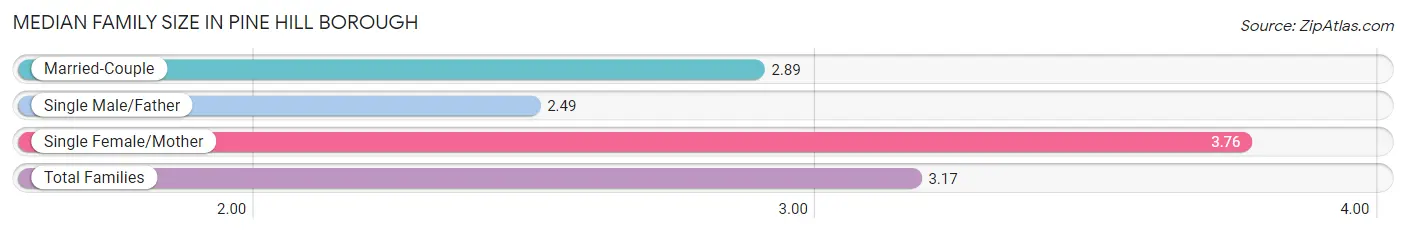
Median Family Size in Pine Hill borough
The median family size in Pine Hill borough is 3.17 persons per family, with single female/mother families (877 | 35.4%) accounting for the largest median family size of 3.76 persons per family. On the other hand, single male/father families (162 | 6.6%) represent the smallest median family size with 2.49 persons per family.
| Family Type | # Families | Family Size |
| Married-Couple | 1,435 (58.0%) | 2.89 |
| Single Male/Father | 162 (6.6%) | 2.49 |
| Single Female/Mother | 877 (35.4%) | 3.76 |
| Total Families | 2,474 (100.0%) | 3.17 |
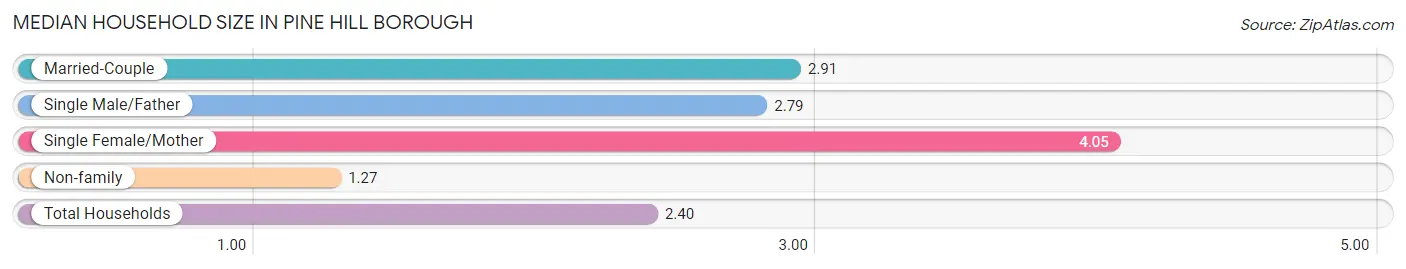
Median Household Size in Pine Hill borough
The median household size in Pine Hill borough is 2.40 persons per household, with single female/mother households (877 | 19.8%) accounting for the largest median household size of 4.05 persons per household. non-family households (1,965 | 44.3%) represent the smallest median household size with 1.27 persons per household.
| Household Type | # Households | Household Size |
| Married-Couple | 1,435 (32.3%) | 2.91 |
| Single Male/Father | 162 (3.6%) | 2.79 |
| Single Female/Mother | 877 (19.8%) | 4.05 |
| Non-family | 1,965 (44.3%) | 1.27 |
| Total Households | 4,439 (100.0%) | 2.40 |
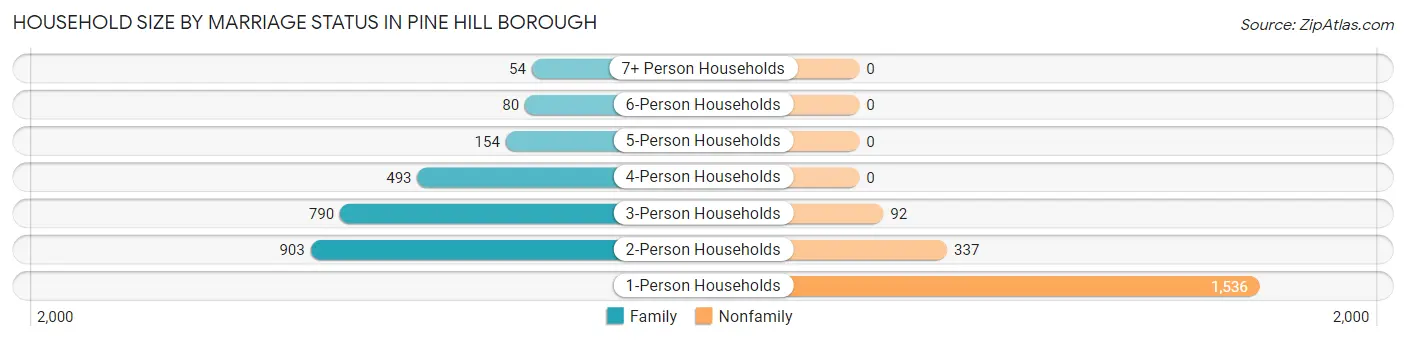
Household Size by Marriage Status in Pine Hill borough
Out of a total of 4,439 households in Pine Hill borough, 2,474 (55.7%) are family households, while 1,965 (44.3%) are nonfamily households. The most numerous type of family households are 2-person households, comprising 903, and the most common type of nonfamily households are 1-person households, comprising 1,536.
| Household Size | Family Households | Nonfamily Households |
| 1-Person Households | - | 1,536 (34.6%) |
| 2-Person Households | 903 (20.3%) | 337 (7.6%) |
| 3-Person Households | 790 (17.8%) | 92 (2.1%) |
| 4-Person Households | 493 (11.1%) | 0 (0.0%) |
| 5-Person Households | 154 (3.5%) | 0 (0.0%) |
| 6-Person Households | 80 (1.8%) | 0 (0.0%) |
| 7+ Person Households | 54 (1.2%) | 0 (0.0%) |
| Total | 2,474 (55.7%) | 1,965 (44.3%) |
Female Fertility in Pine Hill borough
Fertility by Age in Pine Hill borough
Average fertility rate in Pine Hill borough is 60.0 births per 1,000 women. Women in the age bracket of 20 to 34 years have the highest fertility rate with 77.0 births per 1,000 women. Women in the age bracket of 20 to 34 years acount for 66.3% of all women with births.
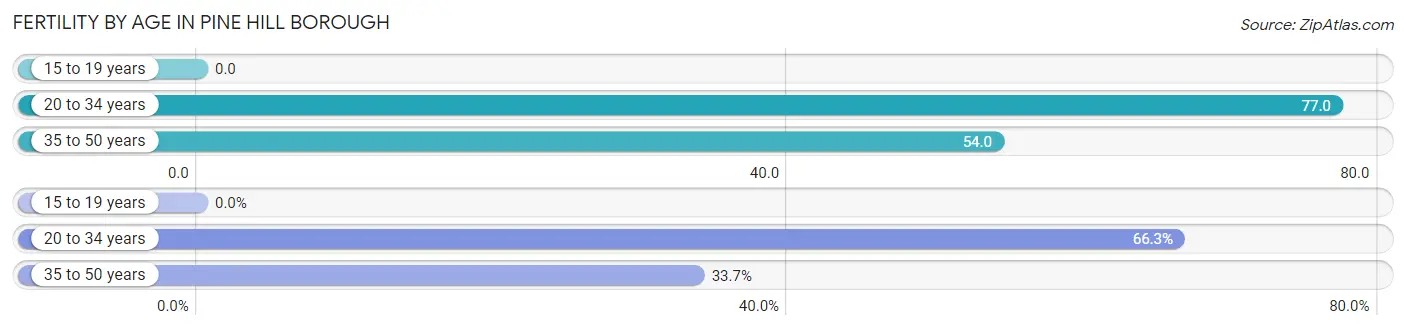
| Age Bracket | Women with Births | Births / 1,000 Women |
| 15 to 19 years | 0 (0.0%) | 0.0 |
| 20 to 34 years | 118 (66.3%) | 77.0 |
| 35 to 50 years | 60 (33.7%) | 54.0 |
| Total | 178 (100.0%) | 60.0 |
Fertility by Age by Marriage Status in Pine Hill borough
48.9% of women with births (178) in Pine Hill borough are married. The highest percentage of unmarried women with births falls into 35 to 50 years age bracket with 75.0% of them unmarried at the time of birth, while the lowest percentage of unmarried women with births belong to 20 to 34 years age bracket with 39.0% of them unmarried.
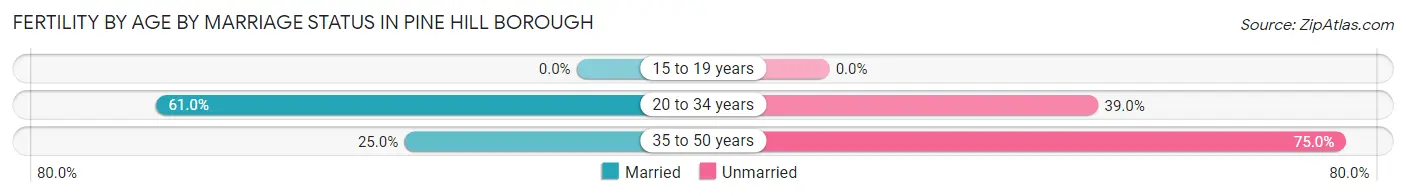
| Age Bracket | Married | Unmarried |
| 15 to 19 years | 0 (0.0%) | 0 (0.0%) |
| 20 to 34 years | 72 (61.0%) | 46 (39.0%) |
| 35 to 50 years | 15 (25.0%) | 45 (75.0%) |
| Total | 87 (48.9%) | 91 (51.1%) |
Fertility by Education in Pine Hill borough
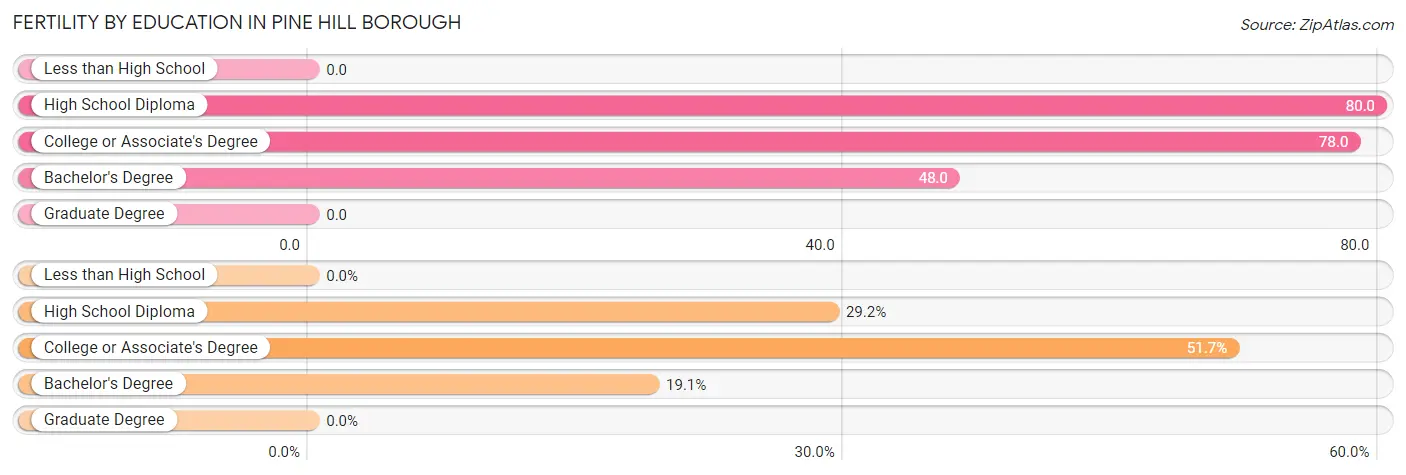
| Educational Attainment | Women with Births | Births / 1,000 Women |
| Less than High School | 0 (0.0%) | 0.0 |
| High School Diploma | 52 (29.2%) | 80.0 |
| College or Associate's Degree | 92 (51.7%) | 78.0 |
| Bachelor's Degree | 34 (19.1%) | 48.0 |
| Graduate Degree | 0 (0.0%) | 0.0 |
| Total | 178 (100.0%) | 60.0 |
Fertility by Education by Marriage Status in Pine Hill borough
51.1% of women with births in Pine Hill borough are unmarried. Women with the educational attainment of bachelor's degree are most likely to be married with 100.0% of them married at childbirth, while women with the educational attainment of high school diploma are least likely to be married with 67.3% of them unmarried at childbirth.
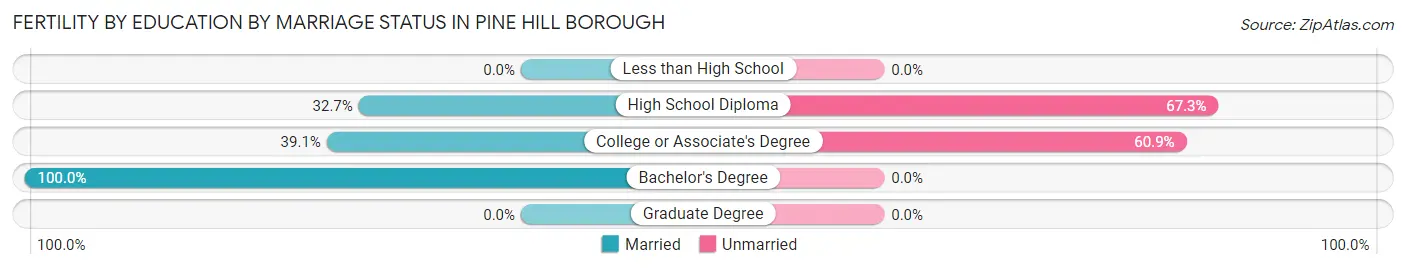
| Educational Attainment | Married | Unmarried |
| Less than High School | 0 (0.0%) | 0 (0.0%) |
| High School Diploma | 17 (32.7%) | 35 (67.3%) |
| College or Associate's Degree | 36 (39.1%) | 56 (60.9%) |
| Bachelor's Degree | 34 (100.0%) | 0 (0.0%) |
| Graduate Degree | 0 (0.0%) | 0 (0.0%) |
| Total | 87 (48.9%) | 91 (51.1%) |
Employment Characteristics in Pine Hill borough
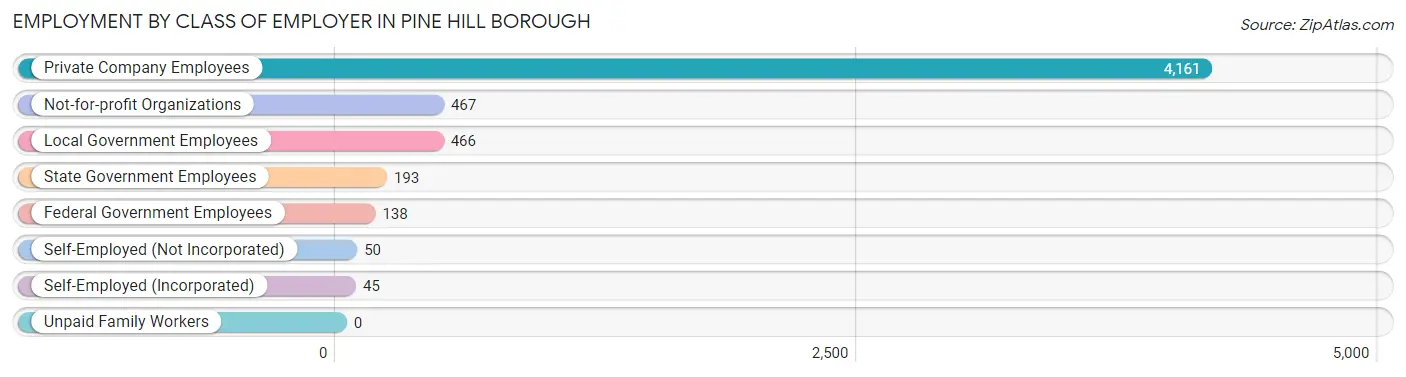
Employment by Class of Employer in Pine Hill borough
Among the 5,520 employed individuals in Pine Hill borough, private company employees (4,161 | 75.4%), not-for-profit organizations (467 | 8.5%), and local government employees (466 | 8.4%) make up the most common classes of employment.
| Employer Class | # Employees | % Employees |
| Private Company Employees | 4,161 | 75.4% |
| Self-Employed (Incorporated) | 45 | 0.8% |
| Self-Employed (Not Incorporated) | 50 | 0.9% |
| Not-for-profit Organizations | 467 | 8.5% |
| Local Government Employees | 466 | 8.4% |
| State Government Employees | 193 | 3.5% |
| Federal Government Employees | 138 | 2.5% |
| Unpaid Family Workers | 0 | 0.0% |
| Total | 5,520 | 100.0% |
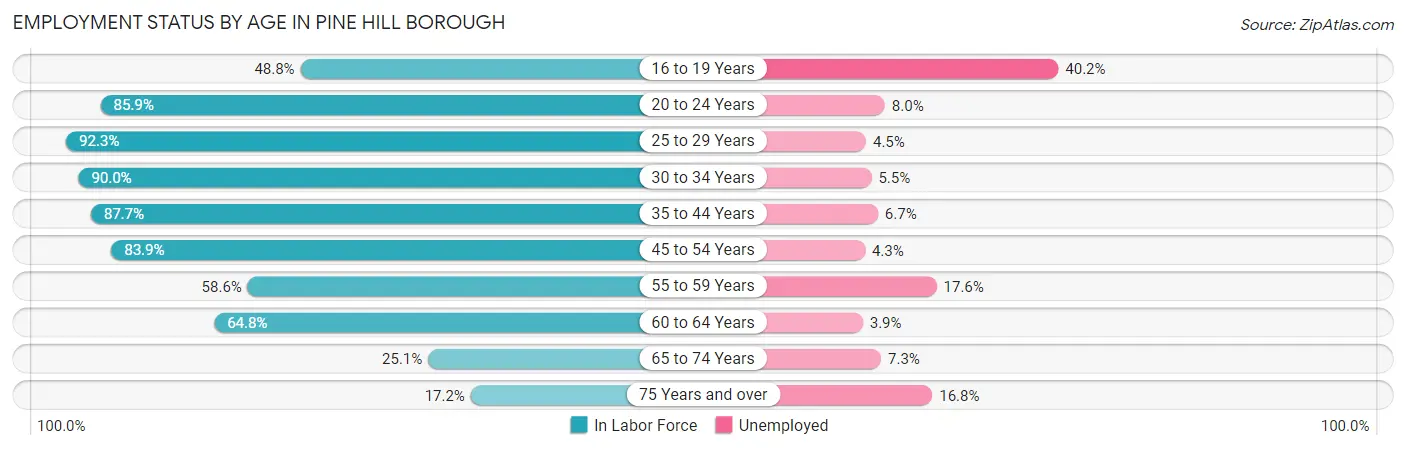
Employment Status by Age in Pine Hill borough
According to the labor force statistics for Pine Hill borough, out of the total population over 16 years of age (8,630), 70.8% or 6,110 individuals are in the labor force, with 8.3% or 507 of them unemployed. The age group with the highest labor force participation rate is 25 to 29 years, with 92.3% or 1,095 individuals in the labor force. Within the labor force, the 16 to 19 years age range has the highest percentage of unemployed individuals, with 40.2% or 100 of them being unemployed.
| Age Bracket | In Labor Force | Unemployed |
| 16 to 19 Years | 249 (48.8%) | 100 (40.2%) |
| 20 to 24 Years | 685 (85.9%) | 55 (8.0%) |
| 25 to 29 Years | 1,095 (92.3%) | 49 (4.5%) |
| 30 to 34 Years | 600 (90.0%) | 33 (5.5%) |
| 35 to 44 Years | 1,245 (87.7%) | 83 (6.7%) |
| 45 to 54 Years | 1,035 (83.9%) | 45 (4.3%) |
| 55 to 59 Years | 556 (58.6%) | 98 (17.6%) |
| 60 to 64 Years | 357 (64.8%) | 14 (3.9%) |
| 65 to 74 Years | 192 (25.1%) | 14 (7.3%) |
| 75 Years and over | 95 (17.2%) | 16 (16.8%) |
| Total | 6,110 (70.8%) | 507 (8.3%) |
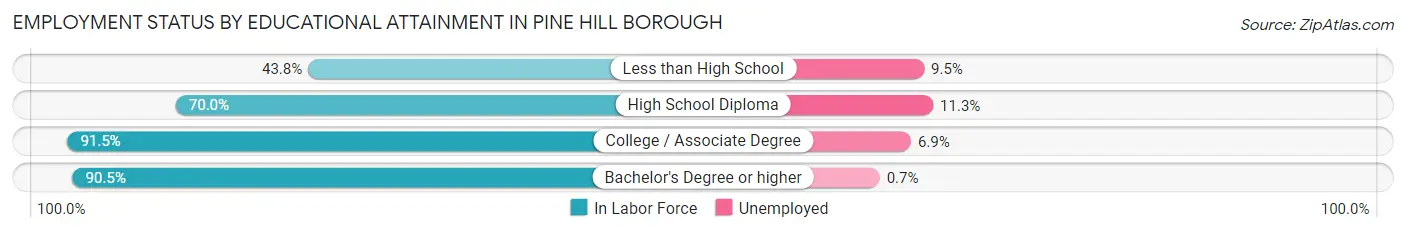
Employment Status by Educational Attainment in Pine Hill borough
According to labor force statistics for Pine Hill borough, 81.4% of individuals (4,890) out of the total population between 25 and 64 years of age (6,007) are in the labor force, with 6.6% or 323 of them being unemployed. The group with the highest labor force participation rate are those with the educational attainment of college / associate degree, with 91.5% or 1,873 individuals in the labor force. Within the labor force, individuals with high school diploma education have the highest percentage of unemployment, with 11.3% or 172 of them being unemployed.
| Educational Attainment | In Labor Force | Unemployed |
| Less than High School | 116 (43.8%) | 25 (9.5%) |
| High School Diploma | 1,524 (70.0%) | 246 (11.3%) |
| College / Associate Degree | 1,873 (91.5%) | 141 (6.9%) |
| Bachelor's Degree or higher | 1,374 (90.5%) | 11 (0.7%) |
| Total | 4,890 (81.4%) | 396 (6.6%) |
Employment Occupations by Sex in Pine Hill borough
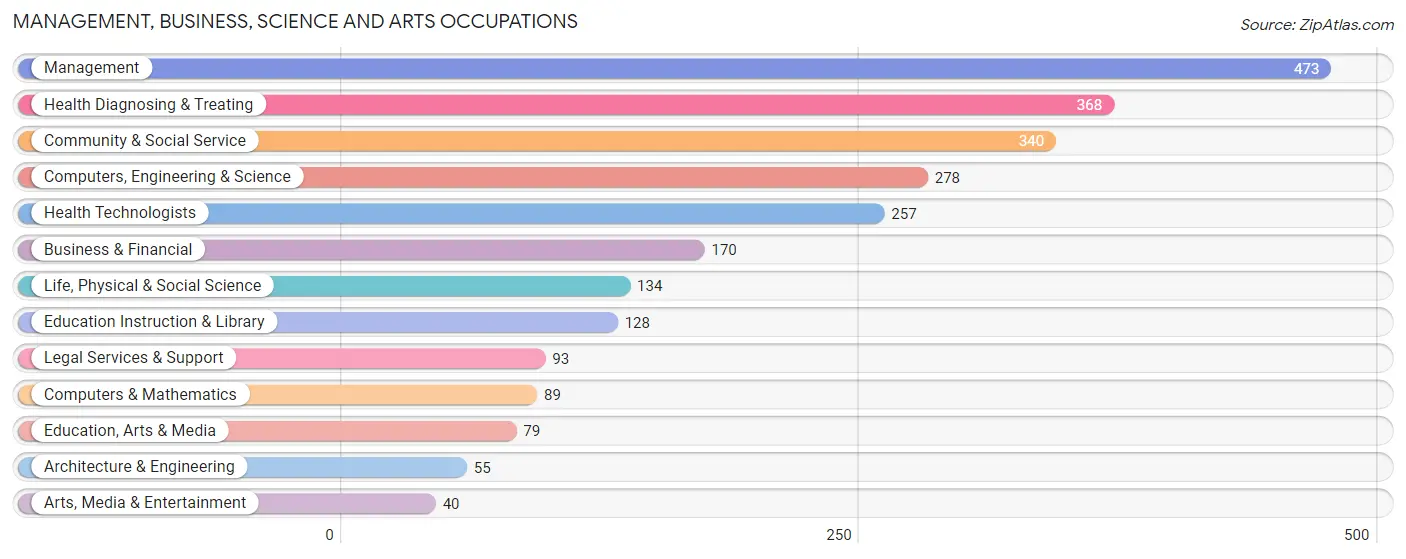
Management, Business, Science and Arts Occupations
The most common Management, Business, Science and Arts occupations in Pine Hill borough are Management (473 | 8.4%), Health Diagnosing & Treating (368 | 6.6%), Community & Social Service (340 | 6.1%), Computers, Engineering & Science (278 | 5.0%), and Health Technologists (257 | 4.6%).
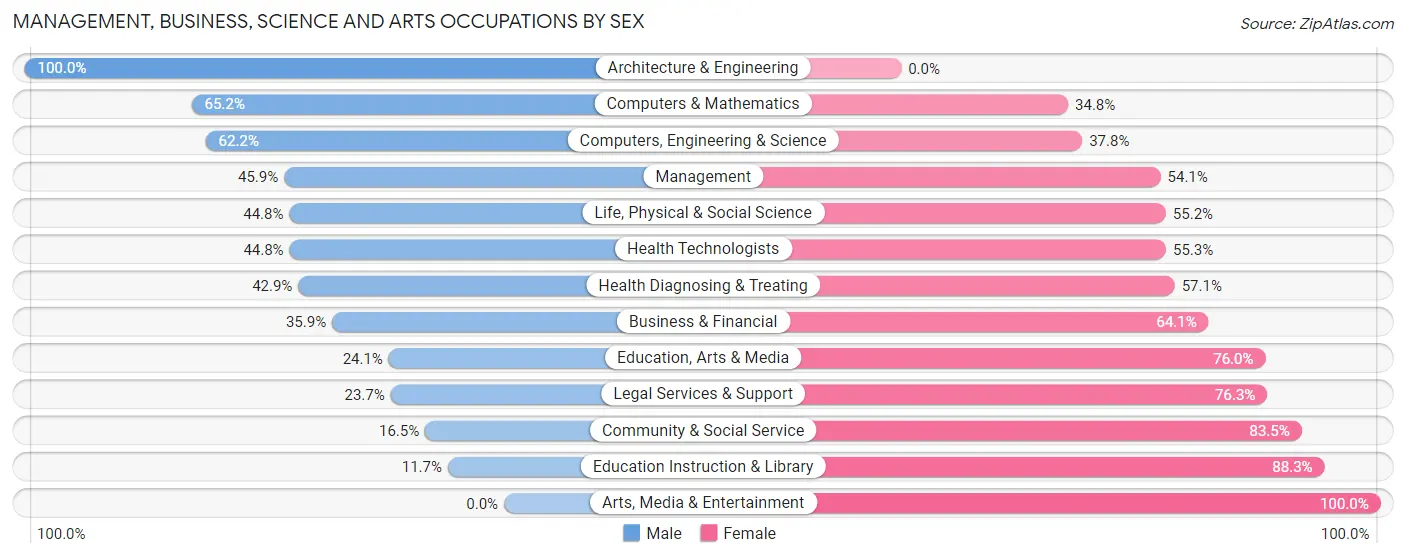
Management, Business, Science and Arts Occupations by Sex
Within the Management, Business, Science and Arts occupations in Pine Hill borough, the most male-oriented occupations are Architecture & Engineering (100.0%), Computers & Mathematics (65.2%), and Computers, Engineering & Science (62.2%), while the most female-oriented occupations are Arts, Media & Entertainment (100.0%), Education Instruction & Library (88.3%), and Community & Social Service (83.5%).
| Occupation | Male | Female |
| Management | 217 (45.9%) | 256 (54.1%) |
| Business & Financial | 61 (35.9%) | 109 (64.1%) |
| Computers, Engineering & Science | 173 (62.2%) | 105 (37.8%) |
| Computers & Mathematics | 58 (65.2%) | 31 (34.8%) |
| Architecture & Engineering | 55 (100.0%) | 0 (0.0%) |
| Life, Physical & Social Science | 60 (44.8%) | 74 (55.2%) |
| Community & Social Service | 56 (16.5%) | 284 (83.5%) |
| Education, Arts & Media | 19 (24.0%) | 60 (75.9%) |
| Legal Services & Support | 22 (23.7%) | 71 (76.3%) |
| Education Instruction & Library | 15 (11.7%) | 113 (88.3%) |
| Arts, Media & Entertainment | 0 (0.0%) | 40 (100.0%) |
| Health Diagnosing & Treating | 158 (42.9%) | 210 (57.1%) |
| Health Technologists | 115 (44.8%) | 142 (55.2%) |
| Total (Category) | 665 (40.8%) | 964 (59.2%) |
| Total (Overall) | 2,449 (43.7%) | 3,154 (56.3%) |
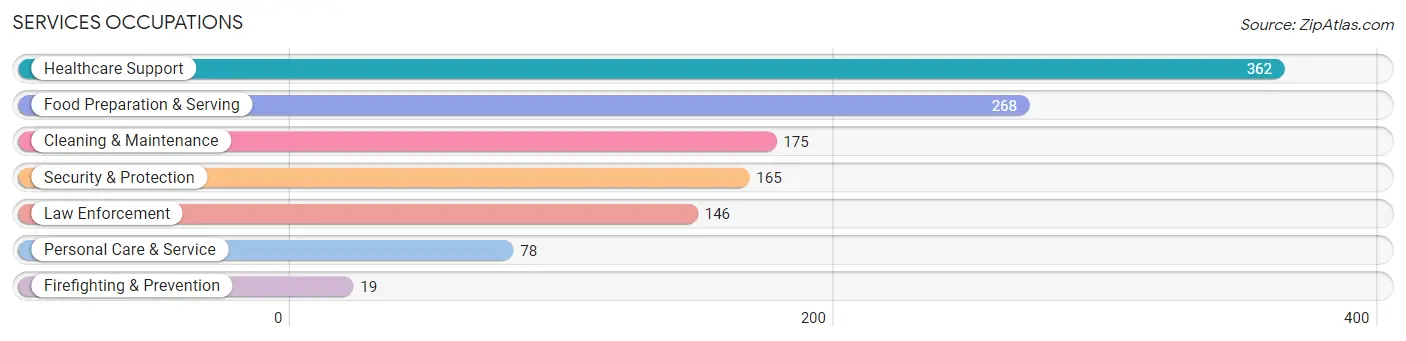
Services Occupations
The most common Services occupations in Pine Hill borough are Healthcare Support (362 | 6.5%), Food Preparation & Serving (268 | 4.8%), Cleaning & Maintenance (175 | 3.1%), Security & Protection (165 | 2.9%), and Law Enforcement (146 | 2.6%).
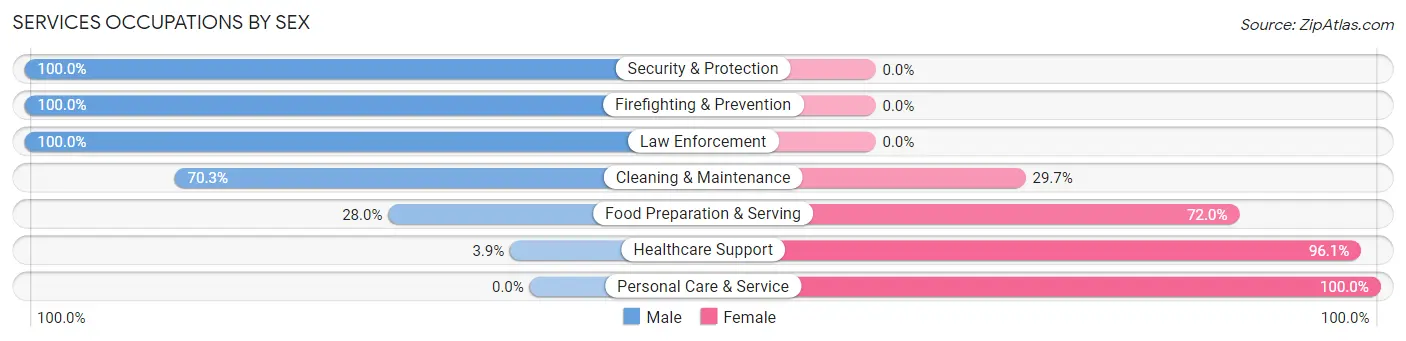
Services Occupations by Sex
Within the Services occupations in Pine Hill borough, the most male-oriented occupations are Security & Protection (100.0%), Firefighting & Prevention (100.0%), and Law Enforcement (100.0%), while the most female-oriented occupations are Personal Care & Service (100.0%), Healthcare Support (96.1%), and Food Preparation & Serving (72.0%).
| Occupation | Male | Female |
| Healthcare Support | 14 (3.9%) | 348 (96.1%) |
| Security & Protection | 165 (100.0%) | 0 (0.0%) |
| Firefighting & Prevention | 19 (100.0%) | 0 (0.0%) |
| Law Enforcement | 146 (100.0%) | 0 (0.0%) |
| Food Preparation & Serving | 75 (28.0%) | 193 (72.0%) |
| Cleaning & Maintenance | 123 (70.3%) | 52 (29.7%) |
| Personal Care & Service | 0 (0.0%) | 78 (100.0%) |
| Total (Category) | 377 (36.0%) | 671 (64.0%) |
| Total (Overall) | 2,449 (43.7%) | 3,154 (56.3%) |
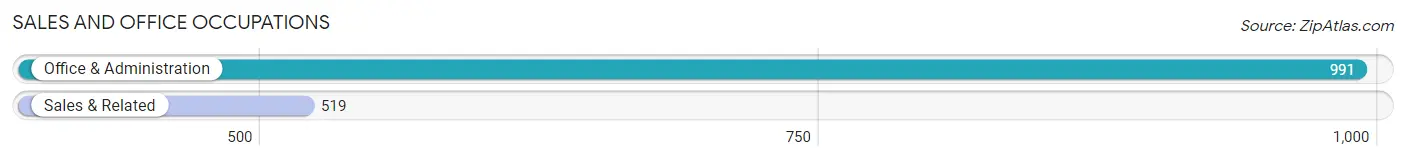
Sales and Office Occupations
The most common Sales and Office occupations in Pine Hill borough are Office & Administration (991 | 17.7%), and Sales & Related (519 | 9.3%).
Sales and Office Occupations by Sex

| Occupation | Male | Female |
| Sales & Related | 209 (40.3%) | 310 (59.7%) |
| Office & Administration | 127 (12.8%) | 864 (87.2%) |
| Total (Category) | 336 (22.3%) | 1,174 (77.7%) |
| Total (Overall) | 2,449 (43.7%) | 3,154 (56.3%) |
Natural Resources, Construction and Maintenance Occupations
The most common Natural Resources, Construction and Maintenance occupations in Pine Hill borough are Construction & Extraction (324 | 5.8%), and Installation, Maintenance & Repair (169 | 3.0%).

Natural Resources, Construction and Maintenance Occupations by Sex

| Occupation | Male | Female |
| Farming, Fishing & Forestry | 0 (0.0%) | 0 (0.0%) |
| Construction & Extraction | 324 (100.0%) | 0 (0.0%) |
| Installation, Maintenance & Repair | 169 (100.0%) | 0 (0.0%) |
| Total (Category) | 493 (100.0%) | 0 (0.0%) |
| Total (Overall) | 2,449 (43.7%) | 3,154 (56.3%) |
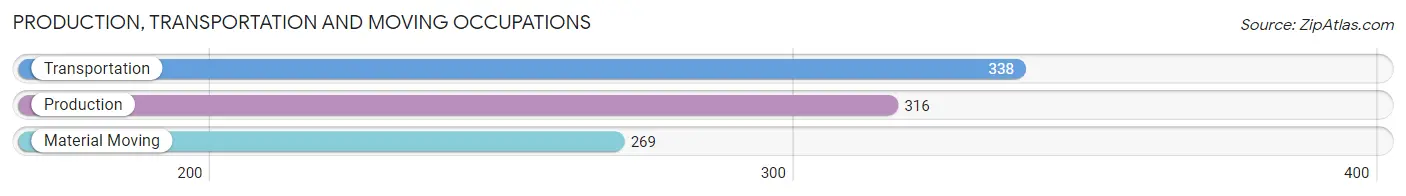
Production, Transportation and Moving Occupations
The most common Production, Transportation and Moving occupations in Pine Hill borough are Transportation (338 | 6.0%), Production (316 | 5.6%), and Material Moving (269 | 4.8%).
Production, Transportation and Moving Occupations by Sex
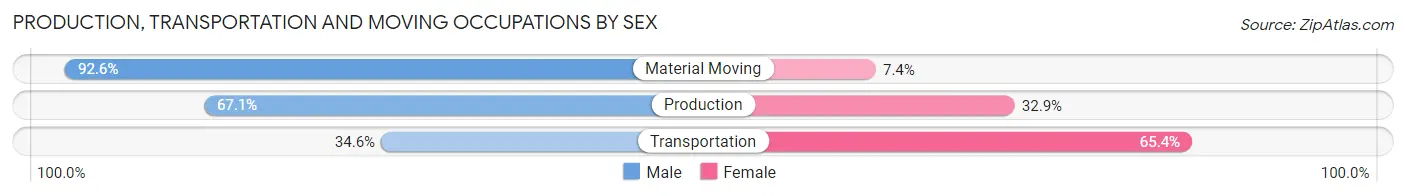
| Occupation | Male | Female |
| Production | 212 (67.1%) | 104 (32.9%) |
| Transportation | 117 (34.6%) | 221 (65.4%) |
| Material Moving | 249 (92.6%) | 20 (7.4%) |
| Total (Category) | 578 (62.6%) | 345 (37.4%) |
| Total (Overall) | 2,449 (43.7%) | 3,154 (56.3%) |
Employment Industries by Sex in Pine Hill borough
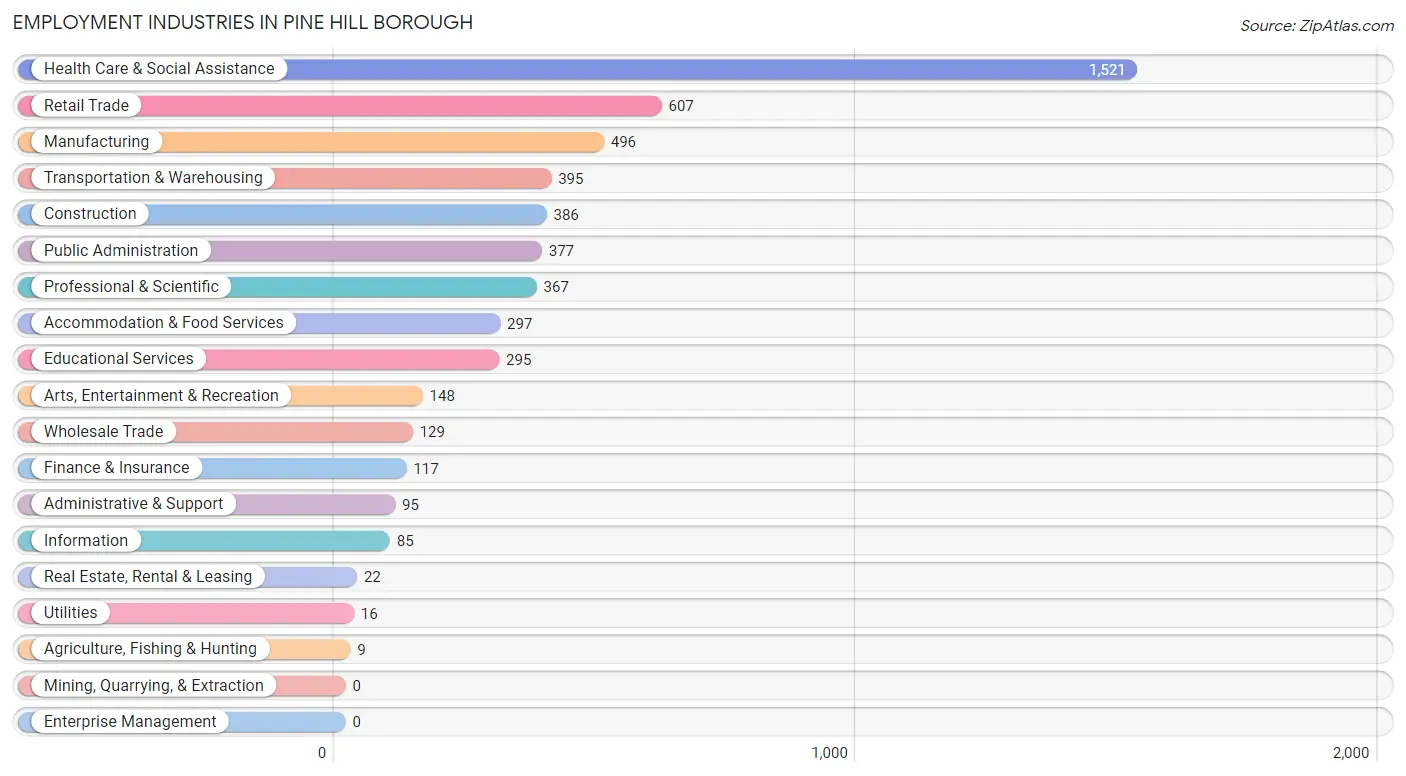
Employment Industries in Pine Hill borough
The major employment industries in Pine Hill borough include Health Care & Social Assistance (1,521 | 27.2%), Retail Trade (607 | 10.8%), Manufacturing (496 | 8.8%), Transportation & Warehousing (395 | 7.0%), and Construction (386 | 6.9%).
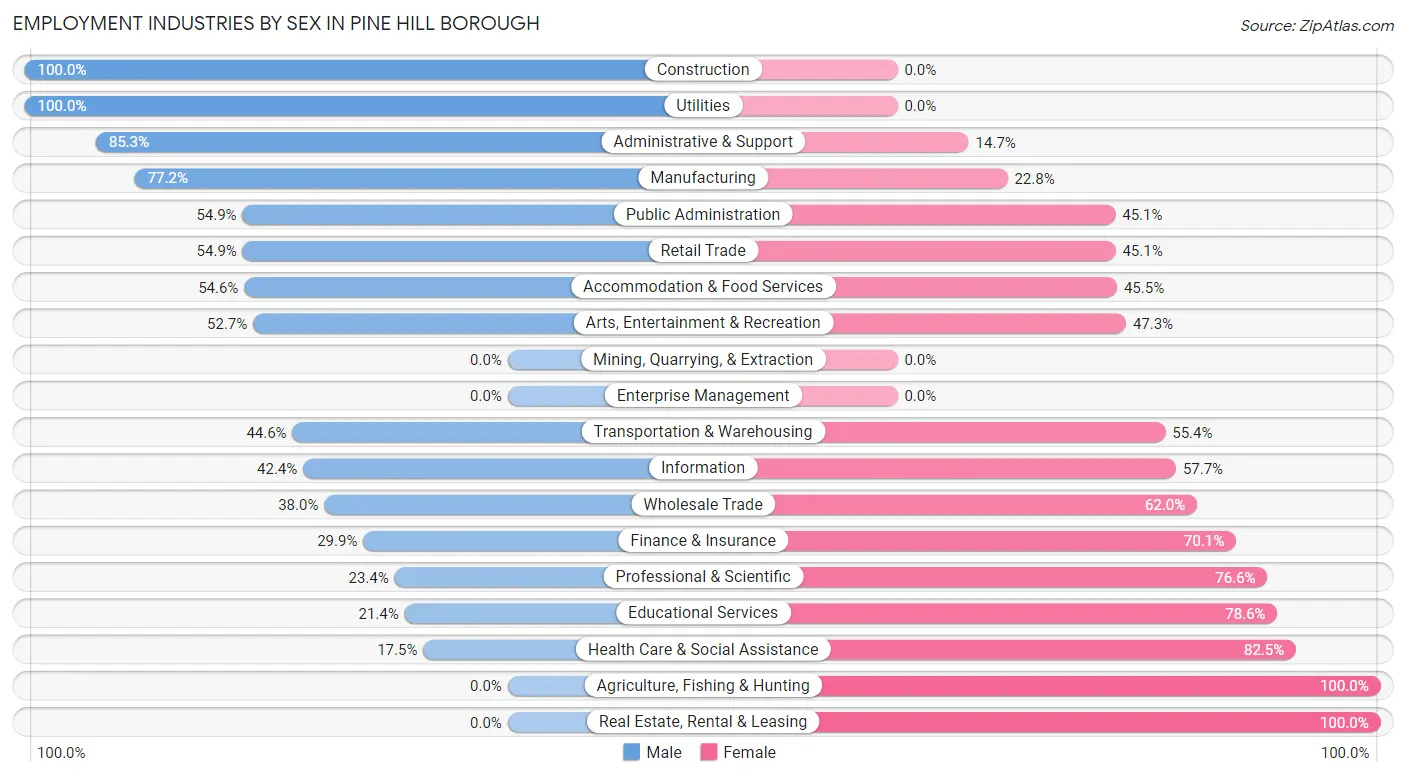
Employment Industries by Sex in Pine Hill borough
The Pine Hill borough industries that see more men than women are Construction (100.0%), Utilities (100.0%), and Administrative & Support (85.3%), whereas the industries that tend to have a higher number of women are Agriculture, Fishing & Hunting (100.0%), Real Estate, Rental & Leasing (100.0%), and Health Care & Social Assistance (82.5%).
| Industry | Male | Female |
| Agriculture, Fishing & Hunting | 0 (0.0%) | 9 (100.0%) |
| Mining, Quarrying, & Extraction | 0 (0.0%) | 0 (0.0%) |
| Construction | 386 (100.0%) | 0 (0.0%) |
| Manufacturing | 383 (77.2%) | 113 (22.8%) |
| Wholesale Trade | 49 (38.0%) | 80 (62.0%) |
| Retail Trade | 333 (54.9%) | 274 (45.1%) |
| Transportation & Warehousing | 176 (44.6%) | 219 (55.4%) |
| Utilities | 16 (100.0%) | 0 (0.0%) |
| Information | 36 (42.3%) | 49 (57.7%) |
| Finance & Insurance | 35 (29.9%) | 82 (70.1%) |
| Real Estate, Rental & Leasing | 0 (0.0%) | 22 (100.0%) |
| Professional & Scientific | 86 (23.4%) | 281 (76.6%) |
| Enterprise Management | 0 (0.0%) | 0 (0.0%) |
| Administrative & Support | 81 (85.3%) | 14 (14.7%) |
| Educational Services | 63 (21.4%) | 232 (78.6%) |
| Health Care & Social Assistance | 266 (17.5%) | 1,255 (82.5%) |
| Arts, Entertainment & Recreation | 78 (52.7%) | 70 (47.3%) |
| Accommodation & Food Services | 162 (54.5%) | 135 (45.5%) |
| Public Administration | 207 (54.9%) | 170 (45.1%) |
| Total | 2,449 (43.7%) | 3,154 (56.3%) |
Education in Pine Hill borough
School Enrollment in Pine Hill borough
The most common levels of schooling among the 2,362 students in Pine Hill borough are college / undergraduate (599 | 25.4%), high school (512 | 21.7%), and elementary school (441 | 18.7%).
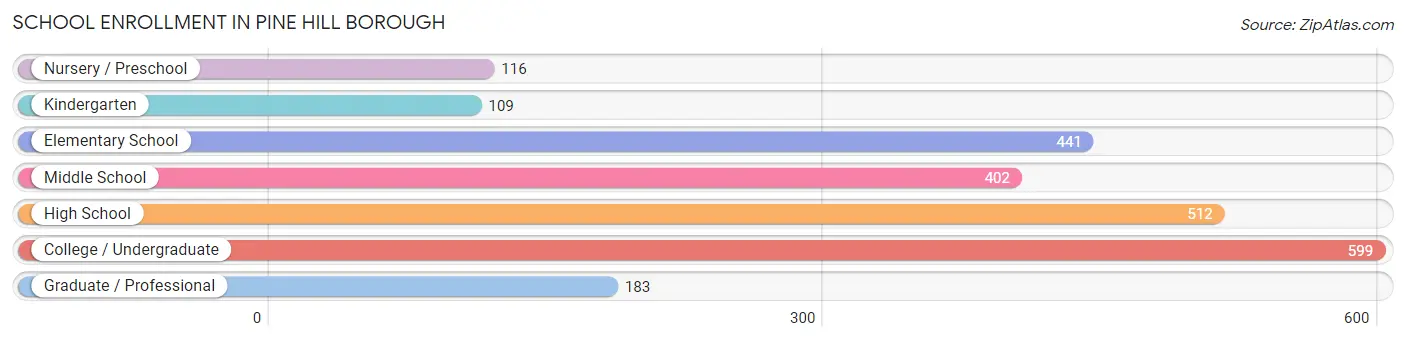
| School Level | # Students | % Students |
| Nursery / Preschool | 116 | 4.9% |
| Kindergarten | 109 | 4.6% |
| Elementary School | 441 | 18.7% |
| Middle School | 402 | 17.0% |
| High School | 512 | 21.7% |
| College / Undergraduate | 599 | 25.4% |
| Graduate / Professional | 183 | 7.7% |
| Total | 2,362 | 100.0% |
School Enrollment by Age by Funding Source in Pine Hill borough
Out of a total of 2,362 students who are enrolled in schools in Pine Hill borough, 458 (19.4%) attend a private institution, while the remaining 1,904 (80.6%) are enrolled in public schools. The age group of 3 to 4 year olds has the highest likelihood of being enrolled in private schools, with 93 (93.9% in the age bracket) enrolled. Conversely, the age group of 10 to 14 year olds has the lowest likelihood of being enrolled in a private school, with 544 (95.8% in the age bracket) attending a public institution.
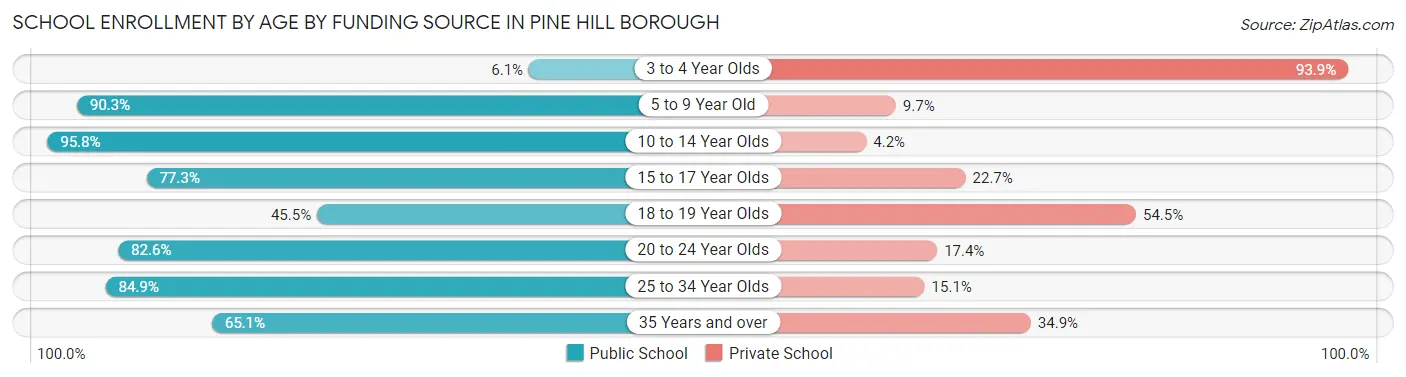
| Age Bracket | Public School | Private School |
| 3 to 4 Year Olds | 6 (6.1%) | 93 (93.9%) |
| 5 to 9 Year Old | 473 (90.3%) | 51 (9.7%) |
| 10 to 14 Year Olds | 544 (95.8%) | 24 (4.2%) |
| 15 to 17 Year Olds | 279 (77.3%) | 82 (22.7%) |
| 18 to 19 Year Olds | 51 (45.5%) | 61 (54.5%) |
| 20 to 24 Year Olds | 147 (82.6%) | 31 (17.4%) |
| 25 to 34 Year Olds | 276 (84.9%) | 49 (15.1%) |
| 35 Years and over | 127 (65.1%) | 68 (34.9%) |
| Total | 1,904 (80.6%) | 458 (19.4%) |
Educational Attainment by Field of Study in Pine Hill borough
Science & technology (327 | 17.2%), bio, nature & agricultural (265 | 14.0%), psychology (243 | 12.8%), business (219 | 11.6%), and education (152 | 8.0%) are the most common fields of study among 1,896 individuals in Pine Hill borough who have obtained a bachelor's degree or higher.
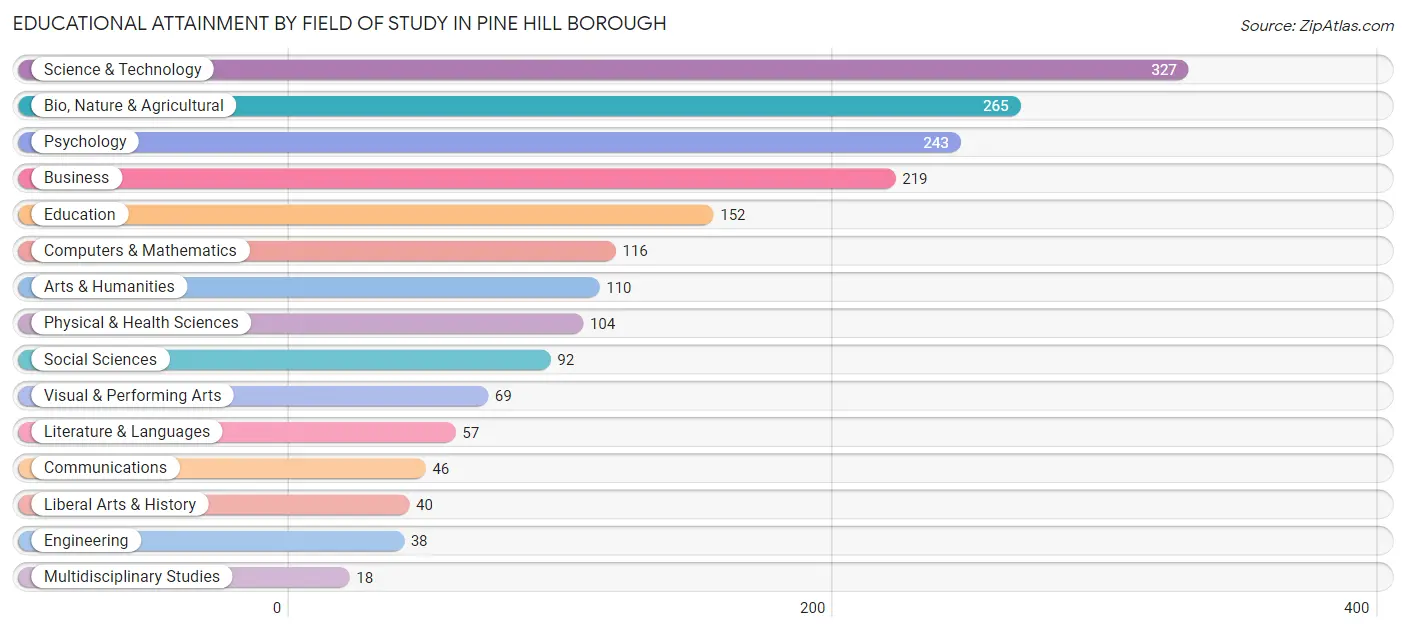
| Field of Study | # Graduates | % Graduates |
| Computers & Mathematics | 116 | 6.1% |
| Bio, Nature & Agricultural | 265 | 14.0% |
| Physical & Health Sciences | 104 | 5.5% |
| Psychology | 243 | 12.8% |
| Social Sciences | 92 | 4.9% |
| Engineering | 38 | 2.0% |
| Multidisciplinary Studies | 18 | 0.9% |
| Science & Technology | 327 | 17.2% |
| Business | 219 | 11.6% |
| Education | 152 | 8.0% |
| Literature & Languages | 57 | 3.0% |
| Liberal Arts & History | 40 | 2.1% |
| Visual & Performing Arts | 69 | 3.6% |
| Communications | 46 | 2.4% |
| Arts & Humanities | 110 | 5.8% |
| Total | 1,896 | 100.0% |
Transportation & Commute in Pine Hill borough
Vehicle Availability by Sex in Pine Hill borough
The most prevalent vehicle ownership categories in Pine Hill borough are males with 2 vehicles (1,161, accounting for 48.3%) and females with 2 vehicles (1,359, making up 37.2%).
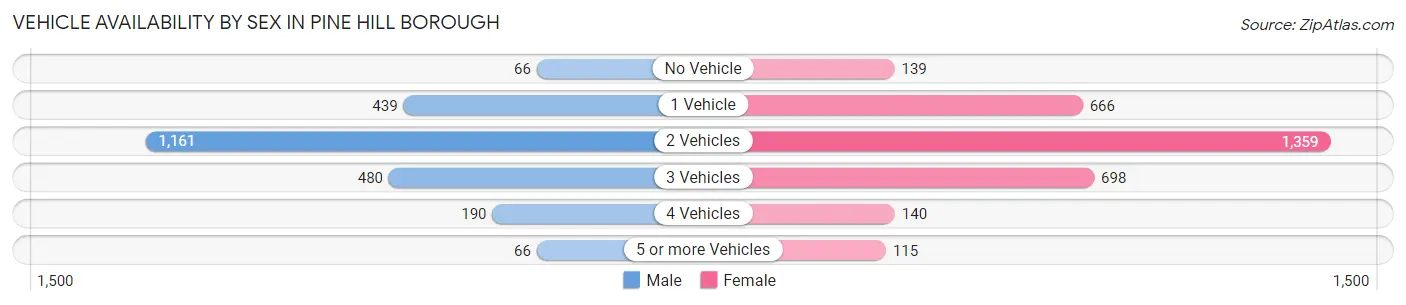
| Vehicles Available | Male | Female |
| No Vehicle | 66 (2.8%) | 139 (4.5%) |
| 1 Vehicle | 439 (18.3%) | 666 (21.4%) |
| 2 Vehicles | 1,161 (48.3%) | 1,359 (43.6%) |
| 3 Vehicles | 480 (20.0%) | 698 (22.4%) |
| 4 Vehicles | 190 (7.9%) | 140 (4.5%) |
| 5 or more Vehicles | 66 (2.8%) | 115 (3.7%) |
| Total | 2,402 (100.0%) | 3,117 (100.0%) |
Commute Time in Pine Hill borough
The most frequently occuring commute durations in Pine Hill borough are 20 to 24 minutes (1,067 commuters, 20.4%), 15 to 19 minutes (817 commuters, 15.6%), and 30 to 34 minutes (771 commuters, 14.7%).
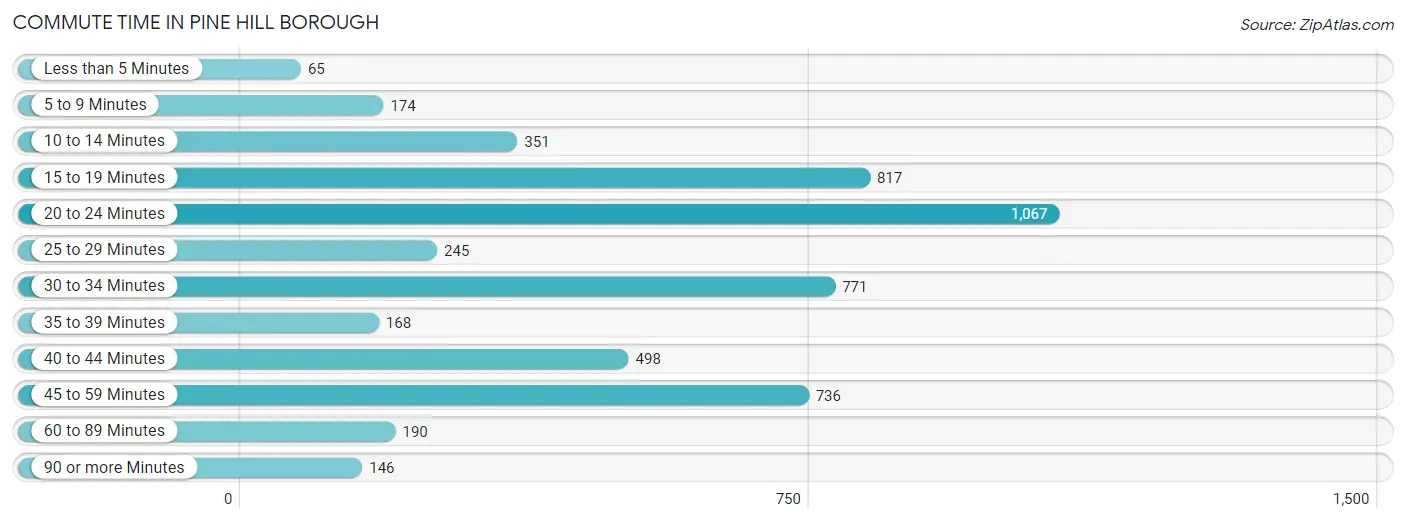
| Commute Time | # Commuters | % Commuters |
| Less than 5 Minutes | 65 | 1.2% |
| 5 to 9 Minutes | 174 | 3.3% |
| 10 to 14 Minutes | 351 | 6.7% |
| 15 to 19 Minutes | 817 | 15.6% |
| 20 to 24 Minutes | 1,067 | 20.4% |
| 25 to 29 Minutes | 245 | 4.7% |
| 30 to 34 Minutes | 771 | 14.7% |
| 35 to 39 Minutes | 168 | 3.2% |
| 40 to 44 Minutes | 498 | 9.5% |
| 45 to 59 Minutes | 736 | 14.1% |
| 60 to 89 Minutes | 190 | 3.6% |
| 90 or more Minutes | 146 | 2.8% |
Commute Time by Sex in Pine Hill borough
The most common commute times in Pine Hill borough are 20 to 24 minutes (355 commuters, 15.5%) for males and 20 to 24 minutes (712 commuters, 24.3%) for females.
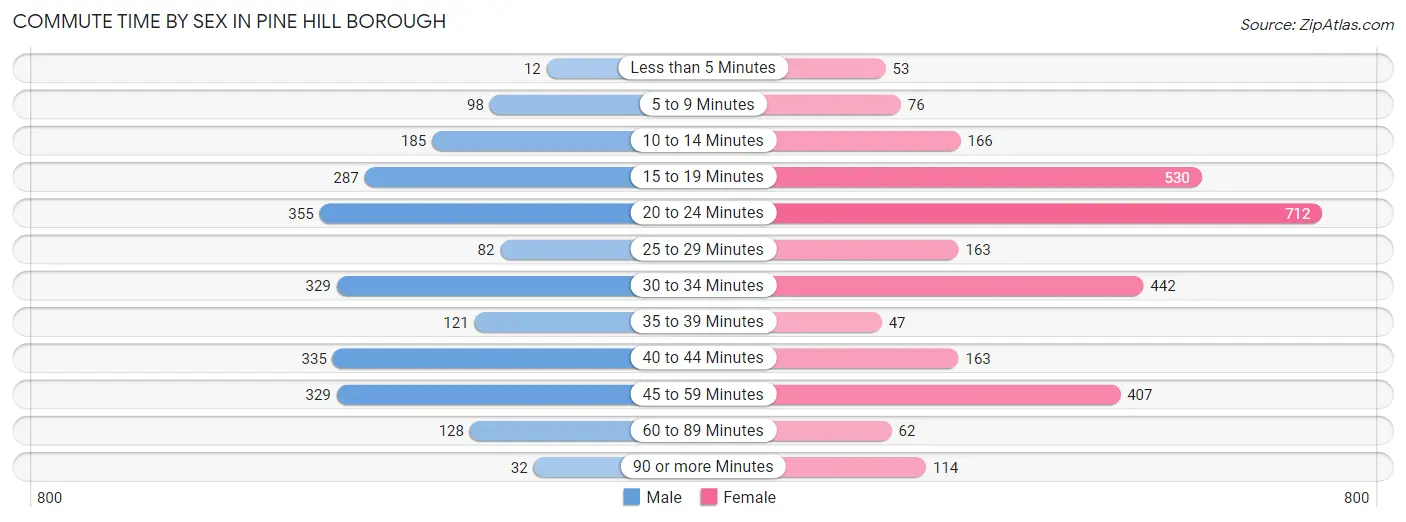
| Commute Time | Male | Female |
| Less than 5 Minutes | 12 (0.5%) | 53 (1.8%) |
| 5 to 9 Minutes | 98 (4.3%) | 76 (2.6%) |
| 10 to 14 Minutes | 185 (8.1%) | 166 (5.7%) |
| 15 to 19 Minutes | 287 (12.5%) | 530 (18.1%) |
| 20 to 24 Minutes | 355 (15.5%) | 712 (24.3%) |
| 25 to 29 Minutes | 82 (3.6%) | 163 (5.6%) |
| 30 to 34 Minutes | 329 (14.3%) | 442 (15.1%) |
| 35 to 39 Minutes | 121 (5.3%) | 47 (1.6%) |
| 40 to 44 Minutes | 335 (14.6%) | 163 (5.6%) |
| 45 to 59 Minutes | 329 (14.3%) | 407 (13.9%) |
| 60 to 89 Minutes | 128 (5.6%) | 62 (2.1%) |
| 90 or more Minutes | 32 (1.4%) | 114 (3.9%) |
Time of Departure to Work by Sex in Pine Hill borough
The most frequent times of departure to work in Pine Hill borough are 6:30 AM to 6:59 AM (364, 15.9%) for males and 7:00 AM to 7:29 AM (522, 17.8%) for females.
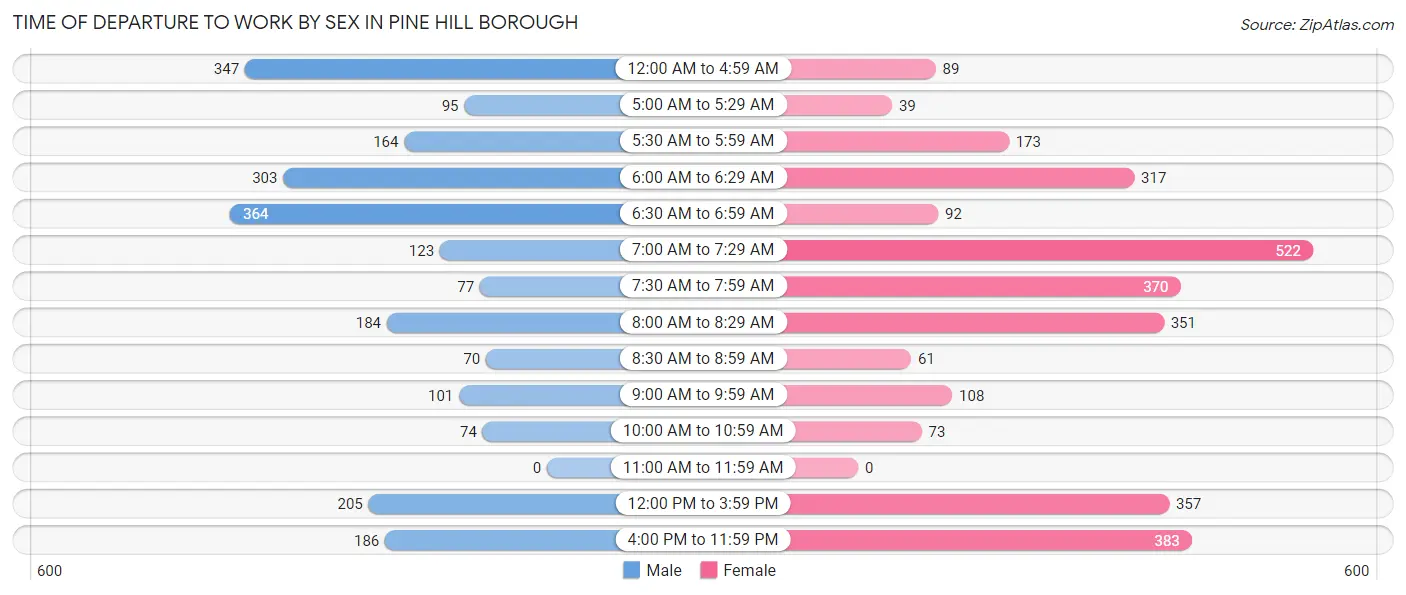
| Time of Departure | Male | Female |
| 12:00 AM to 4:59 AM | 347 (15.1%) | 89 (3.0%) |
| 5:00 AM to 5:29 AM | 95 (4.1%) | 39 (1.3%) |
| 5:30 AM to 5:59 AM | 164 (7.1%) | 173 (5.9%) |
| 6:00 AM to 6:29 AM | 303 (13.2%) | 317 (10.8%) |
| 6:30 AM to 6:59 AM | 364 (15.9%) | 92 (3.1%) |
| 7:00 AM to 7:29 AM | 123 (5.4%) | 522 (17.8%) |
| 7:30 AM to 7:59 AM | 77 (3.4%) | 370 (12.6%) |
| 8:00 AM to 8:29 AM | 184 (8.0%) | 351 (12.0%) |
| 8:30 AM to 8:59 AM | 70 (3.0%) | 61 (2.1%) |
| 9:00 AM to 9:59 AM | 101 (4.4%) | 108 (3.7%) |
| 10:00 AM to 10:59 AM | 74 (3.2%) | 73 (2.5%) |
| 11:00 AM to 11:59 AM | 0 (0.0%) | 0 (0.0%) |
| 12:00 PM to 3:59 PM | 205 (8.9%) | 357 (12.2%) |
| 4:00 PM to 11:59 PM | 186 (8.1%) | 383 (13.1%) |
| Total | 2,293 (100.0%) | 2,935 (100.0%) |
Housing Occupancy in Pine Hill borough
Occupancy by Ownership in Pine Hill borough
Of the total 4,439 dwellings in Pine Hill borough, owner-occupied units account for 2,722 (61.3%), while renter-occupied units make up 1,717 (38.7%).
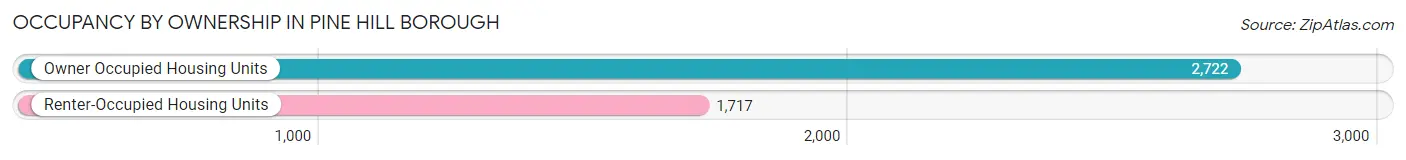
| Occupancy | # Housing Units | % Housing Units |
| Owner Occupied Housing Units | 2,722 | 61.3% |
| Renter-Occupied Housing Units | 1,717 | 38.7% |
| Total Occupied Housing Units | 4,439 | 100.0% |
Occupancy by Household Size in Pine Hill borough
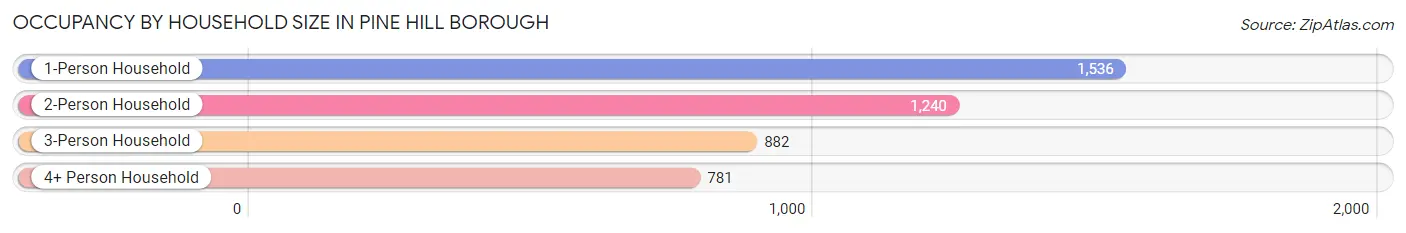
| Household Size | # Housing Units | % Housing Units |
| 1-Person Household | 1,536 | 34.6% |
| 2-Person Household | 1,240 | 27.9% |
| 3-Person Household | 882 | 19.9% |
| 4+ Person Household | 781 | 17.6% |
| Total Housing Units | 4,439 | 100.0% |
Occupancy by Ownership by Household Size in Pine Hill borough
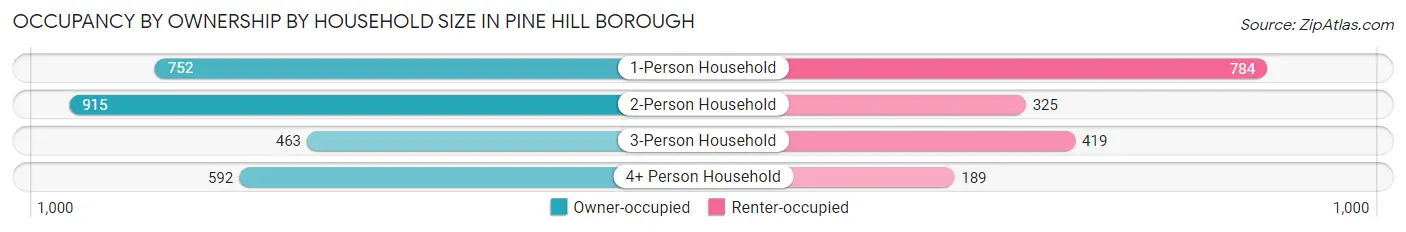
| Household Size | Owner-occupied | Renter-occupied |
| 1-Person Household | 752 (49.0%) | 784 (51.0%) |
| 2-Person Household | 915 (73.8%) | 325 (26.2%) |
| 3-Person Household | 463 (52.5%) | 419 (47.5%) |
| 4+ Person Household | 592 (75.8%) | 189 (24.2%) |
| Total Housing Units | 2,722 (61.3%) | 1,717 (38.7%) |
Occupancy by Educational Attainment in Pine Hill borough
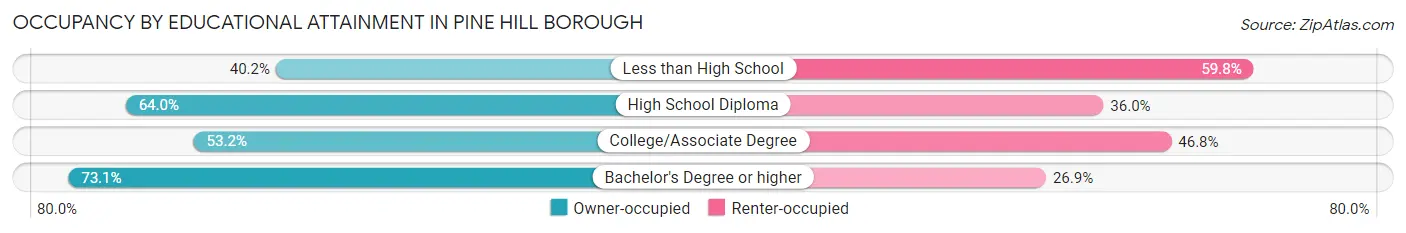
| Household Size | Owner-occupied | Renter-occupied |
| Less than High School | 98 (40.2%) | 146 (59.8%) |
| High School Diploma | 907 (64.0%) | 511 (36.0%) |
| College/Associate Degree | 835 (53.2%) | 735 (46.8%) |
| Bachelor's Degree or higher | 882 (73.1%) | 325 (26.9%) |
Occupancy by Age of Householder in Pine Hill borough
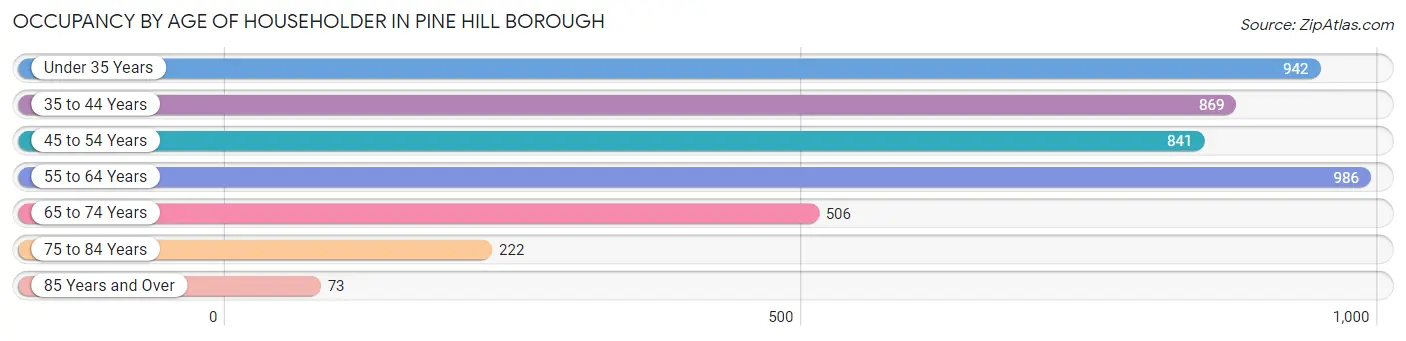
| Age Bracket | # Households | % Households |
| Under 35 Years | 942 | 21.2% |
| 35 to 44 Years | 869 | 19.6% |
| 45 to 54 Years | 841 | 19.0% |
| 55 to 64 Years | 986 | 22.2% |
| 65 to 74 Years | 506 | 11.4% |
| 75 to 84 Years | 222 | 5.0% |
| 85 Years and Over | 73 | 1.6% |
| Total | 4,439 | 100.0% |
Housing Finances in Pine Hill borough
Median Income by Occupancy in Pine Hill borough
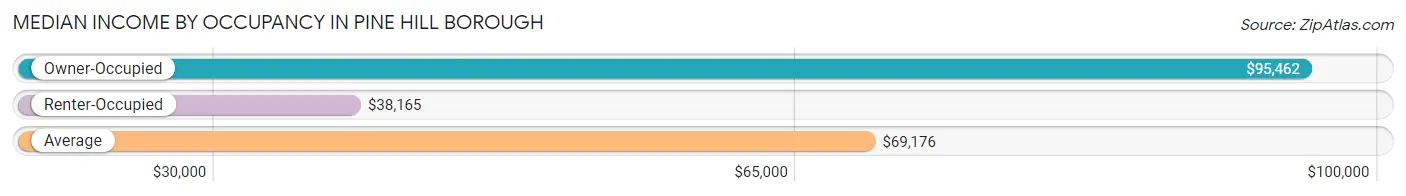
| Occupancy Type | # Households | Median Income |
| Owner-Occupied | 2,722 (61.3%) | $95,462 |
| Renter-Occupied | 1,717 (38.7%) | $38,165 |
| Average | 4,439 (100.0%) | $69,176 |
Occupancy by Householder Income Bracket in Pine Hill borough
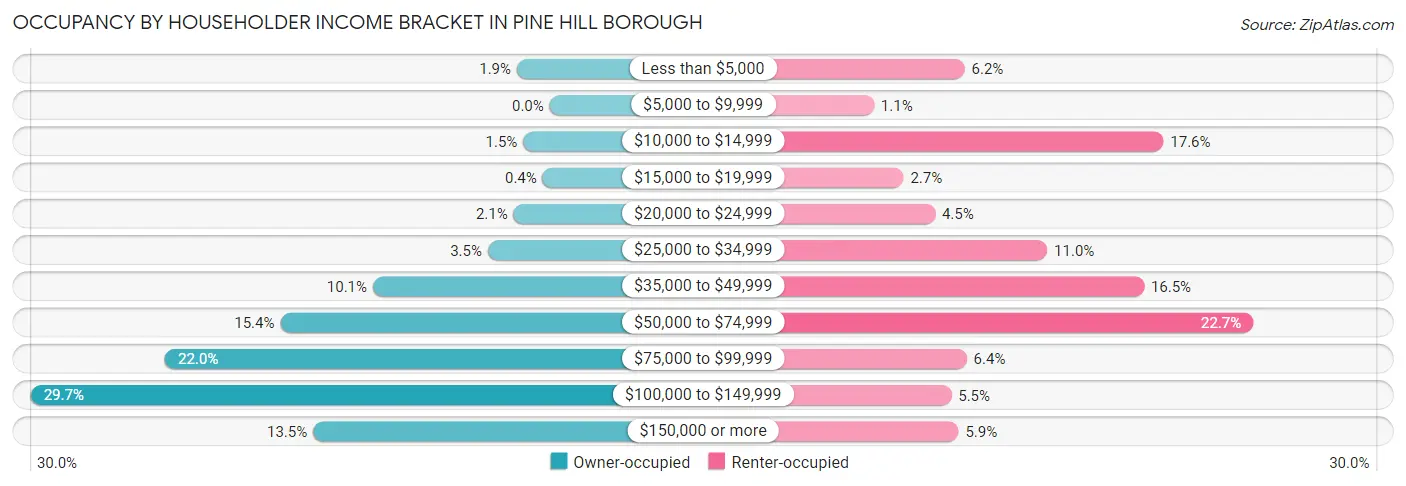
| Income Bracket | Owner-occupied | Renter-occupied |
| Less than $5,000 | 51 (1.9%) | 107 (6.2%) |
| $5,000 to $9,999 | 0 (0.0%) | 18 (1.1%) |
| $10,000 to $14,999 | 41 (1.5%) | 302 (17.6%) |
| $15,000 to $19,999 | 11 (0.4%) | 47 (2.7%) |
| $20,000 to $24,999 | 56 (2.1%) | 78 (4.5%) |
| $25,000 to $34,999 | 96 (3.5%) | 188 (11.0%) |
| $35,000 to $49,999 | 275 (10.1%) | 283 (16.5%) |
| $50,000 to $74,999 | 419 (15.4%) | 390 (22.7%) |
| $75,000 to $99,999 | 598 (22.0%) | 109 (6.4%) |
| $100,000 to $149,999 | 807 (29.6%) | 94 (5.5%) |
| $150,000 or more | 368 (13.5%) | 101 (5.9%) |
| Total | 2,722 (100.0%) | 1,717 (100.0%) |
Monthly Housing Cost Tiers in Pine Hill borough
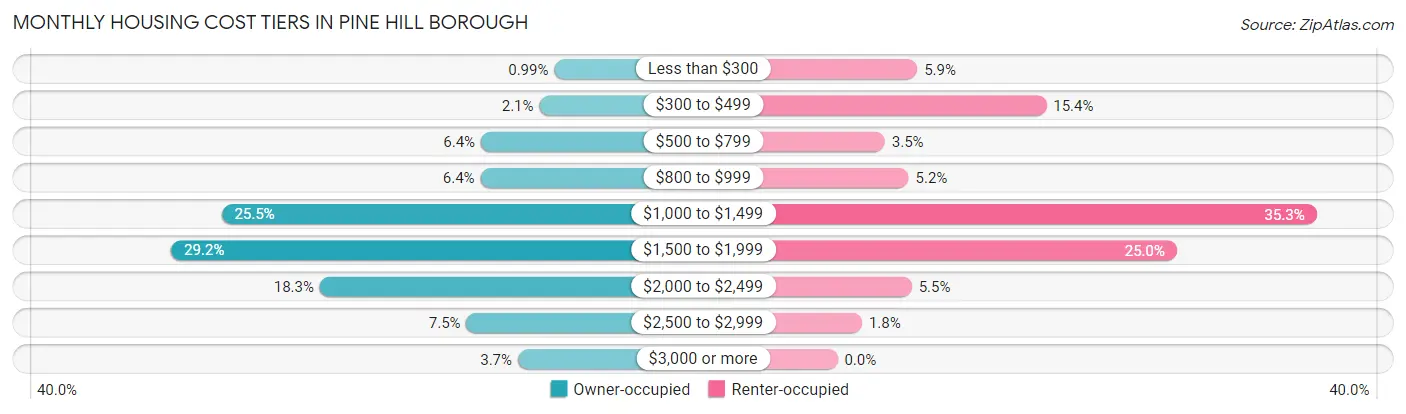
| Monthly Cost | Owner-occupied | Renter-occupied |
| Less than $300 | 27 (1.0%) | 101 (5.9%) |
| $300 to $499 | 57 (2.1%) | 264 (15.4%) |
| $500 to $799 | 174 (6.4%) | 60 (3.5%) |
| $800 to $999 | 175 (6.4%) | 90 (5.2%) |
| $1,000 to $1,499 | 694 (25.5%) | 606 (35.3%) |
| $1,500 to $1,999 | 795 (29.2%) | 429 (25.0%) |
| $2,000 to $2,499 | 497 (18.3%) | 94 (5.5%) |
| $2,500 to $2,999 | 203 (7.5%) | 31 (1.8%) |
| $3,000 or more | 100 (3.7%) | 0 (0.0%) |
| Total | 2,722 (100.0%) | 1,717 (100.0%) |
Physical Housing Characteristics in Pine Hill borough
Housing Structures in Pine Hill borough
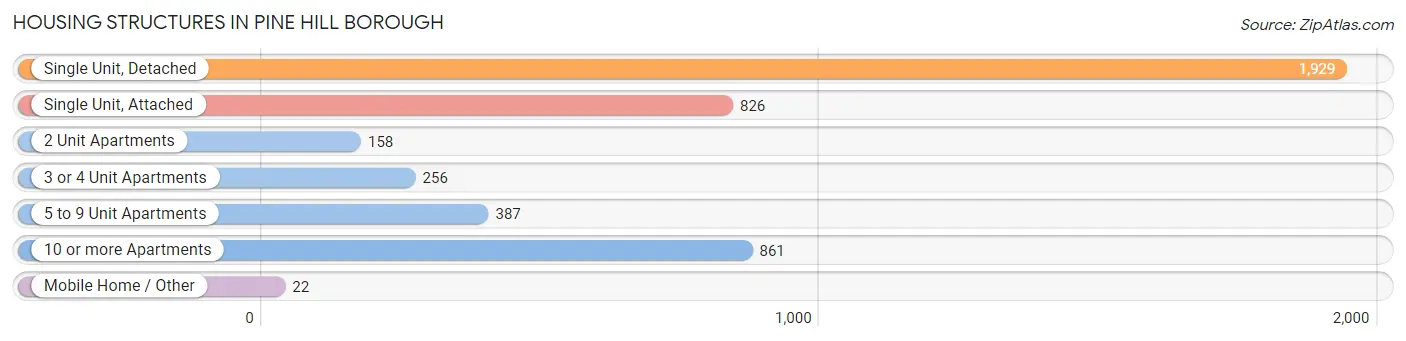
| Structure Type | # Housing Units | % Housing Units |
| Single Unit, Detached | 1,929 | 43.5% |
| Single Unit, Attached | 826 | 18.6% |
| 2 Unit Apartments | 158 | 3.6% |
| 3 or 4 Unit Apartments | 256 | 5.8% |
| 5 to 9 Unit Apartments | 387 | 8.7% |
| 10 or more Apartments | 861 | 19.4% |
| Mobile Home / Other | 22 | 0.5% |
| Total | 4,439 | 100.0% |
Housing Structures by Occupancy in Pine Hill borough
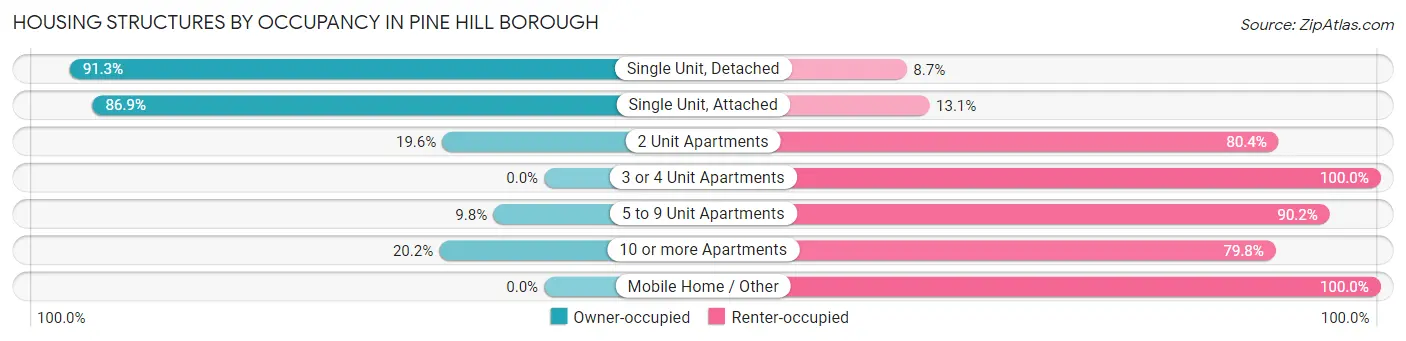
| Structure Type | Owner-occupied | Renter-occupied |
| Single Unit, Detached | 1,761 (91.3%) | 168 (8.7%) |
| Single Unit, Attached | 718 (86.9%) | 108 (13.1%) |
| 2 Unit Apartments | 31 (19.6%) | 127 (80.4%) |
| 3 or 4 Unit Apartments | 0 (0.0%) | 256 (100.0%) |
| 5 to 9 Unit Apartments | 38 (9.8%) | 349 (90.2%) |
| 10 or more Apartments | 174 (20.2%) | 687 (79.8%) |
| Mobile Home / Other | 0 (0.0%) | 22 (100.0%) |
| Total | 2,722 (61.3%) | 1,717 (38.7%) |
Housing Structures by Number of Rooms in Pine Hill borough
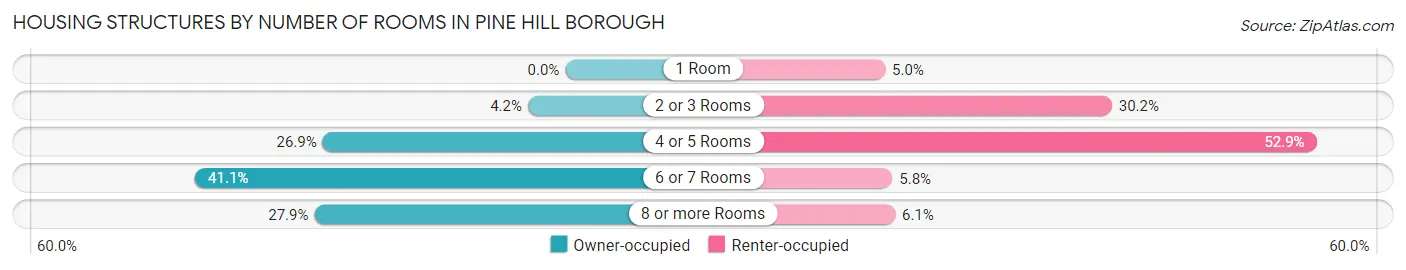
| Number of Rooms | Owner-occupied | Renter-occupied |
| 1 Room | 0 (0.0%) | 86 (5.0%) |
| 2 or 3 Rooms | 113 (4.2%) | 518 (30.2%) |
| 4 or 5 Rooms | 733 (26.9%) | 908 (52.9%) |
| 6 or 7 Rooms | 1,118 (41.1%) | 100 (5.8%) |
| 8 or more Rooms | 758 (27.9%) | 105 (6.1%) |
| Total | 2,722 (100.0%) | 1,717 (100.0%) |
Housing Structure by Heating Type in Pine Hill borough
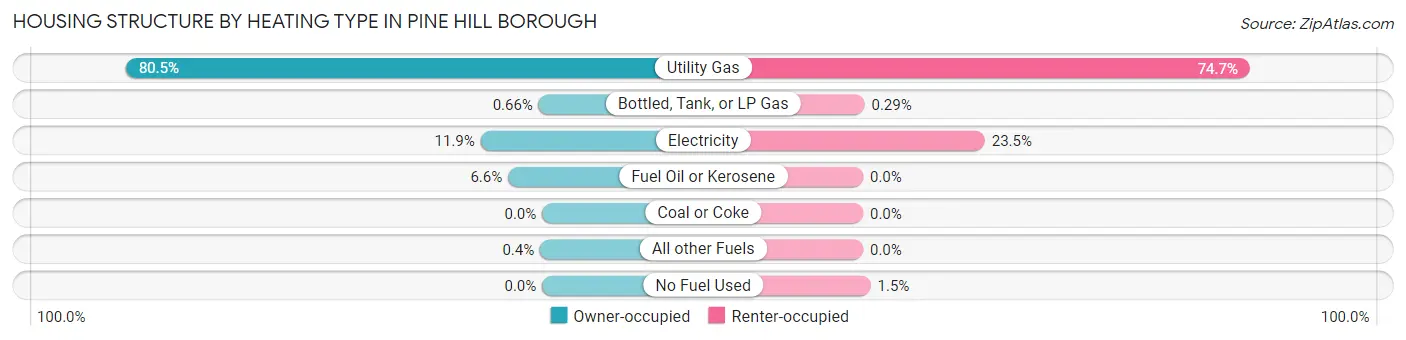
| Heating Type | Owner-occupied | Renter-occupied |
| Utility Gas | 2,190 (80.5%) | 1,283 (74.7%) |
| Bottled, Tank, or LP Gas | 18 (0.7%) | 5 (0.3%) |
| Electricity | 324 (11.9%) | 404 (23.5%) |
| Fuel Oil or Kerosene | 179 (6.6%) | 0 (0.0%) |
| Coal or Coke | 0 (0.0%) | 0 (0.0%) |
| All other Fuels | 11 (0.4%) | 0 (0.0%) |
| No Fuel Used | 0 (0.0%) | 25 (1.5%) |
| Total | 2,722 (100.0%) | 1,717 (100.0%) |
Household Vehicle Usage in Pine Hill borough
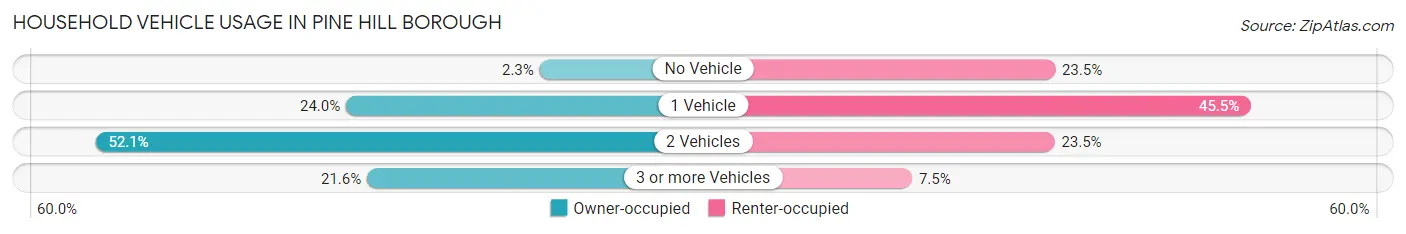
| Vehicles per Household | Owner-occupied | Renter-occupied |
| No Vehicle | 63 (2.3%) | 404 (23.5%) |
| 1 Vehicle | 653 (24.0%) | 781 (45.5%) |
| 2 Vehicles | 1,417 (52.1%) | 403 (23.5%) |
| 3 or more Vehicles | 589 (21.6%) | 129 (7.5%) |
| Total | 2,722 (100.0%) | 1,717 (100.0%) |
Real Estate & Mortgages in Pine Hill borough
Real Estate and Mortgage Overview in Pine Hill borough
| Characteristic | Without Mortgage | With Mortgage |
| Housing Units | 617 | 2,105 |
| Median Property Value | $177,200 | $168,800 |
| Median Household Income | $76,319 | $307 |
| Monthly Housing Costs | $956 | $85 |
| Real Estate Taxes | $6,561 | $68 |
Property Value by Mortgage Status in Pine Hill borough
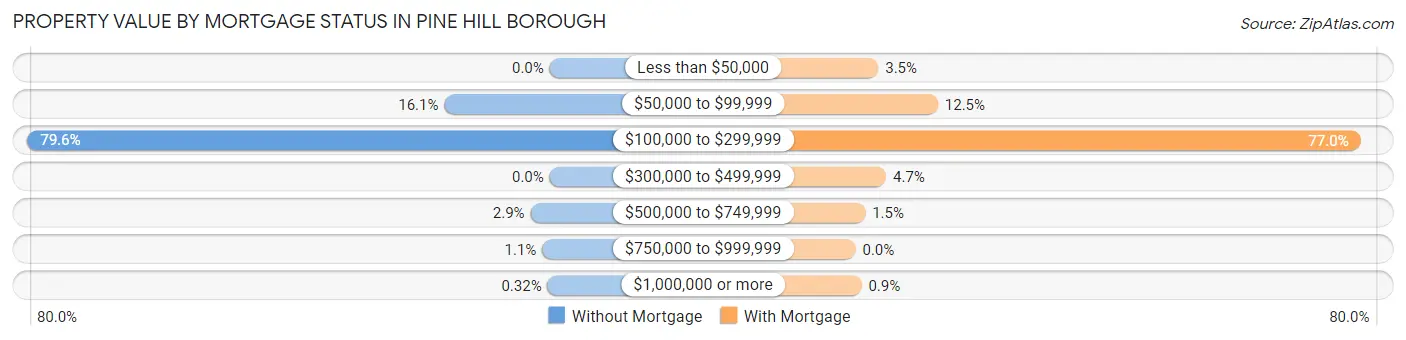
| Property Value | Without Mortgage | With Mortgage |
| Less than $50,000 | 0 (0.0%) | 73 (3.5%) |
| $50,000 to $99,999 | 99 (16.1%) | 264 (12.5%) |
| $100,000 to $299,999 | 491 (79.6%) | 1,620 (77.0%) |
| $300,000 to $499,999 | 0 (0.0%) | 98 (4.7%) |
| $500,000 to $749,999 | 18 (2.9%) | 31 (1.5%) |
| $750,000 to $999,999 | 7 (1.1%) | 0 (0.0%) |
| $1,000,000 or more | 2 (0.3%) | 19 (0.9%) |
| Total | 617 (100.0%) | 2,105 (100.0%) |
Household Income by Mortgage Status in Pine Hill borough
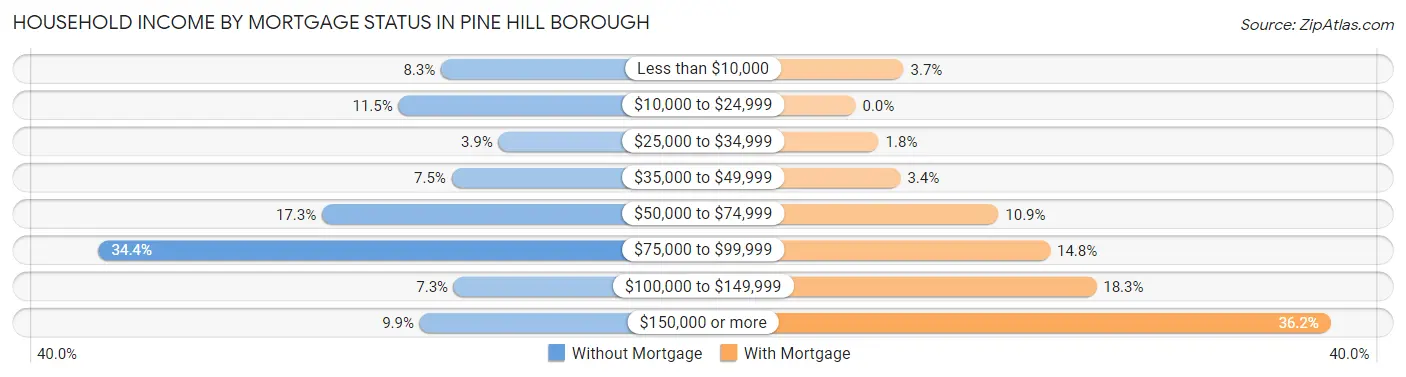
| Household Income | Without Mortgage | With Mortgage |
| Less than $10,000 | 51 (8.3%) | 77 (3.7%) |
| $10,000 to $24,999 | 71 (11.5%) | 0 (0.0%) |
| $25,000 to $34,999 | 24 (3.9%) | 37 (1.8%) |
| $35,000 to $49,999 | 46 (7.5%) | 72 (3.4%) |
| $50,000 to $74,999 | 107 (17.3%) | 229 (10.9%) |
| $75,000 to $99,999 | 212 (34.4%) | 312 (14.8%) |
| $100,000 to $149,999 | 45 (7.3%) | 386 (18.3%) |
| $150,000 or more | 61 (9.9%) | 762 (36.2%) |
| Total | 617 (100.0%) | 2,105 (100.0%) |
Property Value to Household Income Ratio in Pine Hill borough
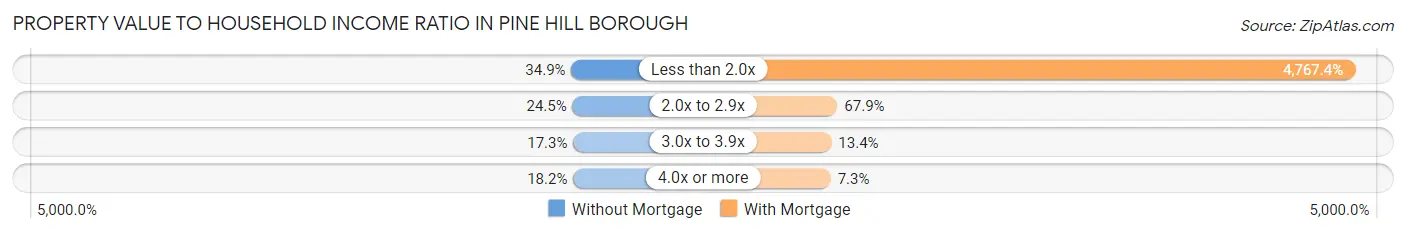
| Value-to-Income Ratio | Without Mortgage | With Mortgage |
| Less than 2.0x | 215 (34.8%) | 100,353 (4,767.4%) |
| 2.0x to 2.9x | 151 (24.5%) | 1,430 (67.9%) |
| 3.0x to 3.9x | 107 (17.3%) | 283 (13.4%) |
| 4.0x or more | 112 (18.1%) | 153 (7.3%) |
| Total | 617 (100.0%) | 2,105 (100.0%) |
Real Estate Taxes by Mortgage Status in Pine Hill borough
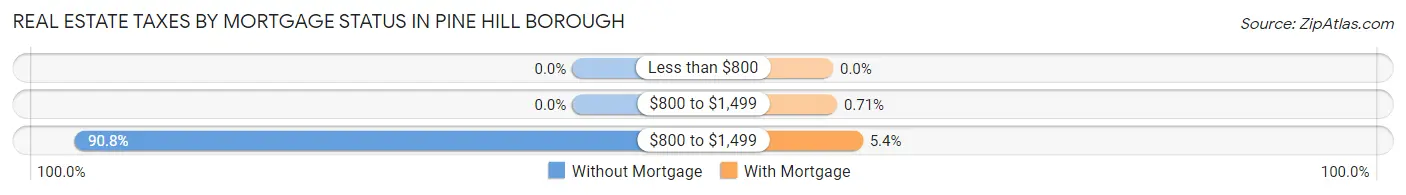
| Property Taxes | Without Mortgage | With Mortgage |
| Less than $800 | 0 (0.0%) | 0 (0.0%) |
| $800 to $1,499 | 0 (0.0%) | 15 (0.7%) |
| $800 to $1,499 | 560 (90.8%) | 114 (5.4%) |
| Total | 617 (100.0%) | 2,105 (100.0%) |
Health & Disability in Pine Hill borough
Health Insurance Coverage by Age in Pine Hill borough
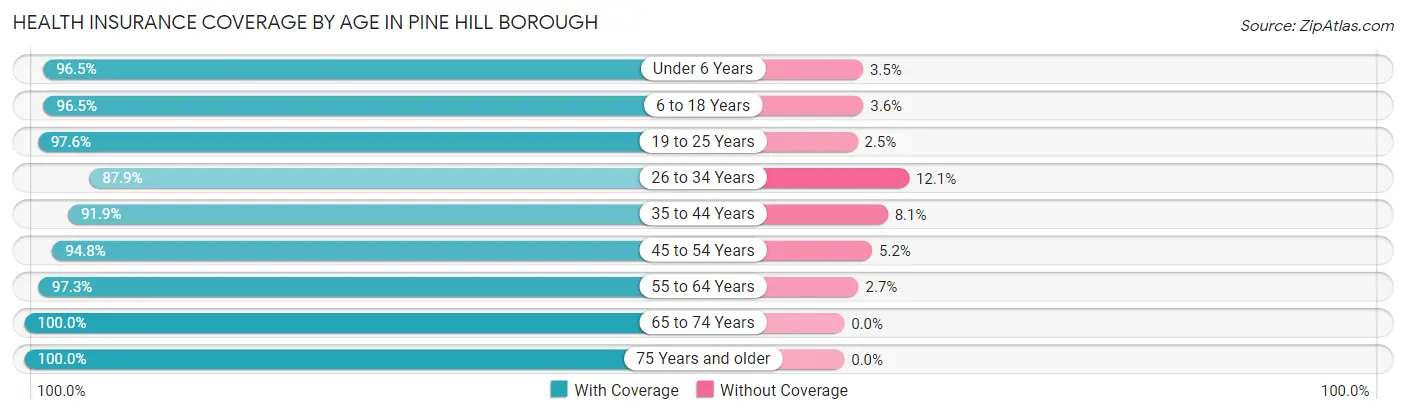
| Age Bracket | With Coverage | Without Coverage |
| Under 6 Years | 887 (96.5%) | 32 (3.5%) |
| 6 to 18 Years | 1,496 (96.5%) | 55 (3.5%) |
| 19 to 25 Years | 1,114 (97.6%) | 28 (2.5%) |
| 26 to 34 Years | 1,415 (87.9%) | 194 (12.1%) |
| 35 to 44 Years | 1,305 (91.9%) | 115 (8.1%) |
| 45 to 54 Years | 1,170 (94.8%) | 64 (5.2%) |
| 55 to 64 Years | 1,460 (97.3%) | 40 (2.7%) |
| 65 to 74 Years | 765 (100.0%) | 0 (0.0%) |
| 75 Years and older | 551 (100.0%) | 0 (0.0%) |
| Total | 10,163 (95.1%) | 528 (4.9%) |
Health Insurance Coverage by Citizenship Status in Pine Hill borough
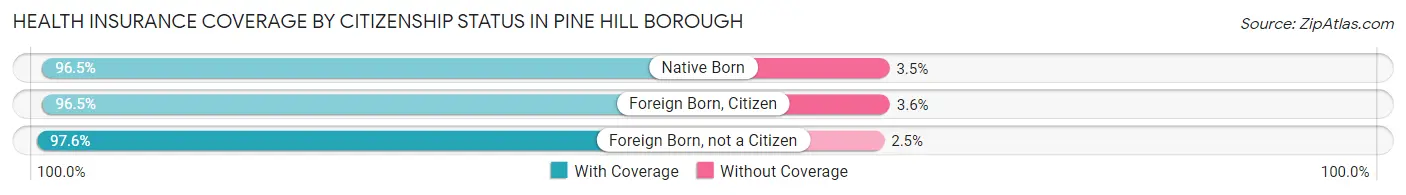
| Citizenship Status | With Coverage | Without Coverage |
| Native Born | 887 (96.5%) | 32 (3.5%) |
| Foreign Born, Citizen | 1,496 (96.5%) | 55 (3.5%) |
| Foreign Born, not a Citizen | 1,114 (97.6%) | 28 (2.5%) |
Health Insurance Coverage by Household Income in Pine Hill borough
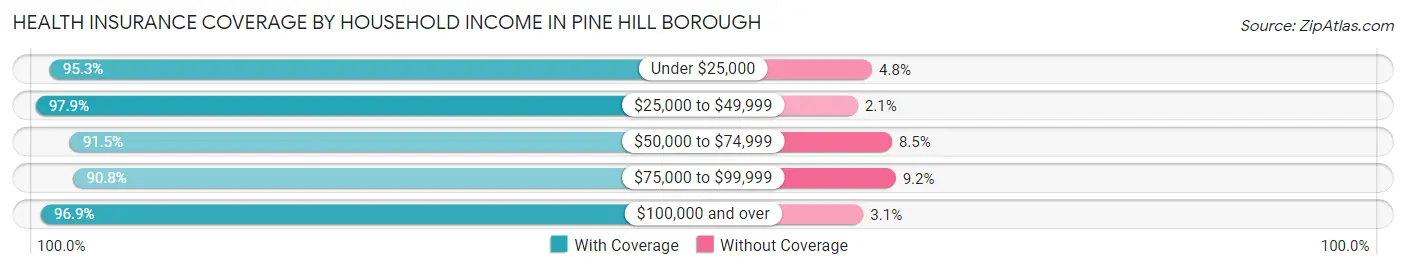
| Household Income | With Coverage | Without Coverage |
| Under $25,000 | 1,103 (95.3%) | 55 (4.8%) |
| $25,000 to $49,999 | 1,871 (97.9%) | 40 (2.1%) |
| $50,000 to $74,999 | 1,523 (91.5%) | 141 (8.5%) |
| $75,000 to $99,999 | 1,596 (90.8%) | 161 (9.2%) |
| $100,000 and over | 4,050 (96.9%) | 130 (3.1%) |
Public vs Private Health Insurance Coverage by Age in Pine Hill borough
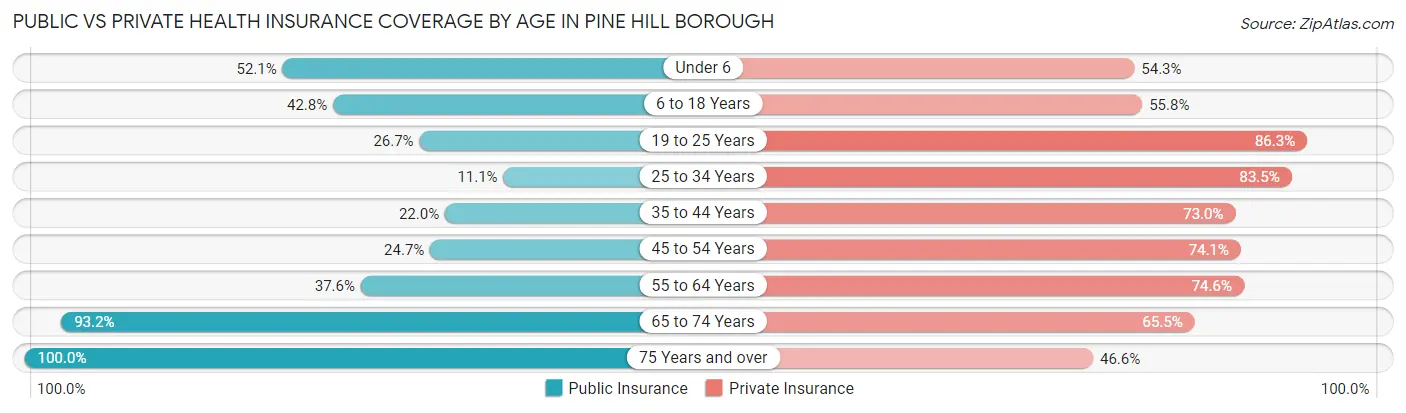
| Age Bracket | Public Insurance | Private Insurance |
| Under 6 | 479 (52.1%) | 499 (54.3%) |
| 6 to 18 Years | 663 (42.7%) | 865 (55.8%) |
| 19 to 25 Years | 305 (26.7%) | 986 (86.3%) |
| 25 to 34 Years | 179 (11.1%) | 1,343 (83.5%) |
| 35 to 44 Years | 312 (22.0%) | 1,037 (73.0%) |
| 45 to 54 Years | 305 (24.7%) | 914 (74.1%) |
| 55 to 64 Years | 564 (37.6%) | 1,119 (74.6%) |
| 65 to 74 Years | 713 (93.2%) | 501 (65.5%) |
| 75 Years and over | 551 (100.0%) | 257 (46.6%) |
| Total | 4,071 (38.1%) | 7,521 (70.4%) |
Disability Status by Sex by Age in Pine Hill borough
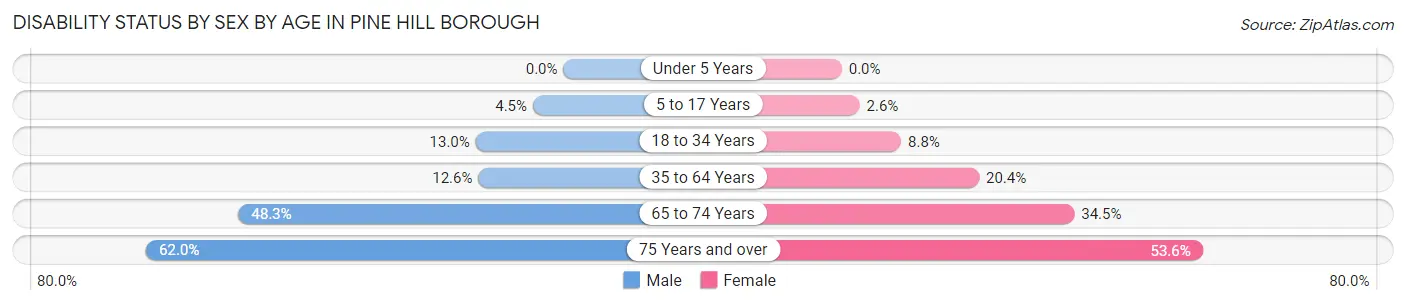
| Age Bracket | Male | Female |
| Under 5 Years | 0 (0.0%) | 0 (0.0%) |
| 5 to 17 Years | 39 (4.5%) | 17 (2.6%) |
| 18 to 34 Years | 159 (13.0%) | 147 (8.8%) |
| 35 to 64 Years | 229 (12.6%) | 477 (20.4%) |
| 65 to 74 Years | 179 (48.2%) | 136 (34.5%) |
| 75 Years and over | 176 (62.0%) | 143 (53.6%) |
Disability Class by Sex by Age in Pine Hill borough
Disability Class: Hearing Difficulty
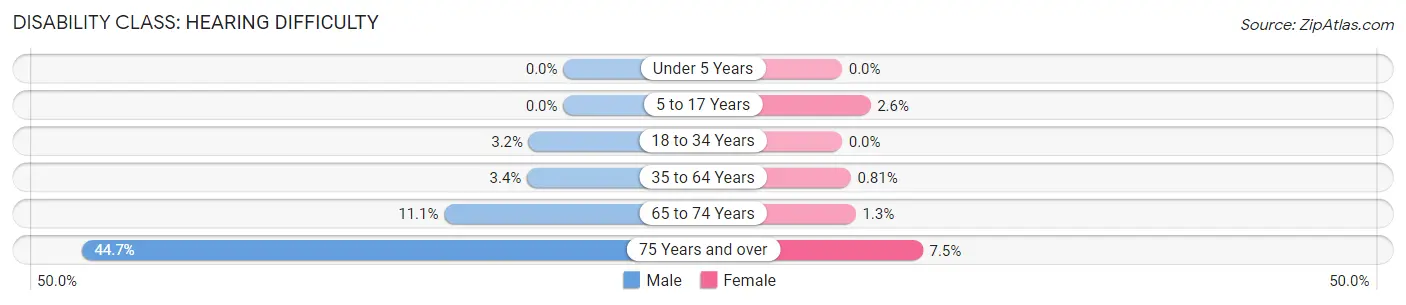
| Age Bracket | Male | Female |
| Under 5 Years | 0 (0.0%) | 0 (0.0%) |
| 5 to 17 Years | 0 (0.0%) | 17 (2.6%) |
| 18 to 34 Years | 39 (3.2%) | 0 (0.0%) |
| 35 to 64 Years | 61 (3.4%) | 19 (0.8%) |
| 65 to 74 Years | 41 (11.1%) | 5 (1.3%) |
| 75 Years and over | 127 (44.7%) | 20 (7.5%) |
Disability Class: Vision Difficulty
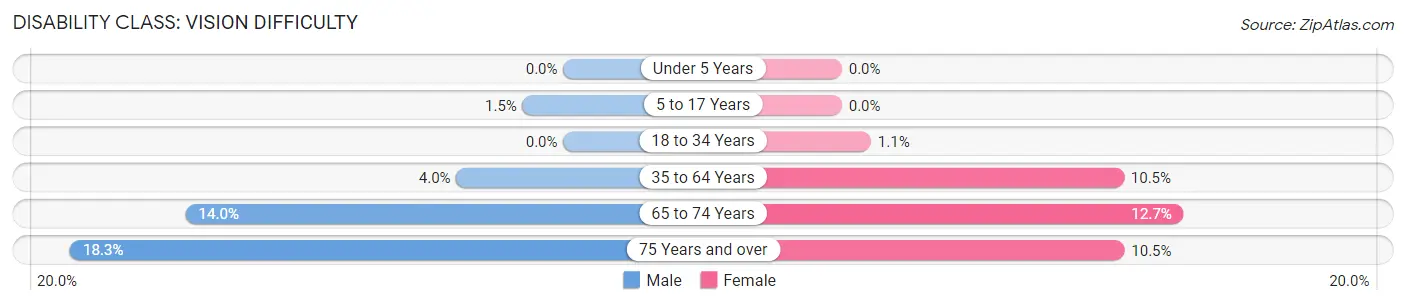
| Age Bracket | Male | Female |
| Under 5 Years | 0 (0.0%) | 0 (0.0%) |
| 5 to 17 Years | 13 (1.5%) | 0 (0.0%) |
| 18 to 34 Years | 0 (0.0%) | 18 (1.1%) |
| 35 to 64 Years | 72 (4.0%) | 245 (10.5%) |
| 65 to 74 Years | 52 (14.0%) | 50 (12.7%) |
| 75 Years and over | 52 (18.3%) | 28 (10.5%) |
Disability Class: Cognitive Difficulty
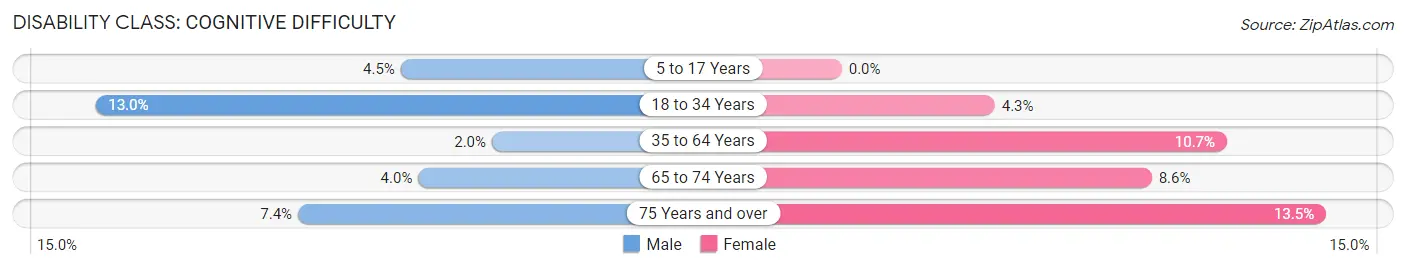
| Age Bracket | Male | Female |
| 5 to 17 Years | 39 (4.5%) | 0 (0.0%) |
| 18 to 34 Years | 159 (13.0%) | 71 (4.3%) |
| 35 to 64 Years | 36 (2.0%) | 251 (10.7%) |
| 65 to 74 Years | 15 (4.0%) | 34 (8.6%) |
| 75 Years and over | 21 (7.4%) | 36 (13.5%) |
Disability Class: Ambulatory Difficulty
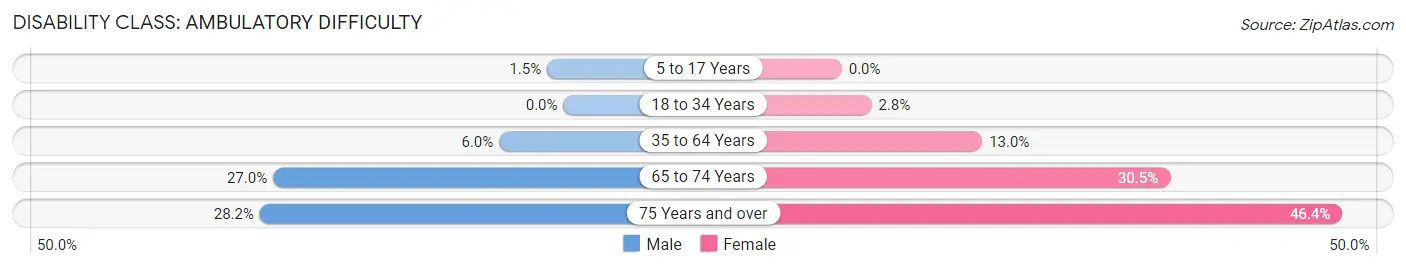
| Age Bracket | Male | Female |
| 5 to 17 Years | 13 (1.5%) | 0 (0.0%) |
| 18 to 34 Years | 0 (0.0%) | 46 (2.8%) |
| 35 to 64 Years | 108 (6.0%) | 305 (13.0%) |
| 65 to 74 Years | 100 (27.0%) | 120 (30.5%) |
| 75 Years and over | 80 (28.2%) | 124 (46.4%) |
Disability Class: Self-Care Difficulty
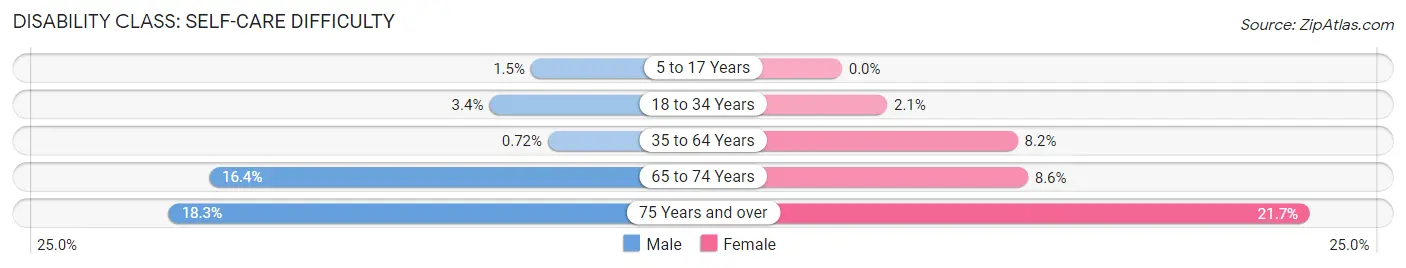
| Age Bracket | Male | Female |
| 5 to 17 Years | 13 (1.5%) | 0 (0.0%) |
| 18 to 34 Years | 42 (3.4%) | 35 (2.1%) |
| 35 to 64 Years | 13 (0.7%) | 191 (8.2%) |
| 65 to 74 Years | 61 (16.4%) | 34 (8.6%) |
| 75 Years and over | 52 (18.3%) | 58 (21.7%) |
Technology Access in Pine Hill borough
Computing Device Access in Pine Hill borough
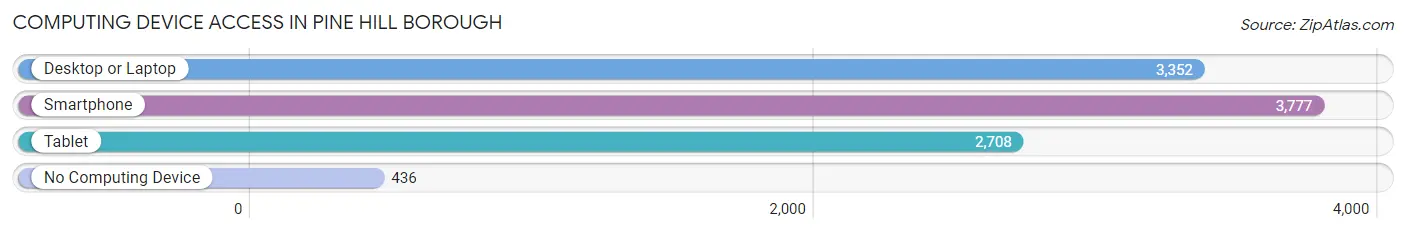
| Device Type | # Households | % Households |
| Desktop or Laptop | 3,352 | 75.5% |
| Smartphone | 3,777 | 85.1% |
| Tablet | 2,708 | 61.0% |
| No Computing Device | 436 | 9.8% |
| Total | 4,439 | 100.0% |
Internet Access in Pine Hill borough
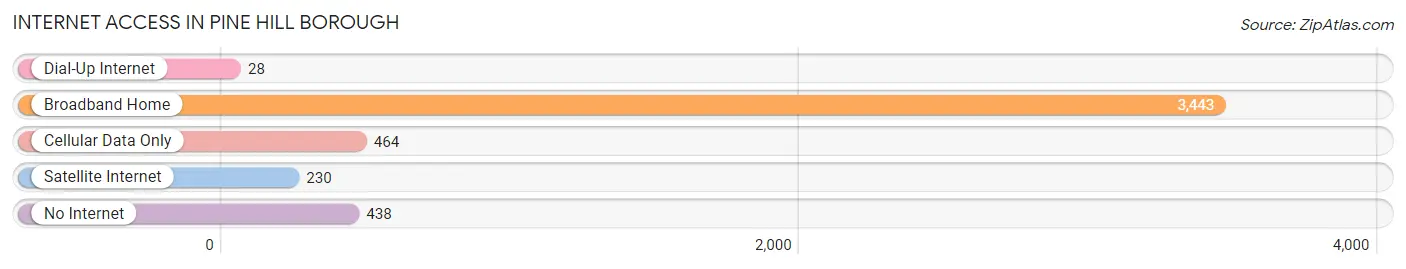
| Internet Type | # Households | % Households |
| Dial-Up Internet | 28 | 0.6% |
| Broadband Home | 3,443 | 77.6% |
| Cellular Data Only | 464 | 10.4% |
| Satellite Internet | 230 | 5.2% |
| No Internet | 438 | 9.9% |
| Total | 4,439 | 100.0% |
Pine Hill borough Summary
Pine Hill Borough is a small borough located in Camden County, New Jersey. It is situated in the Pine Barrens region of the state, and is bordered by the townships of Waterford, Winslow, and Berlin. The borough was incorporated in 1894 and has a population of approximately 5,000 people.
Geography
Pine Hill Borough is located in the Pine Barrens region of New Jersey, which is characterized by sandy soil and pine forests. The borough is situated in the Atlantic Coastal Plain, and is bordered by the townships of Waterford, Winslow, and Berlin. The borough is located approximately 25 miles from Philadelphia and 40 miles from Atlantic City.
The borough is divided into two distinct sections, the northern and southern sections. The northern section is primarily residential, while the southern section is mostly commercial and industrial. The borough is home to several parks, including Pine Hill Park, which is located in the northern section of the borough.
Climate
Pine Hill Borough has a humid subtropical climate, with hot, humid summers and mild winters. The average annual temperature is around 55 degrees Fahrenheit, with an average high of around 80 degrees Fahrenheit in the summer and an average low of around 40 degrees Fahrenheit in the winter. The average annual precipitation is around 45 inches.
Demographics
As of the 2010 census, the population of Pine Hill Borough was 5,067. The racial makeup of the borough was 79.3% White, 14.2% African American, 0.3% Native American, 1.2% Asian, 0.1% Pacific Islander, and 4.9% from other races. Hispanic or Latino of any race were 8.3% of the population.
The median household income in Pine Hill Borough was $50,945, and the median family income was $60,945. The per capita income was $22,945. About 8.3% of families and 10.2% of the population were below the poverty line, including 14.2% of those under age 18 and 8.3% of those age 65 or over.
Economy
Pine Hill Borough is home to a variety of businesses, including retail stores, restaurants, and professional services. The borough is also home to several industrial and manufacturing businesses, including a paper mill and a plastics factory. The borough is also home to a number of small businesses, including a bakery, a florist, and a furniture store.
The borough is served by the Pine Hill School District, which includes two elementary schools, one middle school, and one high school. The borough is also home to a number of churches, including the Pine Hill United Methodist Church and the Pine Hill Presbyterian Church.
Conclusion
Pine Hill Borough is a small borough located in Camden County, New Jersey. It is situated in the Pine Barrens region of the state, and is bordered by the townships of Waterford, Winslow, and Berlin. The borough was incorporated in 1894 and has a population of approximately 5,000 people. The borough is divided into two distinct sections, the northern and southern sections. The northern section is primarily residential, while the southern section is mostly commercial and industrial. The borough is home to several parks, including Pine Hill Park, which is located in the northern section of the borough. The borough is home to a variety of businesses, including retail stores, restaurants, and professional services. The borough is also home to several industrial and manufacturing businesses, including a paper mill and a plastics factory. The borough is served by the Pine Hill School District, which includes two elementary schools, one middle school, and one high school. The borough is also home to a number of churches, including the Pine Hill United Methodist Church and the Pine Hill Presbyterian Church.
Common Questions
What is Per Capita Income in Pine Hill borough?
Per Capita income in Pine Hill borough is $41,194.
What is the Median Family Income in Pine Hill borough?
Median Family Income in Pine Hill borough is $84,778.
What is the Median Household income in Pine Hill borough?
Median Household Income in Pine Hill borough is $69,176.
What is Income or Wage Gap in Pine Hill borough?
Income or Wage Gap in Pine Hill borough is 22.5%.
Women in Pine Hill borough earn 77.5 cents for every dollar earned by a man.
What is Inequality or Gini Index in Pine Hill borough?
Inequality or Gini Index in Pine Hill borough is 0.49.
What is the Total Population of Pine Hill borough?
Total Population of Pine Hill borough is 10,698.
What is the Total Male Population of Pine Hill borough?
Total Male Population of Pine Hill borough is 5,084.
What is the Total Female Population of Pine Hill borough?
Total Female Population of Pine Hill borough is 5,614.
What is the Ratio of Males per 100 Females in Pine Hill borough?
There are 90.56 Males per 100 Females in Pine Hill borough.
What is the Ratio of Females per 100 Males in Pine Hill borough?
There are 110.42 Females per 100 Males in Pine Hill borough.
What is the Median Population Age in Pine Hill borough?
Median Population Age in Pine Hill borough is 35.6 Years.
What is the Average Family Size in Pine Hill borough
Average Family Size in Pine Hill borough is 3.2 People.
What is the Average Household Size in Pine Hill borough
Average Household Size in Pine Hill borough is 2.4 People.
How Large is the Labor Force in Pine Hill borough?
There are 6,110 People in the Labor Forcein in Pine Hill borough.
What is the Percentage of People in the Labor Force in Pine Hill borough?
70.8% of People are in the Labor Force in Pine Hill borough.
What is the Unemployment Rate in Pine Hill borough?
Unemployment Rate in Pine Hill borough is 8.3%.