Brownville, NJ Map & Demographics
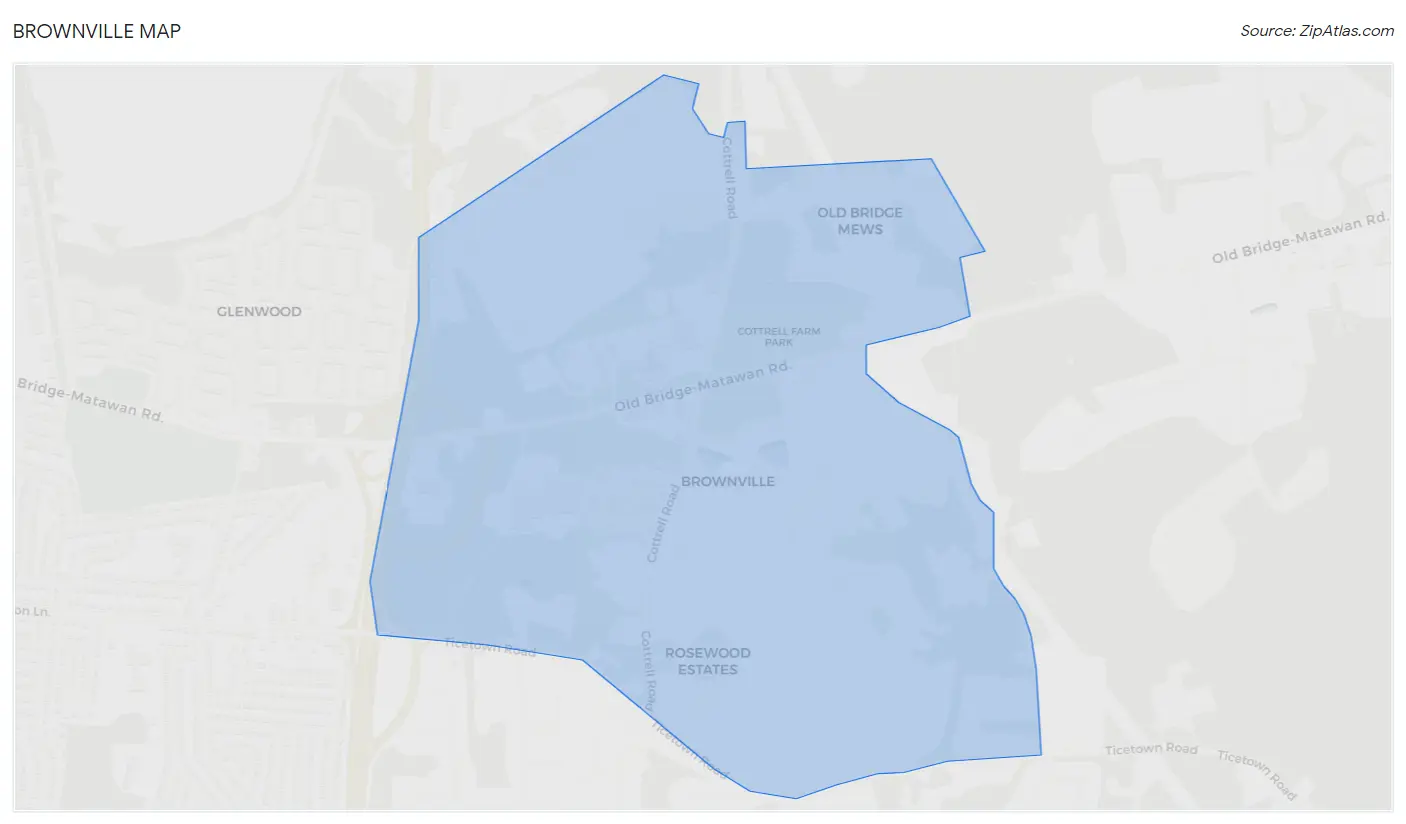
Brownville Map
Brownville Overview
$64,529
PER CAPITA INCOME
$131,214
AVG FAMILY INCOME
$106,406
AVG HOUSEHOLD INCOME
10.9%
WAGE / INCOME GAP [ % ]
89.1¢/ $1
WAGE / INCOME GAP [ $ ]
0.43
INEQUALITY / GINI INDEX
2,183
TOTAL POPULATION
1,012
MALE POPULATION
1,171
FEMALE POPULATION
86.42
MALES / 100 FEMALES
115.71
FEMALES / 100 MALES
45.6
MEDIAN AGE
2.9
AVG FAMILY SIZE
2.3
AVG HOUSEHOLD SIZE
1,550
LABOR FORCE [ PEOPLE ]
80.9%
PERCENT IN LABOR FORCE
5.3%
UNEMPLOYMENT RATE
Income in Brownville
Income Overview in Brownville
Per Capita Income in Brownville is $64,529, while median incomes of families and households are $131,214 and $106,406 respectively.
| Characteristic | Number | Measure |
| Per Capita Income | 2,183 | $64,529 |
| Median Family Income | 520 | $131,214 |
| Mean Family Income | 520 | $165,202 |
| Median Household Income | 964 | $106,406 |
| Mean Household Income | 964 | $144,552 |
| Income Deficit | 520 | $0 |
| Wage / Income Gap (%) | 2,183 | 10.89% |
| Wage / Income Gap ($) | 2,183 | 89.11¢ per $1 |
| Gini / Inequality Index | 2,183 | 0.43 |
Earnings by Sex in Brownville
Average Earnings in Brownville are $60,793, $64,632 for men and $57,596 for women, a difference of 10.9%.
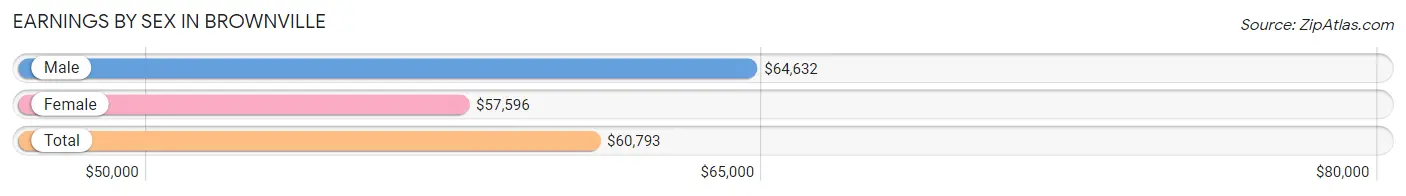
| Sex | Number | Average Earnings |
| Male | 748 (47.1%) | $64,632 |
| Female | 839 (52.9%) | $57,596 |
| Total | 1,587 (100.0%) | $60,793 |
Earnings by Sex by Income Bracket in Brownville
The most common earnings brackets in Brownville are $100,000+ for men (238 | 31.8%) and $100,000+ for women (158 | 18.8%).
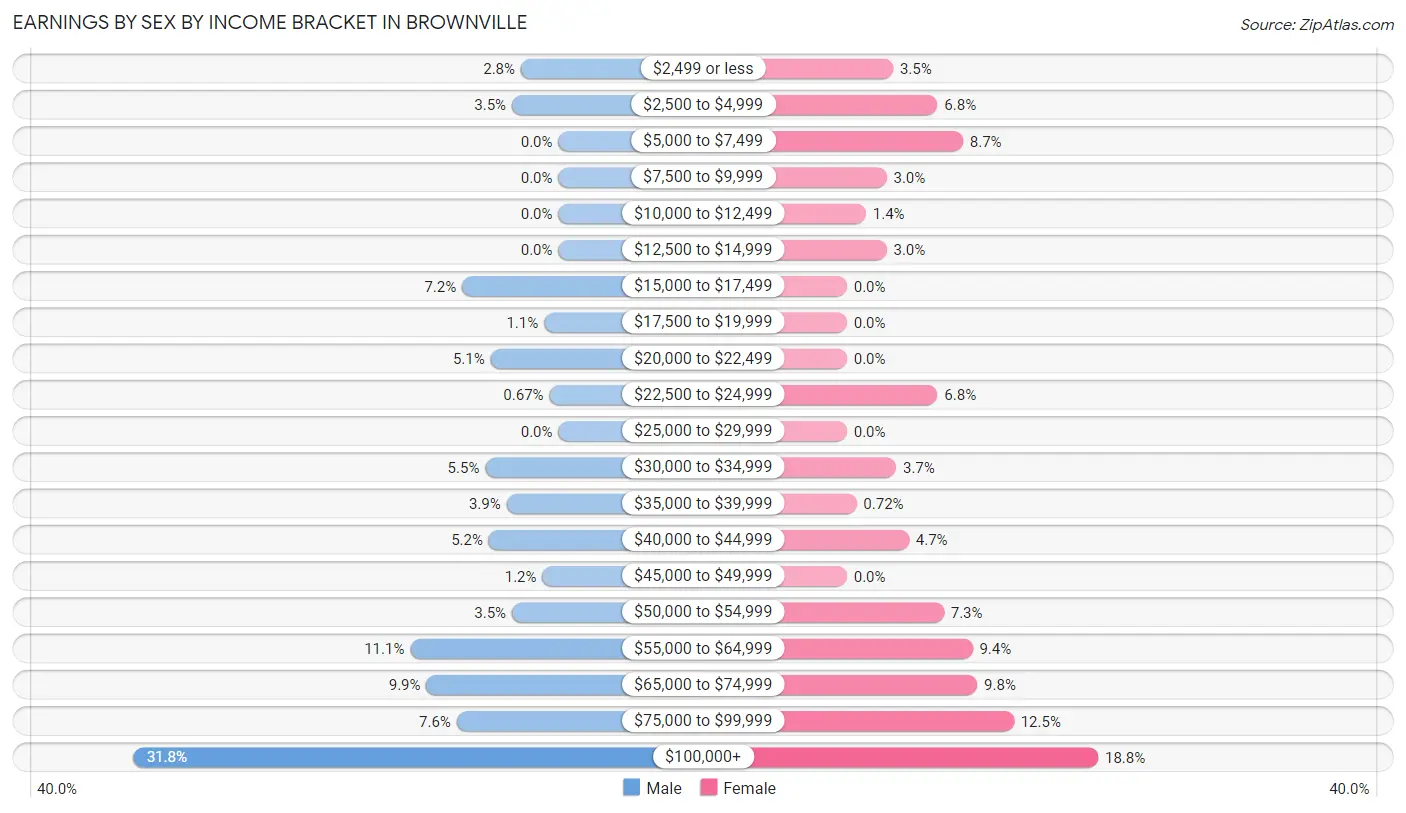
| Income | Male | Female |
| $2,499 or less | 21 (2.8%) | 29 (3.5%) |
| $2,500 to $4,999 | 26 (3.5%) | 57 (6.8%) |
| $5,000 to $7,499 | 0 (0.0%) | 73 (8.7%) |
| $7,500 to $9,999 | 0 (0.0%) | 25 (3.0%) |
| $10,000 to $12,499 | 0 (0.0%) | 12 (1.4%) |
| $12,500 to $14,999 | 0 (0.0%) | 25 (3.0%) |
| $15,000 to $17,499 | 54 (7.2%) | 0 (0.0%) |
| $17,500 to $19,999 | 8 (1.1%) | 0 (0.0%) |
| $20,000 to $22,499 | 38 (5.1%) | 0 (0.0%) |
| $22,500 to $24,999 | 5 (0.7%) | 57 (6.8%) |
| $25,000 to $29,999 | 0 (0.0%) | 0 (0.0%) |
| $30,000 to $34,999 | 41 (5.5%) | 31 (3.7%) |
| $35,000 to $39,999 | 29 (3.9%) | 6 (0.7%) |
| $40,000 to $44,999 | 39 (5.2%) | 39 (4.6%) |
| $45,000 to $49,999 | 9 (1.2%) | 0 (0.0%) |
| $50,000 to $54,999 | 26 (3.5%) | 61 (7.3%) |
| $55,000 to $64,999 | 83 (11.1%) | 79 (9.4%) |
| $65,000 to $74,999 | 74 (9.9%) | 82 (9.8%) |
| $75,000 to $99,999 | 57 (7.6%) | 105 (12.5%) |
| $100,000+ | 238 (31.8%) | 158 (18.8%) |
| Total | 748 (100.0%) | 839 (100.0%) |
Earnings by Sex by Educational Attainment in Brownville
Average earnings in Brownville are $71,115 for men and $61,947 for women, a difference of 12.9%. Men with an educational attainment of bachelor's degree enjoy the highest average annual earnings of $161,786, while those with high school diploma education earn the least with $43,750. Women with an educational attainment of graduate degree earn the most with the average annual earnings of $101,333, while those with high school diploma education have the smallest earnings of $53,182.
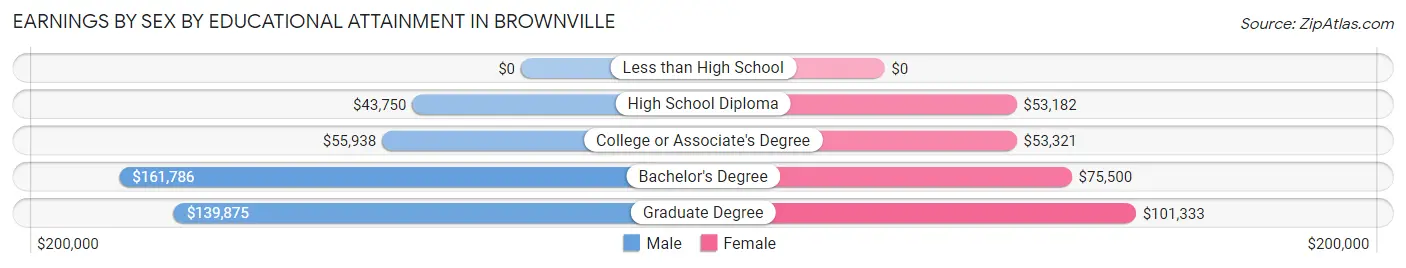
| Educational Attainment | Male Income | Female Income |
| Less than High School | - | - |
| High School Diploma | $43,750 | $53,182 |
| College or Associate's Degree | $55,938 | $53,321 |
| Bachelor's Degree | $161,786 | $75,500 |
| Graduate Degree | $139,875 | $101,333 |
| Total | $71,115 | $61,947 |
Family Income in Brownville
Family Income Brackets in Brownville
According to the Brownville family income data, there are 124 families falling into the $200,000+ income range, which is the most common income bracket and makes up 23.8% of all families.
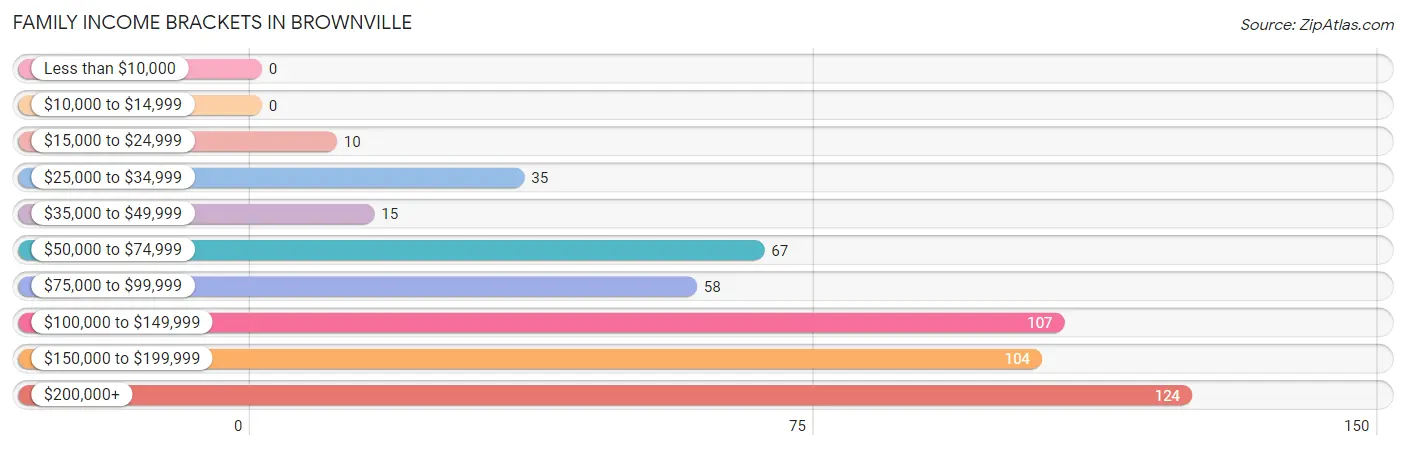
| Income Bracket | # Families | % Families |
| Less than $10,000 | 0 | 0.0% |
| $10,000 to $14,999 | 0 | 0.0% |
| $15,000 to $24,999 | 10 | 1.9% |
| $25,000 to $34,999 | 35 | 6.7% |
| $35,000 to $49,999 | 15 | 2.9% |
| $50,000 to $74,999 | 67 | 12.9% |
| $75,000 to $99,999 | 58 | 11.2% |
| $100,000 to $149,999 | 107 | 20.6% |
| $150,000 to $199,999 | 104 | 20.0% |
| $200,000+ | 124 | 23.8% |
Family Income by Famaliy Size in Brownville
3-person families (212 | 40.8%) account for the highest median family income in Brownville with $155,625 per family, while 2-person families (198 | 38.1%) have the highest median income of $65,143 per family member.
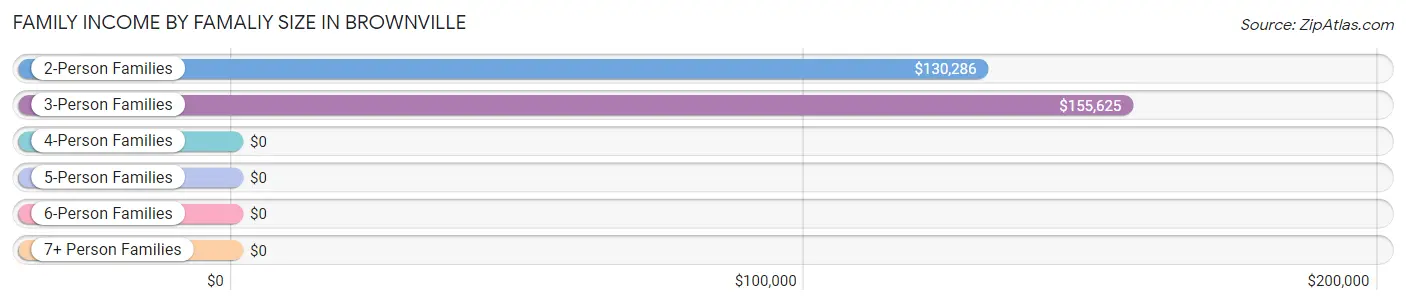
| Income Bracket | # Families | Median Income |
| 2-Person Families | 198 (38.1%) | $130,286 |
| 3-Person Families | 212 (40.8%) | $155,625 |
| 4-Person Families | 98 (18.9%) | $0 |
| 5-Person Families | 12 (2.3%) | $0 |
| 6-Person Families | 0 (0.0%) | $0 |
| 7+ Person Families | 0 (0.0%) | $0 |
| Total | 520 (100.0%) | $131,214 |
Family Income by Number of Earners in Brownville
The median family income in Brownville is $131,214, with families comprising 3+ earners (138) having the highest median family income of $164,821, while families with no earners (32) have the lowest median family income of $81,200, accounting for 26.5% and 6.1% of families, respectively.
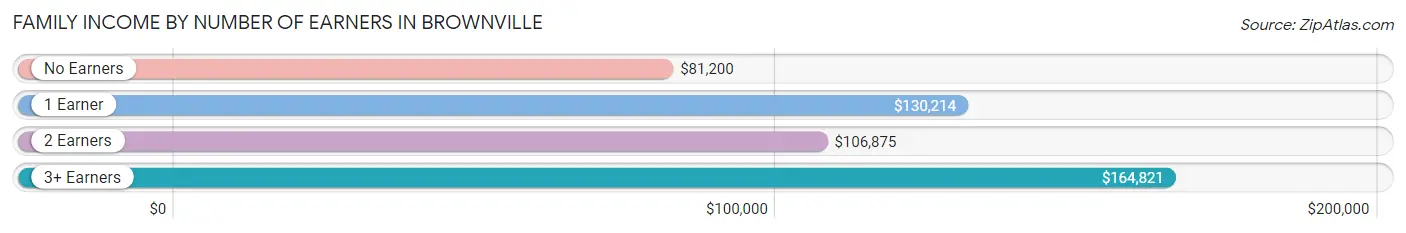
| Number of Earners | # Families | Median Income |
| No Earners | 32 (6.1%) | $81,200 |
| 1 Earner | 108 (20.8%) | $130,214 |
| 2 Earners | 242 (46.5%) | $106,875 |
| 3+ Earners | 138 (26.5%) | $164,821 |
| Total | 520 (100.0%) | $131,214 |
Household Income in Brownville
Household Income Brackets in Brownville
With 231 households falling in the category, the $200,000+ income range is the most frequent in Brownville, accounting for 24.0% of all households. In contrast, only 17 households (1.8%) fall into the $10,000 to $14,999 income bracket, making it the least populous group.
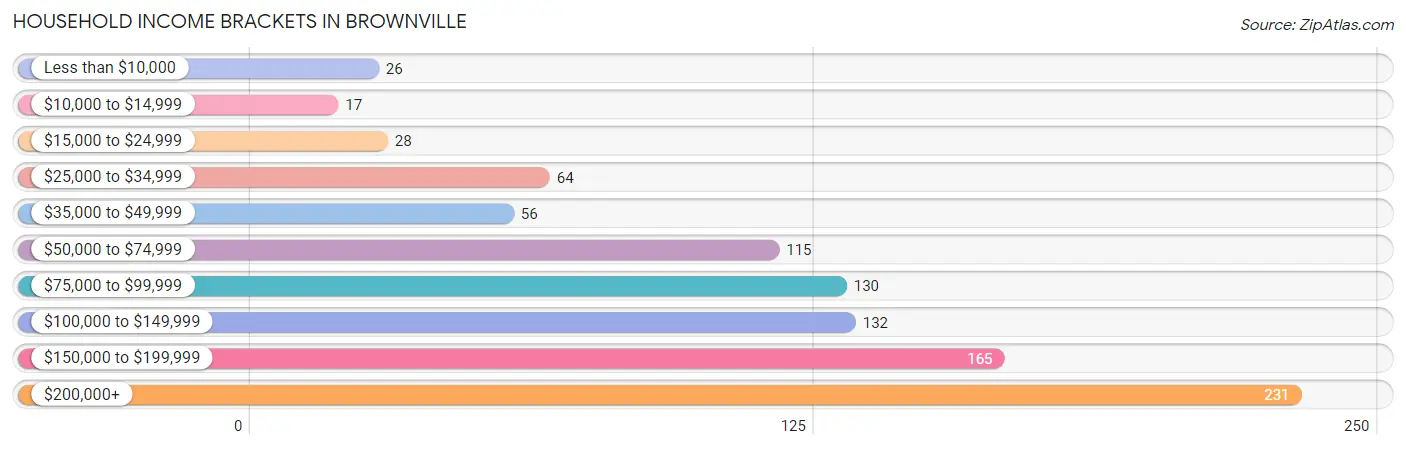
| Income Bracket | # Households | % Households |
| Less than $10,000 | 26 | 2.7% |
| $10,000 to $14,999 | 17 | 1.8% |
| $15,000 to $24,999 | 28 | 2.9% |
| $25,000 to $34,999 | 64 | 6.6% |
| $35,000 to $49,999 | 56 | 5.8% |
| $50,000 to $74,999 | 115 | 11.9% |
| $75,000 to $99,999 | 130 | 13.5% |
| $100,000 to $149,999 | 132 | 13.7% |
| $150,000 to $199,999 | 165 | 17.1% |
| $200,000+ | 231 | 24.0% |
Household Income by Householder Age in Brownville
The median household income in Brownville is $106,406, with the highest median household income of $139,313 found in the 45 to 64 years age bracket for the primary householder. A total of 511 households (53.0%) fall into this category.
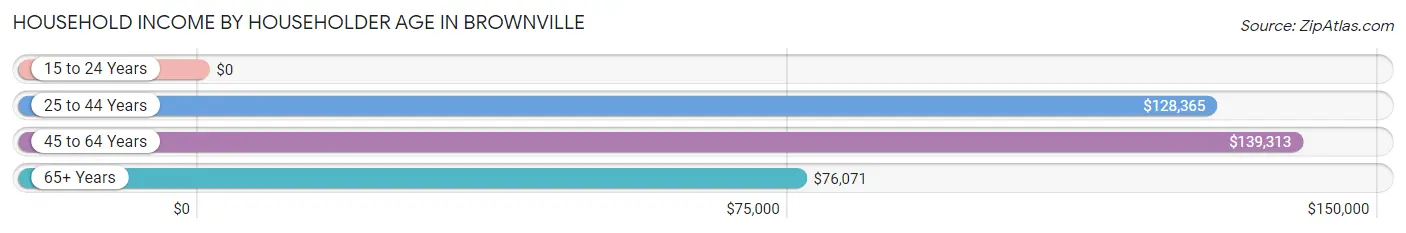
| Income Bracket | # Households | Median Income |
| 15 to 24 Years | 0 (0.0%) | $0 |
| 25 to 44 Years | 223 (23.1%) | $128,365 |
| 45 to 64 Years | 511 (53.0%) | $139,313 |
| 65+ Years | 230 (23.9%) | $76,071 |
| Total | 964 (100.0%) | $106,406 |
Poverty in Brownville
Income Below Poverty by Sex and Age in Brownville
With 1.5% poverty level for males and 9.4% for females among the residents of Brownville, 5 year old males and under 5 year old females are the most vulnerable to poverty, with 15 males (44.1%) and 33 females (70.2%) in their respective age groups living below the poverty level.
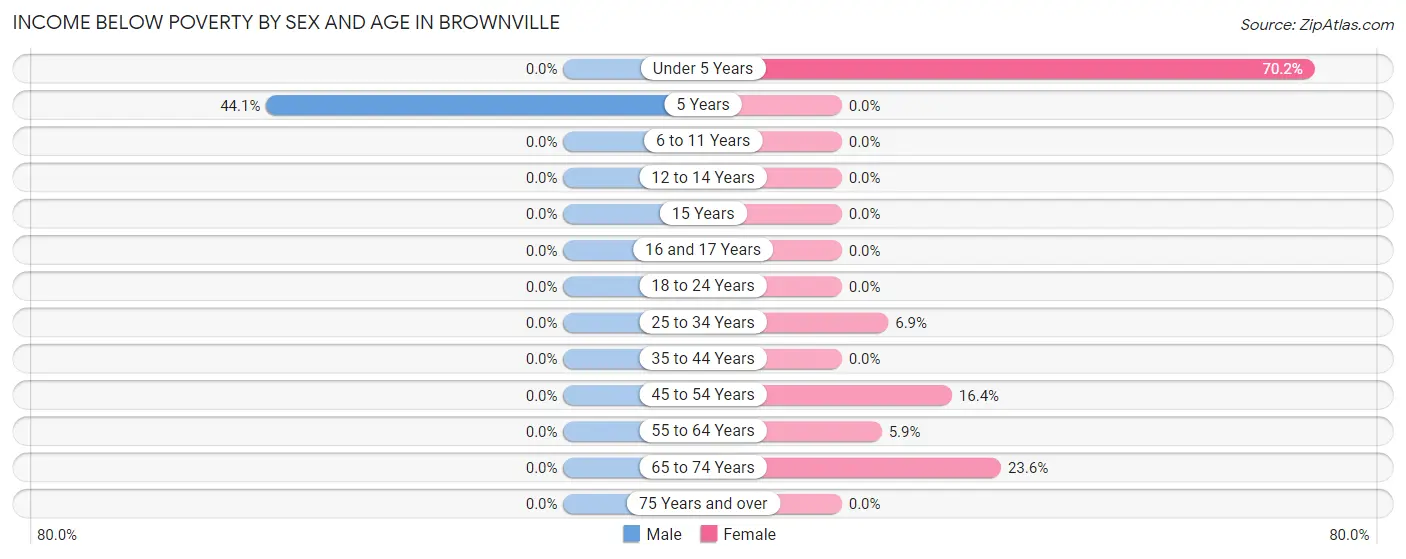
| Age Bracket | Male | Female |
| Under 5 Years | 0 (0.0%) | 33 (70.2%) |
| 5 Years | 15 (44.1%) | 0 (0.0%) |
| 6 to 11 Years | 0 (0.0%) | 0 (0.0%) |
| 12 to 14 Years | 0 (0.0%) | 0 (0.0%) |
| 15 Years | 0 (0.0%) | 0 (0.0%) |
| 16 and 17 Years | 0 (0.0%) | 0 (0.0%) |
| 18 to 24 Years | 0 (0.0%) | 0 (0.0%) |
| 25 to 34 Years | 0 (0.0%) | 12 (6.9%) |
| 35 to 44 Years | 0 (0.0%) | 0 (0.0%) |
| 45 to 54 Years | 0 (0.0%) | 17 (16.4%) |
| 55 to 64 Years | 0 (0.0%) | 22 (5.9%) |
| 65 to 74 Years | 0 (0.0%) | 26 (23.6%) |
| 75 Years and over | 0 (0.0%) | 0 (0.0%) |
| Total | 15 (1.5%) | 110 (9.4%) |
Income Above Poverty by Sex and Age in Brownville
According to the poverty statistics in Brownville, males aged under 5 years and females aged 5 years are the age groups that are most secure financially, with 100.0% of males and 100.0% of females in these age groups living above the poverty line.
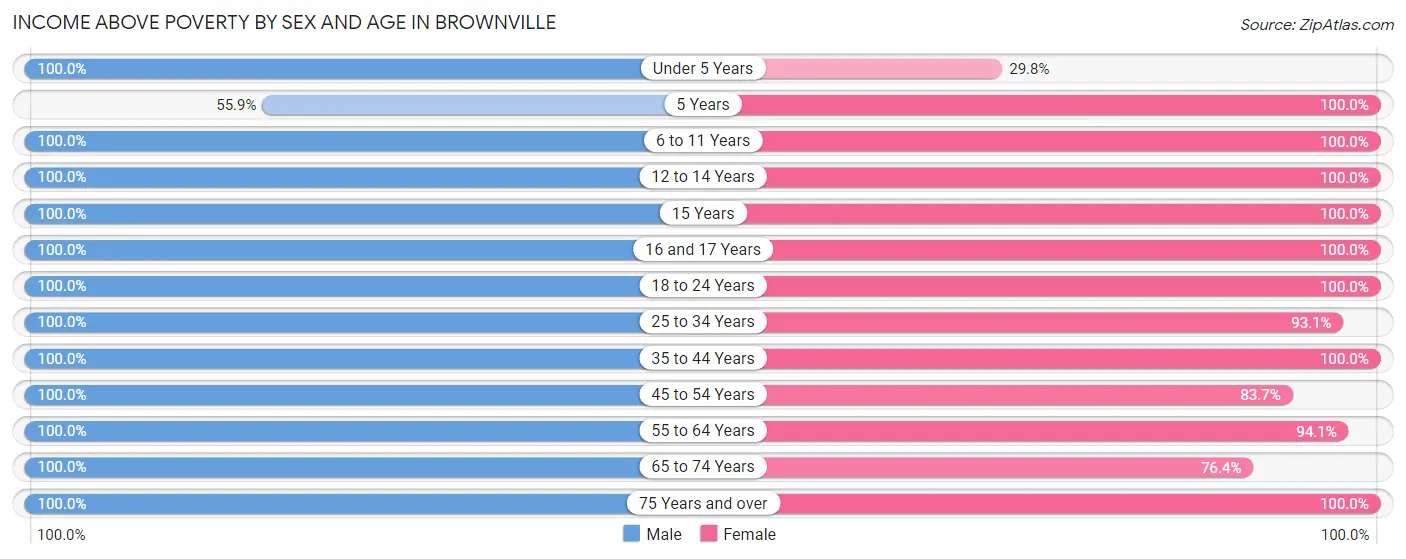
| Age Bracket | Male | Female |
| Under 5 Years | 52 (100.0%) | 14 (29.8%) |
| 5 Years | 19 (55.9%) | 36 (100.0%) |
| 6 to 11 Years | 13 (100.0%) | 36 (100.0%) |
| 12 to 14 Years | 6 (100.0%) | 12 (100.0%) |
| 15 Years | 4 (100.0%) | 27 (100.0%) |
| 16 and 17 Years | 39 (100.0%) | 5 (100.0%) |
| 18 to 24 Years | 54 (100.0%) | 106 (100.0%) |
| 25 to 34 Years | 145 (100.0%) | 162 (93.1%) |
| 35 to 44 Years | 181 (100.0%) | 94 (100.0%) |
| 45 to 54 Years | 76 (100.0%) | 87 (83.7%) |
| 55 to 64 Years | 266 (100.0%) | 349 (94.1%) |
| 65 to 74 Years | 110 (100.0%) | 84 (76.4%) |
| 75 Years and over | 32 (100.0%) | 49 (100.0%) |
| Total | 997 (98.5%) | 1,061 (90.6%) |
Income Below Poverty Among Married-Couple Families in Brownville
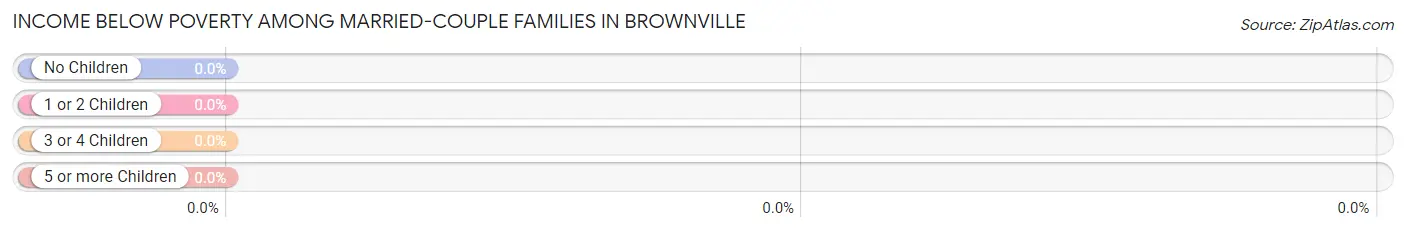
| Children | Above Poverty | Below Poverty |
| No Children | 195 (100.0%) | 0 (0.0%) |
| 1 or 2 Children | 94 (100.0%) | 0 (0.0%) |
| 3 or 4 Children | 8 (100.0%) | 0 (0.0%) |
| 5 or more Children | 0 (0.0%) | 0 (0.0%) |
| Total | 297 (100.0%) | 0 (0.0%) |
Income Below Poverty Among Single-Parent Households in Brownville
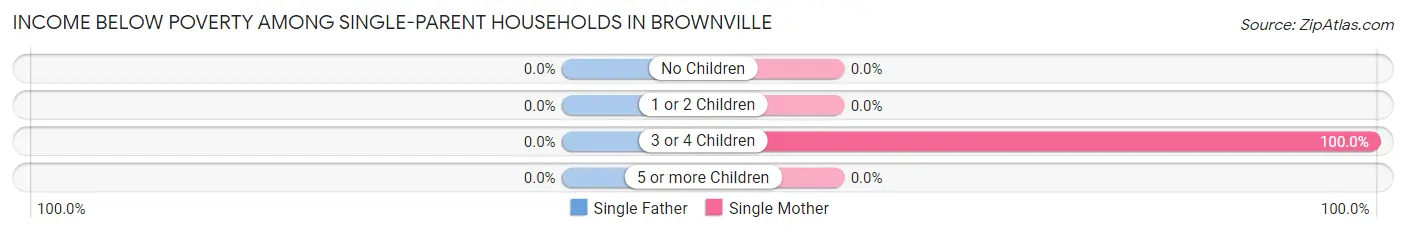
| Children | Single Father | Single Mother |
| No Children | 0 (0.0%) | 0 (0.0%) |
| 1 or 2 Children | 0 (0.0%) | 0 (0.0%) |
| 3 or 4 Children | 0 (0.0%) | 12 (100.0%) |
| 5 or more Children | 0 (0.0%) | 0 (0.0%) |
| Total | 0 (0.0%) | 12 (6.8%) |
Income Below Poverty Among Married-Couple vs Single-Parent Households in Brownville
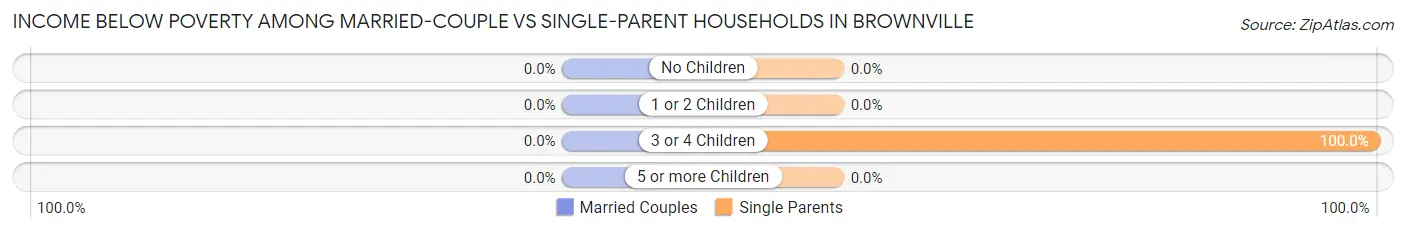
| Children | Married-Couple Families | Single-Parent Households |
| No Children | 0 (0.0%) | 0 (0.0%) |
| 1 or 2 Children | 0 (0.0%) | 0 (0.0%) |
| 3 or 4 Children | 0 (0.0%) | 12 (100.0%) |
| 5 or more Children | 0 (0.0%) | 0 (0.0%) |
| Total | 0 (0.0%) | 12 (5.4%) |
Race in Brownville
The most populous races in Brownville are White / Caucasian (1,733 | 79.4%), Hispanic or Latino (312 | 14.3%), and Some other Race (174 | 8.0%).
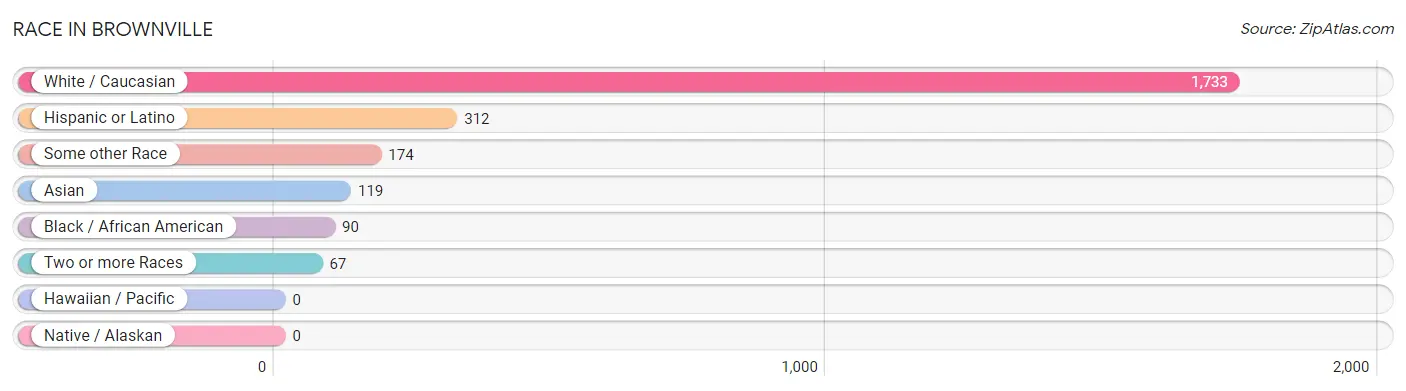
| Race | # Population | % Population |
| Asian | 119 | 5.4% |
| Black / African American | 90 | 4.1% |
| Hawaiian / Pacific | 0 | 0.0% |
| Hispanic or Latino | 312 | 14.3% |
| Native / Alaskan | 0 | 0.0% |
| White / Caucasian | 1,733 | 79.4% |
| Two or more Races | 67 | 3.1% |
| Some other Race | 174 | 8.0% |
| Total | 2,183 | 100.0% |
Ancestry in Brownville
The most populous ancestries reported in Brownville are Italian (748 | 34.3%), Irish (311 | 14.2%), Polish (257 | 11.8%), Puerto Rican (155 | 7.1%), and German (142 | 6.5%), together accounting for 73.9% of all Brownville residents.
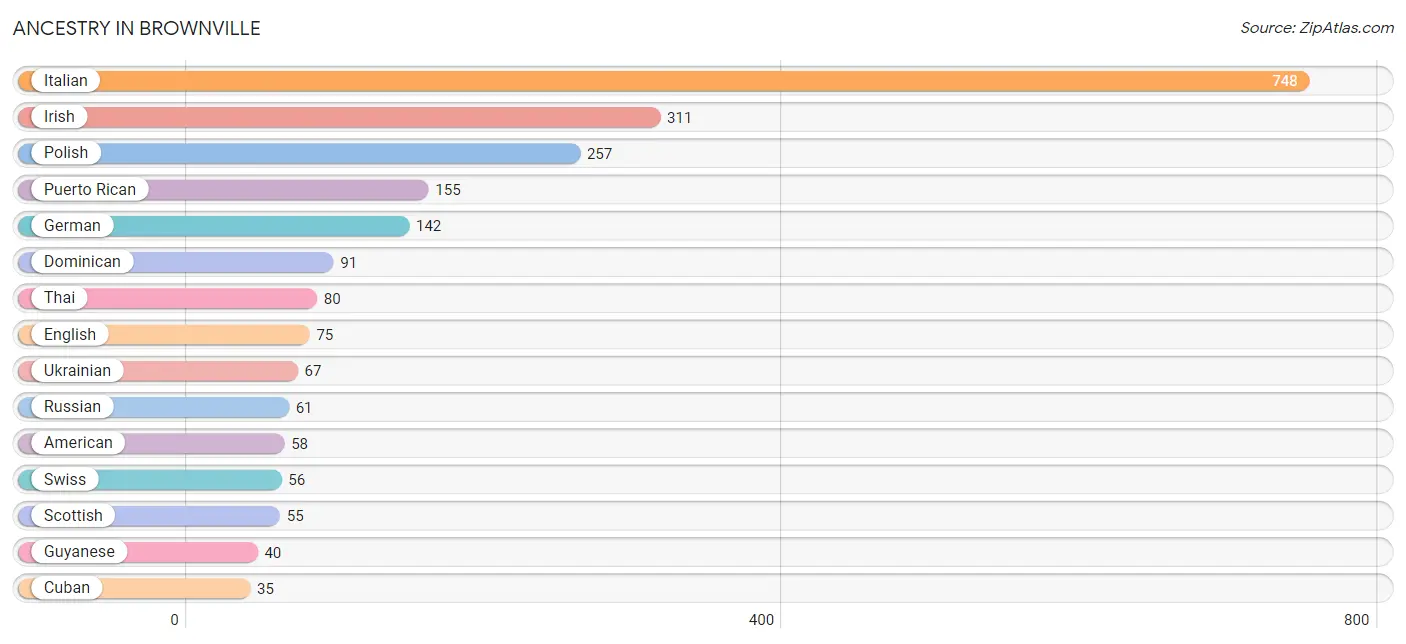
| Ancestry | # Population | % Population |
| American | 58 | 2.7% |
| Austrian | 16 | 0.7% |
| British West Indian | 9 | 0.4% |
| Colombian | 16 | 0.7% |
| Cuban | 35 | 1.6% |
| Czech | 25 | 1.1% |
| Dominican | 91 | 4.2% |
| Dutch | 5 | 0.2% |
| English | 75 | 3.4% |
| French | 35 | 1.6% |
| German | 142 | 6.5% |
| Greek | 17 | 0.8% |
| Guyanese | 40 | 1.8% |
| Hungarian | 3 | 0.1% |
| Indian (Asian) | 28 | 1.3% |
| Irish | 311 | 14.2% |
| Italian | 748 | 34.3% |
| Korean | 11 | 0.5% |
| Lithuanian | 14 | 0.6% |
| Norwegian | 5 | 0.2% |
| Polish | 257 | 11.8% |
| Puerto Rican | 155 | 7.1% |
| Russian | 61 | 2.8% |
| Scotch-Irish | 6 | 0.3% |
| Scottish | 55 | 2.5% |
| Slavic | 3 | 0.1% |
| Slovak | 10 | 0.5% |
| South American | 16 | 0.7% |
| Spanish | 15 | 0.7% |
| Swedish | 25 | 1.1% |
| Swiss | 56 | 2.6% |
| Thai | 80 | 3.7% |
| Ukrainian | 67 | 3.1% |
| Welsh | 18 | 0.8% |
| Yugoslavian | 10 | 0.5% | View All 35 Rows |
Immigrants in Brownville
The most numerous immigrant groups reported in Brownville came from Europe (121 | 5.5%), Eastern Europe (113 | 5.2%), Poland (98 | 4.5%), Asia (84 | 3.8%), and South Central Asia (69 | 3.2%), together accounting for 22.2% of all Brownville residents.
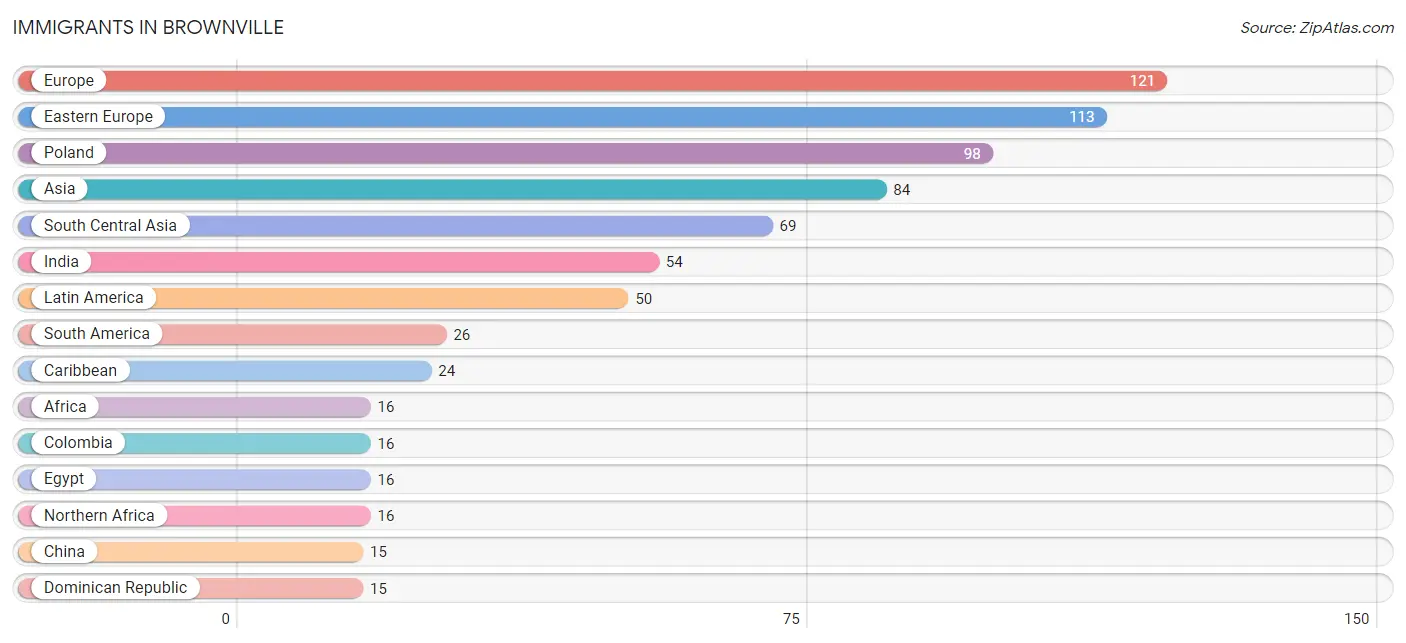
| Immigration Origin | # Population | % Population |
| Africa | 16 | 0.7% |
| Asia | 84 | 3.8% |
| Caribbean | 24 | 1.1% |
| China | 15 | 0.7% |
| Colombia | 16 | 0.7% |
| Dominican Republic | 15 | 0.7% |
| Eastern Asia | 15 | 0.7% |
| Eastern Europe | 113 | 5.2% |
| Egypt | 16 | 0.7% |
| Europe | 121 | 5.5% |
| Greece | 4 | 0.2% |
| Guyana | 10 | 0.5% |
| Hong Kong | 9 | 0.4% |
| India | 54 | 2.5% |
| Italy | 4 | 0.2% |
| Kazakhstan | 15 | 0.7% |
| Latin America | 50 | 2.3% |
| Northern Africa | 16 | 0.7% |
| Poland | 98 | 4.5% |
| South America | 26 | 1.2% |
| South Central Asia | 69 | 3.2% |
| Southern Europe | 8 | 0.4% |
| Ukraine | 15 | 0.7% | View All 23 Rows |
Sex and Age in Brownville
Sex and Age in Brownville
The most populous age groups in Brownville are 60 to 64 Years (135 | 13.3%) for men and 55 to 59 Years (262 | 22.4%) for women.
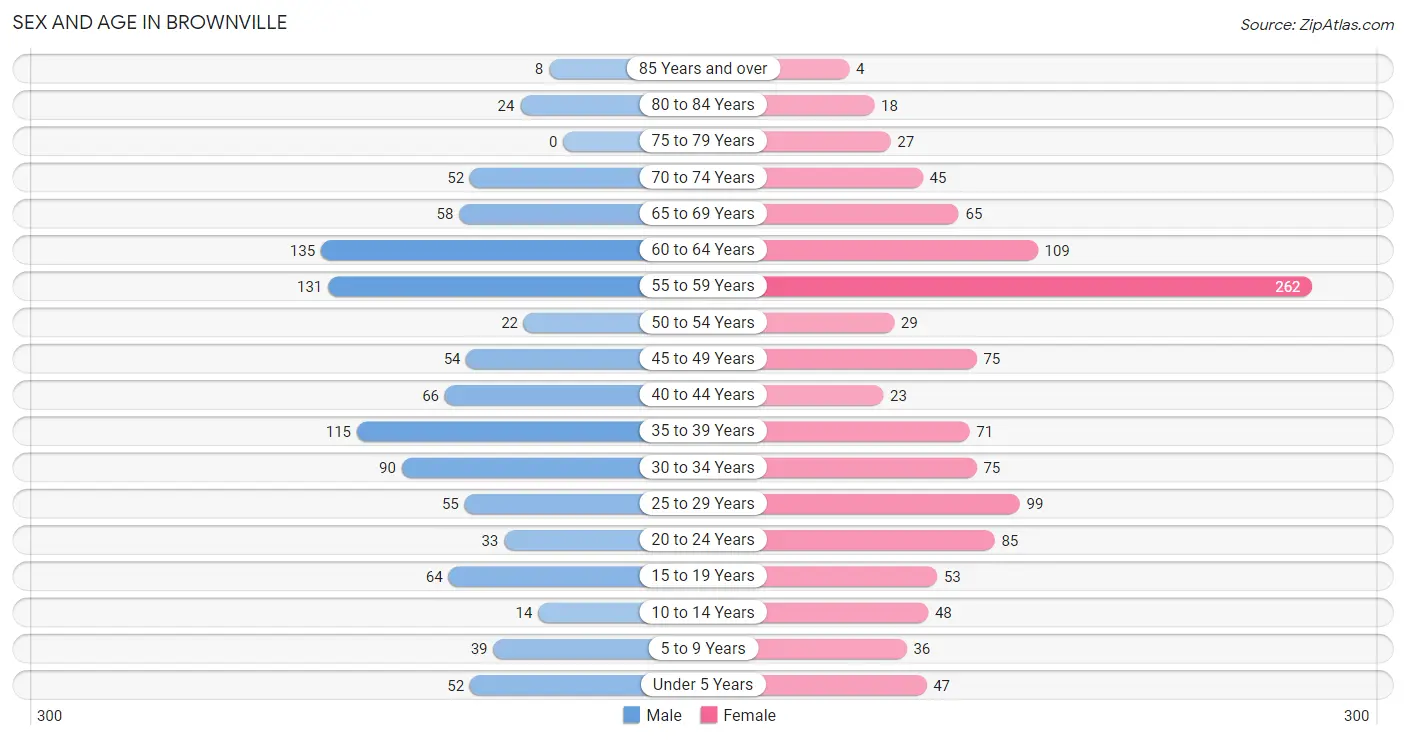
| Age Bracket | Male | Female |
| Under 5 Years | 52 (5.1%) | 47 (4.0%) |
| 5 to 9 Years | 39 (3.8%) | 36 (3.1%) |
| 10 to 14 Years | 14 (1.4%) | 48 (4.1%) |
| 15 to 19 Years | 64 (6.3%) | 53 (4.5%) |
| 20 to 24 Years | 33 (3.3%) | 85 (7.3%) |
| 25 to 29 Years | 55 (5.4%) | 99 (8.5%) |
| 30 to 34 Years | 90 (8.9%) | 75 (6.4%) |
| 35 to 39 Years | 115 (11.4%) | 71 (6.1%) |
| 40 to 44 Years | 66 (6.5%) | 23 (2.0%) |
| 45 to 49 Years | 54 (5.3%) | 75 (6.4%) |
| 50 to 54 Years | 22 (2.2%) | 29 (2.5%) |
| 55 to 59 Years | 131 (12.9%) | 262 (22.4%) |
| 60 to 64 Years | 135 (13.3%) | 109 (9.3%) |
| 65 to 69 Years | 58 (5.7%) | 65 (5.6%) |
| 70 to 74 Years | 52 (5.1%) | 45 (3.8%) |
| 75 to 79 Years | 0 (0.0%) | 27 (2.3%) |
| 80 to 84 Years | 24 (2.4%) | 18 (1.5%) |
| 85 Years and over | 8 (0.8%) | 4 (0.3%) |
| Total | 1,012 (100.0%) | 1,171 (100.0%) |
Families and Households in Brownville
Median Family Size in Brownville
The median family size in Brownville is 2.88 persons per family, with married-couple families (297 | 57.1%) accounting for the largest median family size of 3.04 persons per family. On the other hand, single male/father families (47 | 9.0%) represent the smallest median family size with 2.13 persons per family.
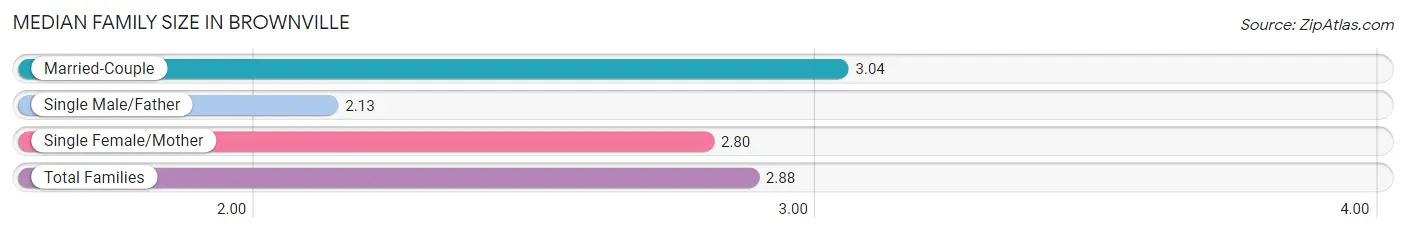
| Family Type | # Families | Family Size |
| Married-Couple | 297 (57.1%) | 3.04 |
| Single Male/Father | 47 (9.0%) | 2.13 |
| Single Female/Mother | 176 (33.9%) | 2.80 |
| Total Families | 520 (100.0%) | 2.88 |
Median Household Size in Brownville
The median household size in Brownville is 2.26 persons per household, with single male/father households (47 | 4.9%) accounting for the largest median household size of 3.83 persons per household. non-family households (444 | 46.1%) represent the smallest median household size with 1.25 persons per household.
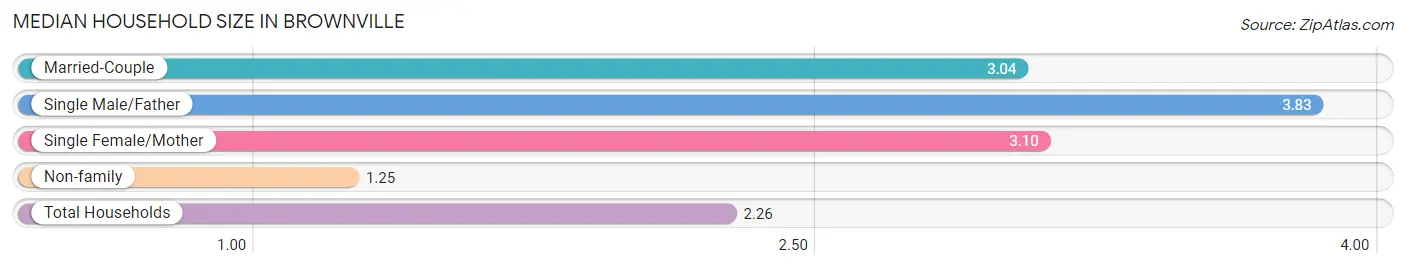
| Household Type | # Households | Household Size |
| Married-Couple | 297 (30.8%) | 3.04 |
| Single Male/Father | 47 (4.9%) | 3.83 |
| Single Female/Mother | 176 (18.3%) | 3.10 |
| Non-family | 444 (46.1%) | 1.25 |
| Total Households | 964 (100.0%) | 2.26 |
Household Size by Marriage Status in Brownville
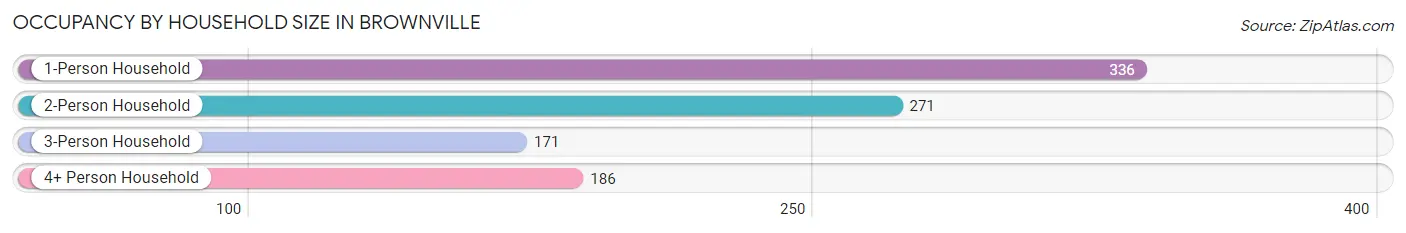
Out of a total of 964 households in Brownville, 520 (53.9%) are family households, while 444 (46.1%) are nonfamily households. The most numerous type of family households are 3-person households, comprising 171, and the most common type of nonfamily households are 1-person households, comprising 336.
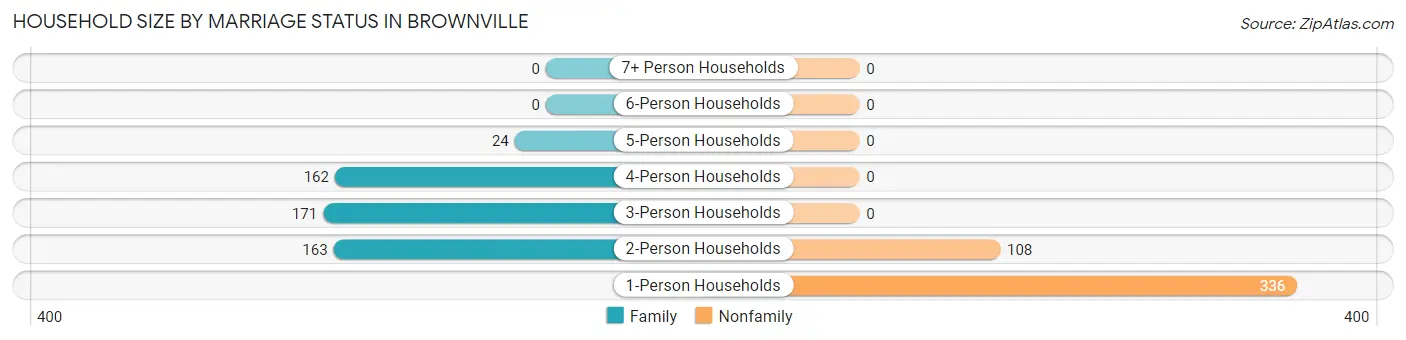
| Household Size | Family Households | Nonfamily Households |
| 1-Person Households | - | 336 (34.8%) |
| 2-Person Households | 163 (16.9%) | 108 (11.2%) |
| 3-Person Households | 171 (17.7%) | 0 (0.0%) |
| 4-Person Households | 162 (16.8%) | 0 (0.0%) |
| 5-Person Households | 24 (2.5%) | 0 (0.0%) |
| 6-Person Households | 0 (0.0%) | 0 (0.0%) |
| 7+ Person Households | 0 (0.0%) | 0 (0.0%) |
| Total | 520 (53.9%) | 444 (46.1%) |
Female Fertility in Brownville
Fertility by Age in Brownville
Average fertility rate in Brownville is 8.0 births per 1,000 women. Women in the age bracket of 20 to 34 years have the highest fertility rate with 15.0 births per 1,000 women. Women in the age bracket of 20 to 34 years acount for 100.0% of all women with births.
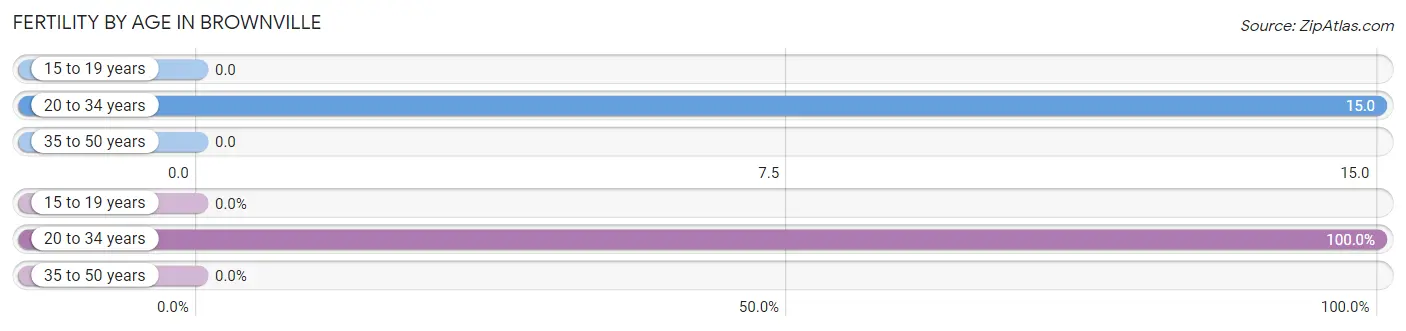
| Age Bracket | Women with Births | Births / 1,000 Women |
| 15 to 19 years | 0 (0.0%) | 0.0 |
| 20 to 34 years | 4 (100.0%) | 15.0 |
| 35 to 50 years | 0 (0.0%) | 0.0 |
| Total | 4 (100.0%) | 8.0 |
Fertility by Age by Marriage Status in Brownville
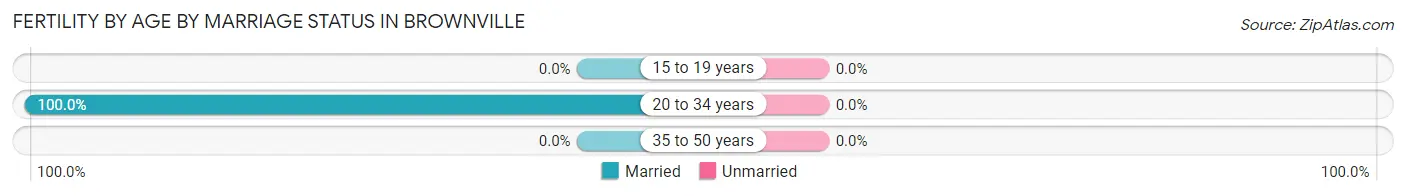
| Age Bracket | Married | Unmarried |
| 15 to 19 years | 0 (0.0%) | 0 (0.0%) |
| 20 to 34 years | 4 (100.0%) | 0 (0.0%) |
| 35 to 50 years | 0 (0.0%) | 0 (0.0%) |
| Total | 4 (100.0%) | 0 (0.0%) |
Fertility by Education in Brownville
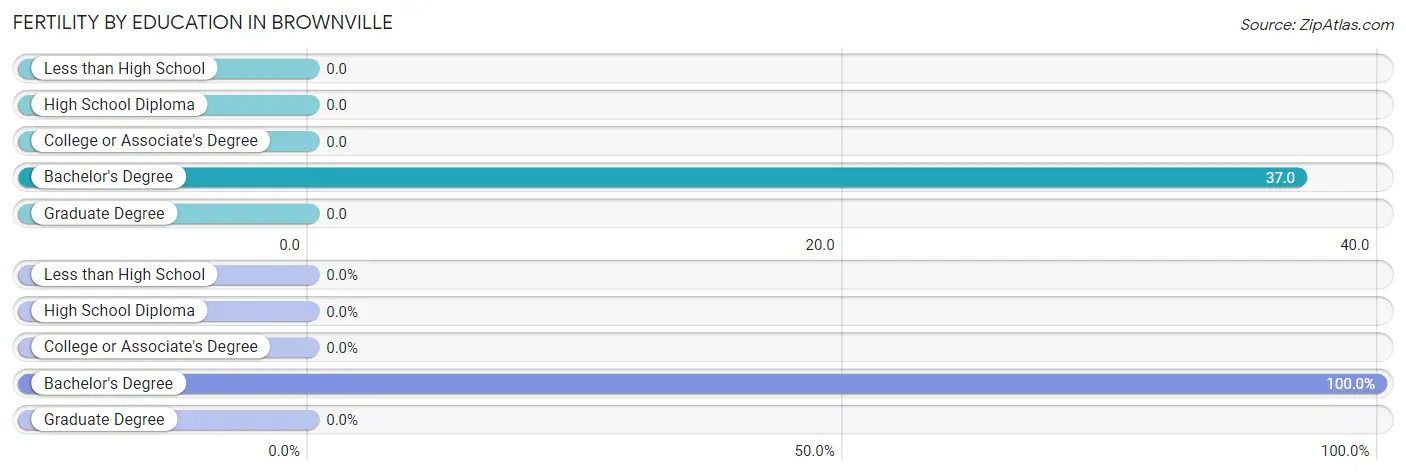
| Educational Attainment | Women with Births | Births / 1,000 Women |
| Less than High School | 0 (0.0%) | 0.0 |
| High School Diploma | 0 (0.0%) | 0.0 |
| College or Associate's Degree | 0 (0.0%) | 0.0 |
| Bachelor's Degree | 4 (100.0%) | 37.0 |
| Graduate Degree | 0 (0.0%) | 0.0 |
| Total | 4 (100.0%) | 8.0 |
Fertility by Education by Marriage Status in Brownville
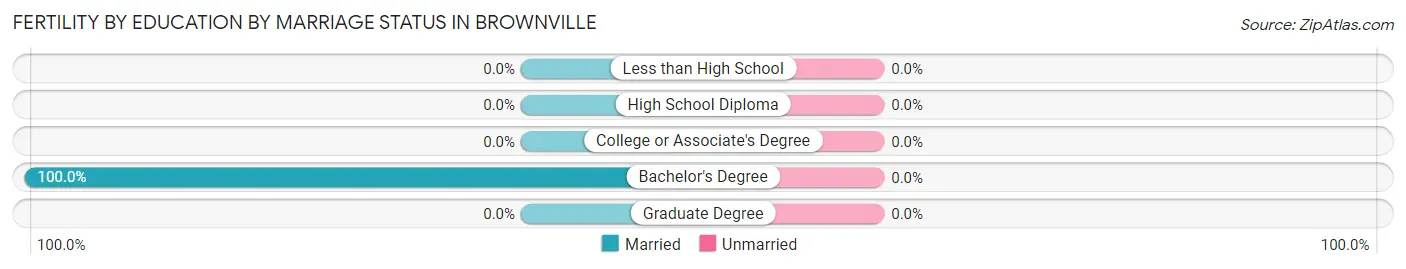
| Educational Attainment | Married | Unmarried |
| Less than High School | 0 (0.0%) | 0 (0.0%) |
| High School Diploma | 0 (0.0%) | 0 (0.0%) |
| College or Associate's Degree | 0 (0.0%) | 0 (0.0%) |
| Bachelor's Degree | 4 (100.0%) | 0 (0.0%) |
| Graduate Degree | 0 (0.0%) | 0 (0.0%) |
| Total | 4 (100.0%) | 0 (0.0%) |
Employment Characteristics in Brownville
Employment by Class of Employer in Brownville
Among the 1,448 employed individuals in Brownville, private company employees (1,133 | 78.2%), local government employees (111 | 7.7%), and not-for-profit organizations (80 | 5.5%) make up the most common classes of employment.
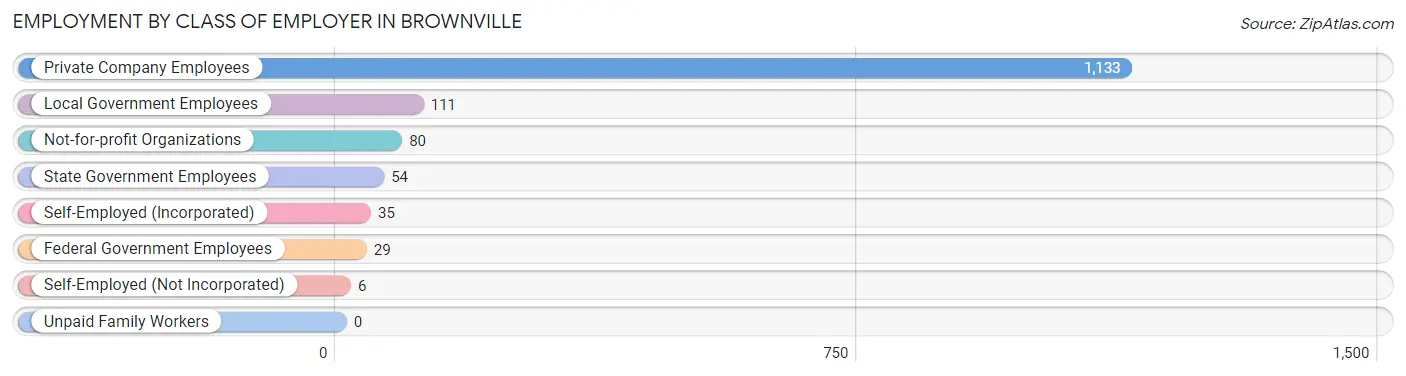
| Employer Class | # Employees | % Employees |
| Private Company Employees | 1,133 | 78.2% |
| Self-Employed (Incorporated) | 35 | 2.4% |
| Self-Employed (Not Incorporated) | 6 | 0.4% |
| Not-for-profit Organizations | 80 | 5.5% |
| Local Government Employees | 111 | 7.7% |
| State Government Employees | 54 | 3.7% |
| Federal Government Employees | 29 | 2.0% |
| Unpaid Family Workers | 0 | 0.0% |
| Total | 1,448 | 100.0% |
Employment Status by Age in Brownville
According to the labor force statistics for Brownville, out of the total population over 16 years of age (1,916), 80.9% or 1,550 individuals are in the labor force, with 5.3% or 82 of them unemployed. The age group with the highest labor force participation rate is 25 to 29 years, with 100.0% or 154 individuals in the labor force. Within the labor force, the 25 to 29 years age range has the highest percentage of unemployed individuals, with 19.5% or 30 of them being unemployed.
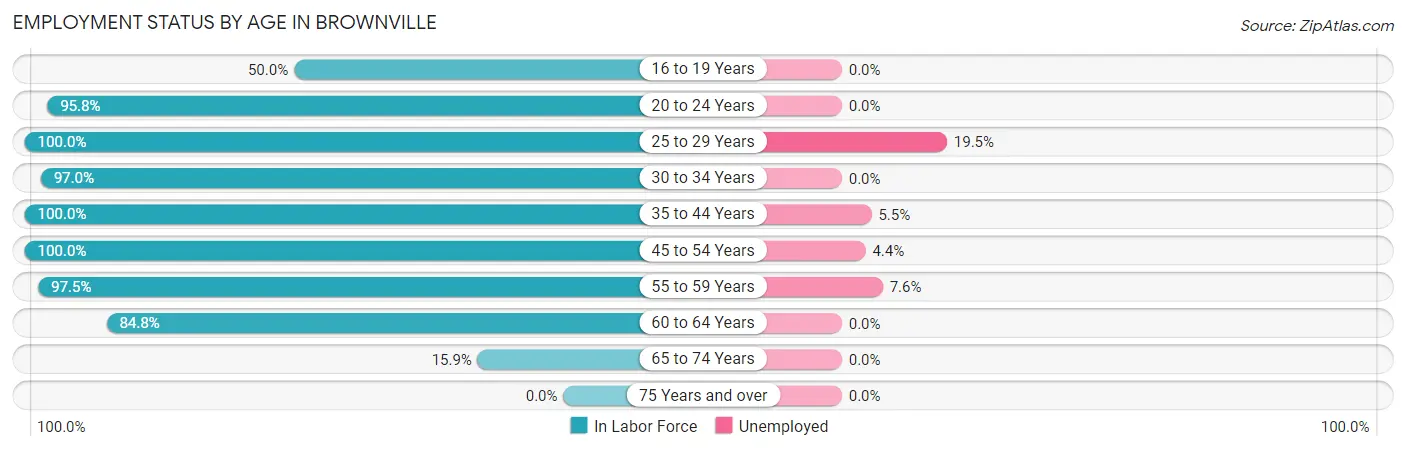
| Age Bracket | In Labor Force | Unemployed |
| 16 to 19 Years | 43 (50.0%) | 0 (0.0%) |
| 20 to 24 Years | 113 (95.8%) | 0 (0.0%) |
| 25 to 29 Years | 154 (100.0%) | 30 (19.5%) |
| 30 to 34 Years | 160 (97.0%) | 0 (0.0%) |
| 35 to 44 Years | 275 (100.0%) | 15 (5.5%) |
| 45 to 54 Years | 180 (100.0%) | 8 (4.4%) |
| 55 to 59 Years | 383 (97.5%) | 29 (7.6%) |
| 60 to 64 Years | 207 (84.8%) | 0 (0.0%) |
| 65 to 74 Years | 35 (15.9%) | 0 (0.0%) |
| 75 Years and over | 0 (0.0%) | 0 (0.0%) |
| Total | 1,550 (80.9%) | 82 (5.3%) |
Employment Status by Educational Attainment in Brownville
According to labor force statistics for Brownville, 96.3% of individuals (1,359) out of the total population between 25 and 64 years of age (1,411) are in the labor force, with 6.0% or 82 of them being unemployed. The group with the highest labor force participation rate are those with the educational attainment of less than high school, with 100.0% or 21 individuals in the labor force. Within the labor force, individuals with college / associate degree education have the highest percentage of unemployment, with 13.3% or 64 of them being unemployed.
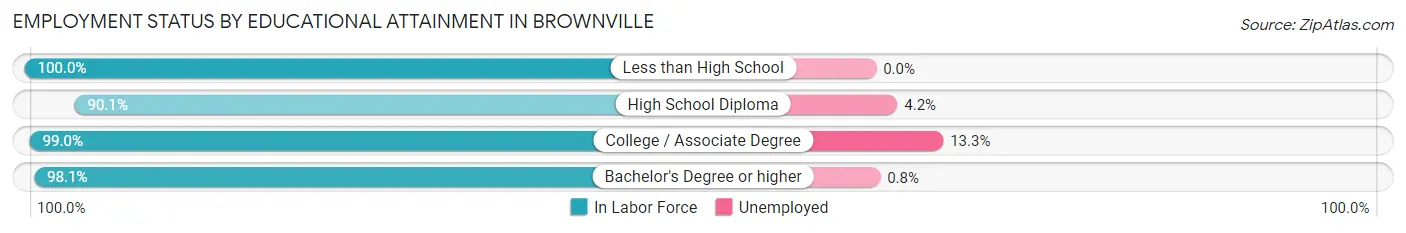
| Educational Attainment | In Labor Force | Unemployed |
| Less than High School | 21 (100.0%) | 0 (0.0%) |
| High School Diploma | 337 (90.1%) | 16 (4.2%) |
| College / Associate Degree | 480 (99.0%) | 65 (13.3%) |
| Bachelor's Degree or higher | 521 (98.1%) | 4 (0.8%) |
| Total | 1,359 (96.3%) | 85 (6.0%) |
Employment Occupations by Sex in Brownville
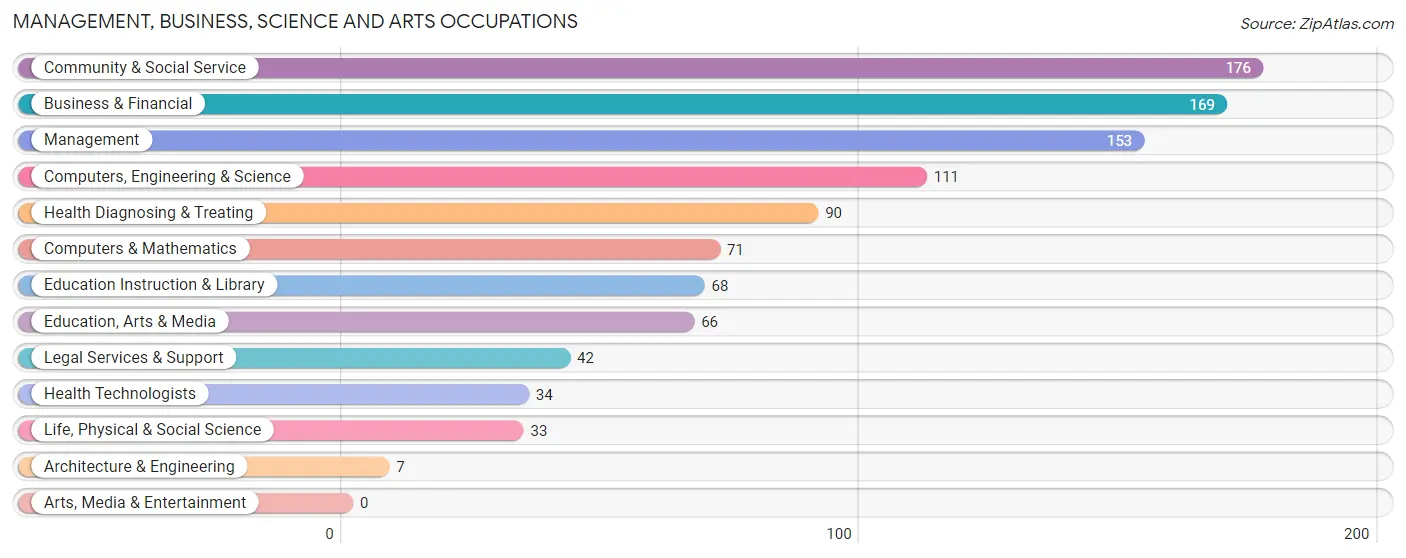
Management, Business, Science and Arts Occupations
The most common Management, Business, Science and Arts occupations in Brownville are Community & Social Service (176 | 12.0%), Business & Financial (169 | 11.5%), Management (153 | 10.4%), Computers, Engineering & Science (111 | 7.6%), and Health Diagnosing & Treating (90 | 6.1%).
Management, Business, Science and Arts Occupations by Sex
Within the Management, Business, Science and Arts occupations in Brownville, the most male-oriented occupations are Architecture & Engineering (100.0%), Life, Physical & Social Science (100.0%), and Computers, Engineering & Science (70.3%), while the most female-oriented occupations are Education, Arts & Media (100.0%), Health Technologists (100.0%), and Education Instruction & Library (94.1%).
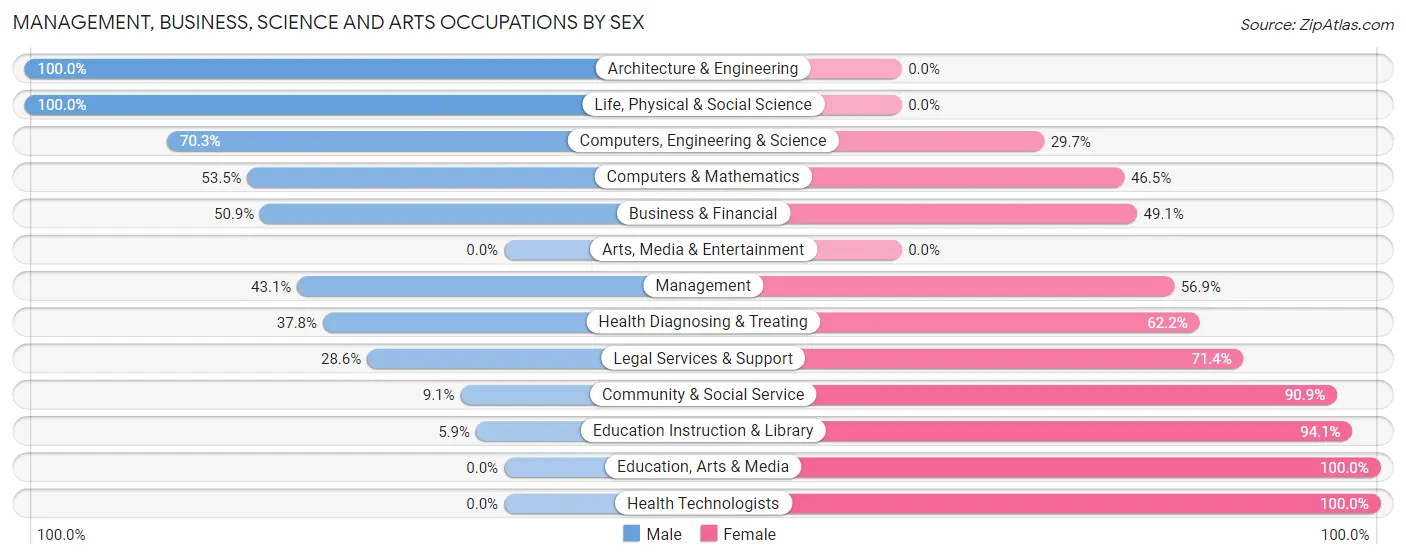
| Occupation | Male | Female |
| Management | 66 (43.1%) | 87 (56.9%) |
| Business & Financial | 86 (50.9%) | 83 (49.1%) |
| Computers, Engineering & Science | 78 (70.3%) | 33 (29.7%) |
| Computers & Mathematics | 38 (53.5%) | 33 (46.5%) |
| Architecture & Engineering | 7 (100.0%) | 0 (0.0%) |
| Life, Physical & Social Science | 33 (100.0%) | 0 (0.0%) |
| Community & Social Service | 16 (9.1%) | 160 (90.9%) |
| Education, Arts & Media | 0 (0.0%) | 66 (100.0%) |
| Legal Services & Support | 12 (28.6%) | 30 (71.4%) |
| Education Instruction & Library | 4 (5.9%) | 64 (94.1%) |
| Arts, Media & Entertainment | 0 (0.0%) | 0 (0.0%) |
| Health Diagnosing & Treating | 34 (37.8%) | 56 (62.2%) |
| Health Technologists | 0 (0.0%) | 34 (100.0%) |
| Total (Category) | 280 (40.1%) | 419 (59.9%) |
| Total (Overall) | 686 (46.7%) | 782 (53.3%) |
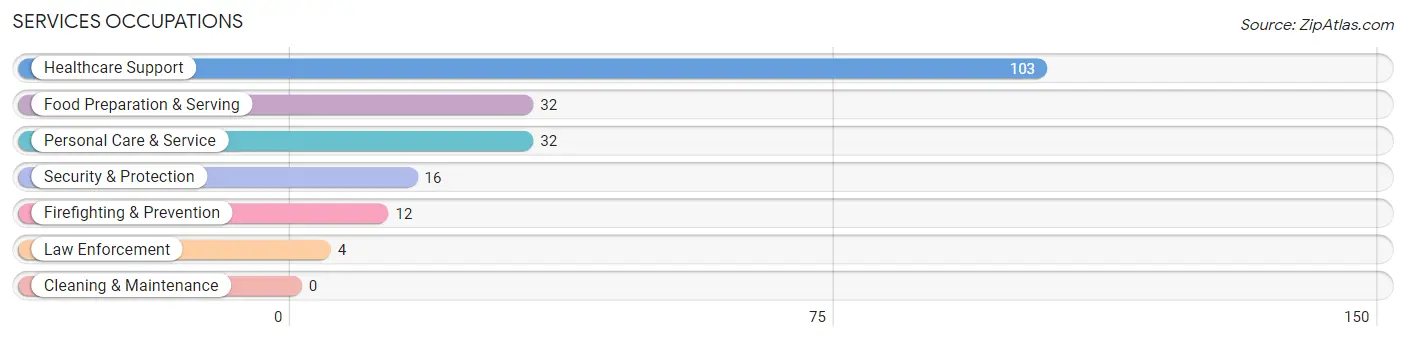
Services Occupations
The most common Services occupations in Brownville are Healthcare Support (103 | 7.0%), Food Preparation & Serving (32 | 2.2%), Personal Care & Service (32 | 2.2%), Security & Protection (16 | 1.1%), and Firefighting & Prevention (12 | 0.8%).
Services Occupations by Sex
Within the Services occupations in Brownville, the most male-oriented occupations are Security & Protection (100.0%), Firefighting & Prevention (100.0%), and Law Enforcement (100.0%), while the most female-oriented occupations are Personal Care & Service (100.0%), Healthcare Support (90.3%), and Food Preparation & Serving (25.0%).
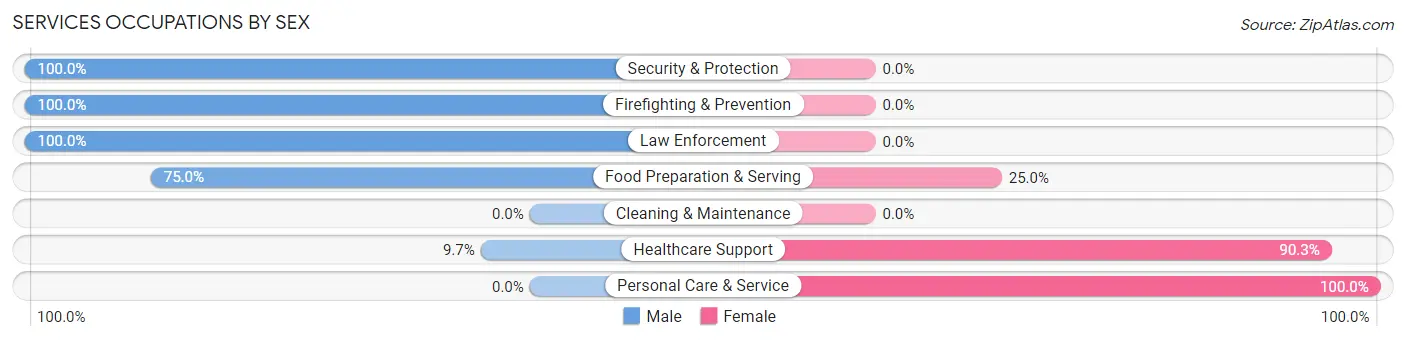
| Occupation | Male | Female |
| Healthcare Support | 10 (9.7%) | 93 (90.3%) |
| Security & Protection | 16 (100.0%) | 0 (0.0%) |
| Firefighting & Prevention | 12 (100.0%) | 0 (0.0%) |
| Law Enforcement | 4 (100.0%) | 0 (0.0%) |
| Food Preparation & Serving | 24 (75.0%) | 8 (25.0%) |
| Cleaning & Maintenance | 0 (0.0%) | 0 (0.0%) |
| Personal Care & Service | 0 (0.0%) | 32 (100.0%) |
| Total (Category) | 50 (27.3%) | 133 (72.7%) |
| Total (Overall) | 686 (46.7%) | 782 (53.3%) |
Sales and Office Occupations
The most common Sales and Office occupations in Brownville are Office & Administration (143 | 9.7%), and Sales & Related (114 | 7.8%).
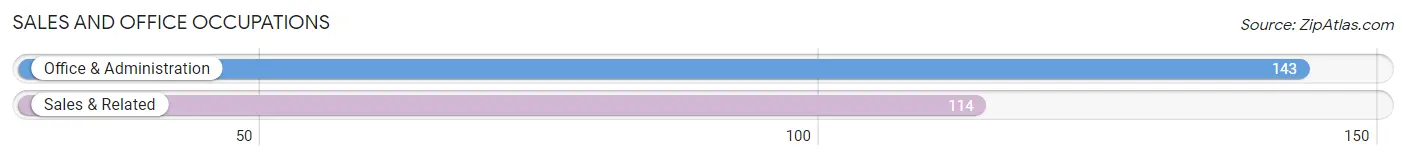
Sales and Office Occupations by Sex
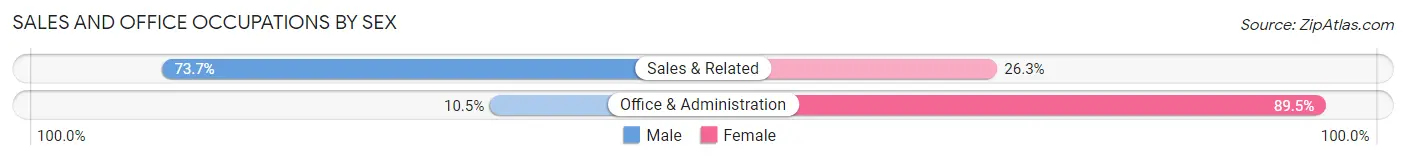
| Occupation | Male | Female |
| Sales & Related | 84 (73.7%) | 30 (26.3%) |
| Office & Administration | 15 (10.5%) | 128 (89.5%) |
| Total (Category) | 99 (38.5%) | 158 (61.5%) |
| Total (Overall) | 686 (46.7%) | 782 (53.3%) |
Natural Resources, Construction and Maintenance Occupations
The most common Natural Resources, Construction and Maintenance occupations in Brownville are Construction & Extraction (103 | 7.0%), and Installation, Maintenance & Repair (51 | 3.5%).
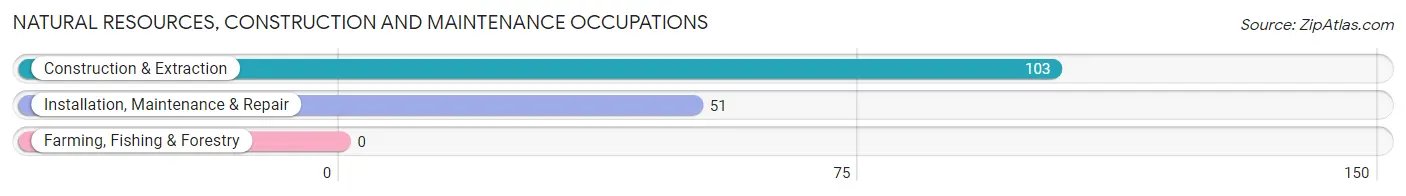
Natural Resources, Construction and Maintenance Occupations by Sex
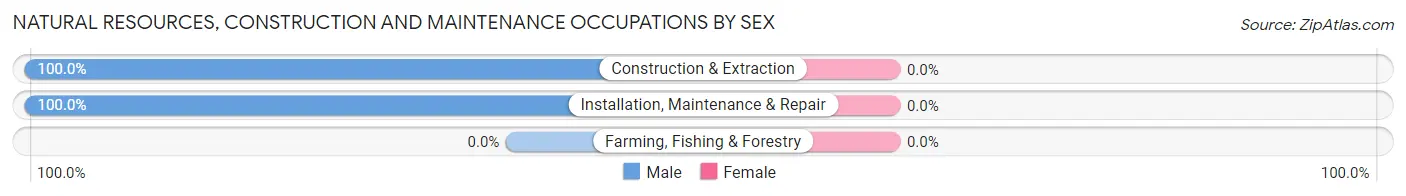
| Occupation | Male | Female |
| Farming, Fishing & Forestry | 0 (0.0%) | 0 (0.0%) |
| Construction & Extraction | 103 (100.0%) | 0 (0.0%) |
| Installation, Maintenance & Repair | 51 (100.0%) | 0 (0.0%) |
| Total (Category) | 154 (100.0%) | 0 (0.0%) |
| Total (Overall) | 686 (46.7%) | 782 (53.3%) |
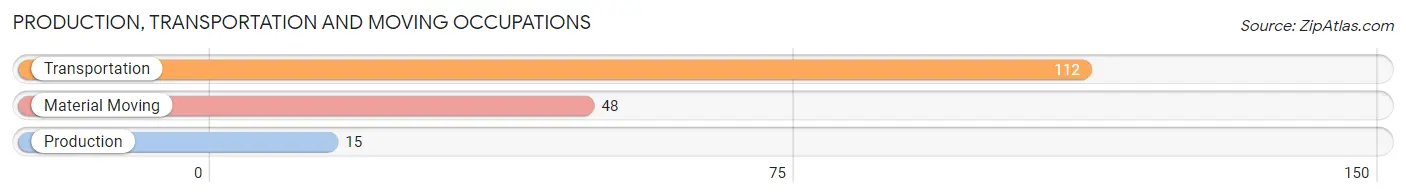
Production, Transportation and Moving Occupations
The most common Production, Transportation and Moving occupations in Brownville are Transportation (112 | 7.6%), Material Moving (48 | 3.3%), and Production (15 | 1.0%).
Production, Transportation and Moving Occupations by Sex
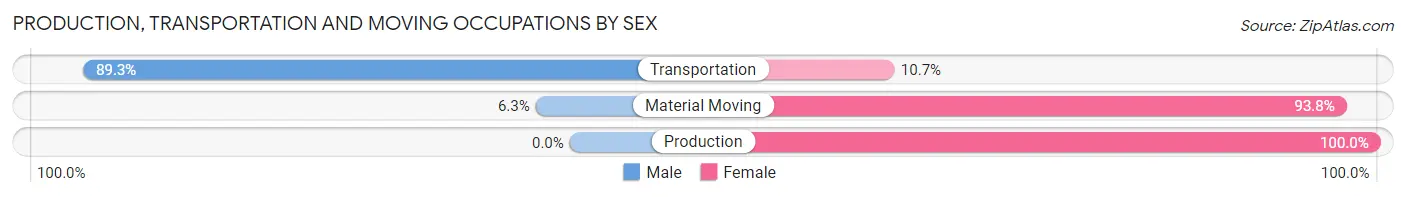
| Occupation | Male | Female |
| Production | 0 (0.0%) | 15 (100.0%) |
| Transportation | 100 (89.3%) | 12 (10.7%) |
| Material Moving | 3 (6.2%) | 45 (93.8%) |
| Total (Category) | 103 (58.9%) | 72 (41.1%) |
| Total (Overall) | 686 (46.7%) | 782 (53.3%) |
Employment Industries by Sex in Brownville
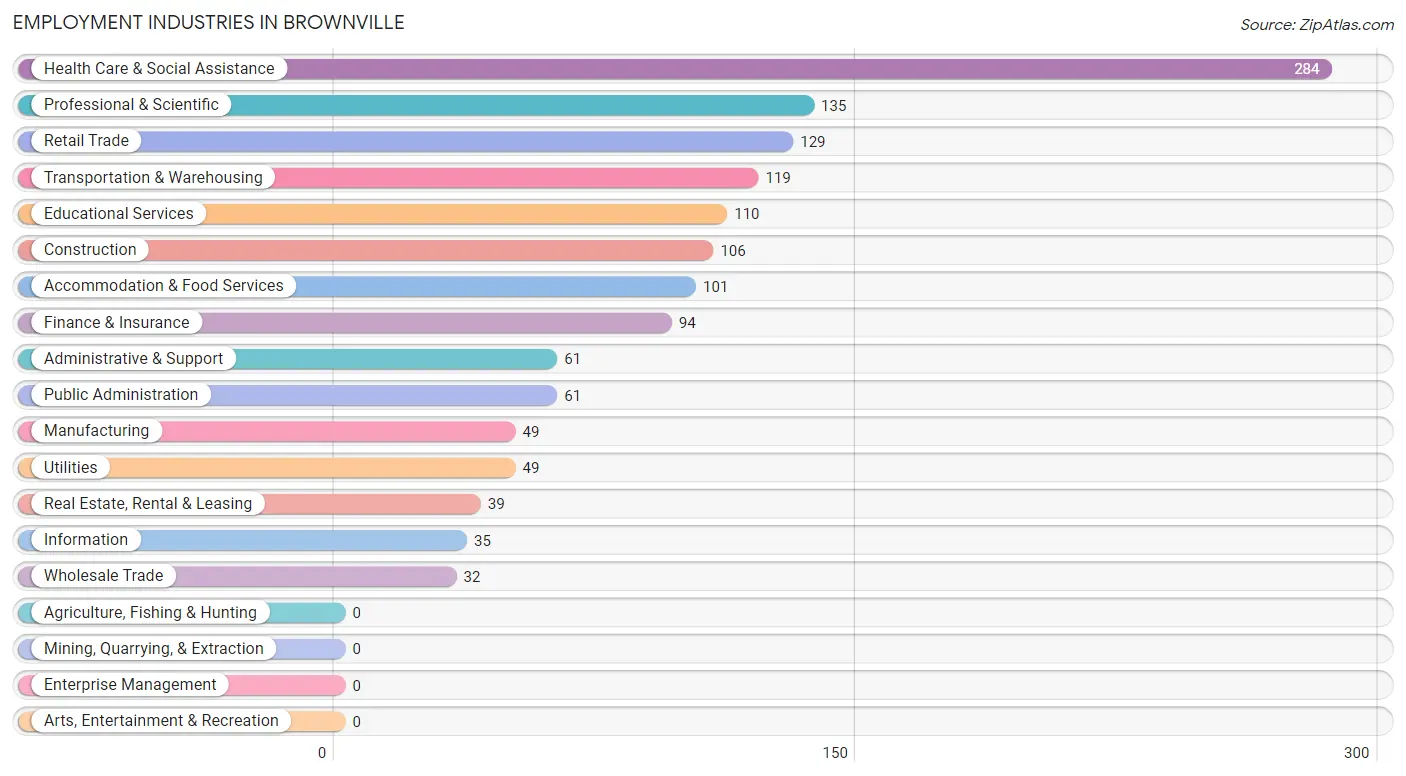
Employment Industries in Brownville
The major employment industries in Brownville include Health Care & Social Assistance (284 | 19.4%), Professional & Scientific (135 | 9.2%), Retail Trade (129 | 8.8%), Transportation & Warehousing (119 | 8.1%), and Educational Services (110 | 7.5%).
Employment Industries by Sex in Brownville
The Brownville industries that see more men than women are Utilities (100.0%), Finance & Insurance (94.7%), and Construction (92.4%), whereas the industries that tend to have a higher number of women are Information (100.0%), Educational Services (96.4%), and Administrative & Support (93.4%).
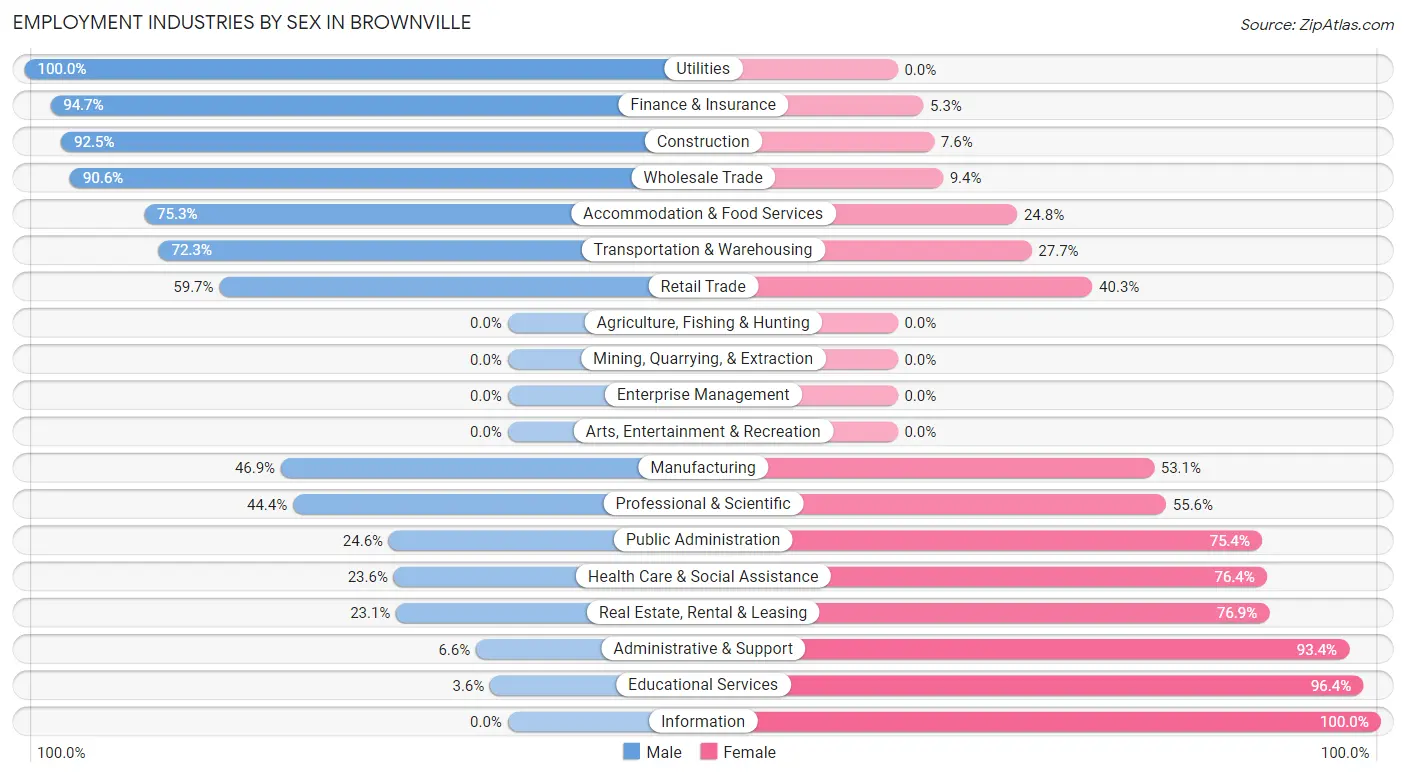
| Industry | Male | Female |
| Agriculture, Fishing & Hunting | 0 (0.0%) | 0 (0.0%) |
| Mining, Quarrying, & Extraction | 0 (0.0%) | 0 (0.0%) |
| Construction | 98 (92.4%) | 8 (7.5%) |
| Manufacturing | 23 (46.9%) | 26 (53.1%) |
| Wholesale Trade | 29 (90.6%) | 3 (9.4%) |
| Retail Trade | 77 (59.7%) | 52 (40.3%) |
| Transportation & Warehousing | 86 (72.3%) | 33 (27.7%) |
| Utilities | 49 (100.0%) | 0 (0.0%) |
| Information | 0 (0.0%) | 35 (100.0%) |
| Finance & Insurance | 89 (94.7%) | 5 (5.3%) |
| Real Estate, Rental & Leasing | 9 (23.1%) | 30 (76.9%) |
| Professional & Scientific | 60 (44.4%) | 75 (55.6%) |
| Enterprise Management | 0 (0.0%) | 0 (0.0%) |
| Administrative & Support | 4 (6.6%) | 57 (93.4%) |
| Educational Services | 4 (3.6%) | 106 (96.4%) |
| Health Care & Social Assistance | 67 (23.6%) | 217 (76.4%) |
| Arts, Entertainment & Recreation | 0 (0.0%) | 0 (0.0%) |
| Accommodation & Food Services | 76 (75.2%) | 25 (24.7%) |
| Public Administration | 15 (24.6%) | 46 (75.4%) |
| Total | 686 (46.7%) | 782 (53.3%) |
Education in Brownville
School Enrollment in Brownville
The most common levels of schooling among the 389 students in Brownville are high school (96 | 24.7%), college / undergraduate (87 | 22.4%), and middle school (62 | 15.9%).
| School Level | # Students | % Students |
| Nursery / Preschool | 44 | 11.3% |
| Kindergarten | 51 | 13.1% |
| Elementary School | 15 | 3.9% |
| Middle School | 62 | 15.9% |
| High School | 96 | 24.7% |
| College / Undergraduate | 87 | 22.4% |
| Graduate / Professional | 34 | 8.7% |
| Total | 389 | 100.0% |
School Enrollment by Age by Funding Source in Brownville
Out of a total of 389 students who are enrolled in schools in Brownville, 177 (45.5%) attend a private institution, while the remaining 212 (54.5%) are enrolled in public schools. The age group of 3 to 4 year olds has the highest likelihood of being enrolled in private schools, with 35 (100.0% in the age bracket) enrolled. Conversely, the age group of 10 to 14 year olds has the lowest likelihood of being enrolled in a private school, with 62 (100.0% in the age bracket) attending a public institution.
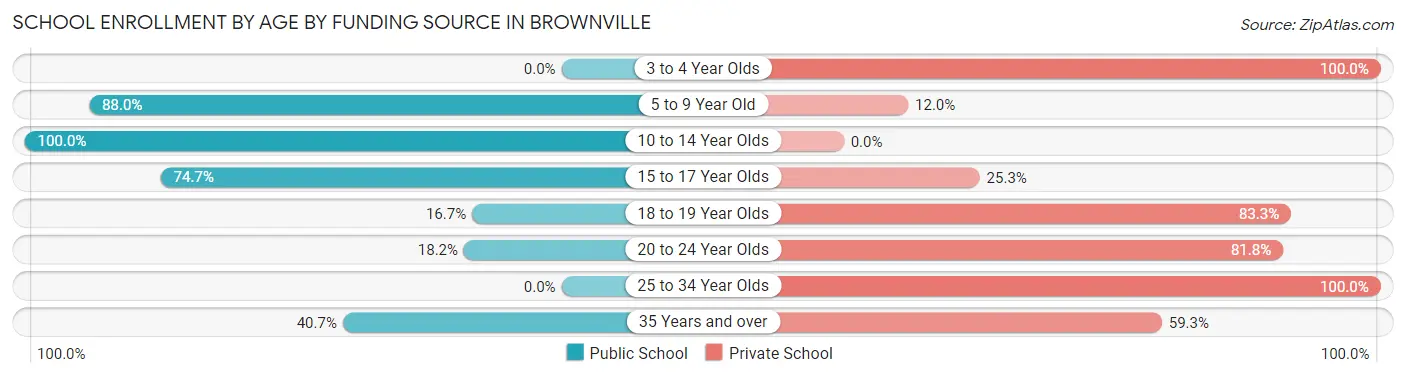
| Age Bracket | Public School | Private School |
| 3 to 4 Year Olds | 0 (0.0%) | 35 (100.0%) |
| 5 to 9 Year Old | 66 (88.0%) | 9 (12.0%) |
| 10 to 14 Year Olds | 62 (100.0%) | 0 (0.0%) |
| 15 to 17 Year Olds | 56 (74.7%) | 19 (25.3%) |
| 18 to 19 Year Olds | 7 (16.7%) | 35 (83.3%) |
| 20 to 24 Year Olds | 10 (18.2%) | 45 (81.8%) |
| 25 to 34 Year Olds | 0 (0.0%) | 18 (100.0%) |
| 35 Years and over | 11 (40.7%) | 16 (59.3%) |
| Total | 212 (54.5%) | 177 (45.5%) |
Educational Attainment by Field of Study in Brownville
Business (186 | 27.8%), education (154 | 23.0%), engineering (77 | 11.5%), psychology (59 | 8.8%), and science & technology (47 | 7.0%) are the most common fields of study among 669 individuals in Brownville who have obtained a bachelor's degree or higher.
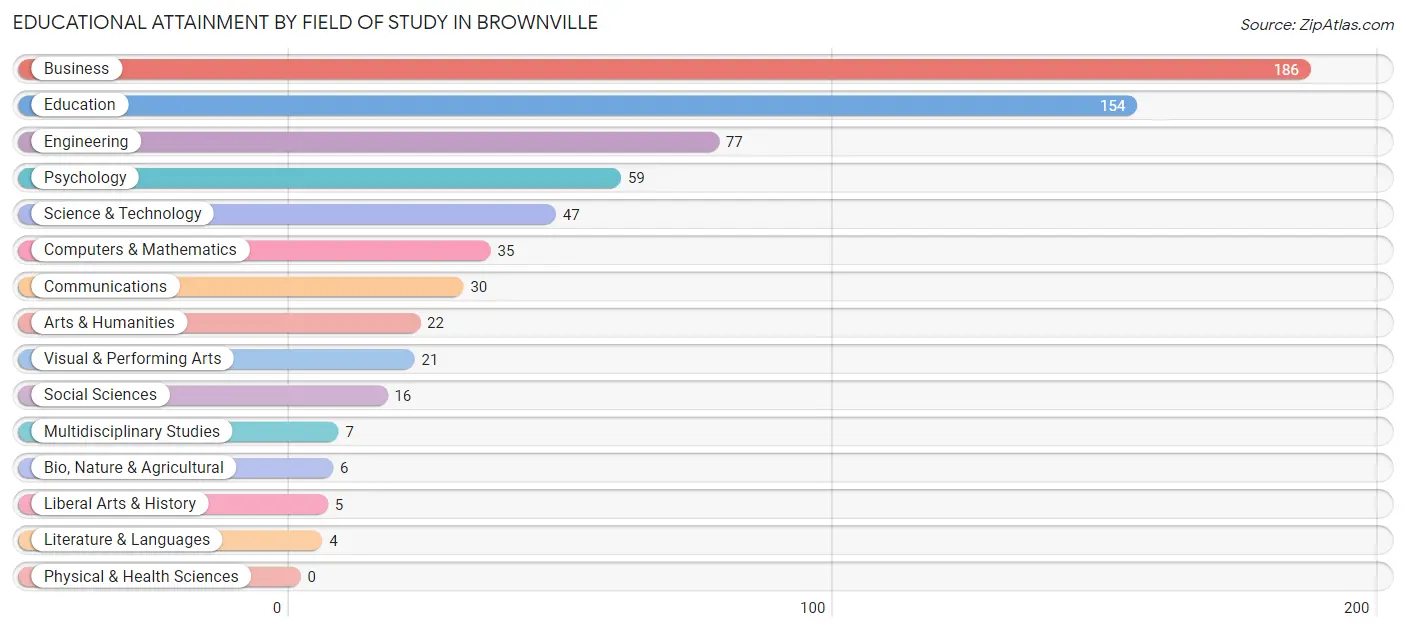
| Field of Study | # Graduates | % Graduates |
| Computers & Mathematics | 35 | 5.2% |
| Bio, Nature & Agricultural | 6 | 0.9% |
| Physical & Health Sciences | 0 | 0.0% |
| Psychology | 59 | 8.8% |
| Social Sciences | 16 | 2.4% |
| Engineering | 77 | 11.5% |
| Multidisciplinary Studies | 7 | 1.1% |
| Science & Technology | 47 | 7.0% |
| Business | 186 | 27.8% |
| Education | 154 | 23.0% |
| Literature & Languages | 4 | 0.6% |
| Liberal Arts & History | 5 | 0.7% |
| Visual & Performing Arts | 21 | 3.1% |
| Communications | 30 | 4.5% |
| Arts & Humanities | 22 | 3.3% |
| Total | 669 | 100.0% |
Transportation & Commute in Brownville
Vehicle Availability by Sex in Brownville
The most prevalent vehicle ownership categories in Brownville are males with 2 vehicles (323, accounting for 47.4%) and females with 2 vehicles (350, making up 42.2%).
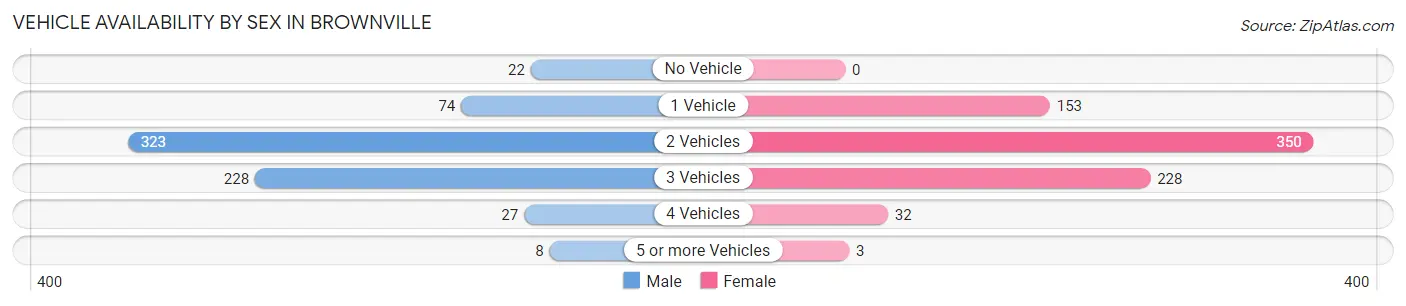
| Vehicles Available | Male | Female |
| No Vehicle | 22 (3.2%) | 0 (0.0%) |
| 1 Vehicle | 74 (10.8%) | 153 (20.0%) |
| 2 Vehicles | 323 (47.4%) | 350 (45.7%) |
| 3 Vehicles | 228 (33.4%) | 228 (29.8%) |
| 4 Vehicles | 27 (4.0%) | 32 (4.2%) |
| 5 or more Vehicles | 8 (1.2%) | 3 (0.4%) |
| Total | 682 (100.0%) | 766 (100.0%) |
Commute Time in Brownville
The most frequently occuring commute durations in Brownville are 60 to 89 minutes (247 commuters, 20.6%), 30 to 34 minutes (224 commuters, 18.7%), and 45 to 59 minutes (169 commuters, 14.1%).
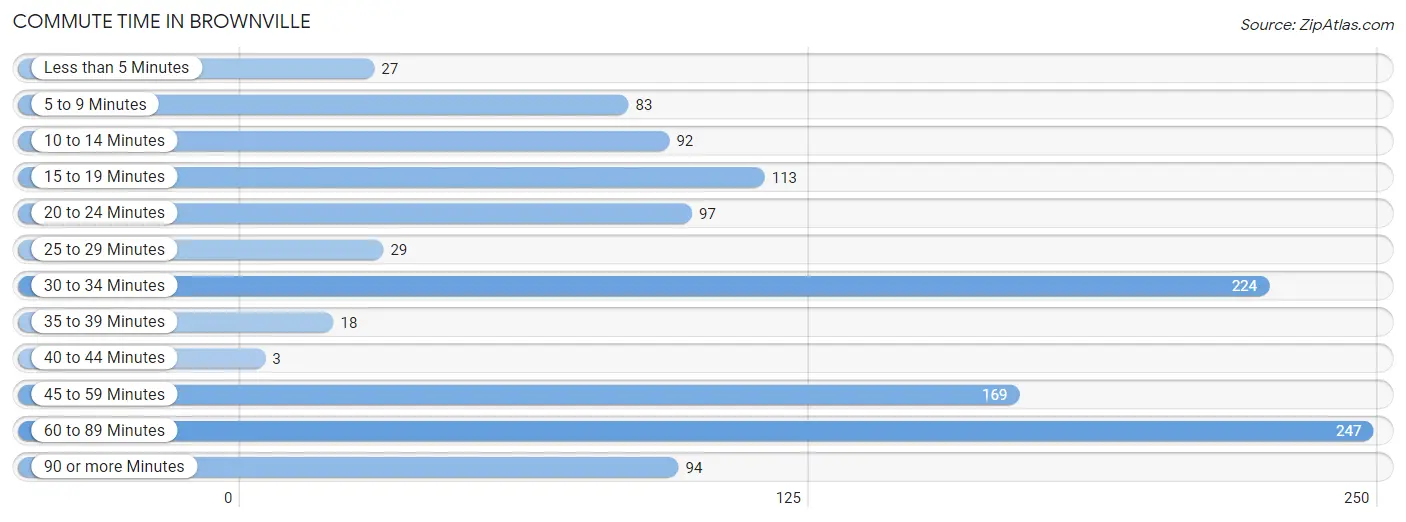
| Commute Time | # Commuters | % Commuters |
| Less than 5 Minutes | 27 | 2.3% |
| 5 to 9 Minutes | 83 | 6.9% |
| 10 to 14 Minutes | 92 | 7.7% |
| 15 to 19 Minutes | 113 | 9.5% |
| 20 to 24 Minutes | 97 | 8.1% |
| 25 to 29 Minutes | 29 | 2.4% |
| 30 to 34 Minutes | 224 | 18.7% |
| 35 to 39 Minutes | 18 | 1.5% |
| 40 to 44 Minutes | 3 | 0.3% |
| 45 to 59 Minutes | 169 | 14.1% |
| 60 to 89 Minutes | 247 | 20.6% |
| 90 or more Minutes | 94 | 7.9% |
Commute Time by Sex in Brownville
The most common commute times in Brownville are 60 to 89 minutes (211 commuters, 34.7%) for males and 30 to 34 minutes (111 commuters, 18.9%) for females.
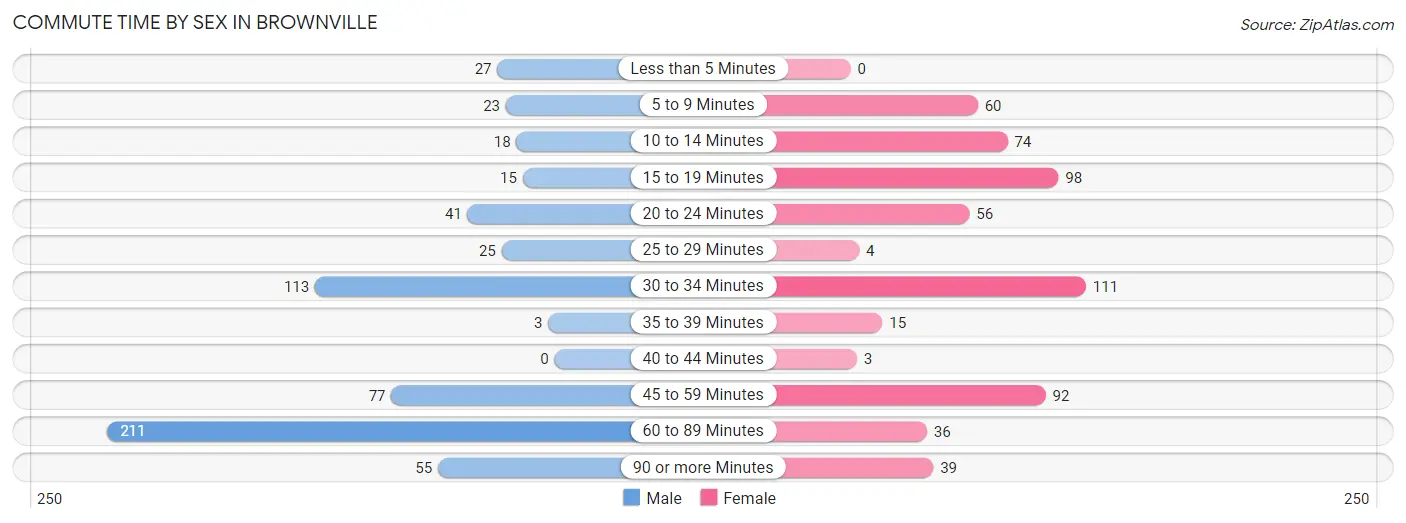
| Commute Time | Male | Female |
| Less than 5 Minutes | 27 (4.4%) | 0 (0.0%) |
| 5 to 9 Minutes | 23 (3.8%) | 60 (10.2%) |
| 10 to 14 Minutes | 18 (3.0%) | 74 (12.6%) |
| 15 to 19 Minutes | 15 (2.5%) | 98 (16.7%) |
| 20 to 24 Minutes | 41 (6.7%) | 56 (9.5%) |
| 25 to 29 Minutes | 25 (4.1%) | 4 (0.7%) |
| 30 to 34 Minutes | 113 (18.6%) | 111 (18.9%) |
| 35 to 39 Minutes | 3 (0.5%) | 15 (2.5%) |
| 40 to 44 Minutes | 0 (0.0%) | 3 (0.5%) |
| 45 to 59 Minutes | 77 (12.7%) | 92 (15.7%) |
| 60 to 89 Minutes | 211 (34.7%) | 36 (6.1%) |
| 90 or more Minutes | 55 (9.0%) | 39 (6.6%) |
Time of Departure to Work by Sex in Brownville
The most frequent times of departure to work in Brownville are 7:00 AM to 7:29 AM (121, 19.9%) for males and 7:30 AM to 7:59 AM (113, 19.2%) for females.
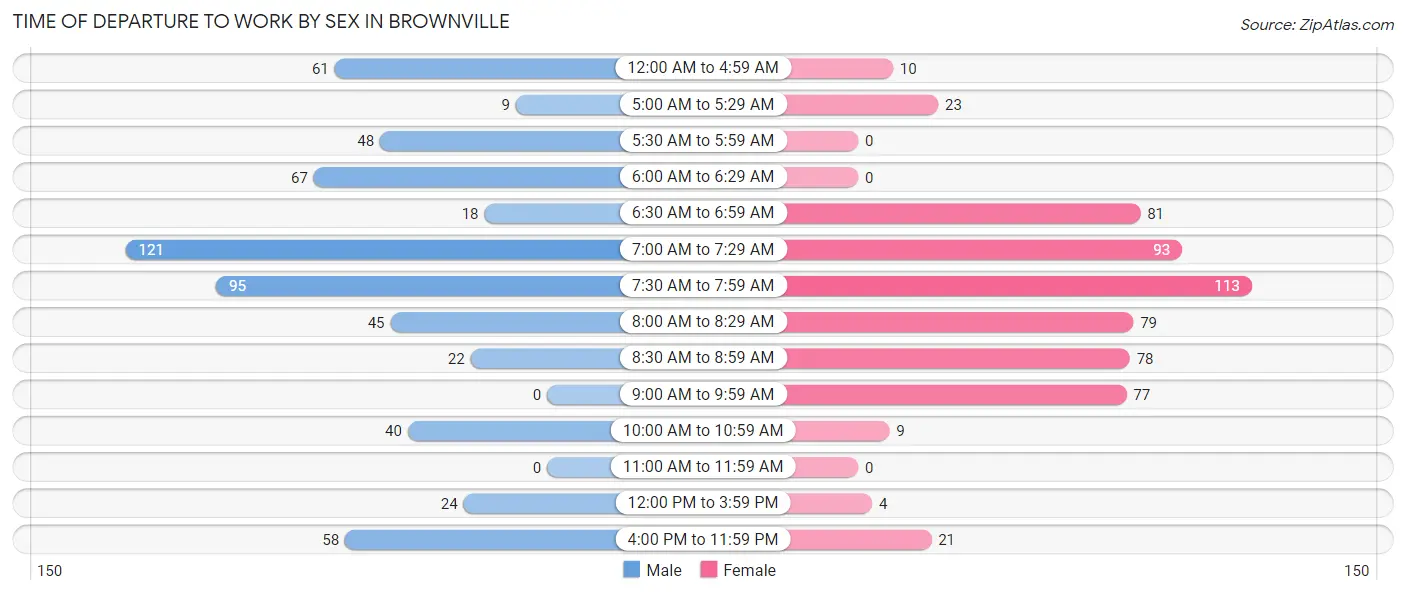
| Time of Departure | Male | Female |
| 12:00 AM to 4:59 AM | 61 (10.0%) | 10 (1.7%) |
| 5:00 AM to 5:29 AM | 9 (1.5%) | 23 (3.9%) |
| 5:30 AM to 5:59 AM | 48 (7.9%) | 0 (0.0%) |
| 6:00 AM to 6:29 AM | 67 (11.0%) | 0 (0.0%) |
| 6:30 AM to 6:59 AM | 18 (3.0%) | 81 (13.8%) |
| 7:00 AM to 7:29 AM | 121 (19.9%) | 93 (15.8%) |
| 7:30 AM to 7:59 AM | 95 (15.6%) | 113 (19.2%) |
| 8:00 AM to 8:29 AM | 45 (7.4%) | 79 (13.4%) |
| 8:30 AM to 8:59 AM | 22 (3.6%) | 78 (13.3%) |
| 9:00 AM to 9:59 AM | 0 (0.0%) | 77 (13.1%) |
| 10:00 AM to 10:59 AM | 40 (6.6%) | 9 (1.5%) |
| 11:00 AM to 11:59 AM | 0 (0.0%) | 0 (0.0%) |
| 12:00 PM to 3:59 PM | 24 (4.0%) | 4 (0.7%) |
| 4:00 PM to 11:59 PM | 58 (9.5%) | 21 (3.6%) |
| Total | 608 (100.0%) | 588 (100.0%) |
Housing Occupancy in Brownville
Occupancy by Ownership in Brownville
Of the total 964 dwellings in Brownville, owner-occupied units account for 841 (87.2%), while renter-occupied units make up 123 (12.8%).
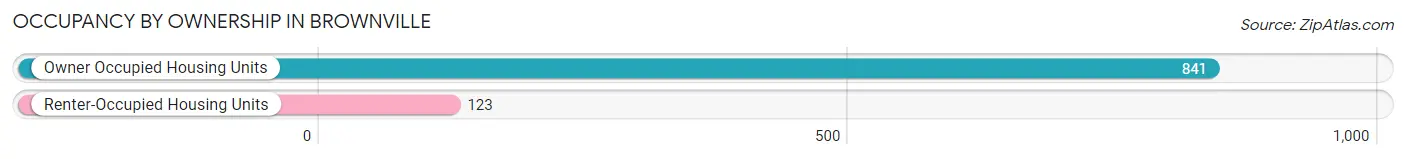
| Occupancy | # Housing Units | % Housing Units |
| Owner Occupied Housing Units | 841 | 87.2% |
| Renter-Occupied Housing Units | 123 | 12.8% |
| Total Occupied Housing Units | 964 | 100.0% |
Occupancy by Household Size in Brownville
| Household Size | # Housing Units | % Housing Units |
| 1-Person Household | 336 | 34.8% |
| 2-Person Household | 271 | 28.1% |
| 3-Person Household | 171 | 17.7% |
| 4+ Person Household | 186 | 19.3% |
| Total Housing Units | 964 | 100.0% |
Occupancy by Ownership by Household Size in Brownville
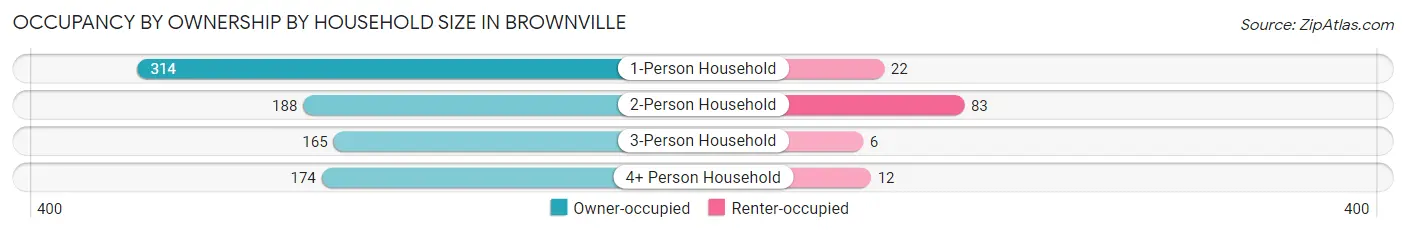
| Household Size | Owner-occupied | Renter-occupied |
| 1-Person Household | 314 (93.4%) | 22 (6.6%) |
| 2-Person Household | 188 (69.4%) | 83 (30.6%) |
| 3-Person Household | 165 (96.5%) | 6 (3.5%) |
| 4+ Person Household | 174 (93.5%) | 12 (6.5%) |
| Total Housing Units | 841 (87.2%) | 123 (12.8%) |
Occupancy by Educational Attainment in Brownville
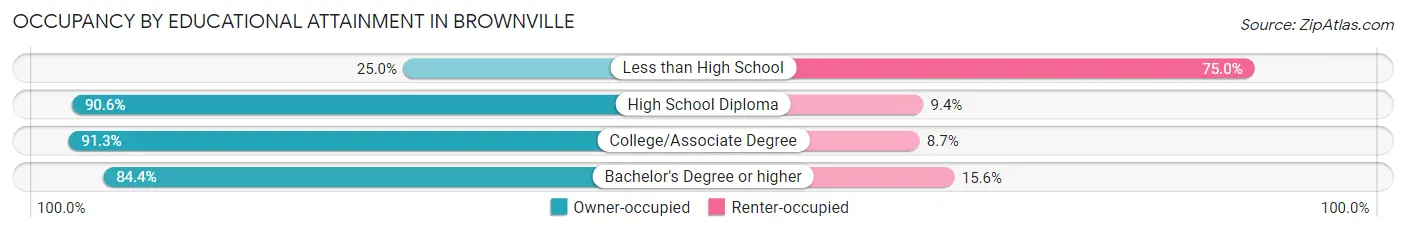
| Household Size | Owner-occupied | Renter-occupied |
| Less than High School | 4 (25.0%) | 12 (75.0%) |
| High School Diploma | 212 (90.6%) | 22 (9.4%) |
| College/Associate Degree | 295 (91.3%) | 28 (8.7%) |
| Bachelor's Degree or higher | 330 (84.4%) | 61 (15.6%) |
Occupancy by Age of Householder in Brownville
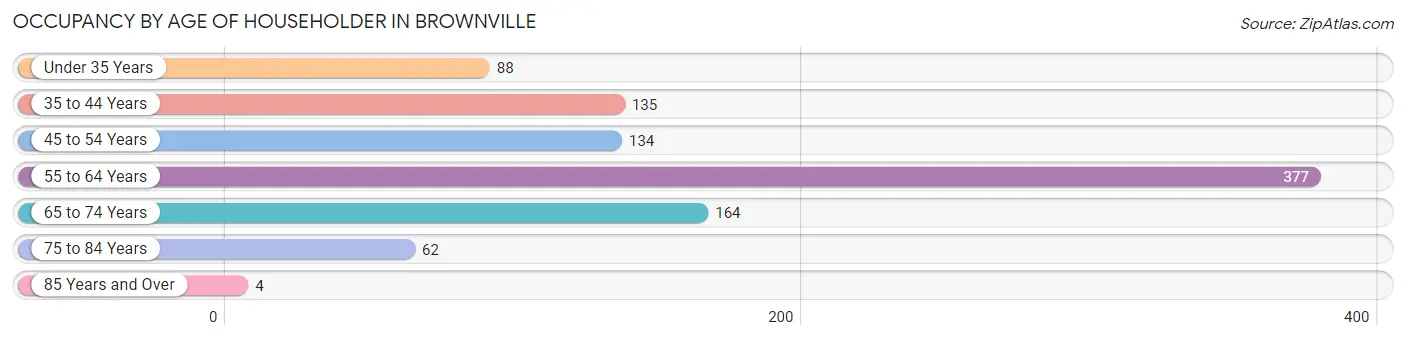
| Age Bracket | # Households | % Households |
| Under 35 Years | 88 | 9.1% |
| 35 to 44 Years | 135 | 14.0% |
| 45 to 54 Years | 134 | 13.9% |
| 55 to 64 Years | 377 | 39.1% |
| 65 to 74 Years | 164 | 17.0% |
| 75 to 84 Years | 62 | 6.4% |
| 85 Years and Over | 4 | 0.4% |
| Total | 964 | 100.0% |
Housing Finances in Brownville
Median Income by Occupancy in Brownville
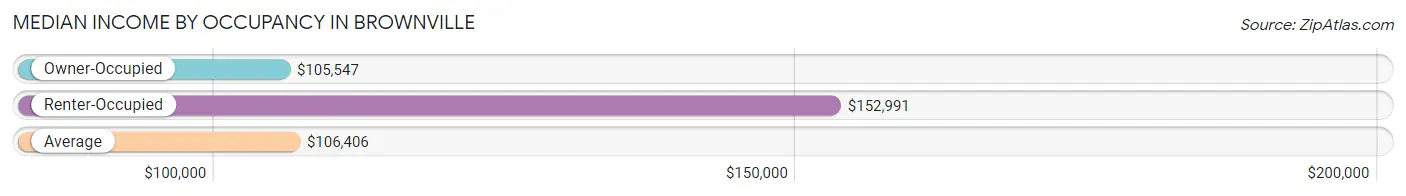
| Occupancy Type | # Households | Median Income |
| Owner-Occupied | 841 (87.2%) | $105,547 |
| Renter-Occupied | 123 (12.8%) | $152,991 |
| Average | 964 (100.0%) | $106,406 |
Occupancy by Householder Income Bracket in Brownville
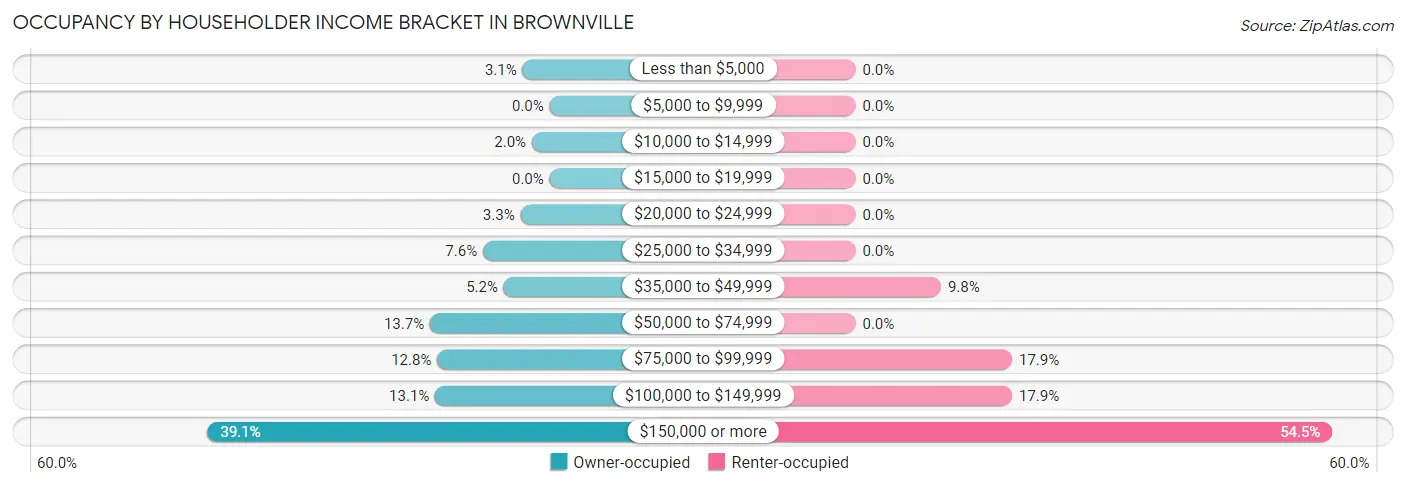
| Income Bracket | Owner-occupied | Renter-occupied |
| Less than $5,000 | 26 (3.1%) | 0 (0.0%) |
| $5,000 to $9,999 | 0 (0.0%) | 0 (0.0%) |
| $10,000 to $14,999 | 17 (2.0%) | 0 (0.0%) |
| $15,000 to $19,999 | 0 (0.0%) | 0 (0.0%) |
| $20,000 to $24,999 | 28 (3.3%) | 0 (0.0%) |
| $25,000 to $34,999 | 64 (7.6%) | 0 (0.0%) |
| $35,000 to $49,999 | 44 (5.2%) | 12 (9.8%) |
| $50,000 to $74,999 | 115 (13.7%) | 0 (0.0%) |
| $75,000 to $99,999 | 108 (12.8%) | 22 (17.9%) |
| $100,000 to $149,999 | 110 (13.1%) | 22 (17.9%) |
| $150,000 or more | 329 (39.1%) | 67 (54.5%) |
| Total | 841 (100.0%) | 123 (100.0%) |
Monthly Housing Cost Tiers in Brownville
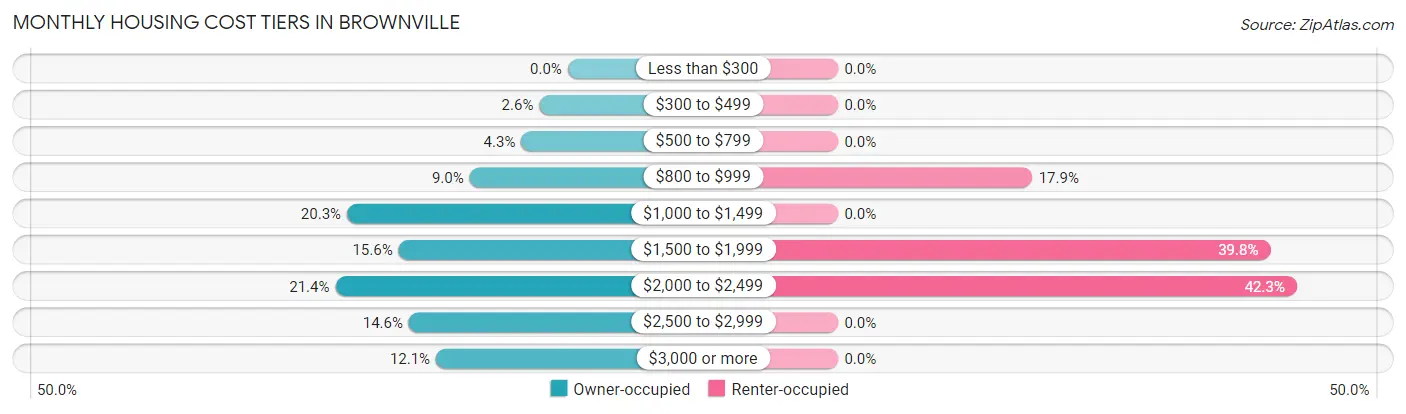
| Monthly Cost | Owner-occupied | Renter-occupied |
| Less than $300 | 0 (0.0%) | 0 (0.0%) |
| $300 to $499 | 22 (2.6%) | 0 (0.0%) |
| $500 to $799 | 36 (4.3%) | 0 (0.0%) |
| $800 to $999 | 76 (9.0%) | 22 (17.9%) |
| $1,000 to $1,499 | 171 (20.3%) | 0 (0.0%) |
| $1,500 to $1,999 | 131 (15.6%) | 49 (39.8%) |
| $2,000 to $2,499 | 180 (21.4%) | 52 (42.3%) |
| $2,500 to $2,999 | 123 (14.6%) | 0 (0.0%) |
| $3,000 or more | 102 (12.1%) | 0 (0.0%) |
| Total | 841 (100.0%) | 123 (100.0%) |
Physical Housing Characteristics in Brownville
Housing Structures in Brownville
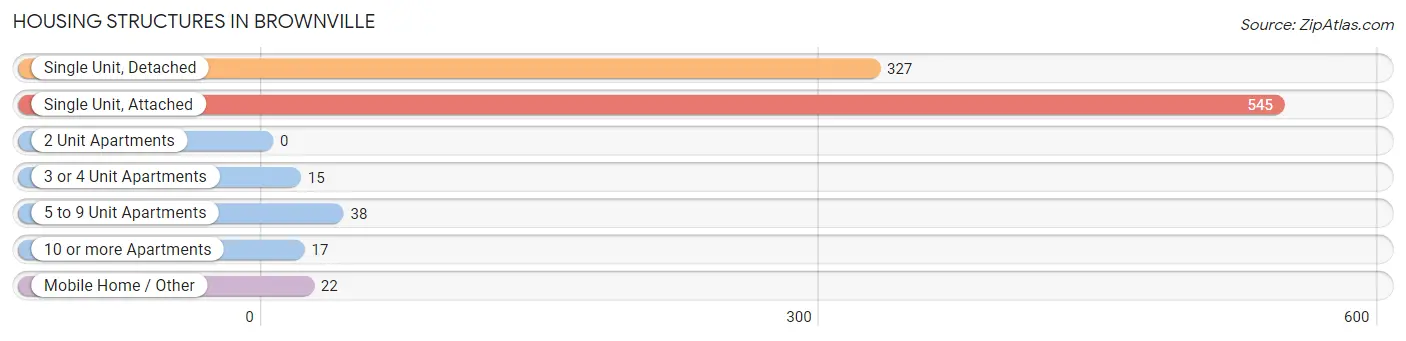
| Structure Type | # Housing Units | % Housing Units |
| Single Unit, Detached | 327 | 33.9% |
| Single Unit, Attached | 545 | 56.5% |
| 2 Unit Apartments | 0 | 0.0% |
| 3 or 4 Unit Apartments | 15 | 1.6% |
| 5 to 9 Unit Apartments | 38 | 3.9% |
| 10 or more Apartments | 17 | 1.8% |
| Mobile Home / Other | 22 | 2.3% |
| Total | 964 | 100.0% |
Housing Structures by Occupancy in Brownville
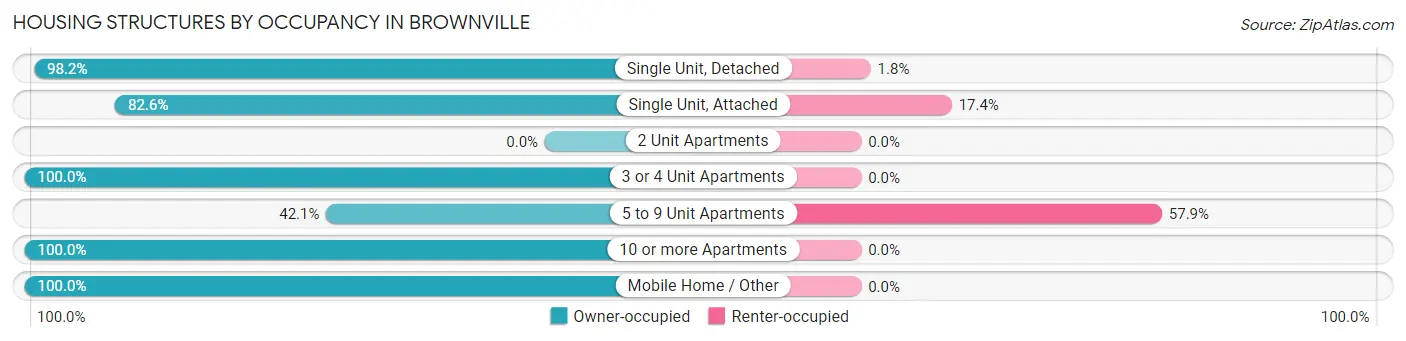
| Structure Type | Owner-occupied | Renter-occupied |
| Single Unit, Detached | 321 (98.2%) | 6 (1.8%) |
| Single Unit, Attached | 450 (82.6%) | 95 (17.4%) |
| 2 Unit Apartments | 0 (0.0%) | 0 (0.0%) |
| 3 or 4 Unit Apartments | 15 (100.0%) | 0 (0.0%) |
| 5 to 9 Unit Apartments | 16 (42.1%) | 22 (57.9%) |
| 10 or more Apartments | 17 (100.0%) | 0 (0.0%) |
| Mobile Home / Other | 22 (100.0%) | 0 (0.0%) |
| Total | 841 (87.2%) | 123 (12.8%) |
Housing Structures by Number of Rooms in Brownville
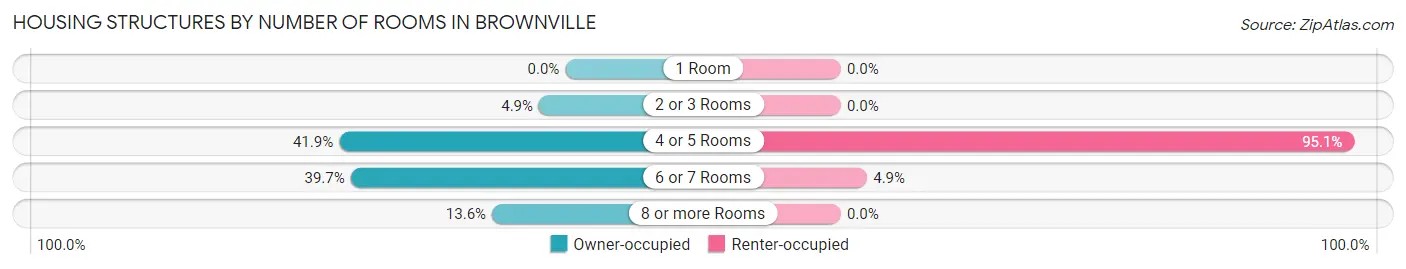
| Number of Rooms | Owner-occupied | Renter-occupied |
| 1 Room | 0 (0.0%) | 0 (0.0%) |
| 2 or 3 Rooms | 41 (4.9%) | 0 (0.0%) |
| 4 or 5 Rooms | 352 (41.8%) | 117 (95.1%) |
| 6 or 7 Rooms | 334 (39.7%) | 6 (4.9%) |
| 8 or more Rooms | 114 (13.6%) | 0 (0.0%) |
| Total | 841 (100.0%) | 123 (100.0%) |
Housing Structure by Heating Type in Brownville
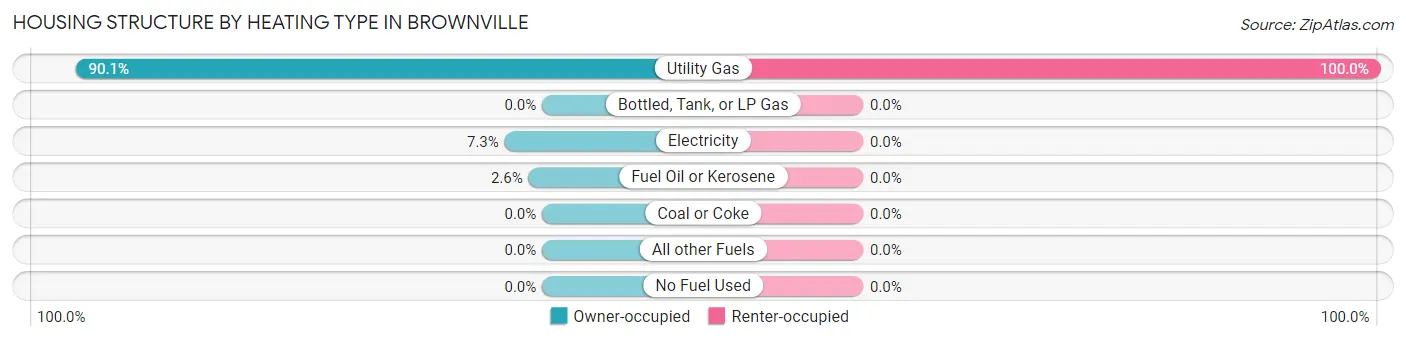
| Heating Type | Owner-occupied | Renter-occupied |
| Utility Gas | 758 (90.1%) | 123 (100.0%) |
| Bottled, Tank, or LP Gas | 0 (0.0%) | 0 (0.0%) |
| Electricity | 61 (7.2%) | 0 (0.0%) |
| Fuel Oil or Kerosene | 22 (2.6%) | 0 (0.0%) |
| Coal or Coke | 0 (0.0%) | 0 (0.0%) |
| All other Fuels | 0 (0.0%) | 0 (0.0%) |
| No Fuel Used | 0 (0.0%) | 0 (0.0%) |
| Total | 841 (100.0%) | 123 (100.0%) |
Household Vehicle Usage in Brownville
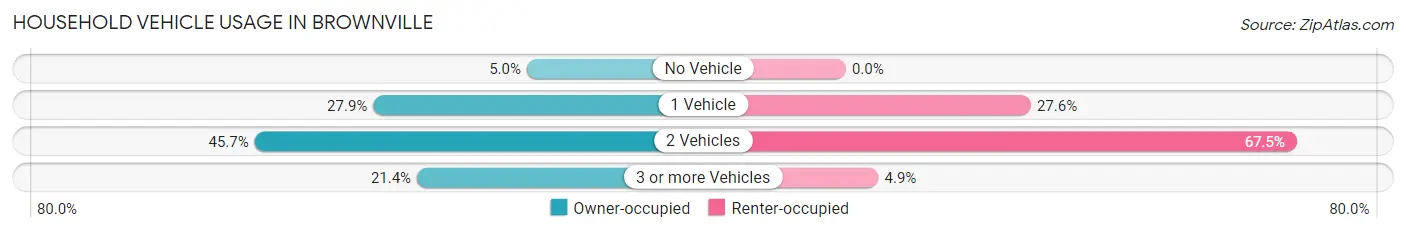
| Vehicles per Household | Owner-occupied | Renter-occupied |
| No Vehicle | 42 (5.0%) | 0 (0.0%) |
| 1 Vehicle | 235 (27.9%) | 34 (27.6%) |
| 2 Vehicles | 384 (45.7%) | 83 (67.5%) |
| 3 or more Vehicles | 180 (21.4%) | 6 (4.9%) |
| Total | 841 (100.0%) | 123 (100.0%) |
Real Estate & Mortgages in Brownville
Real Estate and Mortgage Overview in Brownville
| Characteristic | Without Mortgage | With Mortgage |
| Housing Units | 292 | 549 |
| Median Property Value | $347,700 | $298,400 |
| Median Household Income | $114,583 | $210 |
| Monthly Housing Costs | $1,020 | $102 |
| Real Estate Taxes | $7,011 | $0 |
Property Value by Mortgage Status in Brownville
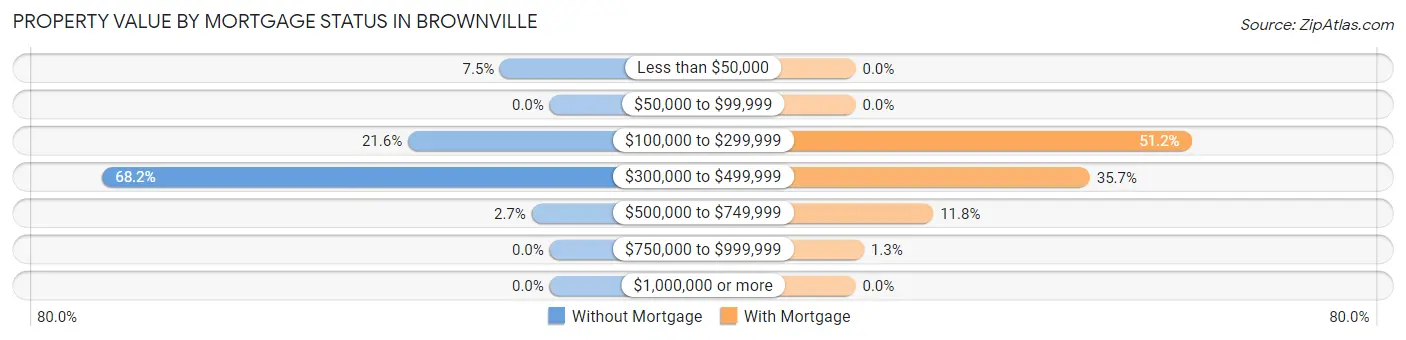
| Property Value | Without Mortgage | With Mortgage |
| Less than $50,000 | 22 (7.5%) | 0 (0.0%) |
| $50,000 to $99,999 | 0 (0.0%) | 0 (0.0%) |
| $100,000 to $299,999 | 63 (21.6%) | 281 (51.2%) |
| $300,000 to $499,999 | 199 (68.1%) | 196 (35.7%) |
| $500,000 to $749,999 | 8 (2.7%) | 65 (11.8%) |
| $750,000 to $999,999 | 0 (0.0%) | 7 (1.3%) |
| $1,000,000 or more | 0 (0.0%) | 0 (0.0%) |
| Total | 292 (100.0%) | 549 (100.0%) |
Household Income by Mortgage Status in Brownville
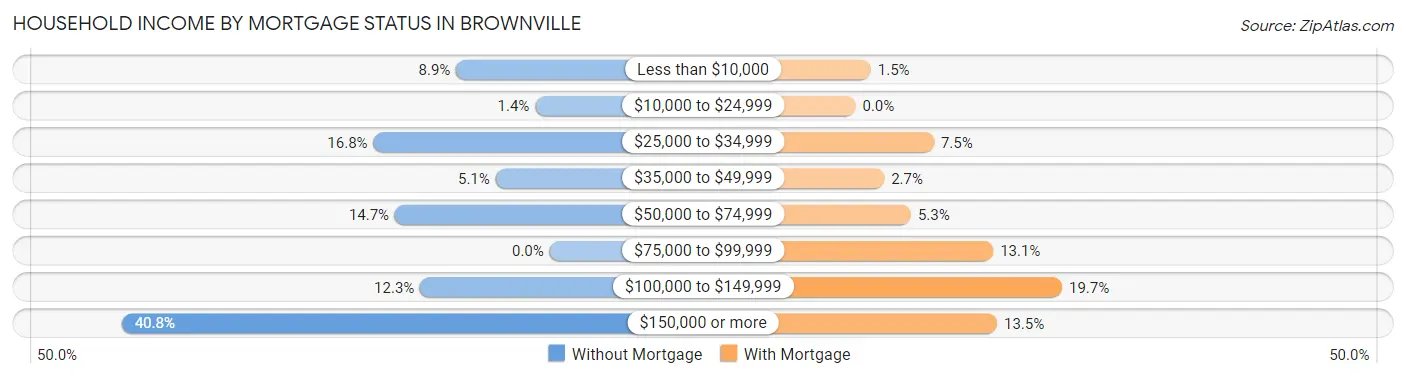
| Household Income | Without Mortgage | With Mortgage |
| Less than $10,000 | 26 (8.9%) | 8 (1.5%) |
| $10,000 to $24,999 | 4 (1.4%) | 0 (0.0%) |
| $25,000 to $34,999 | 49 (16.8%) | 41 (7.5%) |
| $35,000 to $49,999 | 15 (5.1%) | 15 (2.7%) |
| $50,000 to $74,999 | 43 (14.7%) | 29 (5.3%) |
| $75,000 to $99,999 | 0 (0.0%) | 72 (13.1%) |
| $100,000 to $149,999 | 36 (12.3%) | 108 (19.7%) |
| $150,000 or more | 119 (40.7%) | 74 (13.5%) |
| Total | 292 (100.0%) | 549 (100.0%) |
Property Value to Household Income Ratio in Brownville
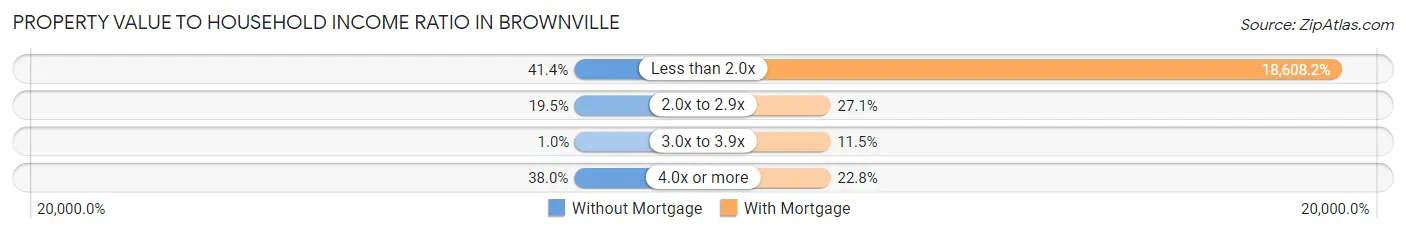
| Value-to-Income Ratio | Without Mortgage | With Mortgage |
| Less than 2.0x | 121 (41.4%) | 102,159 (18,608.2%) |
| 2.0x to 2.9x | 57 (19.5%) | 149 (27.1%) |
| 3.0x to 3.9x | 3 (1.0%) | 63 (11.5%) |
| 4.0x or more | 111 (38.0%) | 125 (22.8%) |
| Total | 292 (100.0%) | 549 (100.0%) |
Real Estate Taxes by Mortgage Status in Brownville
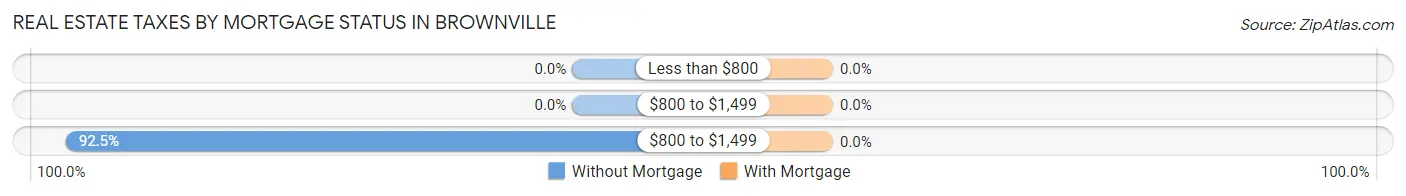
| Property Taxes | Without Mortgage | With Mortgage |
| Less than $800 | 0 (0.0%) | 0 (0.0%) |
| $800 to $1,499 | 0 (0.0%) | 0 (0.0%) |
| $800 to $1,499 | 270 (92.5%) | 0 (0.0%) |
| Total | 292 (100.0%) | 549 (100.0%) |
Health & Disability in Brownville
Health Insurance Coverage by Age in Brownville
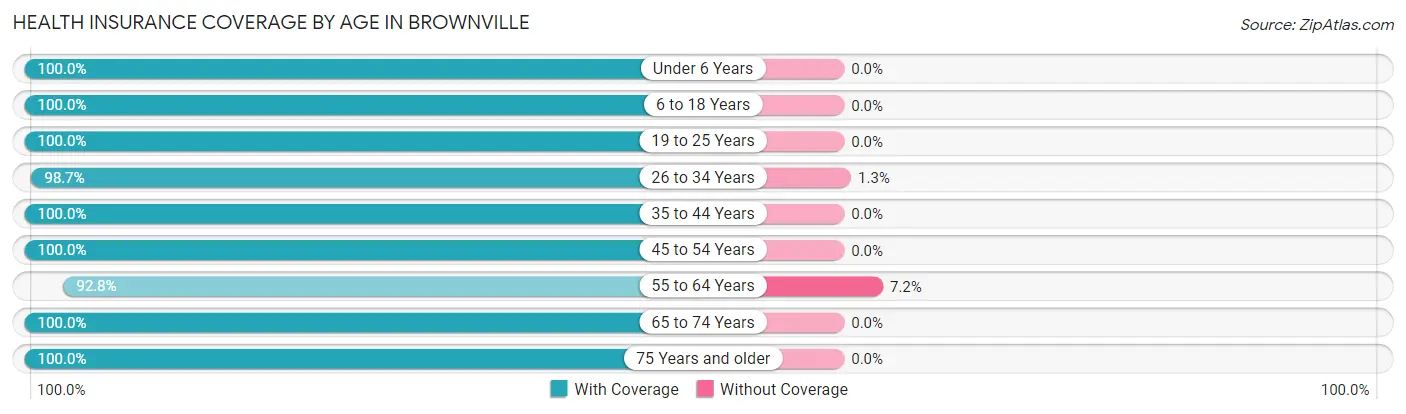
| Age Bracket | With Coverage | Without Coverage |
| Under 6 Years | 169 (100.0%) | 0 (0.0%) |
| 6 to 18 Years | 167 (100.0%) | 0 (0.0%) |
| 19 to 25 Years | 139 (100.0%) | 0 (0.0%) |
| 26 to 34 Years | 311 (98.7%) | 4 (1.3%) |
| 35 to 44 Years | 275 (100.0%) | 0 (0.0%) |
| 45 to 54 Years | 180 (100.0%) | 0 (0.0%) |
| 55 to 64 Years | 591 (92.8%) | 46 (7.2%) |
| 65 to 74 Years | 220 (100.0%) | 0 (0.0%) |
| 75 Years and older | 81 (100.0%) | 0 (0.0%) |
| Total | 2,133 (97.7%) | 50 (2.3%) |
Health Insurance Coverage by Citizenship Status in Brownville
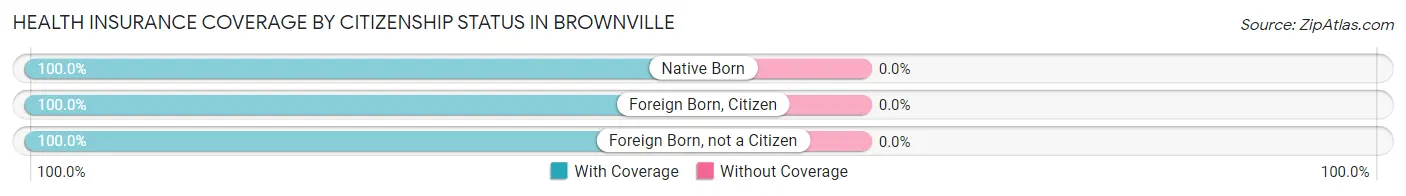
| Citizenship Status | With Coverage | Without Coverage |
| Native Born | 169 (100.0%) | 0 (0.0%) |
| Foreign Born, Citizen | 167 (100.0%) | 0 (0.0%) |
| Foreign Born, not a Citizen | 139 (100.0%) | 0 (0.0%) |
Health Insurance Coverage by Household Income in Brownville
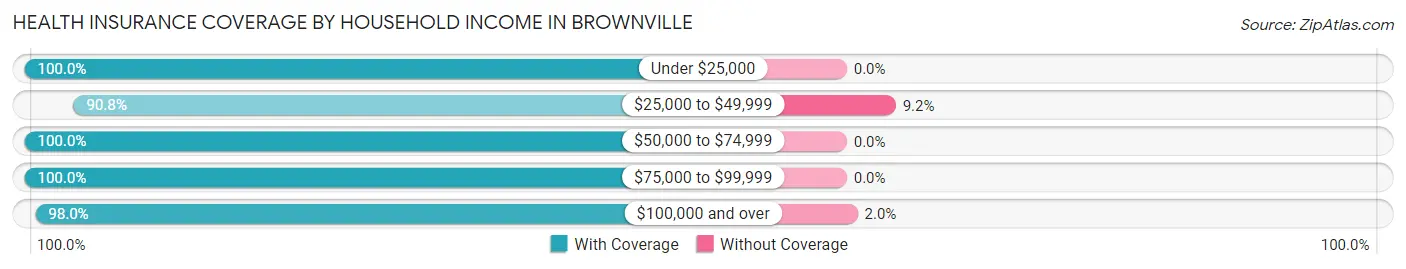
| Household Income | With Coverage | Without Coverage |
| Under $25,000 | 79 (100.0%) | 0 (0.0%) |
| $25,000 to $49,999 | 218 (90.8%) | 22 (9.2%) |
| $50,000 to $74,999 | 272 (100.0%) | 0 (0.0%) |
| $75,000 to $99,999 | 215 (100.0%) | 0 (0.0%) |
| $100,000 and over | 1,349 (98.0%) | 28 (2.0%) |
Public vs Private Health Insurance Coverage by Age in Brownville
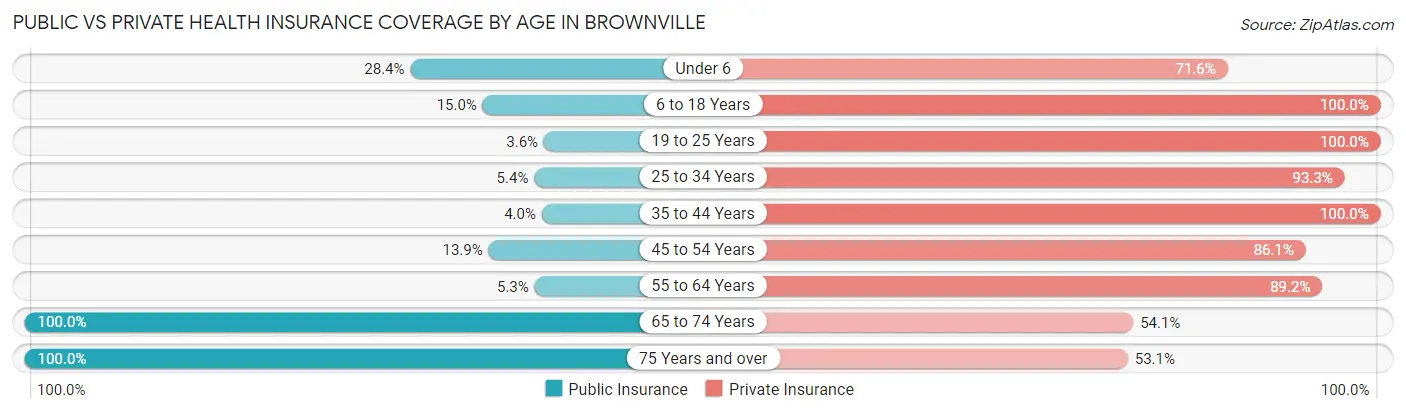
| Age Bracket | Public Insurance | Private Insurance |
| Under 6 | 48 (28.4%) | 121 (71.6%) |
| 6 to 18 Years | 25 (15.0%) | 167 (100.0%) |
| 19 to 25 Years | 5 (3.6%) | 139 (100.0%) |
| 25 to 34 Years | 17 (5.4%) | 294 (93.3%) |
| 35 to 44 Years | 11 (4.0%) | 275 (100.0%) |
| 45 to 54 Years | 25 (13.9%) | 155 (86.1%) |
| 55 to 64 Years | 34 (5.3%) | 568 (89.2%) |
| 65 to 74 Years | 220 (100.0%) | 119 (54.1%) |
| 75 Years and over | 81 (100.0%) | 43 (53.1%) |
| Total | 466 (21.3%) | 1,881 (86.2%) |
Disability Status by Sex by Age in Brownville
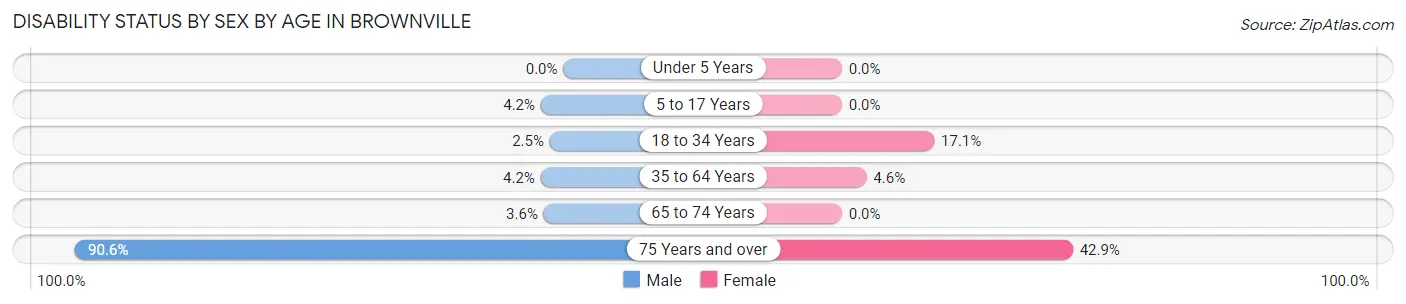
| Age Bracket | Male | Female |
| Under 5 Years | 0 (0.0%) | 0 (0.0%) |
| 5 to 17 Years | 4 (4.2%) | 0 (0.0%) |
| 18 to 34 Years | 5 (2.5%) | 48 (17.1%) |
| 35 to 64 Years | 22 (4.2%) | 26 (4.6%) |
| 65 to 74 Years | 4 (3.6%) | 0 (0.0%) |
| 75 Years and over | 29 (90.6%) | 21 (42.9%) |
Disability Class by Sex by Age in Brownville
Disability Class: Hearing Difficulty
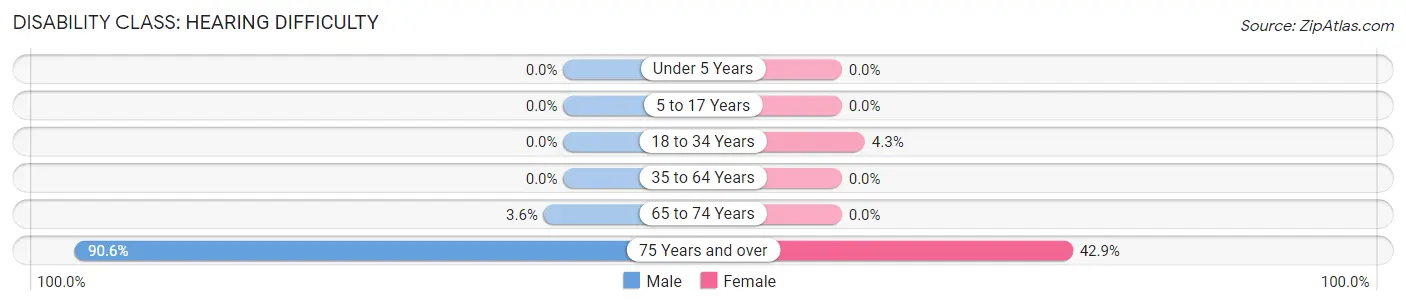
| Age Bracket | Male | Female |
| Under 5 Years | 0 (0.0%) | 0 (0.0%) |
| 5 to 17 Years | 0 (0.0%) | 0 (0.0%) |
| 18 to 34 Years | 0 (0.0%) | 12 (4.3%) |
| 35 to 64 Years | 0 (0.0%) | 0 (0.0%) |
| 65 to 74 Years | 4 (3.6%) | 0 (0.0%) |
| 75 Years and over | 29 (90.6%) | 21 (42.9%) |
Disability Class: Vision Difficulty
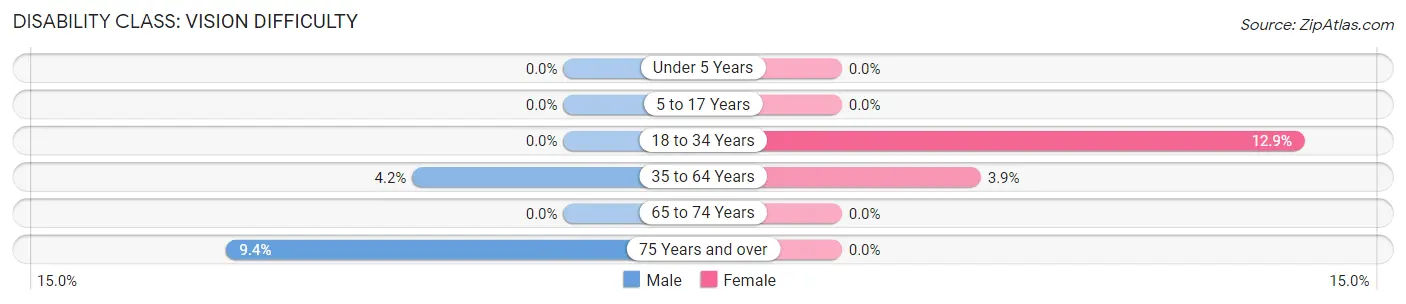
| Age Bracket | Male | Female |
| Under 5 Years | 0 (0.0%) | 0 (0.0%) |
| 5 to 17 Years | 0 (0.0%) | 0 (0.0%) |
| 18 to 34 Years | 0 (0.0%) | 36 (12.9%) |
| 35 to 64 Years | 22 (4.2%) | 22 (3.9%) |
| 65 to 74 Years | 0 (0.0%) | 0 (0.0%) |
| 75 Years and over | 3 (9.4%) | 0 (0.0%) |
Disability Class: Cognitive Difficulty
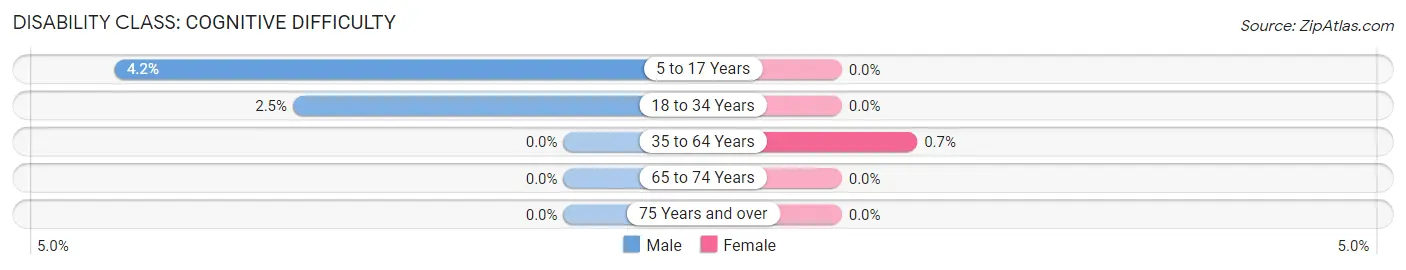
| Age Bracket | Male | Female |
| 5 to 17 Years | 4 (4.2%) | 0 (0.0%) |
| 18 to 34 Years | 5 (2.5%) | 0 (0.0%) |
| 35 to 64 Years | 0 (0.0%) | 4 (0.7%) |
| 65 to 74 Years | 0 (0.0%) | 0 (0.0%) |
| 75 Years and over | 0 (0.0%) | 0 (0.0%) |
Disability Class: Ambulatory Difficulty

| Age Bracket | Male | Female |
| 5 to 17 Years | 0 (0.0%) | 0 (0.0%) |
| 18 to 34 Years | 0 (0.0%) | 0 (0.0%) |
| 35 to 64 Years | 0 (0.0%) | 0 (0.0%) |
| 65 to 74 Years | 4 (3.6%) | 0 (0.0%) |
| 75 Years and over | 3 (9.4%) | 0 (0.0%) |
Disability Class: Self-Care Difficulty
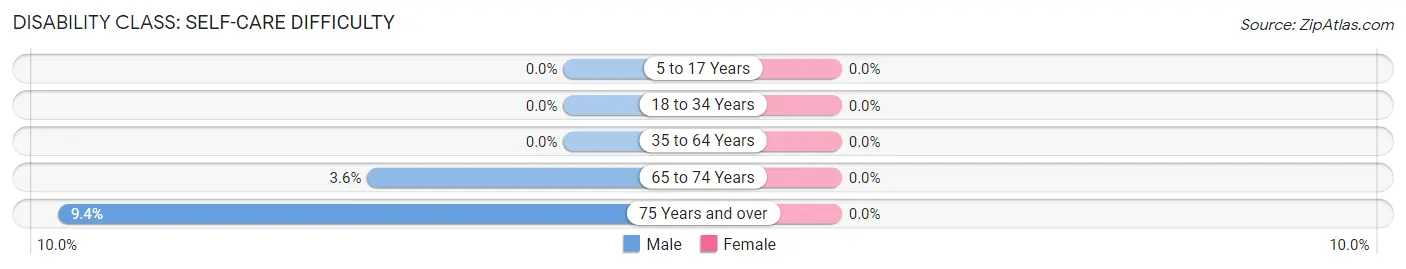
| Age Bracket | Male | Female |
| 5 to 17 Years | 0 (0.0%) | 0 (0.0%) |
| 18 to 34 Years | 0 (0.0%) | 0 (0.0%) |
| 35 to 64 Years | 0 (0.0%) | 0 (0.0%) |
| 65 to 74 Years | 4 (3.6%) | 0 (0.0%) |
| 75 Years and over | 3 (9.4%) | 0 (0.0%) |
Technology Access in Brownville
Computing Device Access in Brownville
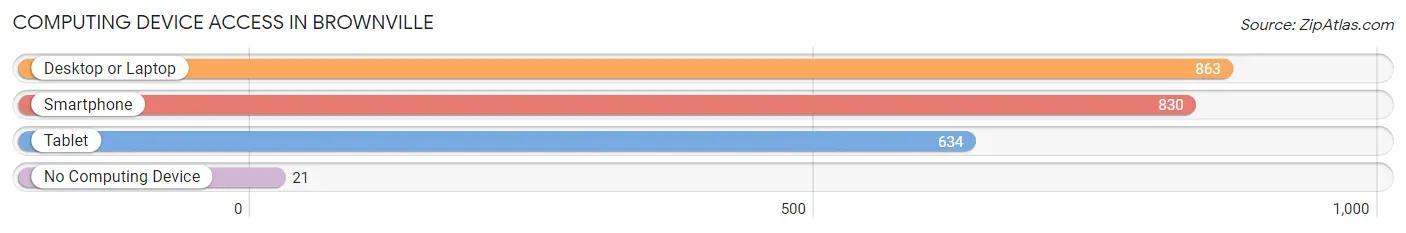
| Device Type | # Households | % Households |
| Desktop or Laptop | 863 | 89.5% |
| Smartphone | 830 | 86.1% |
| Tablet | 634 | 65.8% |
| No Computing Device | 21 | 2.2% |
| Total | 964 | 100.0% |
Internet Access in Brownville
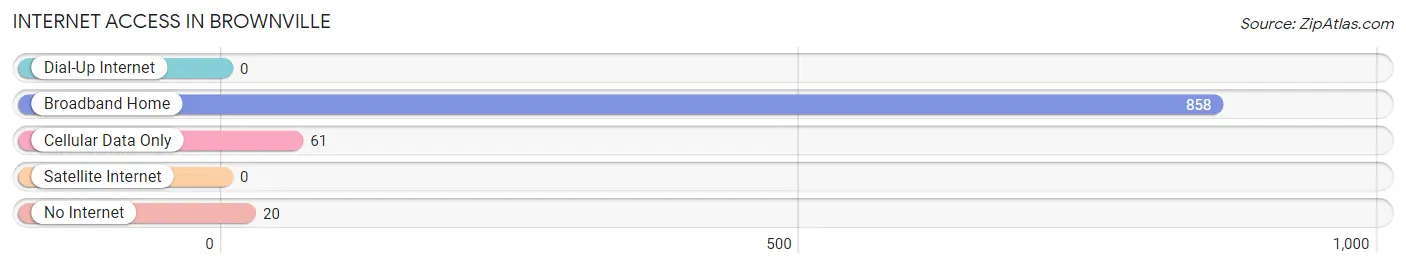
| Internet Type | # Households | % Households |
| Dial-Up Internet | 0 | 0.0% |
| Broadband Home | 858 | 89.0% |
| Cellular Data Only | 61 | 6.3% |
| Satellite Internet | 0 | 0.0% |
| No Internet | 20 | 2.1% |
| Total | 964 | 100.0% |
Brownville Summary
Brownsville, NJ is a small borough located in Burlington County, New Jersey. It is situated on the banks of the Rancocas Creek, and is part of the larger Rancocas Valley region. The borough is bordered by Pemberton Township to the north, Eastampton Township to the east, and Mount Holly Township to the south and west. The population of Brownsville was 1,845 as of the 2010 census.
History
The area that is now Brownsville was originally inhabited by the Lenape Native Americans. The first European settlers arrived in the area in the late 17th century, and the town was officially established in 1798. The town was named after the Brown family, who were among the first settlers.
The town was an agricultural community for much of its history, and the main crops grown were corn, wheat, and potatoes. The town also had a number of mills, including a grist mill, a saw mill, and a paper mill.
In the late 19th century, the town began to experience a period of growth and development. The railroad arrived in 1872, and the town was connected to the larger cities of Philadelphia and Camden. This allowed for the development of industry in the town, and the population began to grow.
Geography
Brownsville is located at 39°59'N 74°45'W (39.983, -74.750). According to the United States Census Bureau, the borough has a total area of 0.9 square miles (2.3 km2), all of which is land.
The borough is located in the Rancocas Valley region of New Jersey. The Rancocas Creek runs through the town, and there are several small lakes in the area. The town is mostly flat, with some rolling hills in the northern part of the borough.
Economy
The economy of Brownsville is largely based on manufacturing and services. The town is home to several small businesses, including a number of restaurants, retail stores, and professional services. The town also has a number of light industrial businesses, including a plastics factory and a printing company.
The town is also home to a number of government offices, including the Burlington County Courthouse and the Burlington County Jail.
Demographics
As of the 2010 census, there were 1,845 people, 717 households, and 463 families residing in the borough. The population density was 2,037.3 people per square mile (788.3/km2). There were 767 housing units at an average density of 845.3 per square mile (326.2/km2). The racial makeup of the borough was 79.2% White, 14.2% African American, 0.2% Native American, 1.2% Asian, 0.1% Pacific Islander, 3.2% from other races, and 1.9% from two or more races. Hispanic or Latino of any race were 8.2% of the population.
There were 717 households, out of which 28.2% had children under the age of 18 living with them, 43.2% were married couples living together, 14.7% had a female householder with no husband present, and 36.2% were non-families. 30.2% of all households were made up of individuals, and 11.2% had someone living alone who was 65 years of age or older. The average household size was 2.56 and the average family size was 3.17.
In the borough, the population was spread out, with 24.2% under the age of 18, 8.2% from 18 to 24, 28.7% from 25 to 44, 24.2% from 45 to 64, and 14.7% who were 65 years of age or older. The median age was 38 years. For every 100 females, there were 94.2 males. For every 100 females age 18 and over, there were 91.2 males.
The median income for a household in the borough was $45,000, and the median income for a family was $51,250. Males had a median income of $37,500 versus $30,000 for females. The per capita income for the borough was $20,945. About 8.2% of families and 10.2% of the population were below the poverty line, including 14.2% of those under age 18 and 8.2% of those age 65 or over.
Common Questions
What is Per Capita Income in Brownville?
Per Capita income in Brownville is $64,529.
What is the Median Family Income in Brownville?
Median Family Income in Brownville is $131,214.
What is the Median Household income in Brownville?
Median Household Income in Brownville is $106,406.
What is Income or Wage Gap in Brownville?
Income or Wage Gap in Brownville is 10.9%.
Women in Brownville earn 89.1 cents for every dollar earned by a man.
What is Inequality or Gini Index in Brownville?
Inequality or Gini Index in Brownville is 0.43.
What is the Total Population of Brownville?
Total Population of Brownville is 2,183.
What is the Total Male Population of Brownville?
Total Male Population of Brownville is 1,012.
What is the Total Female Population of Brownville?
Total Female Population of Brownville is 1,171.
What is the Ratio of Males per 100 Females in Brownville?
There are 86.42 Males per 100 Females in Brownville.
What is the Ratio of Females per 100 Males in Brownville?
There are 115.71 Females per 100 Males in Brownville.
What is the Median Population Age in Brownville?
Median Population Age in Brownville is 45.6 Years.
What is the Average Family Size in Brownville
Average Family Size in Brownville is 2.9 People.
What is the Average Household Size in Brownville
Average Household Size in Brownville is 2.3 People.
How Large is the Labor Force in Brownville?
There are 1,550 People in the Labor Forcein in Brownville.
What is the Percentage of People in the Labor Force in Brownville?
80.9% of People are in the Labor Force in Brownville.
What is the Unemployment Rate in Brownville?
Unemployment Rate in Brownville is 5.3%.