Cities with the Highest Percentage of Population Carpooling to Work in Massachusetts
RELATED REPORTS & OPTIONS
Drive | Carpool
Massachusetts
Compare Cities
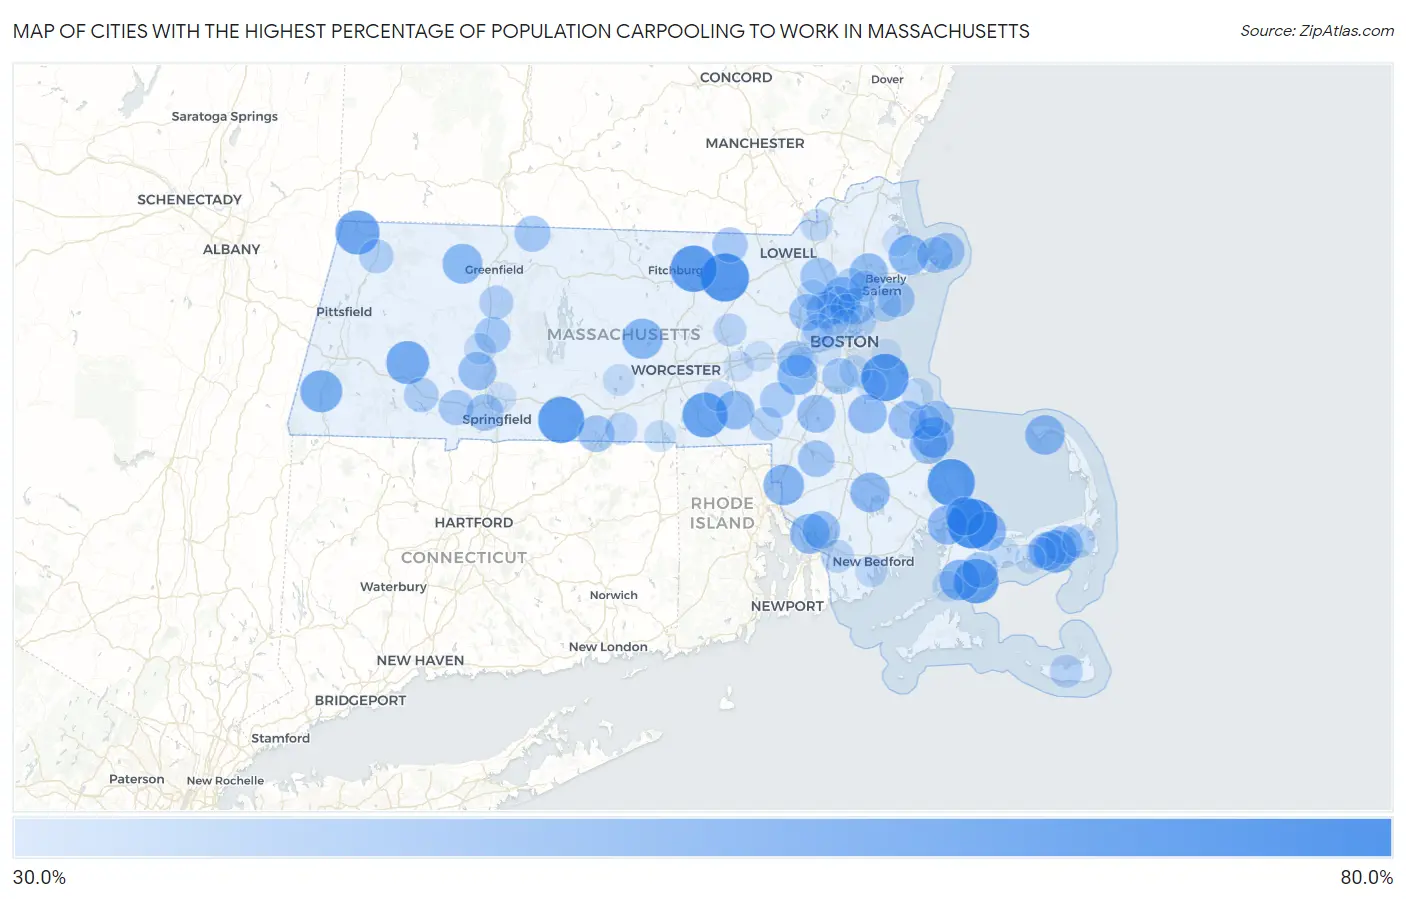
Map of Cities with the Highest Percentage of Population Carpooling to Work in Massachusetts
0.0%
80.0%
Cities with the Highest Percentage of Population Carpooling to Work in Massachusetts
| City | % Carpool | vs State | vs National | |
| 1. | Sandwich | 64.2% | 39.0%(+25.2)#1 | 38.2%(+26.0)#187 |
| 2. | Ayer | 62.3% | 39.0%(+23.3)#2 | 38.2%(+24.1)#290 |
| 3. | Hingham | 61.3% | 39.0%(+22.3)#3 | 38.2%(+23.1)#378 |
| 4. | The Pinehills | 61.1% | 39.0%(+22.1)#4 | 38.2%(+22.9)#399 |
| 5. | Lunenburg | 60.2% | 39.0%(+21.2)#5 | 38.2%(+22.0)#509 |
| 6. | Monson Center | 59.8% | 39.0%(+20.8)#6 | 38.2%(+21.6)#553 |
| 7. | Whitinsville | 58.2% | 39.0%(+19.2)#7 | 38.2%(+20.0)#784 |
| 8. | New Seabury | 57.7% | 39.0%(+18.7)#8 | 38.2%(+19.5)#848 |
| 9. | Williamstown | 57.0% | 39.0%(+18.0)#9 | 38.2%(+18.8)#950 |
| 10. | Chester | 55.6% | 39.0%(+16.6)#10 | 38.2%(+17.4)#1,216 |
| 11. | Dennis Port | 54.7% | 39.0%(+15.7)#11 | 38.2%(+16.5)#1,415 |
| 12. | Great Barrington | 54.4% | 39.0%(+15.4)#12 | 38.2%(+16.2)#1,491 |
| 13. | East Falmouth | 52.5% | 39.0%(+13.5)#13 | 38.2%(+14.3)#1,931 |
| 14. | North Seekonk | 52.5% | 39.0%(+13.5)#14 | 38.2%(+14.3)#1,937 |
| 15. | Duxbury | 52.4% | 39.0%(+13.4)#15 | 38.2%(+14.2)#1,979 |
| 16. | Rutland | 52.1% | 39.0%(+13.1)#16 | 38.2%(+13.9)#2,069 |
| 17. | Dover | 51.7% | 39.0%(+12.7)#17 | 38.2%(+13.5)#2,171 |
| 18. | Ocean Grove | 51.6% | 39.0%(+12.6)#18 | 38.2%(+13.4)#2,197 |
| 19. | Essex | 51.6% | 39.0%(+12.6)#19 | 38.2%(+13.4)#2,199 |
| 20. | Shelburne Falls | 51.4% | 39.0%(+12.4)#20 | 38.2%(+13.2)#2,272 |
| 21. | East Sandwich | 51.1% | 39.0%(+12.1)#21 | 38.2%(+12.9)#2,377 |
| 22. | Provincetown | 51.1% | 39.0%(+12.1)#22 | 38.2%(+12.9)#2,379 |
| 23. | Cedar Crest | 51.1% | 39.0%(+12.1)#23 | 38.2%(+12.9)#2,382 |
| 24. | North Lakeville | 51.0% | 39.0%(+12.0)#24 | 38.2%(+12.8)#2,415 |
| 25. | Buzzards Bay | 50.8% | 39.0%(+11.8)#25 | 38.2%(+12.6)#2,478 |
| 26. | Sagamore | 50.1% | 39.0%(+11.1)#26 | 38.2%(+11.9)#2,764 |
| 27. | Abington | 50.0% | 39.0%(+11.0)#27 | 38.2%(+11.8)#2,793 |
| 28. | Hopedale | 50.0% | 39.0%(+11.0)#28 | 38.2%(+11.8)#2,799 |
| 29. | Wakefield | 49.4% | 39.0%(+10.4)#29 | 38.2%(+11.2)#2,991 |
| 30. | Danvers | 49.3% | 39.0%(+10.3)#30 | 38.2%(+11.1)#3,032 |
| 31. | Northwest Harwich | 49.2% | 39.0%(+10.2)#31 | 38.2%(+11.0)#3,100 |
| 32. | West Dennis | 49.2% | 39.0%(+10.2)#32 | 38.2%(+11.0)#3,103 |
| 33. | Easthampton Town | 49.1% | 39.0%(+10.1)#33 | 38.2%(+10.9)#3,129 |
| 34. | North Pembroke | 49.1% | 39.0%(+10.1)#34 | 38.2%(+10.9)#3,137 |
| 35. | Sharon | 49.0% | 39.0%(+10.00)#35 | 38.2%(+10.8)#3,180 |
| 36. | South Duxbury | 48.9% | 39.0%(+9.90)#36 | 38.2%(+10.7)#3,217 |
| 37. | Stoneham | 48.8% | 39.0%(+9.80)#37 | 38.2%(+10.6)#3,233 |
| 38. | Somerset | 48.6% | 39.0%(+9.60)#38 | 38.2%(+10.4)#3,312 |
| 39. | Winchester | 47.6% | 39.0%(+8.60)#39 | 38.2%(+9.40)#3,748 |
| 40. | Rockport | 47.5% | 39.0%(+8.50)#40 | 38.2%(+9.30)#3,802 |
| 41. | Saugus | 47.4% | 39.0%(+8.40)#41 | 38.2%(+9.20)#3,882 |
| 42. | Wilmington | 47.4% | 39.0%(+8.40)#42 | 38.2%(+9.20)#3,883 |
| 43. | Lexington | 47.3% | 39.0%(+8.30)#43 | 38.2%(+9.10)#3,929 |
| 44. | West Springfield Town | 47.2% | 39.0%(+8.20)#44 | 38.2%(+9.00)#3,999 |
| 45. | Norton Center | 47.2% | 39.0%(+8.20)#45 | 38.2%(+9.00)#4,025 |
| 46. | Holland | 47.2% | 39.0%(+8.20)#46 | 38.2%(+9.00)#4,036 |
| 47. | Marblehead | 47.1% | 39.0%(+8.10)#47 | 38.2%(+8.90)#4,066 |
| 48. | Hatfield | 46.7% | 39.0%(+7.70)#48 | 38.2%(+8.50)#4,243 |
| 49. | Milton | 46.5% | 39.0%(+7.50)#49 | 38.2%(+8.30)#4,293 |
| 50. | Northfield | 46.4% | 39.0%(+7.40)#50 | 38.2%(+8.20)#4,388 |
| 51. | Ocean Bluff Brant Rock | 46.3% | 39.0%(+7.30)#51 | 38.2%(+8.10)#4,424 |
| 52. | Gloucester | 46.2% | 39.0%(+7.20)#52 | 38.2%(+8.00)#4,471 |
| 53. | Mashpee Neck | 46.1% | 39.0%(+7.10)#53 | 38.2%(+7.90)#4,555 |
| 54. | Wellesley | 46.0% | 39.0%(+7.00)#54 | 38.2%(+7.80)#4,573 |
| 55. | East Pepperell | 45.6% | 39.0%(+6.60)#55 | 38.2%(+7.40)#4,767 |
| 56. | Westfield | 45.5% | 39.0%(+6.50)#56 | 38.2%(+7.30)#4,797 |
| 57. | Millis Clicquot | 45.4% | 39.0%(+6.40)#57 | 38.2%(+7.20)#4,928 |
| 58. | Oak Bluffs | 45.2% | 39.0%(+6.20)#58 | 38.2%(+7.00)#5,063 |
| 59. | Marshfield | 44.7% | 39.0%(+5.70)#59 | 38.2%(+6.50)#5,293 |
| 60. | Blandford | 44.7% | 39.0%(+5.70)#60 | 38.2%(+6.50)#5,318 |
| 61. | Adams | 44.2% | 39.0%(+5.20)#61 | 38.2%(+6.00)#5,635 |
| 62. | South Deerfield | 43.8% | 39.0%(+4.80)#62 | 38.2%(+5.60)#5,868 |
| 63. | Lynnfield | 43.5% | 39.0%(+4.50)#63 | 38.2%(+5.30)#6,040 |
| 64. | Franklin Town | 43.4% | 39.0%(+4.40)#64 | 38.2%(+5.20)#6,123 |
| 65. | East Harwich | 43.3% | 39.0%(+4.30)#65 | 38.2%(+5.10)#6,221 |
| 66. | Swampscott | 43.2% | 39.0%(+4.20)#66 | 38.2%(+5.00)#6,299 |
| 67. | Watertown Town | 42.8% | 39.0%(+3.80)#67 | 38.2%(+4.60)#6,545 |
| 68. | Nantucket | 42.8% | 39.0%(+3.80)#68 | 38.2%(+4.60)#6,557 |
| 69. | North Westport | 42.7% | 39.0%(+3.70)#69 | 38.2%(+4.50)#6,632 |
| 70. | Hudson | 42.6% | 39.0%(+3.60)#70 | 38.2%(+4.40)#6,690 |
| 71. | Southbridge Town | 42.1% | 39.0%(+3.10)#71 | 38.2%(+3.90)#7,104 |
| 72. | Revere | 41.9% | 39.0%(+2.90)#72 | 38.2%(+3.70)#7,235 |
| 73. | Melrose | 41.5% | 39.0%(+2.50)#73 | 38.2%(+3.30)#7,549 |
| 74. | Methuen Town | 41.4% | 39.0%(+2.40)#74 | 38.2%(+3.20)#7,687 |
| 75. | Bliss Corner | 41.3% | 39.0%(+2.30)#75 | 38.2%(+3.10)#7,796 |
| 76. | Quincy | 41.2% | 39.0%(+2.20)#76 | 38.2%(+3.00)#7,858 |
| 77. | Peabody | 41.1% | 39.0%(+2.10)#77 | 38.2%(+2.90)#7,922 |
| 78. | Needham | 41.1% | 39.0%(+2.10)#78 | 38.2%(+2.90)#7,925 |
| 79. | Northampton | 41.1% | 39.0%(+2.10)#79 | 38.2%(+2.90)#7,927 |
| 80. | Scituate | 40.9% | 39.0%(+1.90)#80 | 38.2%(+2.70)#8,119 |
| 81. | East Brookfield | 40.8% | 39.0%(+1.80)#81 | 38.2%(+2.60)#8,219 |
| 82. | Everett | 40.6% | 39.0%(+1.60)#82 | 38.2%(+2.40)#8,335 |
| 83. | Webster | 40.6% | 39.0%(+1.60)#83 | 38.2%(+2.40)#8,363 |
| 84. | Barnstable Town | 40.5% | 39.0%(+1.50)#84 | 38.2%(+2.30)#8,437 |
| 85. | Burlington | 40.4% | 39.0%(+1.40)#85 | 38.2%(+2.20)#8,584 |
| 86. | Medford | 40.1% | 39.0%(+1.10)#86 | 38.2%(+1.90)#8,873 |
| 87. | Falmouth | 40.1% | 39.0%(+1.10)#87 | 38.2%(+1.90)#8,909 |
| 88. | North Attleborough | 40.0% | 39.0%(+1.00)#88 | 38.2%(+1.80)#8,954 |
| 89. | Upton | 39.7% | 39.0%(+0.700)#89 | 38.2%(+1.50)#9,256 |
| 90. | Framingham | 39.6% | 39.0%(+0.600)#90 | 38.2%(+1.40)#9,291 |
| 91. | South Yarmouth | 39.5% | 39.0%(+0.500)#91 | 38.2%(+1.30)#9,409 |
| 92. | Cordaville | 39.5% | 39.0%(+0.500)#92 | 38.2%(+1.30)#9,437 |
| 93. | Weymouth Town | 39.4% | 39.0%(+0.400)#93 | 38.2%(+1.20)#9,526 |
| 94. | Ipswich | 39.4% | 39.0%(+0.400)#94 | 38.2%(+1.20)#9,570 |
| 95. | Chicopee | 39.2% | 39.0%(+0.200)#95 | 38.2%(+1.00)#9,756 |
| 96. | Belmont | 39.2% | 39.0%(+0.200)#96 | 38.2%(+1.00)#9,767 |
| 97. | Hull | 39.1% | 39.0%(+0.100)#97 | 38.2%(+0.900)#9,894 |
| 98. | West Yarmouth | 39.1% | 39.0%(+0.100)#98 | 38.2%(+0.900)#9,903 |
| 99. | Cambridge | 38.9% | 39.0%(-0.100)#99 | 38.2%(+0.700)#10,034 |
| 100. | Brookline | 38.9% | 39.0%(-0.100)#100 | 38.2%(+0.700)#10,038 |
Common Questions
What are the Top 10 Cities with the Highest Percentage of Population Carpooling to Work in Massachusetts?
Top 10 Cities with the Highest Percentage of Population Carpooling to Work in Massachusetts are:
#1
64.2%
#2
62.3%
#3
61.3%
#4
61.1%
#5
60.2%
#6
59.8%
#7
58.2%
#8
57.7%
#9
57.0%
#10
55.6%
What city has the Highest Percentage of Population Carpooling to Work in Massachusetts?
Sandwich has the Highest Percentage of Population Carpooling to Work in Massachusetts with 64.2%.
What is the Percentage of Population Carpooling to Work in the State of Massachusetts?
Percentage of Population Carpooling to Work in Massachusetts is 39.0%.
What is the Percentage of Population Carpooling to Work in the United States?
Percentage of Population Carpooling to Work in the United States is 38.2%.