Cities with the Highest Percentage of Population Carpooling to Work in Ohio
RELATED REPORTS & OPTIONS
Drive | Carpool
Ohio
Compare Cities
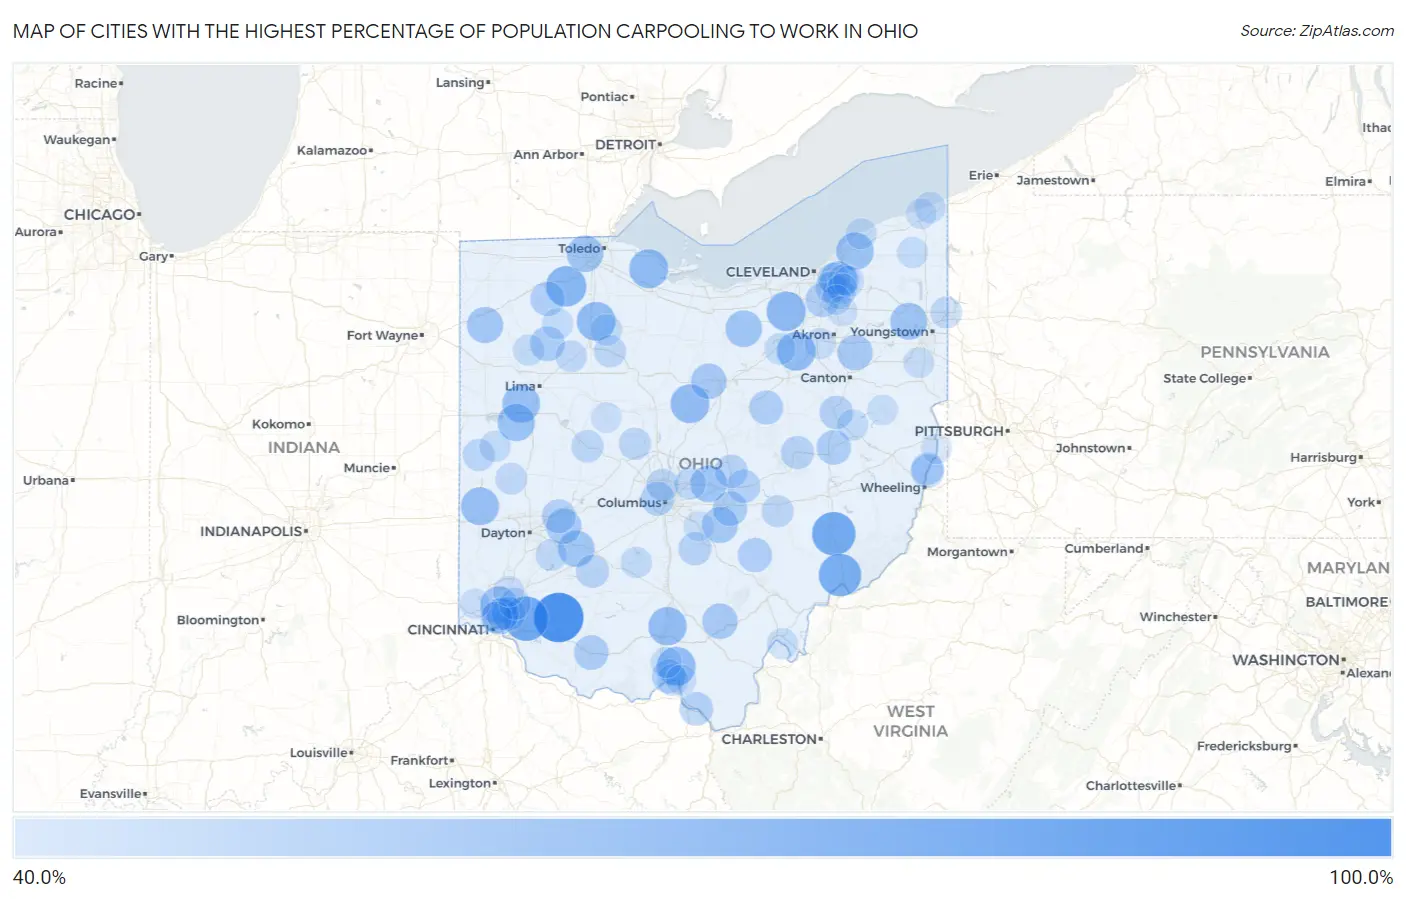
Map of Cities with the Highest Percentage of Population Carpooling to Work in Ohio
0.0%
100.0%
Cities with the Highest Percentage of Population Carpooling to Work in Ohio
| City | % Carpool | vs State | vs National | |
| 1. | Fayetteville | 81.1% | 36.5%(+44.6)#1 | 38.2%(+42.9)#8 |
| 2. | Day Heights | 72.2% | 36.5%(+35.7)#2 | 38.2%(+34.0)#41 |
| 3. | Caldwell | 70.8% | 36.5%(+34.3)#3 | 38.2%(+32.6)#50 |
| 4. | Devola | 69.1% | 36.5%(+32.6)#4 | 38.2%(+30.9)#70 |
| 5. | Grand Rapids | 65.5% | 36.5%(+29.0)#5 | 38.2%(+27.3)#141 |
| 6. | Valley City | 63.7% | 36.5%(+27.2)#6 | 38.2%(+25.5)#210 |
| 7. | Oak Harbor | 63.1% | 36.5%(+26.6)#7 | 38.2%(+24.9)#243 |
| 8. | Bairdstown | 63.1% | 36.5%(+26.6)#8 | 38.2%(+24.9)#248 |
| 9. | Clarktown | 63.0% | 36.5%(+26.5)#9 | 38.2%(+24.8)#251 |
| 10. | Candlewood Lake | 62.9% | 36.5%(+26.4)#10 | 38.2%(+24.7)#255 |
| 11. | Sterling | 62.8% | 36.5%(+26.3)#11 | 38.2%(+24.6)#261 |
| 12. | Waverly | 62.1% | 36.5%(+25.6)#12 | 38.2%(+23.9)#313 |
| 13. | Castine | 61.5% | 36.5%(+25.0)#13 | 38.2%(+23.3)#365 |
| 14. | Buckland | 61.0% | 36.5%(+24.5)#14 | 38.2%(+22.8)#421 |
| 15. | Kirtland Hills | 60.8% | 36.5%(+24.3)#15 | 38.2%(+22.6)#430 |
| 16. | Orange | 60.5% | 36.5%(+24.0)#16 | 38.2%(+22.3)#451 |
| 17. | New Knoxville | 60.5% | 36.5%(+24.0)#17 | 38.2%(+22.3)#459 |
| 18. | Glendale | 60.1% | 36.5%(+23.6)#18 | 38.2%(+21.9)#526 |
| 19. | Lordstown | 59.7% | 36.5%(+23.2)#19 | 38.2%(+21.5)#563 |
| 20. | Alexandria | 59.5% | 36.5%(+23.0)#20 | 38.2%(+21.3)#592 |
| 21. | Rochester | 59.3% | 36.5%(+22.8)#21 | 38.2%(+21.1)#641 |
| 22. | Holland | 59.2% | 36.5%(+22.7)#22 | 38.2%(+21.0)#647 |
| 23. | Shawnee Hills | 59.0% | 36.5%(+22.5)#23 | 38.2%(+20.8)#671 |
| 24. | Paulding | 58.6% | 36.5%(+22.1)#24 | 38.2%(+20.4)#699 |
| 25. | Golf Manor | 58.3% | 36.5%(+21.8)#25 | 38.2%(+20.1)#753 |
| 26. | Pleasantville | 58.2% | 36.5%(+21.7)#26 | 38.2%(+20.0)#794 |
| 27. | Ontario | 57.5% | 36.5%(+21.0)#27 | 38.2%(+19.3)#860 |
| 28. | Hamden | 57.5% | 36.5%(+21.0)#28 | 38.2%(+19.3)#867 |
| 29. | Hartville | 57.4% | 36.5%(+20.9)#29 | 38.2%(+19.2)#881 |
| 30. | Yellow Springs | 57.2% | 36.5%(+20.7)#30 | 38.2%(+19.0)#915 |
| 31. | Ottawa | 56.3% | 36.5%(+19.8)#31 | 38.2%(+18.1)#1,069 |
| 32. | Winchester | 56.1% | 36.5%(+19.6)#32 | 38.2%(+17.9)#1,136 |
| 33. | Thornport | 55.9% | 36.5%(+19.4)#33 | 38.2%(+17.7)#1,173 |
| 34. | Port Washington | 55.8% | 36.5%(+19.3)#34 | 38.2%(+17.6)#1,193 |
| 35. | Shawnee | 55.5% | 36.5%(+19.0)#35 | 38.2%(+17.3)#1,248 |
| 36. | Brecksville | 55.4% | 36.5%(+18.9)#36 | 38.2%(+17.2)#1,264 |
| 37. | Malinta | 55.4% | 36.5%(+18.9)#37 | 38.2%(+17.2)#1,276 |
| 38. | Nashville | 55.0% | 36.5%(+18.5)#38 | 38.2%(+16.8)#1,371 |
| 39. | Enon | 54.9% | 36.5%(+18.4)#39 | 38.2%(+16.7)#1,379 |
| 40. | Kenwood | 54.8% | 36.5%(+18.3)#40 | 38.2%(+16.6)#1,395 |
| 41. | Marble Cliff | 54.8% | 36.5%(+18.3)#41 | 38.2%(+16.6)#1,402 |
| 42. | Rosemount | 54.7% | 36.5%(+18.2)#42 | 38.2%(+16.5)#1,417 |
| 43. | Hanging Rock | 54.5% | 36.5%(+18.0)#43 | 38.2%(+16.3)#1,477 |
| 44. | Parral | 54.2% | 36.5%(+17.7)#44 | 38.2%(+16.0)#1,564 |
| 45. | Marne | 54.0% | 36.5%(+17.5)#45 | 38.2%(+15.8)#1,611 |
| 46. | Tiltonsville | 53.9% | 36.5%(+17.4)#46 | 38.2%(+15.7)#1,620 |
| 47. | Sharon Center | 53.8% | 36.5%(+17.3)#47 | 38.2%(+15.6)#1,630 |
| 48. | St Louisville | 53.8% | 36.5%(+17.3)#48 | 38.2%(+15.6)#1,639 |
| 49. | Sabina | 53.6% | 36.5%(+17.1)#49 | 38.2%(+15.4)#1,667 |
| 50. | Amanda | 53.5% | 36.5%(+17.0)#50 | 38.2%(+15.3)#1,698 |
| 51. | Canal Lewisville | 53.5% | 36.5%(+17.0)#51 | 38.2%(+15.3)#1,700 |
| 52. | Amberley | 53.2% | 36.5%(+16.7)#52 | 38.2%(+15.0)#1,794 |
| 53. | Rayland | 52.5% | 36.5%(+16.0)#53 | 38.2%(+14.3)#1,957 |
| 54. | Riverlea | 52.4% | 36.5%(+15.9)#54 | 38.2%(+14.2)#1,984 |
| 55. | Glenwillow | 52.3% | 36.5%(+15.8)#55 | 38.2%(+14.1)#2,011 |
| 56. | Zanesfield | 52.3% | 36.5%(+15.8)#56 | 38.2%(+14.1)#2,025 |
| 57. | Rossburg | 52.2% | 36.5%(+15.7)#57 | 38.2%(+14.0)#2,051 |
| 58. | Highland Hills | 52.1% | 36.5%(+15.6)#58 | 38.2%(+13.9)#2,082 |
| 59. | Vanlue | 52.1% | 36.5%(+15.6)#59 | 38.2%(+13.9)#2,084 |
| 60. | Bedford | 52.0% | 36.5%(+15.5)#60 | 38.2%(+13.8)#2,088 |
| 61. | South Zanesville | 52.0% | 36.5%(+15.5)#61 | 38.2%(+13.8)#2,099 |
| 62. | Magnetic Springs | 52.0% | 36.5%(+15.5)#62 | 38.2%(+13.8)#2,112 |
| 63. | Sixteen Mile Stand | 51.5% | 36.5%(+15.0)#63 | 38.2%(+13.3)#2,217 |
| 64. | Covington | 51.5% | 36.5%(+15.0)#64 | 38.2%(+13.3)#2,220 |
| 65. | New Albany | 51.3% | 36.5%(+14.8)#65 | 38.2%(+13.1)#2,291 |
| 66. | Elmwood Place | 51.3% | 36.5%(+14.8)#66 | 38.2%(+13.1)#2,305 |
| 67. | West Hill | 51.3% | 36.5%(+14.8)#67 | 38.2%(+13.1)#2,306 |
| 68. | Spring Valley | 51.3% | 36.5%(+14.8)#68 | 38.2%(+13.1)#2,319 |
| 69. | Mount Cory | 51.3% | 36.5%(+14.8)#69 | 38.2%(+13.1)#2,325 |
| 70. | New Boston | 51.2% | 36.5%(+14.7)#70 | 38.2%(+13.0)#2,345 |
| 71. | Burbank | 51.1% | 36.5%(+14.6)#71 | 38.2%(+12.9)#2,406 |
| 72. | Kalida | 51.0% | 36.5%(+14.5)#72 | 38.2%(+12.8)#2,417 |
| 73. | Arcadia | 51.0% | 36.5%(+14.5)#73 | 38.2%(+12.8)#2,428 |
| 74. | West Logan | 51.0% | 36.5%(+14.5)#74 | 38.2%(+12.8)#2,432 |
| 75. | Moreland Hills | 50.8% | 36.5%(+14.3)#75 | 38.2%(+12.6)#2,474 |
| 76. | Osgood | 50.8% | 36.5%(+14.3)#76 | 38.2%(+12.6)#2,497 |
| 77. | Roswell | 50.8% | 36.5%(+14.3)#77 | 38.2%(+12.6)#2,502 |
| 78. | New Holland | 50.7% | 36.5%(+14.2)#78 | 38.2%(+12.5)#2,525 |
| 79. | Pekin | 50.6% | 36.5%(+14.1)#79 | 38.2%(+12.4)#2,547 |
| 80. | Syracuse | 50.5% | 36.5%(+14.0)#80 | 38.2%(+12.3)#2,593 |
| 81. | Belmore | 50.5% | 36.5%(+14.0)#81 | 38.2%(+12.3)#2,626 |
| 82. | Fairport Harbor | 50.4% | 36.5%(+13.9)#82 | 38.2%(+12.2)#2,635 |
| 83. | Roaming Shores | 50.4% | 36.5%(+13.9)#83 | 38.2%(+12.2)#2,639 |
| 84. | North Kingsville | 50.3% | 36.5%(+13.8)#84 | 38.2%(+12.1)#2,678 |
| 85. | Lucasville | 50.3% | 36.5%(+13.8)#85 | 38.2%(+12.1)#2,684 |
| 86. | Norton | 50.1% | 36.5%(+13.6)#86 | 38.2%(+11.9)#2,755 |
| 87. | North Industry | 50.1% | 36.5%(+13.6)#87 | 38.2%(+11.9)#2,773 |
| 88. | Wetherington | 50.1% | 36.5%(+13.6)#88 | 38.2%(+11.9)#2,777 |
| 89. | Chagrin Falls | 49.9% | 36.5%(+13.4)#89 | 38.2%(+11.7)#2,827 |
| 90. | Washingtonville | 49.8% | 36.5%(+13.3)#90 | 38.2%(+11.6)#2,864 |
| 91. | Carrollton | 49.6% | 36.5%(+13.1)#91 | 38.2%(+11.4)#2,905 |
| 92. | Sciotodale | 49.6% | 36.5%(+13.1)#92 | 38.2%(+11.4)#2,920 |
| 93. | Edgewood | 49.5% | 36.5%(+13.0)#93 | 38.2%(+11.3)#2,938 |
| 94. | Mount Victory | 49.5% | 36.5%(+13.0)#94 | 38.2%(+11.3)#2,963 |
| 95. | New Baltimore | 49.3% | 36.5%(+12.8)#95 | 38.2%(+11.1)#3,061 |
| 96. | Solon | 49.2% | 36.5%(+12.7)#96 | 38.2%(+11.0)#3,092 |
| 97. | Mingo Junction | 49.1% | 36.5%(+12.6)#97 | 38.2%(+10.9)#3,139 |
| 98. | Carroll | 49.1% | 36.5%(+12.6)#98 | 38.2%(+10.9)#3,170 |
| 99. | Hudson | 48.9% | 36.5%(+12.4)#99 | 38.2%(+10.7)#3,206 |
| 100. | Macedonia | 48.8% | 36.5%(+12.3)#100 | 38.2%(+10.6)#3,237 |
Common Questions
What are the Top 10 Cities with the Highest Percentage of Population Carpooling to Work in Ohio?
Top 10 Cities with the Highest Percentage of Population Carpooling to Work in Ohio are:
#1
81.1%
#2
72.2%
#3
70.8%
#4
69.1%
#5
65.5%
#6
63.7%
#7
63.1%
#8
63.1%
#9
63.0%
#10
62.9%
What city has the Highest Percentage of Population Carpooling to Work in Ohio?
Fayetteville has the Highest Percentage of Population Carpooling to Work in Ohio with 81.1%.
What is the Percentage of Population Carpooling to Work in the State of Ohio?
Percentage of Population Carpooling to Work in Ohio is 36.5%.
What is the Percentage of Population Carpooling to Work in the United States?
Percentage of Population Carpooling to Work in the United States is 38.2%.