Cities with the Highest Percentage of Population Carpooling to Work in Arizona
RELATED REPORTS & OPTIONS
Drive | Carpool
Arizona
Compare Cities
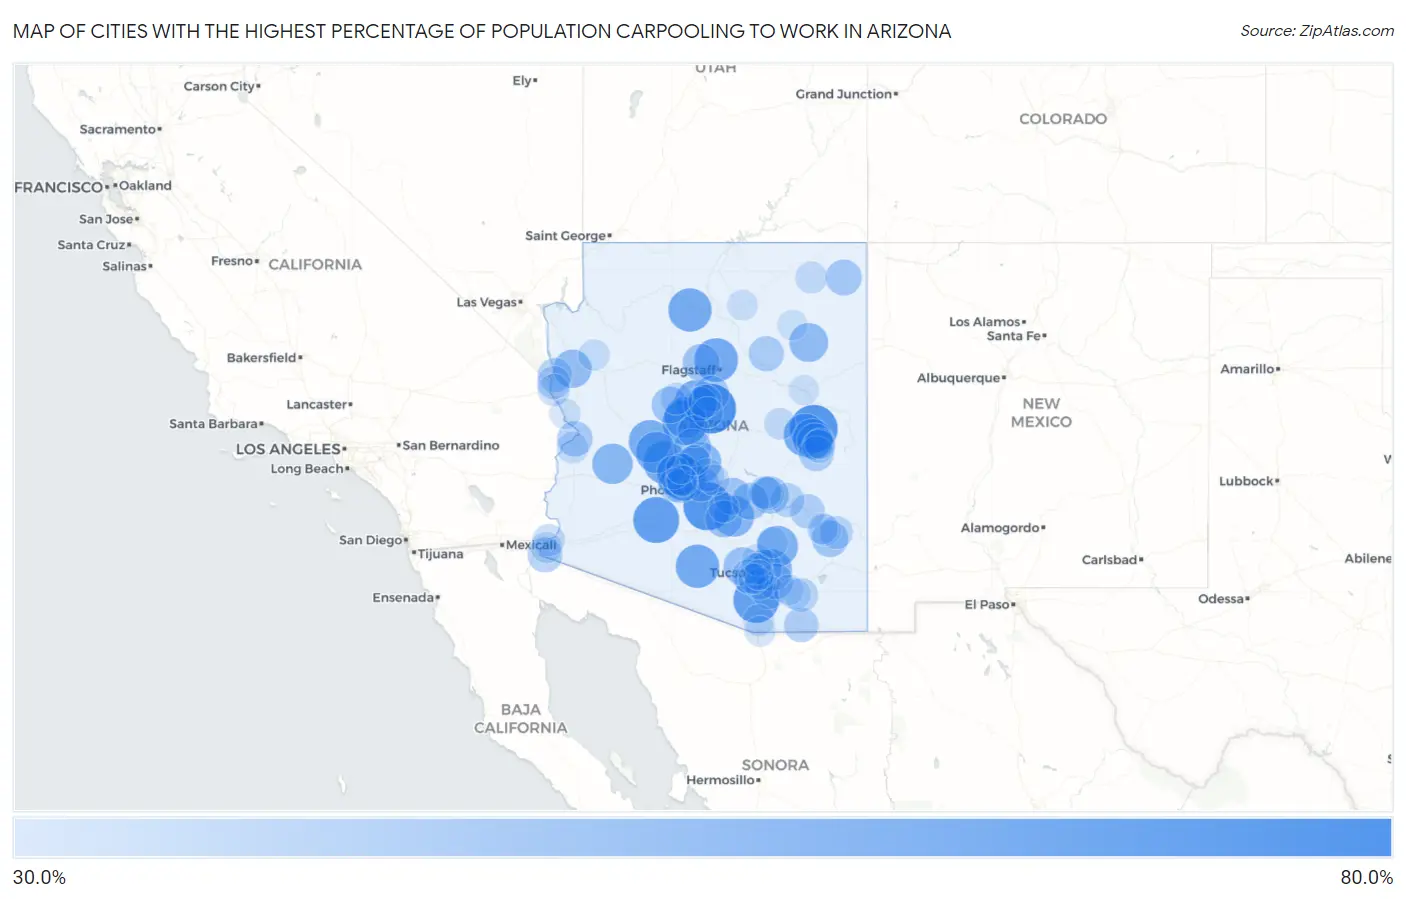
Map of Cities with the Highest Percentage of Population Carpooling to Work in Arizona
0.0%
80.0%
Cities with the Highest Percentage of Population Carpooling to Work in Arizona
| City | % Carpool | vs State | vs National | |
| 1. | Lake Montezuma | 70.1% | 36.6%(+33.5)#1 | 38.2%(+31.9)#58 |
| 2. | Sun Lakes | 67.6% | 36.6%(+31.0)#2 | 38.2%(+29.4)#92 |
| 3. | White Mountain Lake | 67.3% | 36.6%(+30.7)#3 | 38.2%(+29.1)#103 |
| 4. | Gila Bend | 64.2% | 36.6%(+27.6)#4 | 38.2%(+26.0)#188 |
| 5. | Green Valley | 64.0% | 36.6%(+27.4)#5 | 38.2%(+25.8)#199 |
| 6. | Blue Ridge | 63.8% | 36.6%(+27.2)#6 | 38.2%(+25.6)#205 |
| 7. | Mayer | 62.4% | 36.6%(+25.8)#7 | 38.2%(+24.2)#286 |
| 8. | Sun City West | 61.4% | 36.6%(+24.8)#8 | 38.2%(+23.2)#367 |
| 9. | Sun City | 60.9% | 36.6%(+24.3)#9 | 38.2%(+22.7)#424 |
| 10. | Fort Valley | 60.3% | 36.6%(+23.7)#10 | 38.2%(+22.1)#487 |
| 11. | Santa Rosa | 59.9% | 36.6%(+23.3)#11 | 38.2%(+21.7)#548 |
| 12. | Grand Canyon Village | 59.8% | 36.6%(+23.2)#12 | 38.2%(+21.6)#552 |
| 13. | Morristown | 59.6% | 36.6%(+23.0)#13 | 38.2%(+21.4)#574 |
| 14. | Linden | 58.9% | 36.6%(+22.3)#14 | 38.2%(+20.7)#684 |
| 15. | Clarkdale | 58.5% | 36.6%(+21.9)#15 | 38.2%(+20.3)#710 |
| 16. | Congress | 58.5% | 36.6%(+21.9)#16 | 38.2%(+20.3)#716 |
| 17. | Tanque Verde | 56.8% | 36.6%(+20.2)#17 | 38.2%(+18.6)#979 |
| 18. | Wickenburg | 56.4% | 36.6%(+19.8)#18 | 38.2%(+18.2)#1,044 |
| 19. | Dewey Humboldt | 56.3% | 36.6%(+19.7)#19 | 38.2%(+18.1)#1,070 |
| 20. | San Manuel | 56.2% | 36.6%(+19.6)#20 | 38.2%(+18.0)#1,107 |
| 21. | Florence | 55.7% | 36.6%(+19.1)#21 | 38.2%(+17.5)#1,204 |
| 22. | Wenden | 55.1% | 36.6%(+18.5)#22 | 38.2%(+16.9)#1,349 |
| 23. | Cave Creek | 54.8% | 36.6%(+18.2)#23 | 38.2%(+16.6)#1,396 |
| 24. | Wagon Wheel | 54.3% | 36.6%(+17.7)#24 | 38.2%(+16.1)#1,512 |
| 25. | Whitecone | 52.7% | 36.6%(+16.1)#25 | 38.2%(+14.5)#1,909 |
| 26. | Golden Valley | 51.6% | 36.6%(+15.0)#26 | 38.2%(+13.4)#2,189 |
| 27. | Picture Rocks | 50.9% | 36.6%(+14.3)#27 | 38.2%(+12.7)#2,447 |
| 28. | Black Canyon City | 50.5% | 36.6%(+13.9)#28 | 38.2%(+12.3)#2,563 |
| 29. | Globe | 50.1% | 36.6%(+13.5)#29 | 38.2%(+11.9)#2,760 |
| 30. | Gold Canyon | 49.5% | 36.6%(+12.9)#30 | 38.2%(+11.3)#2,932 |
| 31. | Blackwater | 49.5% | 36.6%(+12.9)#31 | 38.2%(+11.3)#2,944 |
| 32. | Parks | 49.5% | 36.6%(+12.9)#32 | 38.2%(+11.3)#2,949 |
| 33. | Superior | 49.1% | 36.6%(+12.5)#33 | 38.2%(+10.9)#3,142 |
| 34. | Williamson | 49.0% | 36.6%(+12.4)#34 | 38.2%(+10.8)#3,179 |
| 35. | Swift Trail Junction | 48.6% | 36.6%(+12.0)#35 | 38.2%(+10.4)#3,333 |
| 36. | Pinetop Lakeside | 47.9% | 36.6%(+11.3)#36 | 38.2%(+9.70)#3,651 |
| 37. | Round Rock | 47.9% | 36.6%(+11.3)#37 | 38.2%(+9.70)#3,665 |
| 38. | Catalina Foothills | 47.8% | 36.6%(+11.2)#38 | 38.2%(+9.60)#3,673 |
| 39. | Sedona | 47.6% | 36.6%(+11.0)#39 | 38.2%(+9.40)#3,755 |
| 40. | Rincon Valley | 47.6% | 36.6%(+11.0)#40 | 38.2%(+9.40)#3,765 |
| 41. | Paradise Valley | 47.4% | 36.6%(+10.8)#41 | 38.2%(+9.20)#3,887 |
| 42. | Cienega Springs | 46.9% | 36.6%(+10.3)#42 | 38.2%(+8.70)#4,166 |
| 43. | Tolani Lake | 46.5% | 36.6%(+9.90)#43 | 38.2%(+8.30)#4,340 |
| 44. | North Fork | 46.1% | 36.6%(+9.50)#44 | 38.2%(+7.90)#4,550 |
| 45. | San Luis | 45.9% | 36.6%(+9.30)#45 | 38.2%(+7.70)#4,628 |
| 46. | Sierra Vista Southeast | 45.4% | 36.6%(+8.80)#46 | 38.2%(+7.20)#4,916 |
| 47. | Bylas | 45.3% | 36.6%(+8.70)#47 | 38.2%(+7.10)#5,001 |
| 48. | Bullhead City | 45.2% | 36.6%(+8.60)#48 | 38.2%(+7.00)#5,030 |
| 49. | Anthem | 44.7% | 36.6%(+8.10)#49 | 38.2%(+6.50)#5,284 |
| 50. | Tucson Estates | 44.7% | 36.6%(+8.10)#50 | 38.2%(+6.50)#5,286 |
| 51. | Peridot | 44.5% | 36.6%(+7.90)#51 | 38.2%(+6.30)#5,431 |
| 52. | Citrus Park | 44.3% | 36.6%(+7.70)#52 | 38.2%(+6.10)#5,564 |
| 53. | Tucson Mountains | 44.2% | 36.6%(+7.60)#53 | 38.2%(+6.00)#5,626 |
| 54. | Litchfield Park | 44.2% | 36.6%(+7.60)#54 | 38.2%(+6.00)#5,633 |
| 55. | Cottonwood | 44.1% | 36.6%(+7.50)#55 | 38.2%(+5.90)#5,685 |
| 56. | Central Heights Midland City | 43.8% | 36.6%(+7.20)#56 | 38.2%(+5.60)#5,865 |
| 57. | St David | 43.8% | 36.6%(+7.20)#57 | 38.2%(+5.60)#5,878 |
| 58. | Surprise | 43.7% | 36.6%(+7.10)#58 | 38.2%(+5.50)#5,911 |
| 59. | Scottsdale | 43.5% | 36.6%(+6.90)#59 | 38.2%(+5.30)#6,026 |
| 60. | Corona De Tucson | 43.4% | 36.6%(+6.80)#60 | 38.2%(+5.20)#6,139 |
| 61. | Circle | 43.4% | 36.6%(+6.80)#61 | 38.2%(+5.20)#6,181 |
| 62. | San Jose | 43.4% | 36.6%(+6.80)#62 | 38.2%(+5.20)#6,183 |
| 63. | Fort Mohave | 43.2% | 36.6%(+6.60)#63 | 38.2%(+5.00)#6,298 |
| 64. | Cornville | 43.2% | 36.6%(+6.60)#64 | 38.2%(+5.00)#6,319 |
| 65. | Hondah | 42.7% | 36.6%(+6.10)#65 | 38.2%(+4.50)#6,661 |
| 66. | Claypool | 42.4% | 36.6%(+5.80)#66 | 38.2%(+4.20)#6,906 |
| 67. | Avenue B And C | 41.8% | 36.6%(+5.20)#67 | 38.2%(+3.60)#7,324 |
| 68. | Mohave Valley | 41.5% | 36.6%(+4.90)#68 | 38.2%(+3.30)#7,602 |
| 69. | Cordes Lakes | 41.4% | 36.6%(+4.80)#69 | 38.2%(+3.20)#7,724 |
| 70. | Chilchinbito | 41.4% | 36.6%(+4.80)#70 | 38.2%(+3.20)#7,752 |
| 71. | Chino Valley | 41.3% | 36.6%(+4.70)#71 | 38.2%(+3.10)#7,782 |
| 72. | Parker | 41.3% | 36.6%(+4.70)#72 | 38.2%(+3.10)#7,809 |
| 73. | Heber Overgaard | 41.1% | 36.6%(+4.50)#73 | 38.2%(+2.90)#7,970 |
| 74. | Valencia West | 41.0% | 36.6%(+4.40)#74 | 38.2%(+2.80)#8,022 |
| 75. | Central | 41.0% | 36.6%(+4.40)#75 | 38.2%(+2.80)#8,073 |
| 76. | Benson | 40.9% | 36.6%(+4.30)#76 | 38.2%(+2.70)#8,120 |
| 77. | Summit | 40.9% | 36.6%(+4.30)#77 | 38.2%(+2.70)#8,124 |
| 78. | Oro Valley | 40.7% | 36.6%(+4.10)#78 | 38.2%(+2.50)#8,257 |
| 79. | Flowing Wells | 40.7% | 36.6%(+4.10)#79 | 38.2%(+2.50)#8,266 |
| 80. | Rio Rico | 40.6% | 36.6%(+4.00)#80 | 38.2%(+2.40)#8,346 |
| 81. | Somerton | 40.6% | 36.6%(+4.00)#81 | 38.2%(+2.40)#8,359 |
| 82. | Valle Vista | 40.5% | 36.6%(+3.90)#82 | 38.2%(+2.30)#8,494 |
| 83. | Mammoth | 40.1% | 36.6%(+3.50)#83 | 38.2%(+1.90)#8,932 |
| 84. | Pima | 39.9% | 36.6%(+3.30)#84 | 38.2%(+1.70)#9,078 |
| 85. | Fountain Hills | 39.8% | 36.6%(+3.20)#85 | 38.2%(+1.60)#9,104 |
| 86. | Camp Verde | 39.8% | 36.6%(+3.20)#86 | 38.2%(+1.60)#9,114 |
| 87. | El Mirage | 39.7% | 36.6%(+3.10)#87 | 38.2%(+1.50)#9,213 |
| 88. | Nogales | 39.7% | 36.6%(+3.10)#88 | 38.2%(+1.50)#9,223 |
| 89. | Tuba City | 39.6% | 36.6%(+3.00)#89 | 38.2%(+1.40)#9,319 |
| 90. | New River | 39.5% | 36.6%(+2.90)#90 | 38.2%(+1.30)#9,401 |
| 91. | Desert Hills | 39.4% | 36.6%(+2.80)#91 | 38.2%(+1.20)#9,586 |
| 92. | Youngtown | 39.2% | 36.6%(+2.60)#92 | 38.2%(+1.00)#9,795 |
| 93. | Mescal | 39.2% | 36.6%(+2.60)#93 | 38.2%(+1.00)#9,822 |
| 94. | Drexel Heights | 39.1% | 36.6%(+2.50)#94 | 38.2%(+0.900)#9,873 |
| 95. | Pinetop Country Club | 39.1% | 36.6%(+2.50)#95 | 38.2%(+0.900)#9,926 |
| 96. | First Mesa | 39.1% | 36.6%(+2.50)#96 | 38.2%(+0.900)#9,933 |
| 97. | Holbrook | 38.9% | 36.6%(+2.30)#97 | 38.2%(+0.700)#10,078 |
| 98. | Peoria | 38.8% | 36.6%(+2.20)#98 | 38.2%(+0.600)#10,135 |
| 99. | San Tan Valley | 38.8% | 36.6%(+2.20)#99 | 38.2%(+0.600)#10,137 |
| 100. | South Tucson | 38.6% | 36.6%(+2.00)#100 | 38.2%(+0.400)#10,385 |
Common Questions
What are the Top 10 Cities with the Highest Percentage of Population Carpooling to Work in Arizona?
Top 10 Cities with the Highest Percentage of Population Carpooling to Work in Arizona are:
#1
70.1%
#2
67.6%
#3
67.3%
#4
64.2%
#5
64.0%
#6
62.4%
#7
61.4%
#8
60.9%
#9
60.3%
#10
59.9%
What city has the Highest Percentage of Population Carpooling to Work in Arizona?
Lake Montezuma has the Highest Percentage of Population Carpooling to Work in Arizona with 70.1%.
What is the Percentage of Population Carpooling to Work in the State of Arizona?
Percentage of Population Carpooling to Work in Arizona is 36.6%.
What is the Percentage of Population Carpooling to Work in the United States?
Percentage of Population Carpooling to Work in the United States is 38.2%.