Cities with the Highest Percentage of Local Government Employees in New York
RELATED REPORTS & OPTIONS
Local Government Employees
New York
Compare Cities
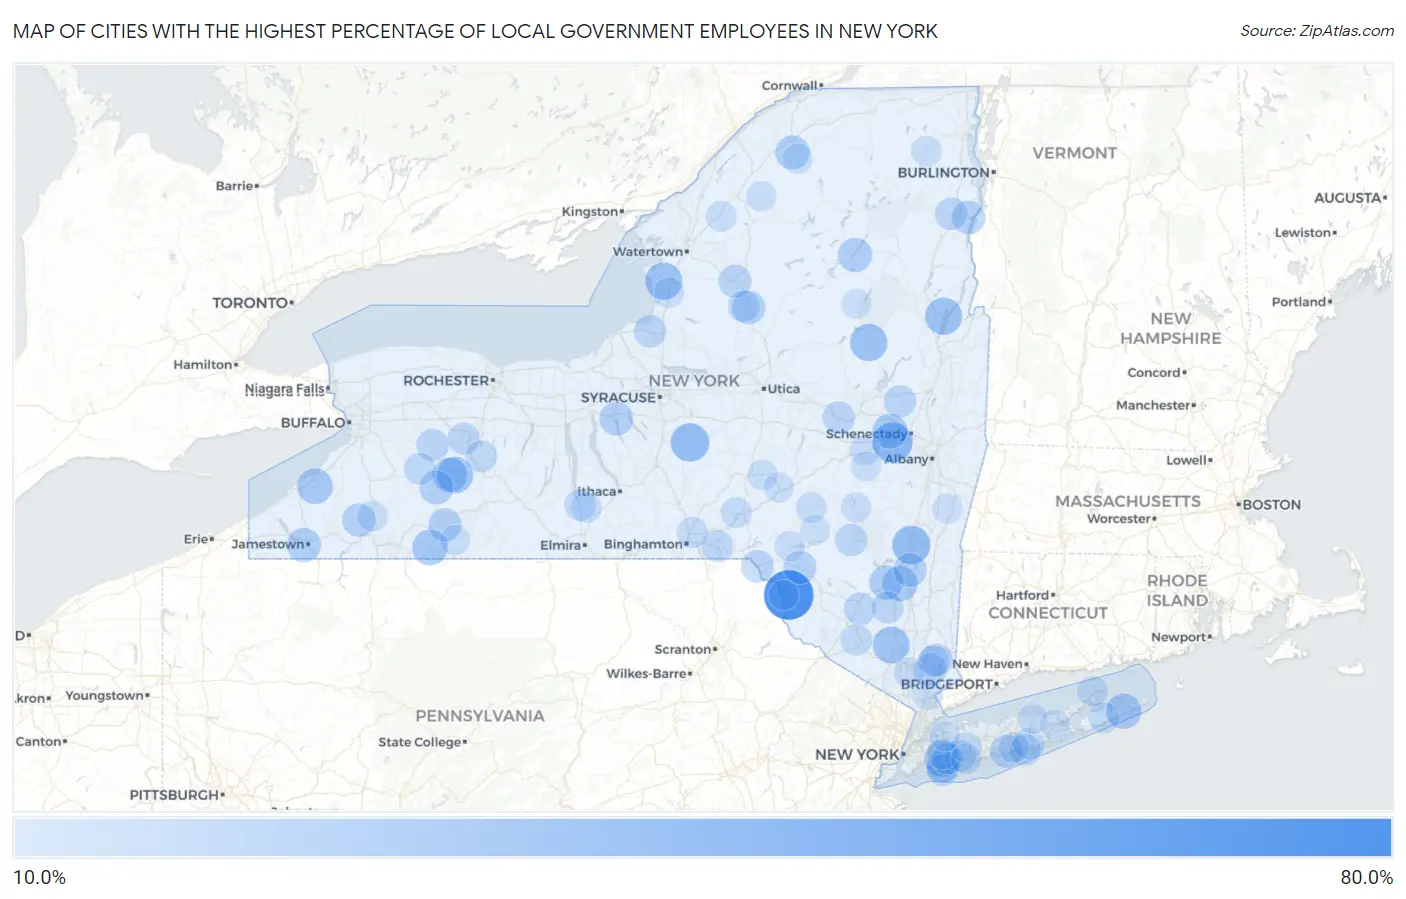
Map of Cities with the Highest Percentage of Local Government Employees in New York
0.0%
80.0%
Cities with the Highest Percentage of Local Government Employees in New York
| City | % Local Government Employees | vs State | vs National | |
| 1. | Hortonville | 64.3% | 9.9%(+54.4)#1 | 7.2%(+57.1)#140 |
| 2. | Duane Lake | 42.1% | 9.9%(+32.2)#2 | 7.2%(+34.9)#430 |
| 3. | Brooktondale | 38.5% | 9.9%(+28.6)#3 | 7.2%(+31.3)#507 |
| 4. | Deruyter | 38.5% | 9.9%(+28.6)#4 | 7.2%(+31.2)#508 |
| 5. | Malden On Hudson | 38.0% | 9.9%(+28.1)#5 | 7.2%(+30.8)#529 |
| 6. | Wells | 35.5% | 9.9%(+25.6)#6 | 7.2%(+28.3)#627 |
| 7. | Belleville | 35.3% | 9.9%(+25.4)#7 | 7.2%(+28.1)#632 |
| 8. | Bolton Landing | 35.3% | 9.9%(+25.4)#8 | 7.2%(+28.0)#639 |
| 9. | Salisbury Mills | 34.5% | 9.9%(+24.6)#9 | 7.2%(+27.3)#672 |
| 10. | Cadyville | 34.5% | 9.9%(+24.6)#10 | 7.2%(+27.3)#673 |
| 11. | Dalton | 33.5% | 9.9%(+23.6)#11 | 7.2%(+26.3)#703 |
| 12. | Haines Falls | 33.3% | 9.9%(+23.5)#12 | 7.2%(+26.1)#713 |
| 13. | Malverne Park Oaks | 33.0% | 9.9%(+23.1)#13 | 7.2%(+25.7)#751 |
| 14. | Bolivar | 31.9% | 9.9%(+22.0)#14 | 7.2%(+24.7)#791 |
| 15. | Forestville | 31.5% | 9.9%(+21.6)#15 | 7.2%(+24.2)#812 |
| 16. | Napeague | 31.3% | 9.9%(+21.5)#16 | 7.2%(+24.1)#822 |
| 17. | Rifton | 31.1% | 9.9%(+21.2)#17 | 7.2%(+23.8)#834 |
| 18. | Mariaville Lake | 30.5% | 9.9%(+20.7)#18 | 7.2%(+23.3)#880 |
| 19. | Ruby | 30.2% | 9.9%(+20.4)#19 | 7.2%(+23.0)#893 |
| 20. | Salisbury Center | 30.2% | 9.9%(+20.3)#20 | 7.2%(+22.9)#894 |
| 21. | Hunt | 30.0% | 9.9%(+20.1)#21 | 7.2%(+22.8)#900 |
| 22. | Long Lake | 28.8% | 9.9%(+19.0)#22 | 7.2%(+21.6)#966 |
| 23. | Conesus | 28.8% | 9.9%(+18.9)#23 | 7.2%(+21.6)#968 |
| 24. | Jamestown West | 28.7% | 9.9%(+18.8)#24 | 7.2%(+21.5)#971 |
| 25. | Stone Ridge | 28.6% | 9.9%(+18.8)#25 | 7.2%(+21.4)#976 |
| 26. | Hannawa Falls | 28.3% | 9.9%(+18.5)#26 | 7.2%(+21.1)#1,004 |
| 27. | Fillmore | 28.0% | 9.9%(+18.1)#27 | 7.2%(+20.8)#1,021 |
| 28. | Melrose Park | 27.7% | 9.9%(+17.8)#28 | 7.2%(+20.4)#1,047 |
| 29. | Rhinecliff | 27.2% | 9.9%(+17.3)#29 | 7.2%(+20.0)#1,088 |
| 30. | Lyons Falls | 27.0% | 9.9%(+17.1)#30 | 7.2%(+19.7)#1,111 |
| 31. | Westport | 27.0% | 9.9%(+17.1)#31 | 7.2%(+19.7)#1,112 |
| 32. | Little Valley | 26.7% | 9.9%(+16.8)#32 | 7.2%(+19.5)#1,131 |
| 33. | Belmont | 26.7% | 9.9%(+16.8)#33 | 7.2%(+19.4)#1,133 |
| 34. | Round Top | 26.6% | 9.9%(+16.8)#34 | 7.2%(+19.4)#1,143 |
| 35. | Copake | 26.2% | 9.9%(+16.3)#35 | 7.2%(+19.0)#1,179 |
| 36. | Roscoe | 26.2% | 9.9%(+16.3)#36 | 7.2%(+18.9)#1,184 |
| 37. | West Sayville | 25.8% | 9.9%(+16.0)#37 | 7.2%(+18.6)#1,207 |
| 38. | Lowville | 25.7% | 9.9%(+15.9)#38 | 7.2%(+18.5)#1,218 |
| 39. | Yorktown Heights | 25.6% | 9.9%(+15.8)#39 | 7.2%(+18.4)#1,227 |
| 40. | Lincolndale | 25.4% | 9.9%(+15.5)#40 | 7.2%(+18.1)#1,251 |
| 41. | Bay Park | 25.2% | 9.9%(+15.4)#41 | 7.2%(+18.0)#1,261 |
| 42. | Hancock | 25.2% | 9.9%(+15.3)#42 | 7.2%(+17.9)#1,265 |
| 43. | Elizabethtown | 25.0% | 9.9%(+15.1)#43 | 7.2%(+17.8)#1,274 |
| 44. | Pine Hill | 24.9% | 9.9%(+15.0)#44 | 7.2%(+17.6)#1,321 |
| 45. | Palatine Bridge | 24.8% | 9.9%(+15.0)#45 | 7.2%(+17.6)#1,323 |
| 46. | Cragsmoor | 24.8% | 9.9%(+14.9)#46 | 7.2%(+17.5)#1,330 |
| 47. | Mexico | 24.7% | 9.9%(+14.9)#47 | 7.2%(+17.5)#1,336 |
| 48. | Galway | 24.7% | 9.9%(+14.8)#48 | 7.2%(+17.4)#1,342 |
| 49. | Lake Delta | 24.6% | 9.9%(+14.8)#49 | 7.2%(+17.4)#1,348 |
| 50. | Warsaw | 24.5% | 9.9%(+14.6)#50 | 7.2%(+17.2)#1,365 |
| 51. | Cuylerville | 24.2% | 9.9%(+14.3)#51 | 7.2%(+16.9)#1,386 |
| 52. | Gardiner | 23.8% | 9.9%(+13.9)#52 | 7.2%(+16.6)#1,424 |
| 53. | Bliss | 23.6% | 9.9%(+13.8)#53 | 7.2%(+16.4)#1,439 |
| 54. | Harbor Isle | 23.6% | 9.9%(+13.7)#54 | 7.2%(+16.4)#1,440 |
| 55. | Brewster Heights | 23.5% | 9.9%(+13.7)#55 | 7.2%(+16.3)#1,451 |
| 56. | Windsor | 23.4% | 9.9%(+13.5)#56 | 7.2%(+16.2)#1,468 |
| 57. | Scottsburg | 23.3% | 9.9%(+13.4)#57 | 7.2%(+16.0)#1,490 |
| 58. | Shenorock | 23.2% | 9.9%(+13.3)#58 | 7.2%(+15.9)#1,500 |
| 59. | Turin | 23.1% | 9.9%(+13.2)#59 | 7.2%(+15.8)#1,510 |
| 60. | Bellport | 23.0% | 9.9%(+13.1)#60 | 7.2%(+15.8)#1,527 |
| 61. | Slaterville Springs | 22.8% | 9.9%(+13.0)#61 | 7.2%(+15.6)#1,548 |
| 62. | North Wantagh | 22.8% | 9.9%(+12.9)#62 | 7.2%(+15.5)#1,556 |
| 63. | Brookhaven | 22.6% | 9.9%(+12.7)#63 | 7.2%(+15.4)#1,577 |
| 64. | Washington Heights | 22.5% | 9.9%(+12.6)#64 | 7.2%(+15.3)#1,597 |
| 65. | South Hempstead | 22.4% | 9.9%(+12.5)#65 | 7.2%(+15.2)#1,613 |
| 66. | Montour Falls | 22.3% | 9.9%(+12.5)#66 | 7.2%(+15.1)#1,629 |
| 67. | Wainscott | 21.8% | 9.9%(+11.9)#67 | 7.2%(+14.5)#1,720 |
| 68. | Chenango Bridge | 21.7% | 9.9%(+11.9)#68 | 7.2%(+14.5)#1,726 |
| 69. | Bainbridge | 21.7% | 9.9%(+11.9)#69 | 7.2%(+14.5)#1,727 |
| 70. | Antwerp | 21.3% | 9.9%(+11.5)#70 | 7.2%(+14.1)#1,790 |
| 71. | Garden City South | 21.2% | 9.9%(+11.3)#71 | 7.2%(+14.0)#1,807 |
| 72. | Odessa | 21.1% | 9.9%(+11.2)#72 | 7.2%(+13.8)#1,841 |
| 73. | Blue Point | 21.0% | 9.9%(+11.1)#73 | 7.2%(+13.8)#1,857 |
| 74. | North Granville | 20.9% | 9.9%(+11.1)#74 | 7.2%(+13.7)#1,860 |
| 75. | Bloomville | 20.8% | 9.9%(+11.0)#75 | 7.2%(+13.6)#1,880 |
| 76. | Massapequa Park | 20.8% | 9.9%(+11.0)#76 | 7.2%(+13.6)#1,892 |
| 77. | Redford | 20.7% | 9.9%(+10.9)#77 | 7.2%(+13.5)#1,908 |
| 78. | East Marion | 20.7% | 9.9%(+10.8)#78 | 7.2%(+13.5)#1,914 |
| 79. | Morris | 20.6% | 9.9%(+10.8)#79 | 7.2%(+13.4)#1,926 |
| 80. | Downsville | 20.6% | 9.9%(+10.7)#80 | 7.2%(+13.4)#1,932 |
| 81. | Old Bethpage | 20.6% | 9.9%(+10.7)#81 | 7.2%(+13.4)#1,941 |
| 82. | Fallsburg | 20.6% | 9.9%(+10.7)#82 | 7.2%(+13.3)#1,945 |
| 83. | Central Bridge | 20.5% | 9.9%(+10.7)#83 | 7.2%(+13.3)#1,950 |
| 84. | Riverside | 20.5% | 9.9%(+10.6)#84 | 7.2%(+13.2)#1,962 |
| 85. | Verplanck | 20.4% | 9.9%(+10.5)#85 | 7.2%(+13.2)#1,981 |
| 86. | Ellicottville | 20.3% | 9.9%(+10.5)#86 | 7.2%(+13.1)#1,992 |
| 87. | East Shoreham | 20.1% | 9.9%(+10.2)#87 | 7.2%(+12.8)#2,025 |
| 88. | Edwards | 20.0% | 9.9%(+10.1)#88 | 7.2%(+12.8)#2,032 |
| 89. | Mannsville | 20.0% | 9.9%(+10.1)#89 | 7.2%(+12.8)#2,039 |
| 90. | Callicoon | 20.0% | 9.9%(+10.1)#90 | 7.2%(+12.8)#2,042 |
| 91. | Prattsville | 20.0% | 9.9%(+10.1)#91 | 7.2%(+12.8)#2,050 |
| 92. | Hawthorne | 19.9% | 9.9%(+10.0)#92 | 7.2%(+12.7)#2,085 |
| 93. | Speculator | 19.9% | 9.9%(+10.0)#93 | 7.2%(+12.6)#2,087 |
| 94. | Colton | 19.8% | 9.9%(+9.98)#94 | 7.2%(+12.6)#2,091 |
| 95. | West End | 19.8% | 9.9%(+9.97)#95 | 7.2%(+12.6)#2,093 |
| 96. | Ghent | 19.8% | 9.9%(+9.89)#96 | 7.2%(+12.5)#2,103 |
| 97. | Middleburgh | 19.7% | 9.9%(+9.82)#97 | 7.2%(+12.5)#2,122 |
| 98. | Andes | 19.6% | 9.9%(+9.74)#98 | 7.2%(+12.4)#2,135 |
| 99. | Wellsville | 19.6% | 9.9%(+9.71)#99 | 7.2%(+12.4)#2,139 |
| 100. | Glenwood Landing | 19.6% | 9.9%(+9.70)#100 | 7.2%(+12.3)#2,141 |
Common Questions
What are the Top 10 Cities with the Highest Percentage of Local Government Employees in New York?
Top 10 Cities with the Highest Percentage of Local Government Employees in New York are:
#1
64.3%
#2
42.1%
#3
38.5%
#4
38.0%
#5
35.5%
#6
35.3%
#7
35.3%
#8
34.5%
#9
33.5%
#10
33.0%
What city has the Highest Percentage of Local Government Employees in New York?
Hortonville has the Highest Percentage of Local Government Employees in New York with 64.3%.
What is the Percentage of Local Government Employees in the State of New York?
Percentage of Local Government Employees in New York is 9.9%.
What is the Percentage of Local Government Employees in the United States?
Percentage of Local Government Employees in the United States is 7.2%.