Cities with the Highest Percentage of Local Government Employees in North Carolina
RELATED REPORTS & OPTIONS
Local Government Employees
North Carolina
Compare Cities
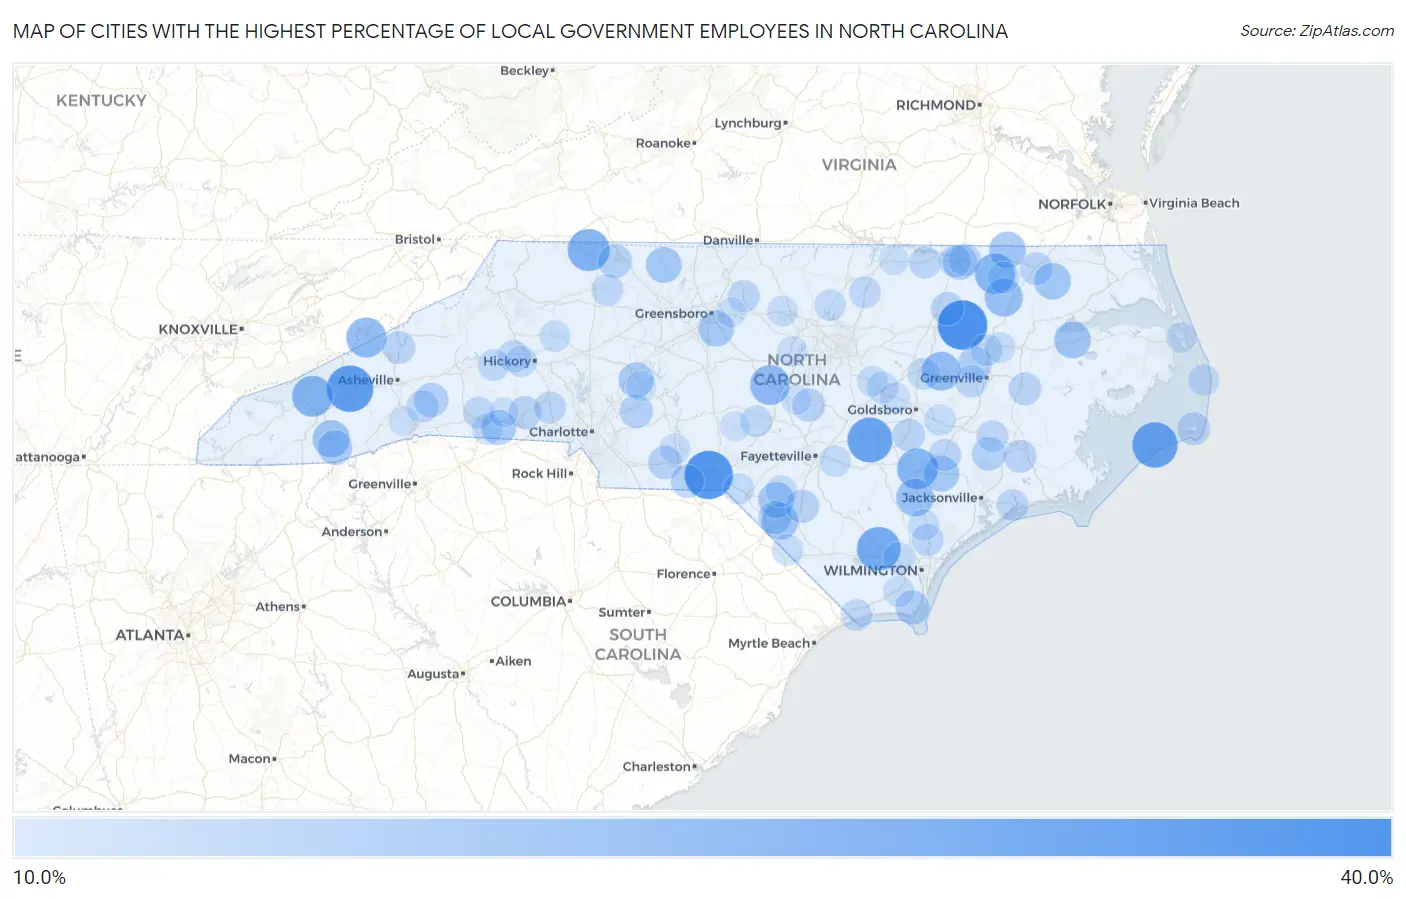
Map of Cities with the Highest Percentage of Local Government Employees in North Carolina
0.0%
40.0%
Cities with the Highest Percentage of Local Government Employees in North Carolina
| City | % Local Government Employees | vs State | vs National | |
| 1. | Leggett | 35.3% | 5.9%(+29.4)#1 | 7.2%(+28.1)#637 |
| 2. | Cordova | 33.9% | 5.9%(+28.0)#2 | 7.2%(+26.7)#691 |
| 3. | Lake Junaluska | 31.7% | 5.9%(+25.7)#3 | 7.2%(+24.4)#800 |
| 4. | Ocracoke | 30.3% | 5.9%(+24.4)#4 | 7.2%(+23.1)#890 |
| 5. | Vann Crossroads | 29.9% | 5.9%(+24.0)#5 | 7.2%(+22.7)#914 |
| 6. | East Arcadia | 28.1% | 5.9%(+22.2)#6 | 7.2%(+20.9)#1,014 |
| 7. | Lowgap | 26.2% | 5.9%(+20.3)#7 | 7.2%(+19.0)#1,182 |
| 8. | Cherokee | 24.9% | 5.9%(+18.9)#8 | 7.2%(+17.6)#1,320 |
| 9. | Kenansville | 24.6% | 5.9%(+18.7)#9 | 7.2%(+17.4)#1,343 |
| 10. | Lasker | 24.2% | 5.9%(+18.3)#10 | 7.2%(+17.0)#1,384 |
| 11. | Glenwood | 24.1% | 5.9%(+18.2)#11 | 7.2%(+16.9)#1,390 |
| 12. | Hot Springs | 23.9% | 5.9%(+17.9)#12 | 7.2%(+16.6)#1,420 |
| 13. | Gulf | 23.6% | 5.9%(+17.6)#13 | 7.2%(+16.4)#1,447 |
| 14. | Saratoga | 22.3% | 5.9%(+16.3)#14 | 7.2%(+15.1)#1,636 |
| 15. | Kelford | 21.6% | 5.9%(+15.6)#15 | 7.2%(+14.3)#1,762 |
| 16. | Wallace | 21.1% | 5.9%(+15.1)#16 | 7.2%(+13.9)#1,835 |
| 17. | Glenville | 20.5% | 5.9%(+14.6)#17 | 7.2%(+13.3)#1,949 |
| 18. | Smithtown | 20.5% | 5.9%(+14.5)#18 | 7.2%(+13.2)#1,966 |
| 19. | Roper | 20.0% | 5.9%(+14.1)#19 | 7.2%(+12.8)#2,033 |
| 20. | Severn | 20.0% | 5.9%(+14.1)#20 | 7.2%(+12.8)#2,044 |
| 21. | Raynham | 20.0% | 5.9%(+14.1)#21 | 7.2%(+12.8)#2,060 |
| 22. | Harrellsville | 19.8% | 5.9%(+13.8)#22 | 7.2%(+12.5)#2,106 |
| 23. | New Hope | 19.4% | 5.9%(+13.4)#23 | 7.2%(+12.1)#2,177 |
| 24. | Prospect | 19.1% | 5.9%(+13.1)#24 | 7.2%(+11.8)#2,258 |
| 25. | Danbury | 19.0% | 5.9%(+13.1)#25 | 7.2%(+11.8)#2,281 |
| 26. | Beulaville | 18.9% | 5.9%(+12.9)#26 | 7.2%(+11.7)#2,322 |
| 27. | Pleasant Garden | 18.8% | 5.9%(+12.9)#27 | 7.2%(+11.6)#2,346 |
| 28. | Faith | 18.1% | 5.9%(+12.2)#28 | 7.2%(+10.9)#2,538 |
| 29. | Boiling Springs | 18.0% | 5.9%(+12.1)#29 | 7.2%(+10.8)#2,572 |
| 30. | Weldon | 17.5% | 5.9%(+11.6)#30 | 7.2%(+10.3)#2,718 |
| 31. | Cashiers | 17.5% | 5.9%(+11.5)#31 | 7.2%(+10.2)#2,734 |
| 32. | Belvoir | 17.1% | 5.9%(+11.1)#32 | 7.2%(+9.85)#2,861 |
| 33. | Chimney Rock Village | 17.0% | 5.9%(+11.1)#33 | 7.2%(+9.82)#2,872 |
| 34. | Southport | 17.0% | 5.9%(+11.0)#34 | 7.2%(+9.75)#2,887 |
| 35. | White Plains | 16.8% | 5.9%(+10.8)#35 | 7.2%(+9.53)#2,969 |
| 36. | Trenton | 16.7% | 5.9%(+10.7)#36 | 7.2%(+9.44)#3,017 |
| 37. | Polkton | 16.2% | 5.9%(+10.3)#37 | 7.2%(+9.02)#3,223 |
| 38. | Mount Pleasant | 16.1% | 5.9%(+10.2)#38 | 7.2%(+8.92)#3,269 |
| 39. | Morven | 16.1% | 5.9%(+10.2)#39 | 7.2%(+8.90)#3,274 |
| 40. | Elrod | 16.0% | 5.9%(+10.1)#40 | 7.2%(+8.82)#3,315 |
| 41. | Mamers | 16.0% | 5.9%(+10.0)#41 | 7.2%(+8.72)#3,349 |
| 42. | Barker Ten Mile | 15.9% | 5.9%(+9.98)#42 | 7.2%(+8.69)#3,363 |
| 43. | Whitakers | 15.8% | 5.9%(+9.85)#43 | 7.2%(+8.56)#3,437 |
| 44. | Waco | 15.7% | 5.9%(+9.75)#44 | 7.2%(+8.46)#3,498 |
| 45. | Brices Creek | 15.6% | 5.9%(+9.68)#45 | 7.2%(+8.39)#3,551 |
| 46. | Mars Hill | 15.6% | 5.9%(+9.64)#46 | 7.2%(+8.35)#3,565 |
| 47. | Buxton | 15.6% | 5.9%(+9.62)#47 | 7.2%(+8.33)#3,575 |
| 48. | Washington Park | 15.6% | 5.9%(+9.62)#48 | 7.2%(+8.33)#3,576 |
| 49. | Winton | 15.4% | 5.9%(+9.47)#49 | 7.2%(+8.18)#3,641 |
| 50. | Mount Olive | 15.3% | 5.9%(+9.33)#50 | 7.2%(+8.05)#3,720 |
| 51. | Garysburg | 15.1% | 5.9%(+9.12)#51 | 7.2%(+7.84)#3,846 |
| 52. | Pink Hill | 15.0% | 5.9%(+9.04)#52 | 7.2%(+7.75)#3,904 |
| 53. | Bell Arthur | 14.9% | 5.9%(+8.94)#53 | 7.2%(+7.66)#3,959 |
| 54. | Edneyville | 14.9% | 5.9%(+8.91)#54 | 7.2%(+7.62)#3,976 |
| 55. | Altamahaw | 14.7% | 5.9%(+8.80)#55 | 7.2%(+7.51)#4,037 |
| 56. | High Shoals | 14.7% | 5.9%(+8.74)#56 | 7.2%(+7.45)#4,071 |
| 57. | Roanoke Rapids | 14.6% | 5.9%(+8.71)#57 | 7.2%(+7.42)#4,087 |
| 58. | Rocky Point | 14.6% | 5.9%(+8.69)#58 | 7.2%(+7.40)#4,107 |
| 59. | Littleton | 14.5% | 5.9%(+8.58)#59 | 7.2%(+7.29)#4,189 |
| 60. | Swansboro | 14.5% | 5.9%(+8.56)#60 | 7.2%(+7.28)#4,195 |
| 61. | Black Creek | 14.5% | 5.9%(+8.54)#61 | 7.2%(+7.25)#4,219 |
| 62. | Cove City | 14.5% | 5.9%(+8.52)#62 | 7.2%(+7.23)#4,231 |
| 63. | Rutherford College | 14.4% | 5.9%(+8.49)#63 | 7.2%(+7.20)#4,249 |
| 64. | Bethel | 14.4% | 5.9%(+8.48)#64 | 7.2%(+7.20)#4,250 |
| 65. | Woodland | 14.4% | 5.9%(+8.44)#65 | 7.2%(+7.15)#4,277 |
| 66. | Boonville | 14.4% | 5.9%(+8.43)#66 | 7.2%(+7.14)#4,285 |
| 67. | Bostic | 14.3% | 5.9%(+8.35)#67 | 7.2%(+7.06)#4,343 |
| 68. | Kittrell | 14.3% | 5.9%(+8.35)#68 | 7.2%(+7.06)#4,369 |
| 69. | Carthage | 14.2% | 5.9%(+8.29)#69 | 7.2%(+7.00)#4,406 |
| 70. | Sunset Beach | 14.2% | 5.9%(+8.27)#70 | 7.2%(+6.98)#4,416 |
| 71. | Salem | 14.2% | 5.9%(+8.24)#71 | 7.2%(+6.95)#4,438 |
| 72. | Red Springs | 14.1% | 5.9%(+8.17)#72 | 7.2%(+6.88)#4,513 |
| 73. | Selma | 14.0% | 5.9%(+8.10)#73 | 7.2%(+6.81)#4,564 |
| 74. | Butner | 13.8% | 5.9%(+7.89)#74 | 7.2%(+6.60)#4,698 |
| 75. | Cliffside | 13.8% | 5.9%(+7.85)#75 | 7.2%(+6.57)#4,724 |
| 76. | Marietta | 13.8% | 5.9%(+7.85)#76 | 7.2%(+6.57)#4,729 |
| 77. | Icard | 13.8% | 5.9%(+7.84)#77 | 7.2%(+6.55)#4,740 |
| 78. | Stedman | 13.8% | 5.9%(+7.81)#78 | 7.2%(+6.53)#4,756 |
| 79. | La Grange | 13.7% | 5.9%(+7.79)#79 | 7.2%(+6.50)#4,772 |
| 80. | Taylorsville | 13.7% | 5.9%(+7.74)#80 | 7.2%(+6.46)#4,812 |
| 81. | Bolivia | 13.6% | 5.9%(+7.70)#81 | 7.2%(+6.41)#4,847 |
| 82. | Northwest | 13.6% | 5.9%(+7.67)#82 | 7.2%(+6.38)#4,867 |
| 83. | Burgaw | 13.6% | 5.9%(+7.67)#83 | 7.2%(+6.38)#4,870 |
| 84. | Rodanthe | 13.6% | 5.9%(+7.65)#84 | 7.2%(+6.36)#4,879 |
| 85. | Laurel Hill | 13.5% | 5.9%(+7.60)#85 | 7.2%(+6.31)#4,913 |
| 86. | Robersonville | 13.4% | 5.9%(+7.47)#86 | 7.2%(+6.18)#5,017 |
| 87. | Farmington | 13.4% | 5.9%(+7.45)#87 | 7.2%(+6.17)#5,031 |
| 88. | Wilson S Mills | 13.2% | 5.9%(+7.26)#88 | 7.2%(+5.97)#5,176 |
| 89. | Ansonville | 13.2% | 5.9%(+7.25)#89 | 7.2%(+5.96)#5,186 |
| 90. | Efland | 13.2% | 5.9%(+7.22)#90 | 7.2%(+5.94)#5,204 |
| 91. | Manteo | 13.0% | 5.9%(+7.08)#91 | 7.2%(+5.80)#5,323 |
| 92. | Fearrington Village | 12.9% | 5.9%(+6.99)#92 | 7.2%(+5.70)#5,407 |
| 93. | Princeton | 12.9% | 5.9%(+6.99)#93 | 7.2%(+5.70)#5,408 |
| 94. | Norlina | 12.6% | 5.9%(+6.68)#94 | 7.2%(+5.39)#5,670 |
| 95. | Broadway | 12.6% | 5.9%(+6.63)#95 | 7.2%(+5.34)#5,713 |
| 96. | Kingstown | 12.5% | 5.9%(+6.56)#96 | 7.2%(+5.27)#5,770 |
| 97. | Valley Hill | 12.5% | 5.9%(+6.55)#97 | 7.2%(+5.26)#5,813 |
| 98. | Rockwell | 12.5% | 5.9%(+6.51)#98 | 7.2%(+5.22)#5,829 |
| 99. | Sedalia | 12.4% | 5.9%(+6.51)#99 | 7.2%(+5.22)#5,834 |
| 100. | Seven Lakes | 12.4% | 5.9%(+6.47)#100 | 7.2%(+5.18)#5,863 |
Common Questions
What are the Top 10 Cities with the Highest Percentage of Local Government Employees in North Carolina?
Top 10 Cities with the Highest Percentage of Local Government Employees in North Carolina are:
#1
35.3%
#2
33.9%
#3
31.7%
#4
30.3%
#5
29.9%
#6
28.1%
#7
26.2%
#8
24.9%
#9
24.6%
#10
24.2%
What city has the Highest Percentage of Local Government Employees in North Carolina?
Leggett has the Highest Percentage of Local Government Employees in North Carolina with 35.3%.
What is the Percentage of Local Government Employees in the State of North Carolina?
Percentage of Local Government Employees in North Carolina is 5.9%.
What is the Percentage of Local Government Employees in the United States?
Percentage of Local Government Employees in the United States is 7.2%.