Iron Horse, CA Map & Demographics
Iron Horse Map
Iron Horse Overview
$22,722
PER CAPITA INCOME
$53,484
AVG HOUSEHOLD INCOME
0.19
INEQUALITY / GINI INDEX
418
TOTAL POPULATION
252
MALE POPULATION
166
FEMALE POPULATION
151.81
MALES / 100 FEMALES
65.87
FEMALES / 100 MALES
56.4
MEDIAN AGE
2.4
AVG FAMILY SIZE
2.0
AVG HOUSEHOLD SIZE
49
LABOR FORCE [ PEOPLE ]
13.6%
PERCENT IN LABOR FORCE
Income in Iron Horse
Income Overview in Iron Horse
| Characteristic | Number | Measure |
| Per Capita Income | 418 | $22,722 |
| Median Family Income | 80 | $0 |
| Mean Family Income | 80 | $0 |
| Median Household Income | 209 | $53,484 |
| Mean Household Income | 209 | $52,864 |
| Income Deficit | 80 | $0 |
| Wage / Income Gap (%) | 418 | 0.00% |
| Wage / Income Gap ($) | 418 | 100.00¢ per $1 |
| Gini / Inequality Index | 418 | 0.19 |
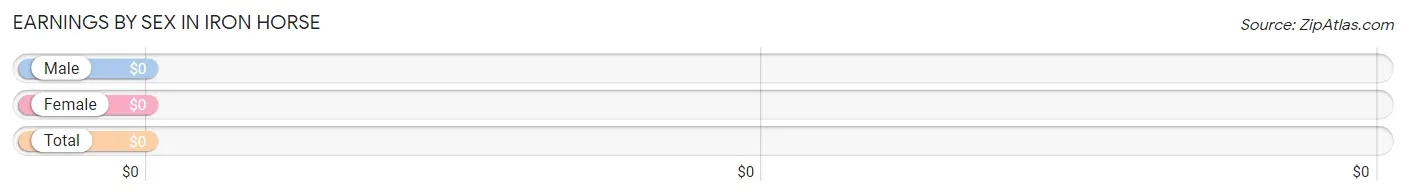
Earnings by Sex in Iron Horse
| Sex | Number | Average Earnings |
| Male | 49 (100.0%) | $0 |
| Female | 0 (0.0%) | $0 |
| Total | 49 (100.0%) | $0 |
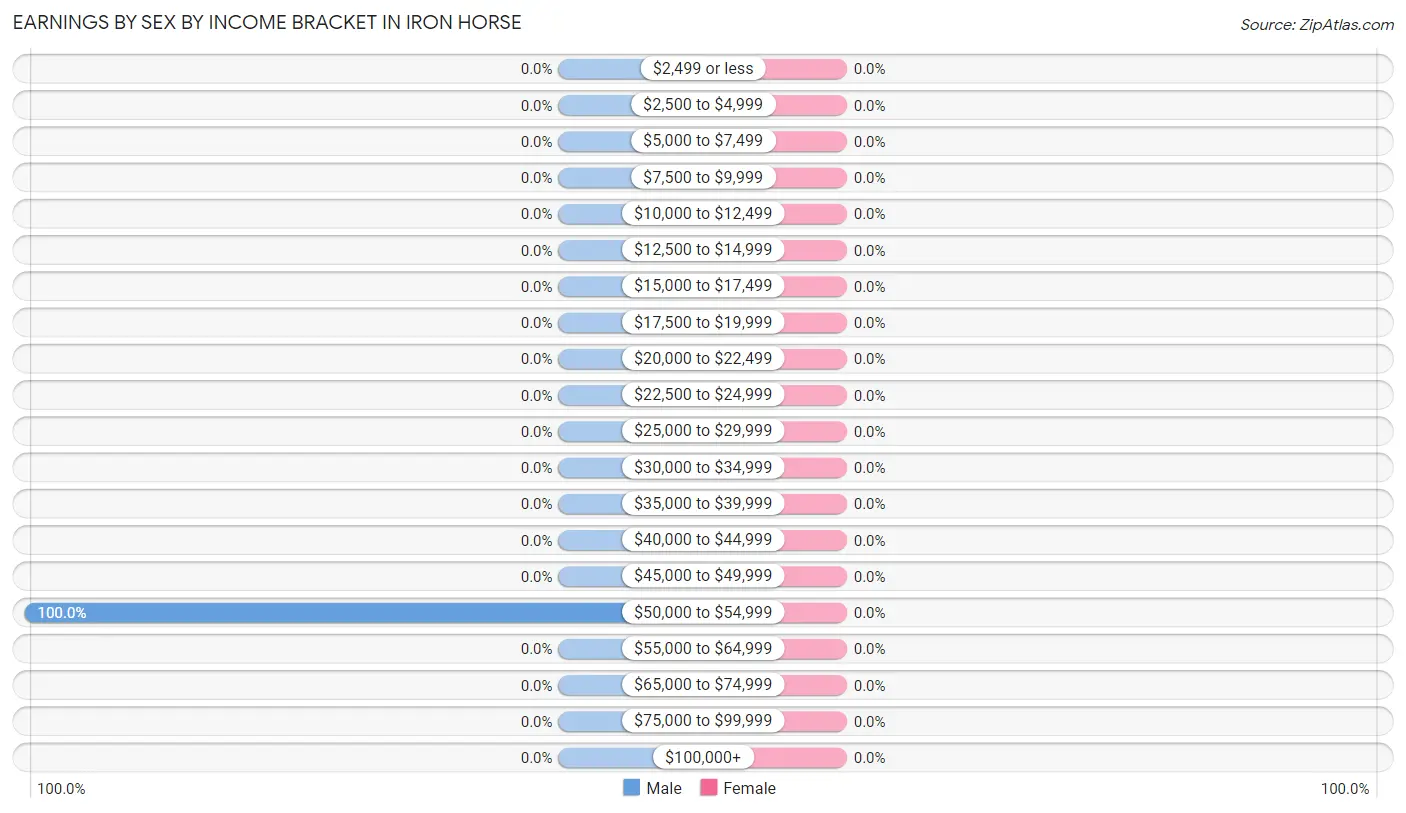
Earnings by Sex by Income Bracket in Iron Horse
| Income | Male | Female |
| $2,499 or less | 0 (0.0%) | 0 (0.0%) |
| $2,500 to $4,999 | 0 (0.0%) | 0 (0.0%) |
| $5,000 to $7,499 | 0 (0.0%) | 0 (0.0%) |
| $7,500 to $9,999 | 0 (0.0%) | 0 (0.0%) |
| $10,000 to $12,499 | 0 (0.0%) | 0 (0.0%) |
| $12,500 to $14,999 | 0 (0.0%) | 0 (0.0%) |
| $15,000 to $17,499 | 0 (0.0%) | 0 (0.0%) |
| $17,500 to $19,999 | 0 (0.0%) | 0 (0.0%) |
| $20,000 to $22,499 | 0 (0.0%) | 0 (0.0%) |
| $22,500 to $24,999 | 0 (0.0%) | 0 (0.0%) |
| $25,000 to $29,999 | 0 (0.0%) | 0 (0.0%) |
| $30,000 to $34,999 | 0 (0.0%) | 0 (0.0%) |
| $35,000 to $39,999 | 0 (0.0%) | 0 (0.0%) |
| $40,000 to $44,999 | 0 (0.0%) | 0 (0.0%) |
| $45,000 to $49,999 | 0 (0.0%) | 0 (0.0%) |
| $50,000 to $54,999 | 49 (100.0%) | 0 (0.0%) |
| $55,000 to $64,999 | 0 (0.0%) | 0 (0.0%) |
| $65,000 to $74,999 | 0 (0.0%) | 0 (0.0%) |
| $75,000 to $99,999 | 0 (0.0%) | 0 (0.0%) |
| $100,000+ | 0 (0.0%) | 0 (0.0%) |
| Total | 49 (100.0%) | 0 (0.0%) |
Earnings by Sex by Educational Attainment in Iron Horse
| Educational Attainment | Male Income | Female Income |
| Less than High School | - | - |
| High School Diploma | - | - |
| College or Associate's Degree | - | - |
| Bachelor's Degree | - | - |
| Graduate Degree | - | - |
| Total | - | - |
Family Income in Iron Horse
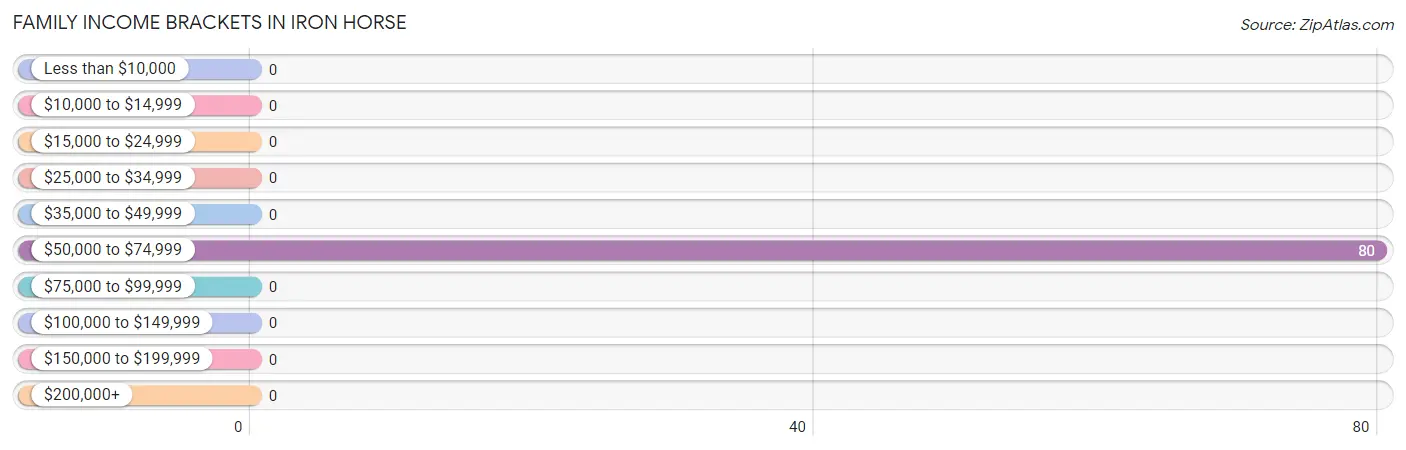
Family Income Brackets in Iron Horse
According to the Iron Horse family income data, there are 80 families falling into the $50,000 to $74,999 income range, which is the most common income bracket and makes up 100.0% of all families.
| Income Bracket | # Families | % Families |
| Less than $10,000 | 0 | 0.0% |
| $10,000 to $14,999 | 0 | 0.0% |
| $15,000 to $24,999 | 0 | 0.0% |
| $25,000 to $34,999 | 0 | 0.0% |
| $35,000 to $49,999 | 0 | 0.0% |
| $50,000 to $74,999 | 80 | 100.0% |
| $75,000 to $99,999 | 0 | 0.0% |
| $100,000 to $149,999 | 0 | 0.0% |
| $150,000 to $199,999 | 0 | 0.0% |
| $200,000+ | 0 | 0.0% |
Family Income by Famaliy Size in Iron Horse
| Income Bracket | # Families | Median Income |
| 2-Person Families | 0 (0.0%) | $0 |
| 3-Person Families | 80 (100.0%) | $0 |
| 4-Person Families | 0 (0.0%) | $0 |
| 5-Person Families | 0 (0.0%) | $0 |
| 6-Person Families | 0 (0.0%) | $0 |
| 7+ Person Families | 0 (0.0%) | $0 |
| Total | 80 (100.0%) | $0 |
Family Income by Number of Earners in Iron Horse
| Number of Earners | # Families | Median Income |
| No Earners | 0 (0.0%) | $0 |
| 1 Earner | 80 (100.0%) | $0 |
| 2 Earners | 0 (0.0%) | $0 |
| 3+ Earners | 0 (0.0%) | $0 |
| Total | 80 (100.0%) | $0 |
Household Income in Iron Horse
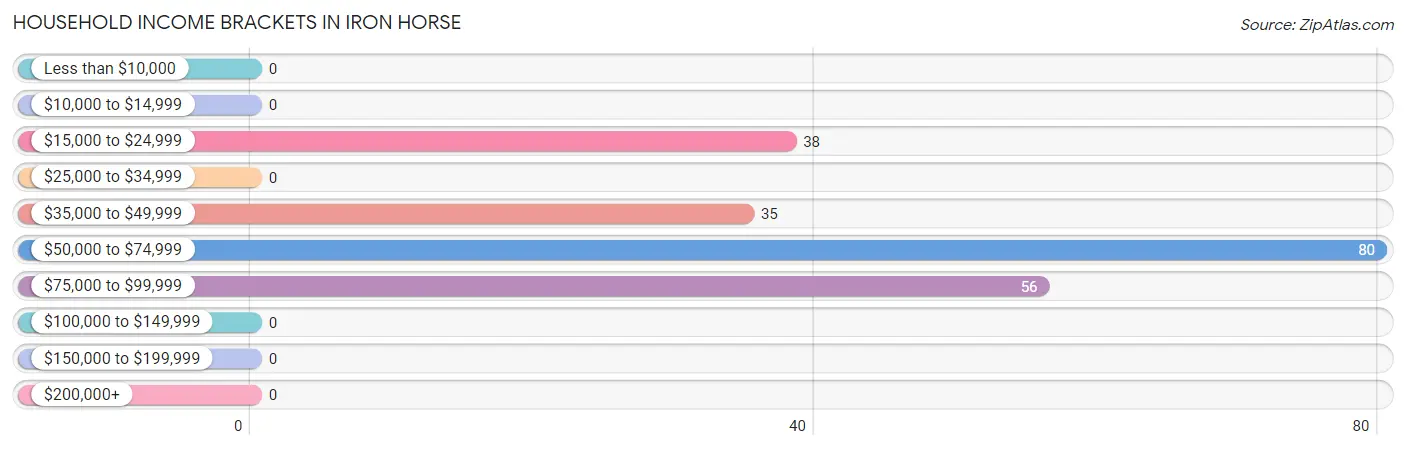
Household Income Brackets in Iron Horse
With 80 households falling in the category, the $50,000 to $74,999 income range is the most frequent in Iron Horse, accounting for 38.3% of all households.
| Income Bracket | # Households | % Households |
| Less than $10,000 | 0 | 0.0% |
| $10,000 to $14,999 | 0 | 0.0% |
| $15,000 to $24,999 | 38 | 18.2% |
| $25,000 to $34,999 | 0 | 0.0% |
| $35,000 to $49,999 | 35 | 16.7% |
| $50,000 to $74,999 | 80 | 38.3% |
| $75,000 to $99,999 | 56 | 26.8% |
| $100,000 to $149,999 | 0 | 0.0% |
| $150,000 to $199,999 | 0 | 0.0% |
| $200,000+ | 0 | 0.0% |
Household Income by Householder Age in Iron Horse
| Income Bracket | # Households | Median Income |
| 15 to 24 Years | 0 (0.0%) | $0 |
| 25 to 44 Years | 80 (38.3%) | $0 |
| 45 to 64 Years | 0 (0.0%) | $0 |
| 65+ Years | 129 (61.7%) | $0 |
| Total | 209 (100.0%) | $53,484 |
Poverty in Iron Horse
Income Below Poverty by Sex and Age in Iron Horse
| Age Bracket | Male | Female |
| Under 5 Years | 0 (0.0%) | 0 (0.0%) |
| 5 Years | 0 (0.0%) | 0 (0.0%) |
| 6 to 11 Years | 0 (0.0%) | 0 (0.0%) |
| 12 to 14 Years | 0 (0.0%) | 0 (0.0%) |
| 15 Years | 0 (0.0%) | 0 (0.0%) |
| 16 and 17 Years | 0 (0.0%) | 0 (0.0%) |
| 18 to 24 Years | 0 (0.0%) | 0 (0.0%) |
| 25 to 34 Years | 0 (0.0%) | 0 (0.0%) |
| 35 to 44 Years | 0 (0.0%) | 0 (0.0%) |
| 45 to 54 Years | 0 (0.0%) | 0 (0.0%) |
| 55 to 64 Years | 0 (0.0%) | 0 (0.0%) |
| 65 to 74 Years | 0 (0.0%) | 0 (0.0%) |
| 75 Years and over | 0 (0.0%) | 0 (0.0%) |
| Total | 0 (0.0%) | 0 (0.0%) |
Income Above Poverty by Sex and Age in Iron Horse
According to the poverty statistics in Iron Horse, males aged 6 to 11 years and females aged 35 to 44 years are the age groups that are most secure financially, with 100.0% of males and 100.0% of females in these age groups living above the poverty line.
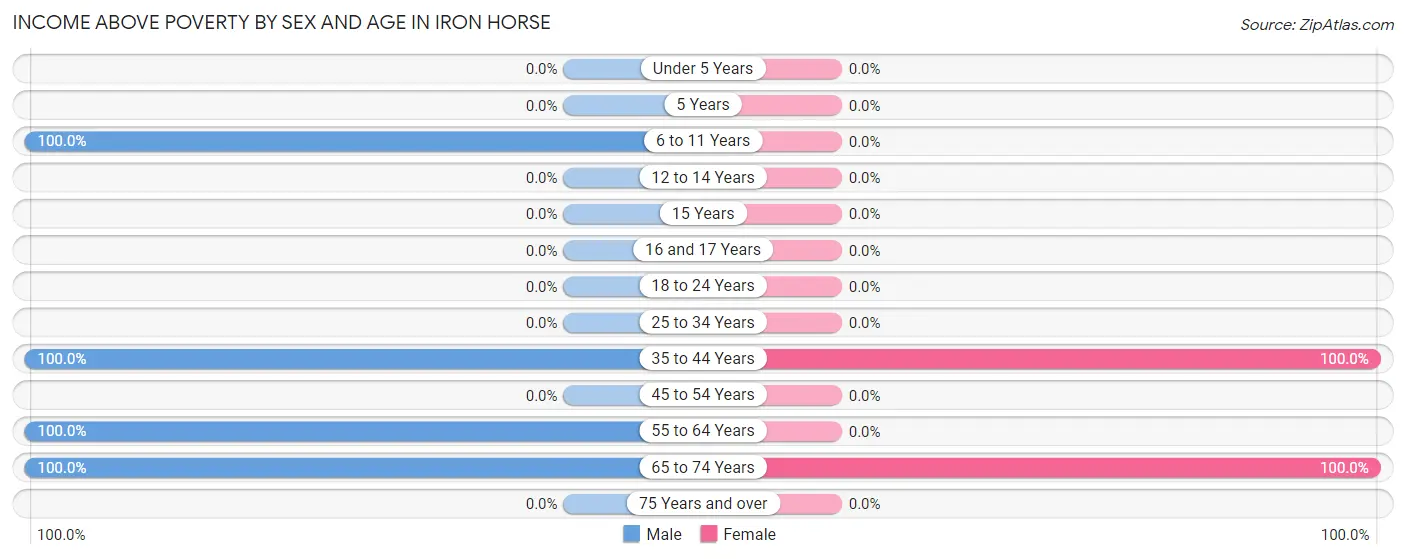
| Age Bracket | Male | Female |
| Under 5 Years | 0 (0.0%) | 0 (0.0%) |
| 5 Years | 0 (0.0%) | 0 (0.0%) |
| 6 to 11 Years | 59 (100.0%) | 0 (0.0%) |
| 12 to 14 Years | 0 (0.0%) | 0 (0.0%) |
| 15 Years | 0 (0.0%) | 0 (0.0%) |
| 16 and 17 Years | 0 (0.0%) | 0 (0.0%) |
| 18 to 24 Years | 0 (0.0%) | 0 (0.0%) |
| 25 to 34 Years | 0 (0.0%) | 0 (0.0%) |
| 35 to 44 Years | 49 (100.0%) | 80 (100.0%) |
| 45 to 54 Years | 0 (0.0%) | 0 (0.0%) |
| 55 to 64 Years | 50 (100.0%) | 0 (0.0%) |
| 65 to 74 Years | 94 (100.0%) | 86 (100.0%) |
| 75 Years and over | 0 (0.0%) | 0 (0.0%) |
| Total | 252 (100.0%) | 166 (100.0%) |
Income Below Poverty Among Married-Couple Families in Iron Horse

| Children | Above Poverty | Below Poverty |
| No Children | 0 (0.0%) | 0 (0.0%) |
| 1 or 2 Children | 80 (100.0%) | 0 (0.0%) |
| 3 or 4 Children | 0 (0.0%) | 0 (0.0%) |
| 5 or more Children | 0 (0.0%) | 0 (0.0%) |
| Total | 80 (100.0%) | 0 (0.0%) |
Income Below Poverty Among Single-Parent Households in Iron Horse
| Children | Single Father | Single Mother |
| No Children | 0 (0.0%) | 0 (0.0%) |
| 1 or 2 Children | 0 (0.0%) | 0 (0.0%) |
| 3 or 4 Children | 0 (0.0%) | 0 (0.0%) |
| 5 or more Children | 0 (0.0%) | 0 (0.0%) |
| Total | 0 (0.0%) | 0 (0.0%) |
Income Below Poverty Among Married-Couple vs Single-Parent Households in Iron Horse
| Children | Married-Couple Families | Single-Parent Households |
| No Children | 0 (0.0%) | 0 (0.0%) |
| 1 or 2 Children | 0 (0.0%) | 0 (0.0%) |
| 3 or 4 Children | 0 (0.0%) | 0 (0.0%) |
| 5 or more Children | 0 (0.0%) | 0 (0.0%) |
| Total | 0 (0.0%) | 0 (0.0%) |
Race in Iron Horse
The most populous races in Iron Horse are White / Caucasian (368 | 88.0%), Hispanic or Latino (50 | 12.0%), and Two or more Races (50 | 12.0%).
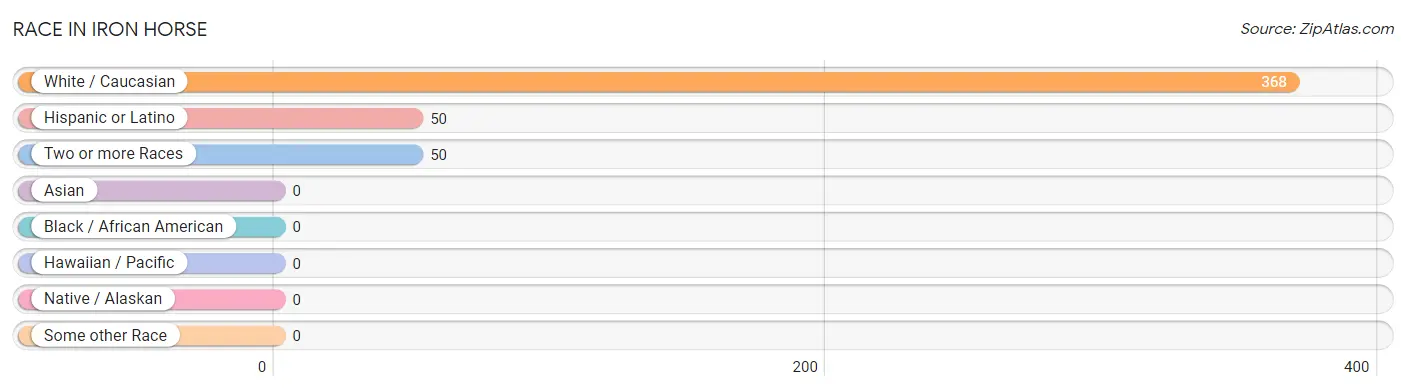
| Race | # Population | % Population |
| Asian | 0 | 0.0% |
| Black / African American | 0 | 0.0% |
| Hawaiian / Pacific | 0 | 0.0% |
| Hispanic or Latino | 50 | 12.0% |
| Native / Alaskan | 0 | 0.0% |
| White / Caucasian | 368 | 88.0% |
| Two or more Races | 50 | 12.0% |
| Some other Race | 0 | 0.0% |
| Total | 418 | 100.0% |
Ancestry in Iron Horse
The most populous ancestries reported in Iron Horse are English (107 | 25.6%), Swedish (56 | 13.4%), Irish (51 | 12.2%), and Mexican (50 | 12.0%), together accounting for 63.2% of all Iron Horse residents.
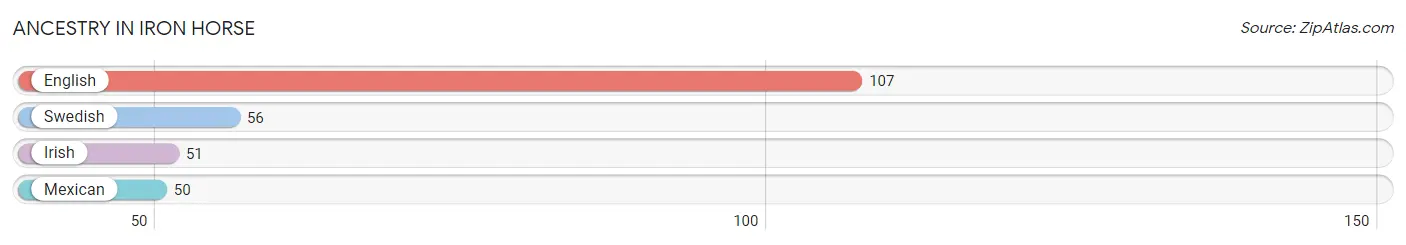
| Ancestry | # Population | % Population |
| English | 107 | 25.6% |
| Irish | 51 | 12.2% |
| Mexican | 50 | 12.0% |
| Swedish | 56 | 13.4% | View All 4 Rows |
Immigrants in Iron Horse
The most numerous immigrant groups reported in Iron Horse came from Europe (50 | 12.0%), Southern Europe (50 | 12.0%), and Spain (50 | 12.0%), together accounting for 35.9% of all Iron Horse residents.
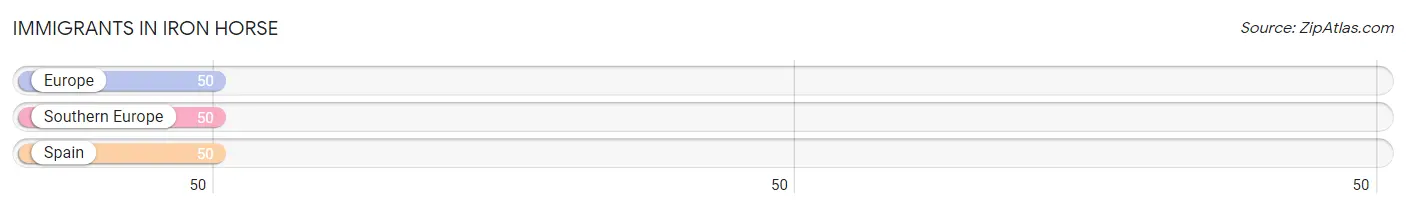
| Immigration Origin | # Population | % Population |
| Europe | 50 | 12.0% |
| Southern Europe | 50 | 12.0% |
| Spain | 50 | 12.0% | View All 3 Rows |
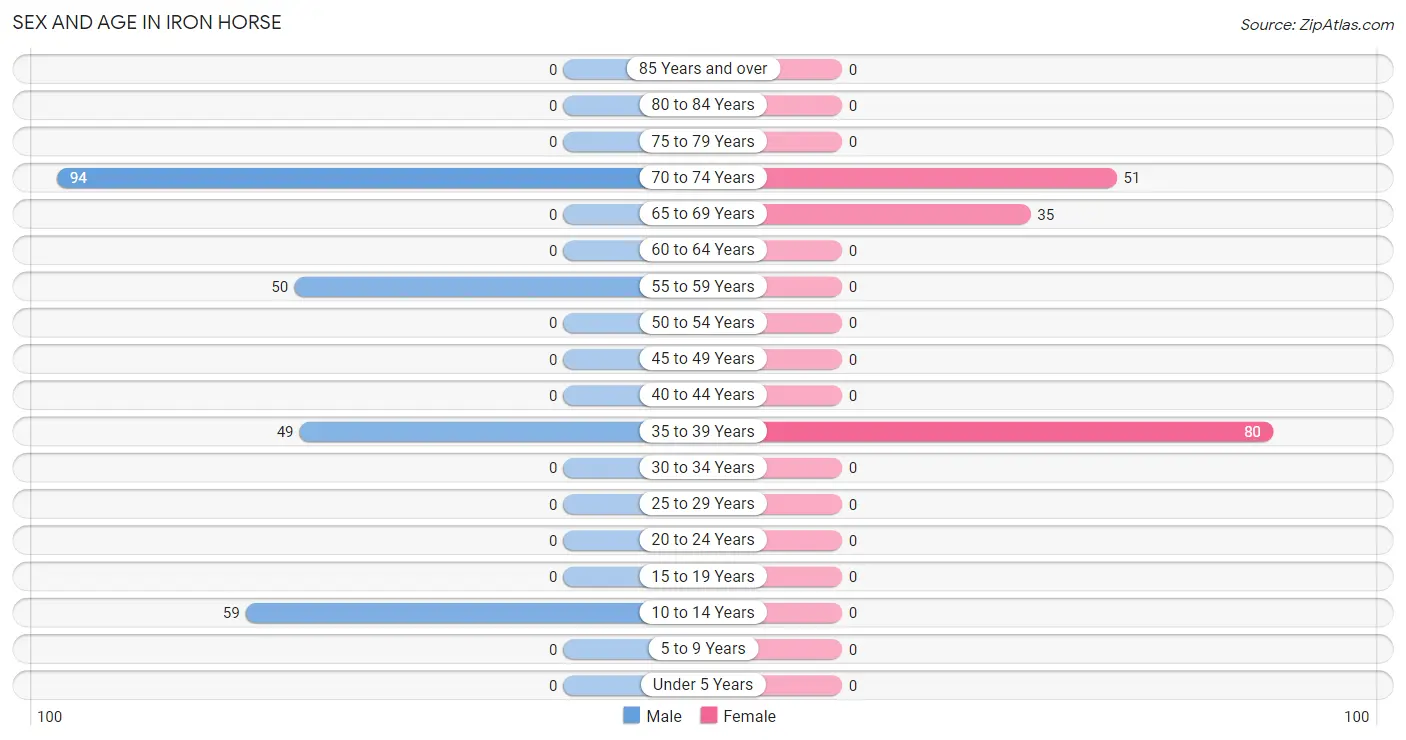
Sex and Age in Iron Horse
Sex and Age in Iron Horse
The most populous age groups in Iron Horse are 70 to 74 Years (94 | 37.3%) for men and 35 to 39 Years (80 | 48.2%) for women.
| Age Bracket | Male | Female |
| Under 5 Years | 0 (0.0%) | 0 (0.0%) |
| 5 to 9 Years | 0 (0.0%) | 0 (0.0%) |
| 10 to 14 Years | 59 (23.4%) | 0 (0.0%) |
| 15 to 19 Years | 0 (0.0%) | 0 (0.0%) |
| 20 to 24 Years | 0 (0.0%) | 0 (0.0%) |
| 25 to 29 Years | 0 (0.0%) | 0 (0.0%) |
| 30 to 34 Years | 0 (0.0%) | 0 (0.0%) |
| 35 to 39 Years | 49 (19.4%) | 80 (48.2%) |
| 40 to 44 Years | 0 (0.0%) | 0 (0.0%) |
| 45 to 49 Years | 0 (0.0%) | 0 (0.0%) |
| 50 to 54 Years | 0 (0.0%) | 0 (0.0%) |
| 55 to 59 Years | 50 (19.8%) | 0 (0.0%) |
| 60 to 64 Years | 0 (0.0%) | 0 (0.0%) |
| 65 to 69 Years | 0 (0.0%) | 35 (21.1%) |
| 70 to 74 Years | 94 (37.3%) | 51 (30.7%) |
| 75 to 79 Years | 0 (0.0%) | 0 (0.0%) |
| 80 to 84 Years | 0 (0.0%) | 0 (0.0%) |
| 85 Years and over | 0 (0.0%) | 0 (0.0%) |
| Total | 252 (100.0%) | 166 (100.0%) |
Families and Households in Iron Horse
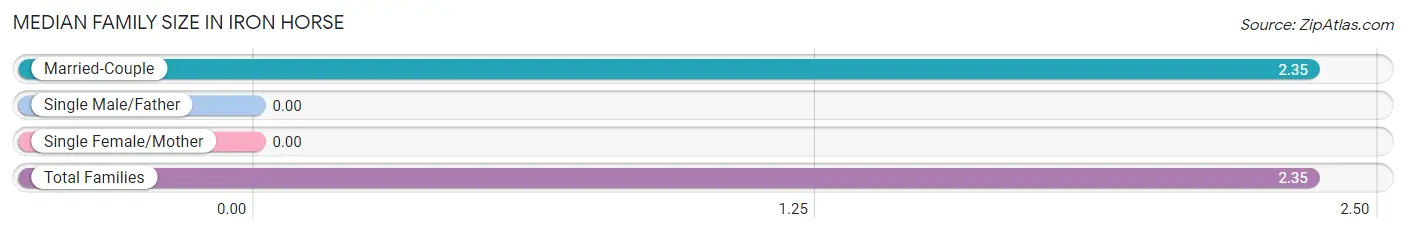
Median Family Size in Iron Horse
| Family Type | # Families | Family Size |
| Married-Couple | 80 (100.0%) | 2.35 |
| Single Male/Father | 0 (0.0%) | - |
| Single Female/Mother | 0 (0.0%) | - |
| Total Families | 80 (100.0%) | 2.35 |
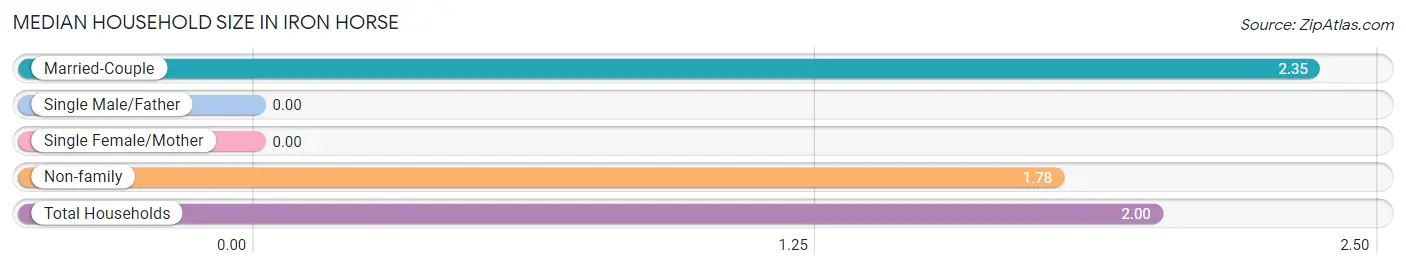
Median Household Size in Iron Horse
| Household Type | # Households | Household Size |
| Married-Couple | 80 (38.3%) | 2.35 |
| Single Male/Father | 0 (0.0%) | - |
| Single Female/Mother | 0 (0.0%) | - |
| Non-family | 129 (61.7%) | 1.78 |
| Total Households | 209 (100.0%) | 2.00 |
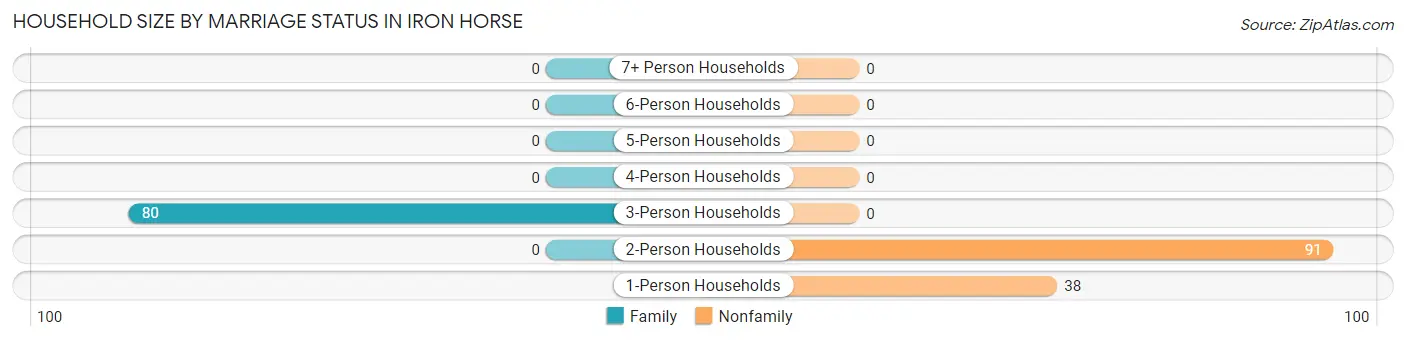
Household Size by Marriage Status in Iron Horse
Out of a total of 209 households in Iron Horse, 80 (38.3%) are family households, while 129 (61.7%) are nonfamily households. The most numerous type of family households are 3-person households, comprising 80, and the most common type of nonfamily households are 2-person households, comprising 91.
| Household Size | Family Households | Nonfamily Households |
| 1-Person Households | - | 38 (18.2%) |
| 2-Person Households | 0 (0.0%) | 91 (43.5%) |
| 3-Person Households | 80 (38.3%) | 0 (0.0%) |
| 4-Person Households | 0 (0.0%) | 0 (0.0%) |
| 5-Person Households | 0 (0.0%) | 0 (0.0%) |
| 6-Person Households | 0 (0.0%) | 0 (0.0%) |
| 7+ Person Households | 0 (0.0%) | 0 (0.0%) |
| Total | 80 (38.3%) | 129 (61.7%) |
Female Fertility in Iron Horse
Fertility by Age in Iron Horse
| Age Bracket | Women with Births | Births / 1,000 Women |
| 15 to 19 years | 0 (0.0%) | 0.0 |
| 20 to 34 years | 0 (0.0%) | 0.0 |
| 35 to 50 years | 0 (0.0%) | 0.0 |
| Total | 0 (0.0%) | 0.0 |
Fertility by Age by Marriage Status in Iron Horse
| Age Bracket | Married | Unmarried |
| 15 to 19 years | 0 (0.0%) | 0 (0.0%) |
| 20 to 34 years | 0 (0.0%) | 0 (0.0%) |
| 35 to 50 years | 0 (0.0%) | 0 (0.0%) |
| Total | 0 (0.0%) | 0 (0.0%) |
Fertility by Education in Iron Horse
| Educational Attainment | Women with Births | Births / 1,000 Women |
| Less than High School | 0 (0.0%) | 0.0 |
| High School Diploma | 0 (0.0%) | 0.0 |
| College or Associate's Degree | 0 (0.0%) | 0.0 |
| Bachelor's Degree | 0 (0.0%) | 0.0 |
| Graduate Degree | 0 (0.0%) | 0.0 |
| Total | 0 (0.0%) | 0.0 |
Fertility by Education by Marriage Status in Iron Horse
| Educational Attainment | Married | Unmarried |
| Less than High School | 0 (0.0%) | 0 (0.0%) |
| High School Diploma | 0 (0.0%) | 0 (0.0%) |
| College or Associate's Degree | 0 (0.0%) | 0 (0.0%) |
| Bachelor's Degree | 0 (0.0%) | 0 (0.0%) |
| Graduate Degree | 0 (0.0%) | 0 (0.0%) |
| Total | 0 (0.0%) | 0 (0.0%) |
Employment Characteristics in Iron Horse
Employment by Class of Employer in Iron Horse
Among the 49 employed individuals in Iron Horse, , and local government employees (49 | 100.0%) make up the most common classes of employment.

| Employer Class | # Employees | % Employees |
| Private Company Employees | 0 | 0.0% |
| Self-Employed (Incorporated) | 0 | 0.0% |
| Self-Employed (Not Incorporated) | 0 | 0.0% |
| Not-for-profit Organizations | 0 | 0.0% |
| Local Government Employees | 49 | 100.0% |
| State Government Employees | 0 | 0.0% |
| Federal Government Employees | 0 | 0.0% |
| Unpaid Family Workers | 0 | 0.0% |
| Total | 49 | 100.0% |
Employment Status by Age in Iron Horse
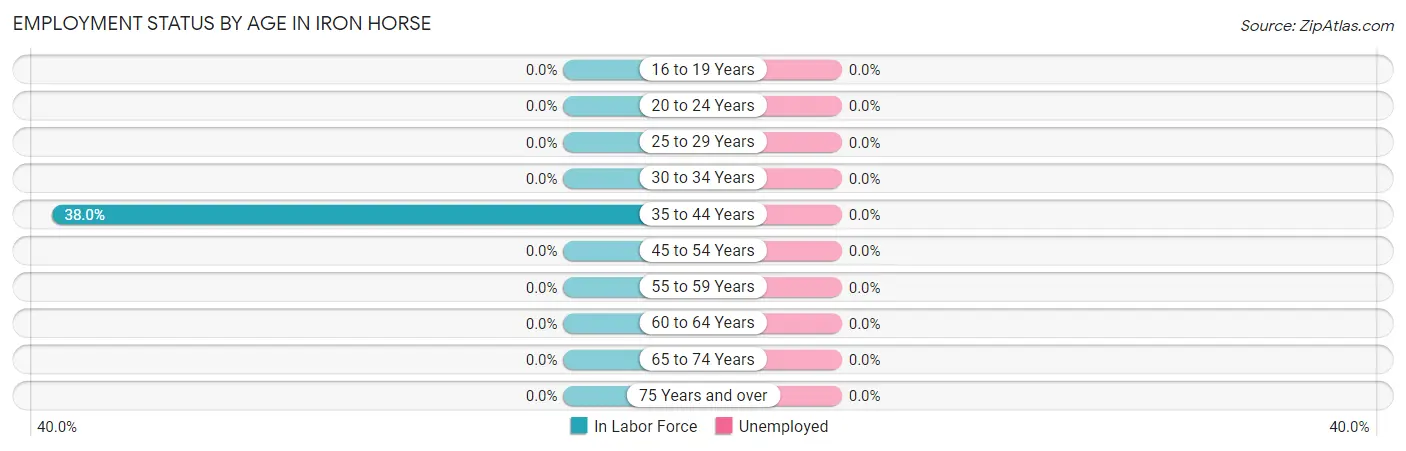
| Age Bracket | In Labor Force | Unemployed |
| 16 to 19 Years | 0 (0.0%) | 0 (0.0%) |
| 20 to 24 Years | 0 (0.0%) | 0 (0.0%) |
| 25 to 29 Years | 0 (0.0%) | 0 (0.0%) |
| 30 to 34 Years | 0 (0.0%) | 0 (0.0%) |
| 35 to 44 Years | 49 (38.0%) | 0 (0.0%) |
| 45 to 54 Years | 0 (0.0%) | 0 (0.0%) |
| 55 to 59 Years | 0 (0.0%) | 0 (0.0%) |
| 60 to 64 Years | 0 (0.0%) | 0 (0.0%) |
| 65 to 74 Years | 0 (0.0%) | 0 (0.0%) |
| 75 Years and over | 0 (0.0%) | 0 (0.0%) |
| Total | 49 (13.6%) | 0 (0.0%) |
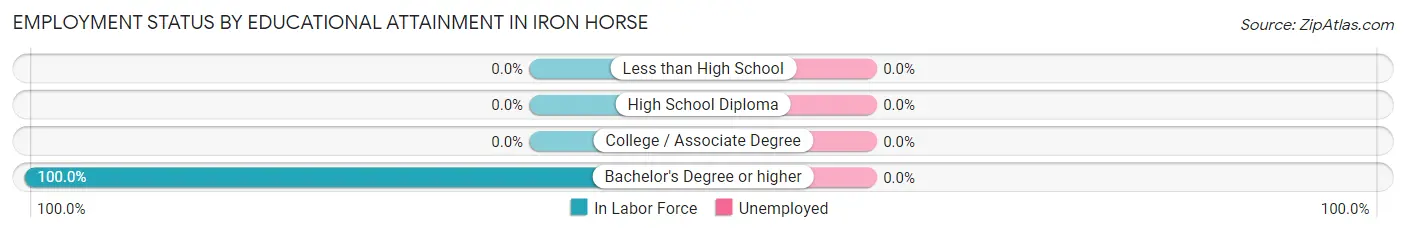
Employment Status by Educational Attainment in Iron Horse
| Educational Attainment | In Labor Force | Unemployed |
| Less than High School | 0 (0.0%) | 0 (0.0%) |
| High School Diploma | 0 (0.0%) | 0 (0.0%) |
| College / Associate Degree | 0 (0.0%) | 0 (0.0%) |
| Bachelor's Degree or higher | 49 (100.0%) | 0 (0.0%) |
| Total | 49 (27.4%) | 0 (0.0%) |
Employment Occupations by Sex in Iron Horse
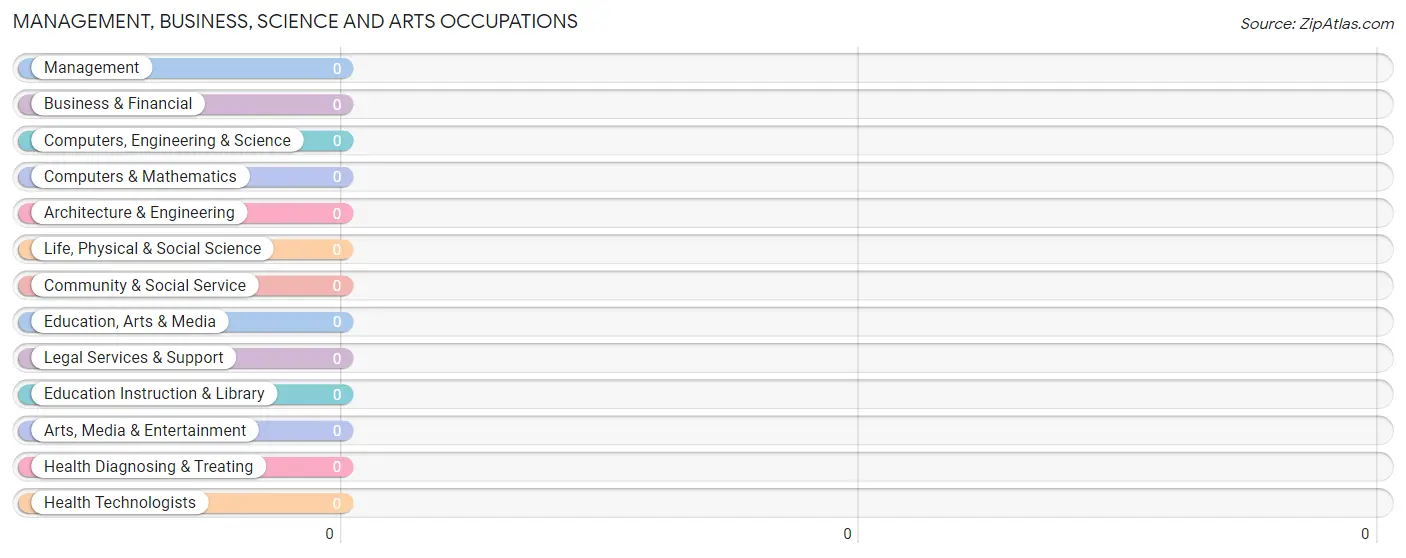
Management, Business, Science and Arts Occupations
Management, Business, Science and Arts Occupations by Sex
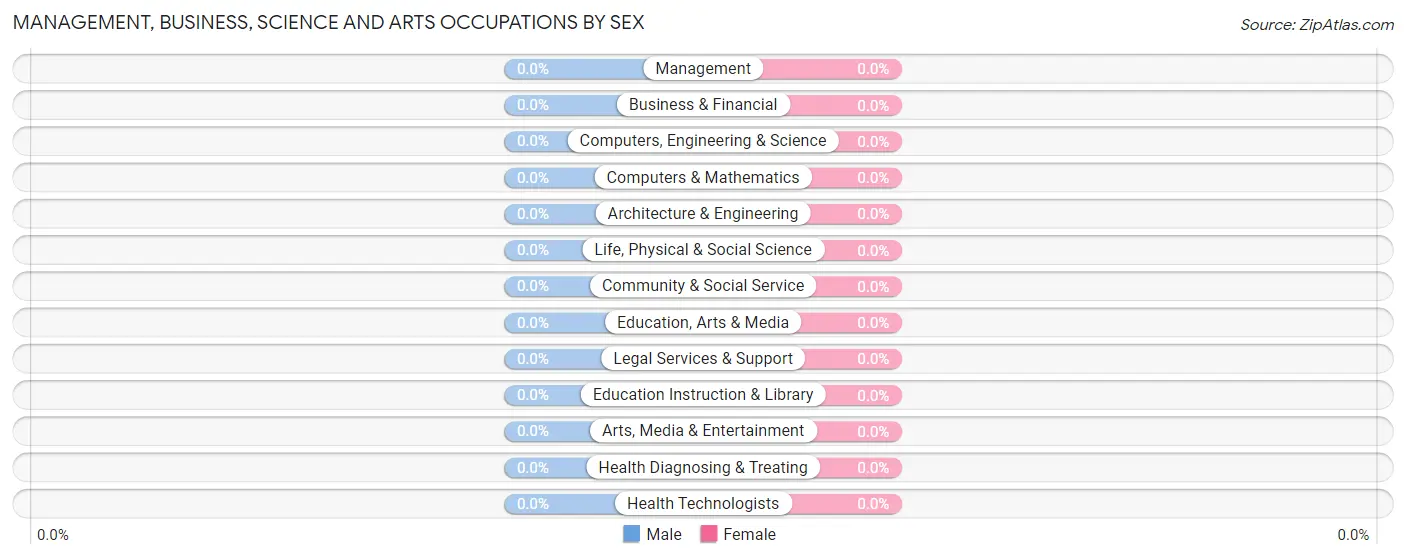
| Occupation | Male | Female |
| Management | 0 (0.0%) | 0 (0.0%) |
| Business & Financial | 0 (0.0%) | 0 (0.0%) |
| Computers, Engineering & Science | 0 (0.0%) | 0 (0.0%) |
| Computers & Mathematics | 0 (0.0%) | 0 (0.0%) |
| Architecture & Engineering | 0 (0.0%) | 0 (0.0%) |
| Life, Physical & Social Science | 0 (0.0%) | 0 (0.0%) |
| Community & Social Service | 0 (0.0%) | 0 (0.0%) |
| Education, Arts & Media | 0 (0.0%) | 0 (0.0%) |
| Legal Services & Support | 0 (0.0%) | 0 (0.0%) |
| Education Instruction & Library | 0 (0.0%) | 0 (0.0%) |
| Arts, Media & Entertainment | 0 (0.0%) | 0 (0.0%) |
| Health Diagnosing & Treating | 0 (0.0%) | 0 (0.0%) |
| Health Technologists | 0 (0.0%) | 0 (0.0%) |
| Total (Category) | 0 (0.0%) | 0 (0.0%) |
| Total (Overall) | 49 (100.0%) | 0 (0.0%) |
Services Occupations
The most common Services occupations in Iron Horse are , and Cleaning & Maintenance (49 | 100.0%).
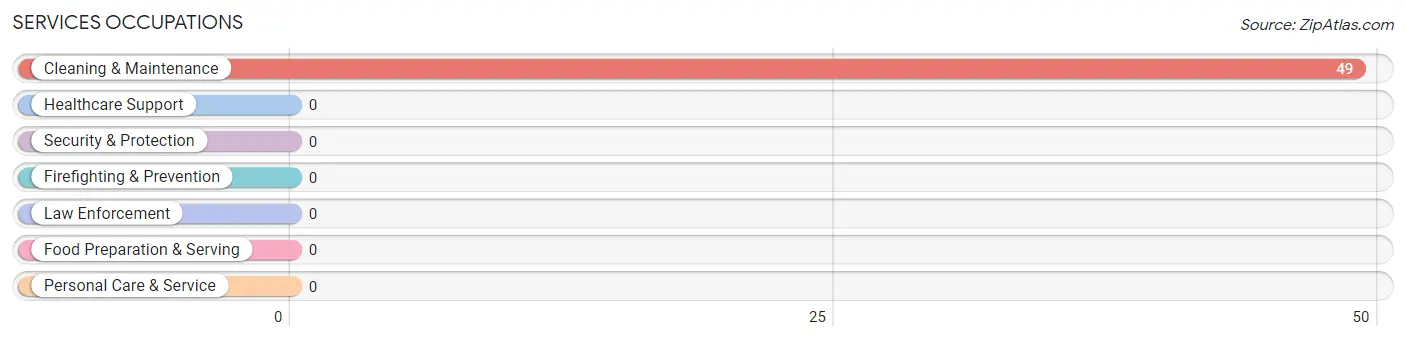
Services Occupations by Sex
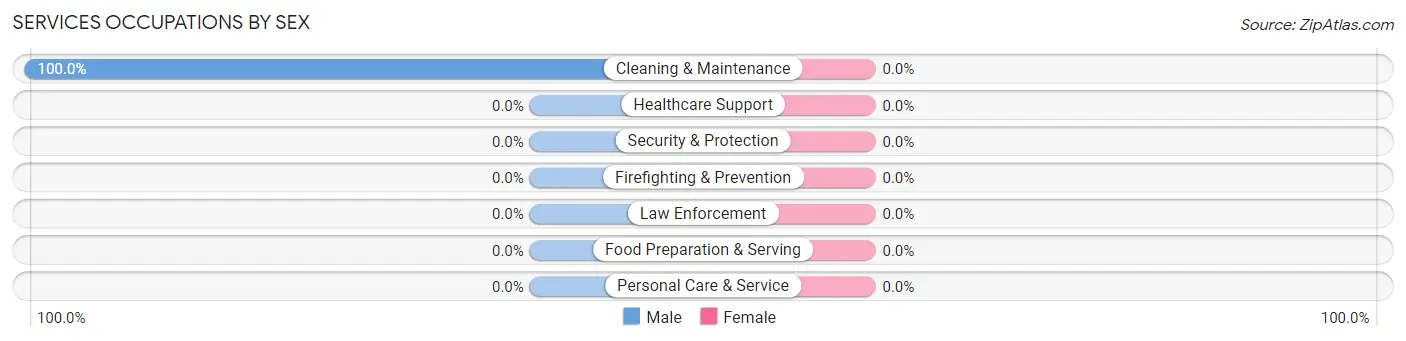
| Occupation | Male | Female |
| Healthcare Support | 0 (0.0%) | 0 (0.0%) |
| Security & Protection | 0 (0.0%) | 0 (0.0%) |
| Firefighting & Prevention | 0 (0.0%) | 0 (0.0%) |
| Law Enforcement | 0 (0.0%) | 0 (0.0%) |
| Food Preparation & Serving | 0 (0.0%) | 0 (0.0%) |
| Cleaning & Maintenance | 49 (100.0%) | 0 (0.0%) |
| Personal Care & Service | 0 (0.0%) | 0 (0.0%) |
| Total (Category) | 49 (100.0%) | 0 (0.0%) |
| Total (Overall) | 49 (100.0%) | 0 (0.0%) |
Sales and Office Occupations
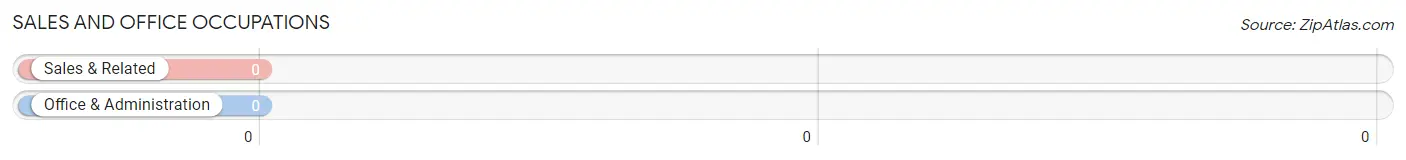
Sales and Office Occupations by Sex
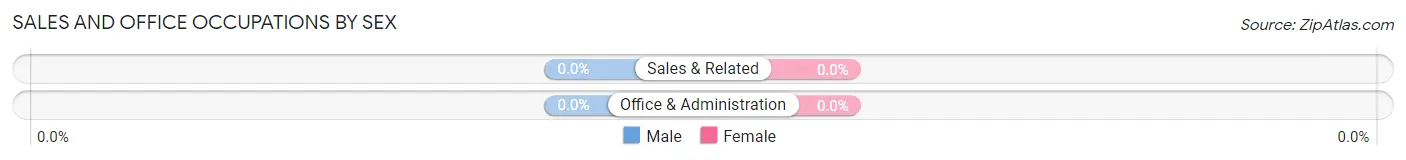
| Occupation | Male | Female |
| Sales & Related | 0 (0.0%) | 0 (0.0%) |
| Office & Administration | 0 (0.0%) | 0 (0.0%) |
| Total (Category) | 0 (0.0%) | 0 (0.0%) |
| Total (Overall) | 49 (100.0%) | 0 (0.0%) |
Natural Resources, Construction and Maintenance Occupations
Natural Resources, Construction and Maintenance Occupations by Sex
| Occupation | Male | Female |
| Farming, Fishing & Forestry | 0 (0.0%) | 0 (0.0%) |
| Construction & Extraction | 0 (0.0%) | 0 (0.0%) |
| Installation, Maintenance & Repair | 0 (0.0%) | 0 (0.0%) |
| Total (Category) | 0 (0.0%) | 0 (0.0%) |
| Total (Overall) | 49 (100.0%) | 0 (0.0%) |
Production, Transportation and Moving Occupations
Production, Transportation and Moving Occupations by Sex
| Occupation | Male | Female |
| Production | 0 (0.0%) | 0 (0.0%) |
| Transportation | 0 (0.0%) | 0 (0.0%) |
| Material Moving | 0 (0.0%) | 0 (0.0%) |
| Total (Category) | 0 (0.0%) | 0 (0.0%) |
| Total (Overall) | 49 (100.0%) | 0 (0.0%) |
Employment Industries by Sex in Iron Horse
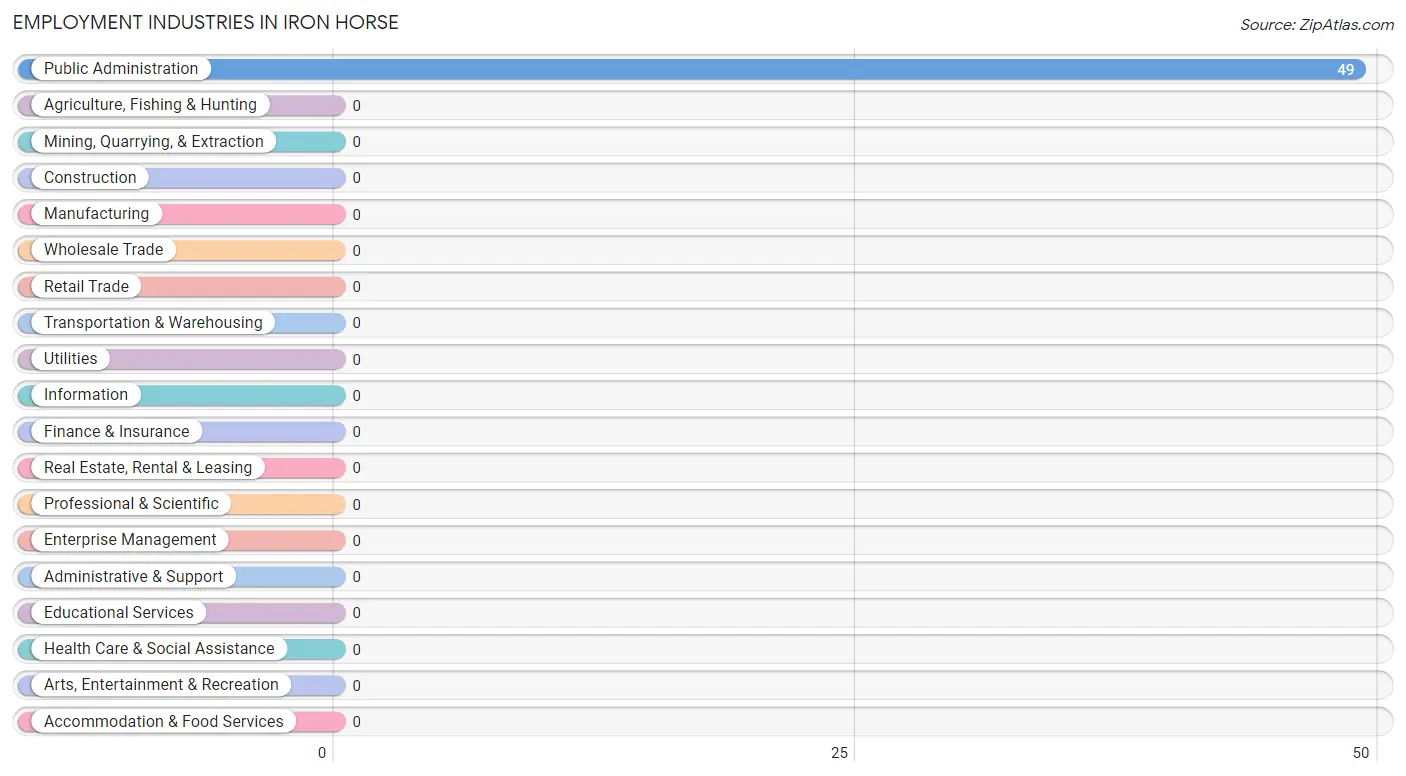
Employment Industries in Iron Horse
The major employment industries in Iron Horse include , and Public Administration (49 | 100.0%).
Employment Industries by Sex in Iron Horse
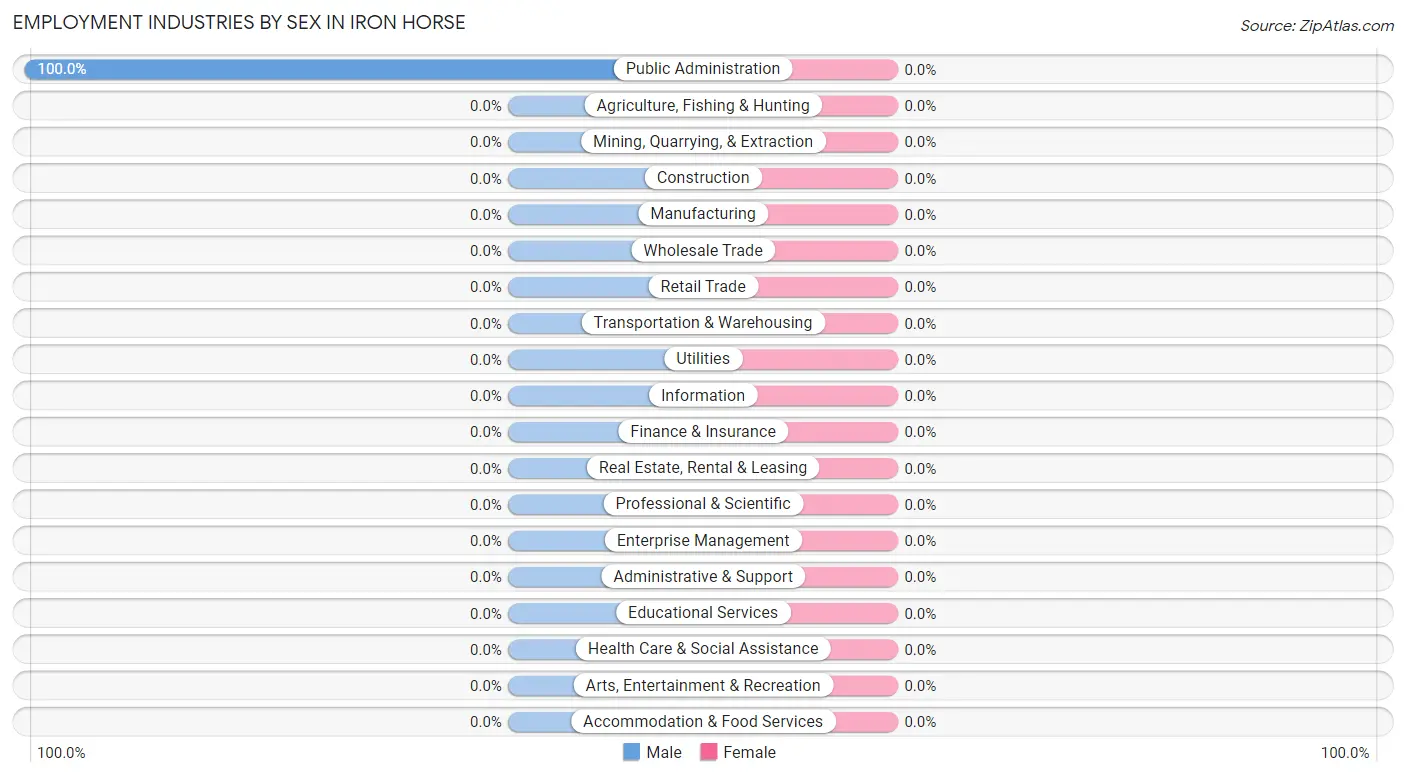
| Industry | Male | Female |
| Agriculture, Fishing & Hunting | 0 (0.0%) | 0 (0.0%) |
| Mining, Quarrying, & Extraction | 0 (0.0%) | 0 (0.0%) |
| Construction | 0 (0.0%) | 0 (0.0%) |
| Manufacturing | 0 (0.0%) | 0 (0.0%) |
| Wholesale Trade | 0 (0.0%) | 0 (0.0%) |
| Retail Trade | 0 (0.0%) | 0 (0.0%) |
| Transportation & Warehousing | 0 (0.0%) | 0 (0.0%) |
| Utilities | 0 (0.0%) | 0 (0.0%) |
| Information | 0 (0.0%) | 0 (0.0%) |
| Finance & Insurance | 0 (0.0%) | 0 (0.0%) |
| Real Estate, Rental & Leasing | 0 (0.0%) | 0 (0.0%) |
| Professional & Scientific | 0 (0.0%) | 0 (0.0%) |
| Enterprise Management | 0 (0.0%) | 0 (0.0%) |
| Administrative & Support | 0 (0.0%) | 0 (0.0%) |
| Educational Services | 0 (0.0%) | 0 (0.0%) |
| Health Care & Social Assistance | 0 (0.0%) | 0 (0.0%) |
| Arts, Entertainment & Recreation | 0 (0.0%) | 0 (0.0%) |
| Accommodation & Food Services | 0 (0.0%) | 0 (0.0%) |
| Public Administration | 49 (100.0%) | 0 (0.0%) |
| Total | 49 (100.0%) | 0 (0.0%) |
Education in Iron Horse
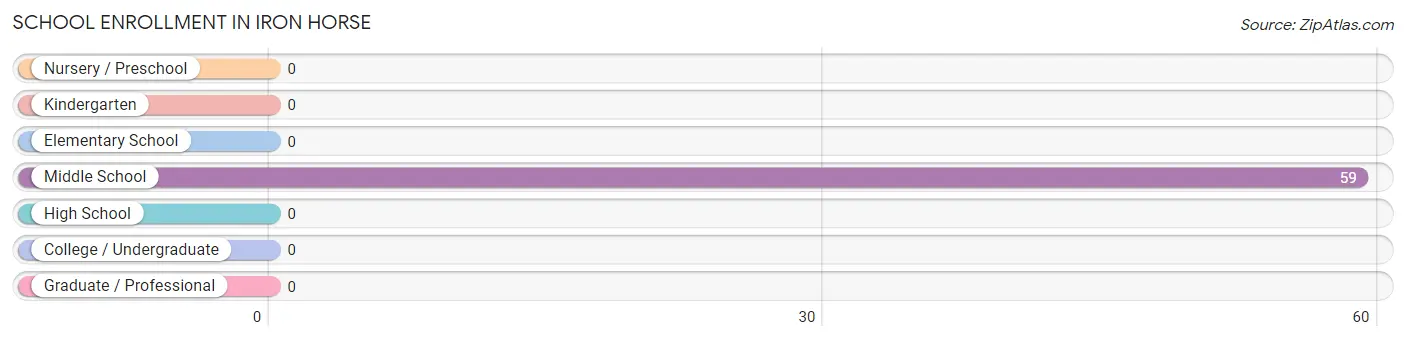
School Enrollment in Iron Horse
| School Level | # Students | % Students |
| Nursery / Preschool | 0 | 0.0% |
| Kindergarten | 0 | 0.0% |
| Elementary School | 0 | 0.0% |
| Middle School | 59 | 100.0% |
| High School | 0 | 0.0% |
| College / Undergraduate | 0 | 0.0% |
| Graduate / Professional | 0 | 0.0% |
| Total | 59 | 100.0% |
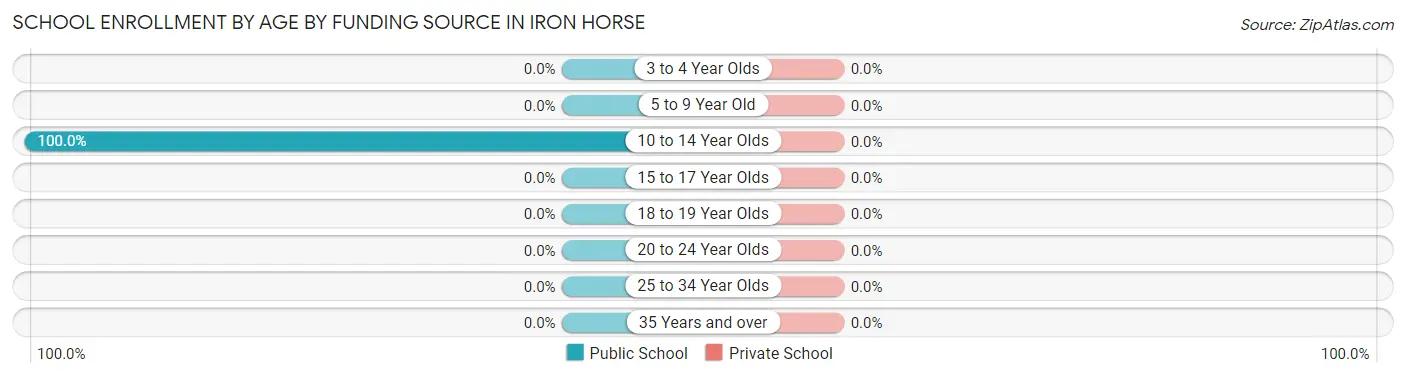
School Enrollment by Age by Funding Source in Iron Horse
| Age Bracket | Public School | Private School |
| 3 to 4 Year Olds | 0 (0.0%) | 0 (0.0%) |
| 5 to 9 Year Old | 0 (0.0%) | 0 (0.0%) |
| 10 to 14 Year Olds | 59 (100.0%) | 0 (0.0%) |
| 15 to 17 Year Olds | 0 (0.0%) | 0 (0.0%) |
| 18 to 19 Year Olds | 0 (0.0%) | 0 (0.0%) |
| 20 to 24 Year Olds | 0 (0.0%) | 0 (0.0%) |
| 25 to 34 Year Olds | 0 (0.0%) | 0 (0.0%) |
| 35 Years and over | 0 (0.0%) | 0 (0.0%) |
| Total | 59 (100.0%) | 0 (0.0%) |
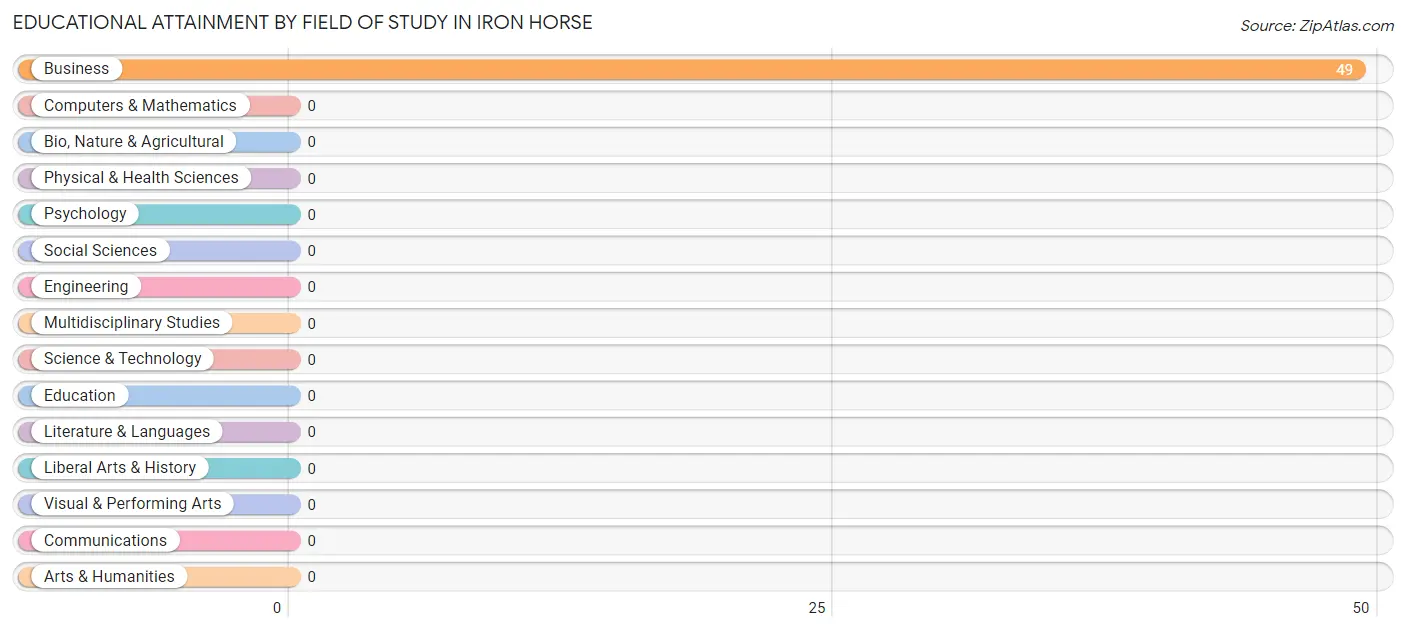
Educational Attainment by Field of Study in Iron Horse
, and business (49 | 100.0%) are the most common fields of study among 49 individuals in Iron Horse who have obtained a bachelor's degree or higher.
| Field of Study | # Graduates | % Graduates |
| Computers & Mathematics | 0 | 0.0% |
| Bio, Nature & Agricultural | 0 | 0.0% |
| Physical & Health Sciences | 0 | 0.0% |
| Psychology | 0 | 0.0% |
| Social Sciences | 0 | 0.0% |
| Engineering | 0 | 0.0% |
| Multidisciplinary Studies | 0 | 0.0% |
| Science & Technology | 0 | 0.0% |
| Business | 49 | 100.0% |
| Education | 0 | 0.0% |
| Literature & Languages | 0 | 0.0% |
| Liberal Arts & History | 0 | 0.0% |
| Visual & Performing Arts | 0 | 0.0% |
| Communications | 0 | 0.0% |
| Arts & Humanities | 0 | 0.0% |
| Total | 49 | 100.0% |
Transportation & Commute in Iron Horse
Vehicle Availability by Sex in Iron Horse
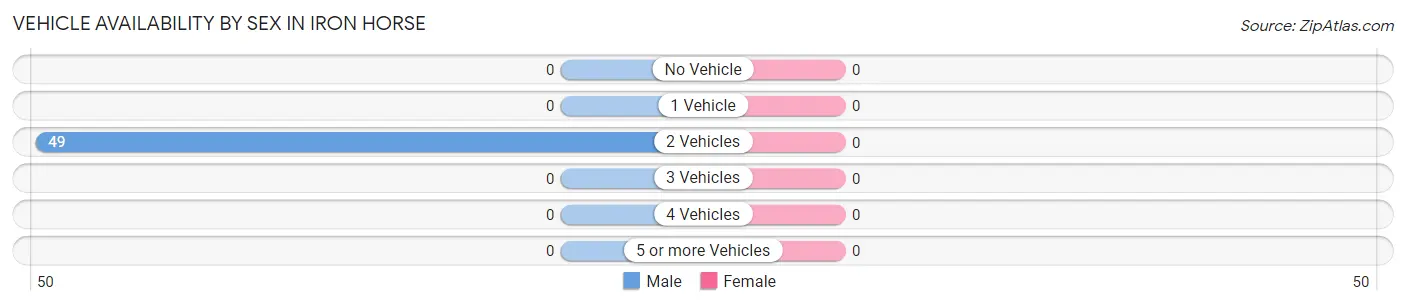
| Vehicles Available | Male | Female |
| No Vehicle | 0 (0.0%) | 0 (0.0%) |
| 1 Vehicle | 0 (0.0%) | 0 (0.0%) |
| 2 Vehicles | 49 (100.0%) | 0 (0.0%) |
| 3 Vehicles | 0 (0.0%) | 0 (0.0%) |
| 4 Vehicles | 0 (0.0%) | 0 (0.0%) |
| 5 or more Vehicles | 0 (0.0%) | 0 (0.0%) |
| Total | 49 (100.0%) | 0 (0.0%) |
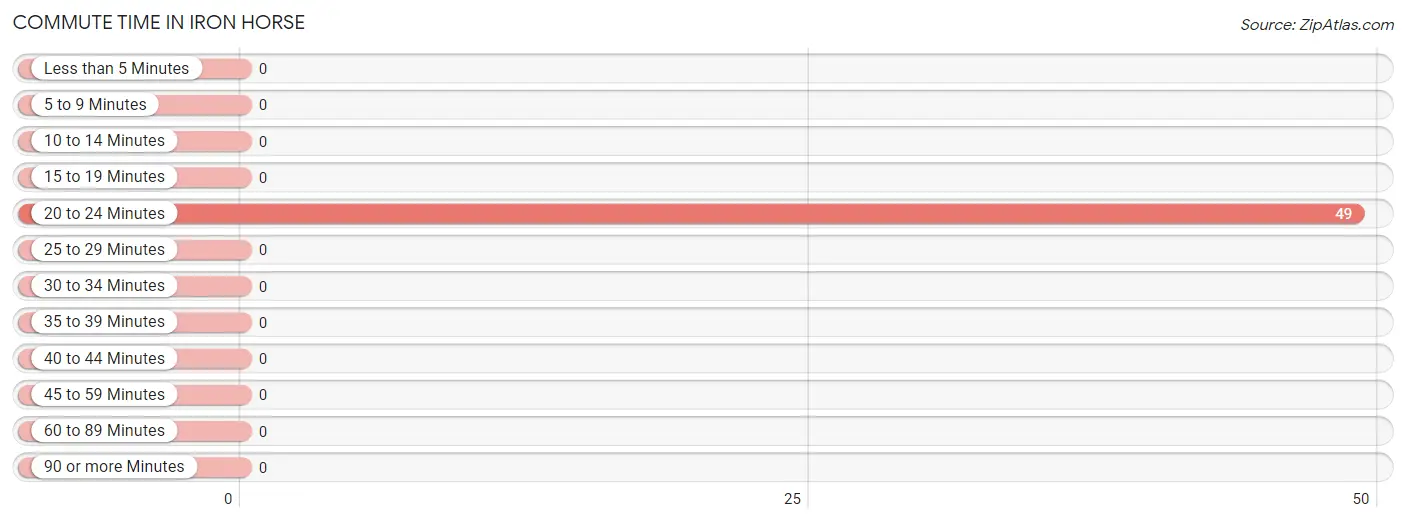
Commute Time in Iron Horse
The most frequently occuring commute durations in Iron Horse are 20 to 24 minutes (49 commuters, 100.0%), less than 5 minutes (0 commuters, 0.0%), and 5 to 9 minutes (0 commuters, 0.0%).
| Commute Time | # Commuters | % Commuters |
| Less than 5 Minutes | 0 | 0.0% |
| 5 to 9 Minutes | 0 | 0.0% |
| 10 to 14 Minutes | 0 | 0.0% |
| 15 to 19 Minutes | 0 | 0.0% |
| 20 to 24 Minutes | 49 | 100.0% |
| 25 to 29 Minutes | 0 | 0.0% |
| 30 to 34 Minutes | 0 | 0.0% |
| 35 to 39 Minutes | 0 | 0.0% |
| 40 to 44 Minutes | 0 | 0.0% |
| 45 to 59 Minutes | 0 | 0.0% |
| 60 to 89 Minutes | 0 | 0.0% |
| 90 or more Minutes | 0 | 0.0% |
Commute Time by Sex in Iron Horse
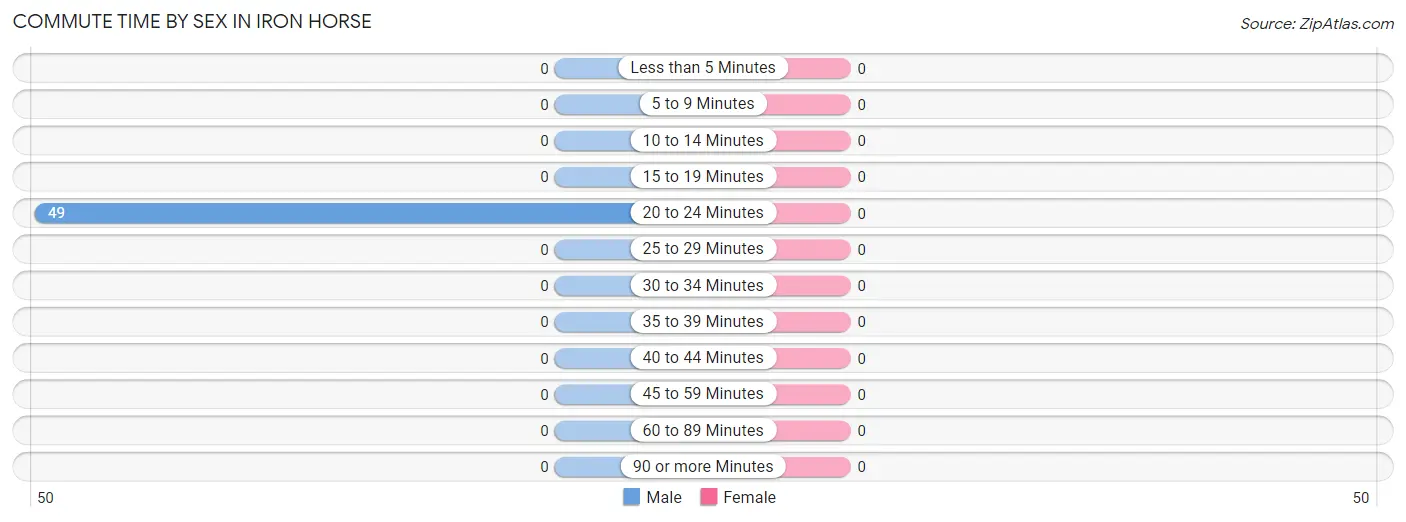
| Commute Time | Male | Female |
| Less than 5 Minutes | 0 (0.0%) | 0 (0.0%) |
| 5 to 9 Minutes | 0 (0.0%) | 0 (0.0%) |
| 10 to 14 Minutes | 0 (0.0%) | 0 (0.0%) |
| 15 to 19 Minutes | 0 (0.0%) | 0 (0.0%) |
| 20 to 24 Minutes | 49 (100.0%) | 0 (0.0%) |
| 25 to 29 Minutes | 0 (0.0%) | 0 (0.0%) |
| 30 to 34 Minutes | 0 (0.0%) | 0 (0.0%) |
| 35 to 39 Minutes | 0 (0.0%) | 0 (0.0%) |
| 40 to 44 Minutes | 0 (0.0%) | 0 (0.0%) |
| 45 to 59 Minutes | 0 (0.0%) | 0 (0.0%) |
| 60 to 89 Minutes | 0 (0.0%) | 0 (0.0%) |
| 90 or more Minutes | 0 (0.0%) | 0 (0.0%) |
Time of Departure to Work by Sex in Iron Horse
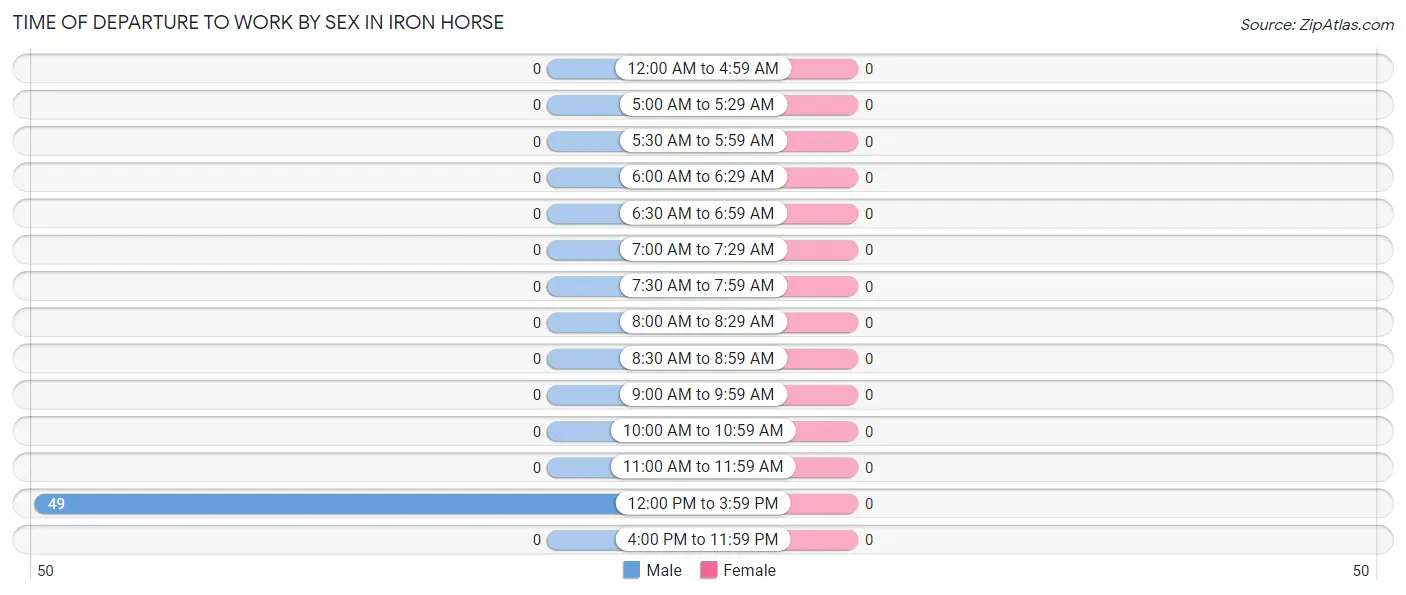
| Time of Departure | Male | Female |
| 12:00 AM to 4:59 AM | 0 (0.0%) | 0 (0.0%) |
| 5:00 AM to 5:29 AM | 0 (0.0%) | 0 (0.0%) |
| 5:30 AM to 5:59 AM | 0 (0.0%) | 0 (0.0%) |
| 6:00 AM to 6:29 AM | 0 (0.0%) | 0 (0.0%) |
| 6:30 AM to 6:59 AM | 0 (0.0%) | 0 (0.0%) |
| 7:00 AM to 7:29 AM | 0 (0.0%) | 0 (0.0%) |
| 7:30 AM to 7:59 AM | 0 (0.0%) | 0 (0.0%) |
| 8:00 AM to 8:29 AM | 0 (0.0%) | 0 (0.0%) |
| 8:30 AM to 8:59 AM | 0 (0.0%) | 0 (0.0%) |
| 9:00 AM to 9:59 AM | 0 (0.0%) | 0 (0.0%) |
| 10:00 AM to 10:59 AM | 0 (0.0%) | 0 (0.0%) |
| 11:00 AM to 11:59 AM | 0 (0.0%) | 0 (0.0%) |
| 12:00 PM to 3:59 PM | 49 (100.0%) | 0 (0.0%) |
| 4:00 PM to 11:59 PM | 0 (0.0%) | 0 (0.0%) |
| Total | 49 (100.0%) | 0 (0.0%) |
Housing Occupancy in Iron Horse
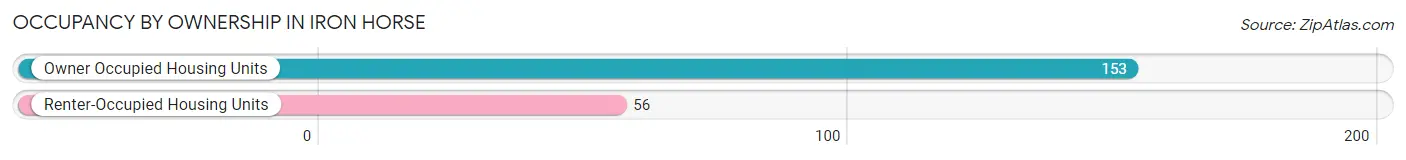
Occupancy by Ownership in Iron Horse
Of the total 209 dwellings in Iron Horse, owner-occupied units account for 153 (73.2%), while renter-occupied units make up 56 (26.8%).
| Occupancy | # Housing Units | % Housing Units |
| Owner Occupied Housing Units | 153 | 73.2% |
| Renter-Occupied Housing Units | 56 | 26.8% |
| Total Occupied Housing Units | 209 | 100.0% |
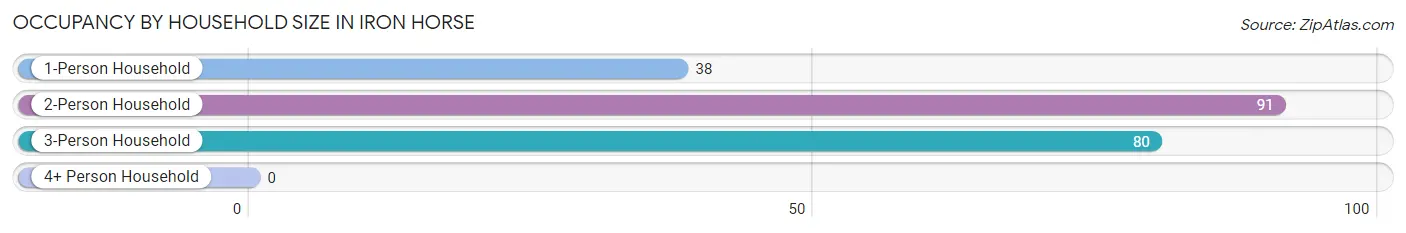
Occupancy by Household Size in Iron Horse
| Household Size | # Housing Units | % Housing Units |
| 1-Person Household | 38 | 18.2% |
| 2-Person Household | 91 | 43.5% |
| 3-Person Household | 80 | 38.3% |
| 4+ Person Household | 0 | 0.0% |
| Total Housing Units | 209 | 100.0% |
Occupancy by Ownership by Household Size in Iron Horse
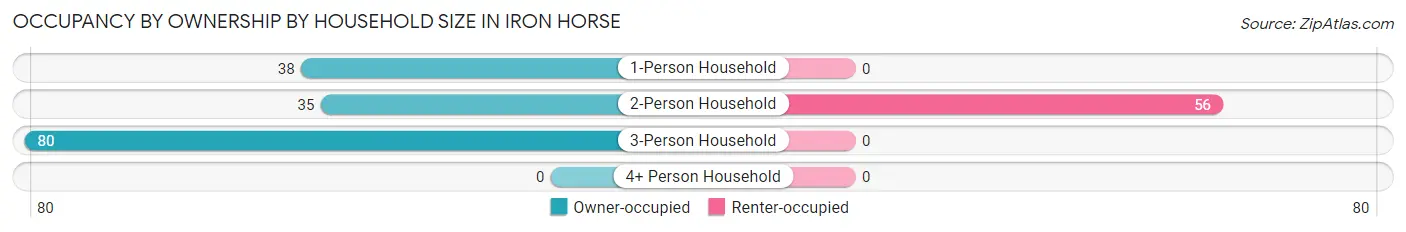
| Household Size | Owner-occupied | Renter-occupied |
| 1-Person Household | 38 (100.0%) | 0 (0.0%) |
| 2-Person Household | 35 (38.5%) | 56 (61.5%) |
| 3-Person Household | 80 (100.0%) | 0 (0.0%) |
| 4+ Person Household | 0 (0.0%) | 0 (0.0%) |
| Total Housing Units | 153 (73.2%) | 56 (26.8%) |
Occupancy by Educational Attainment in Iron Horse
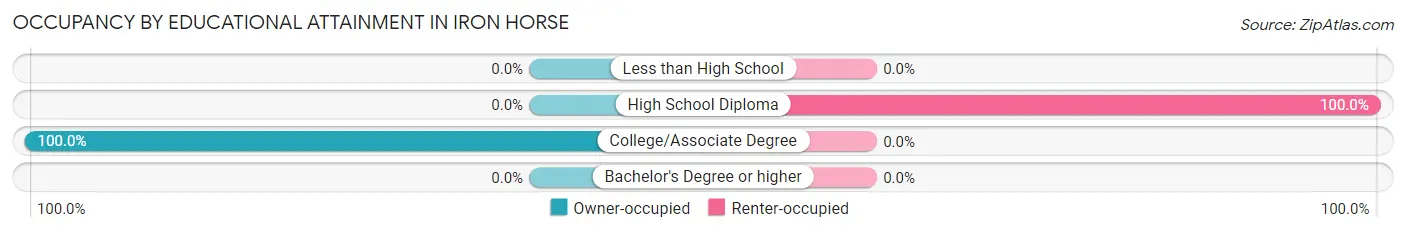
| Household Size | Owner-occupied | Renter-occupied |
| Less than High School | 0 (0.0%) | 0 (0.0%) |
| High School Diploma | 0 (0.0%) | 56 (100.0%) |
| College/Associate Degree | 153 (100.0%) | 0 (0.0%) |
| Bachelor's Degree or higher | 0 (0.0%) | 0 (0.0%) |
Occupancy by Age of Householder in Iron Horse
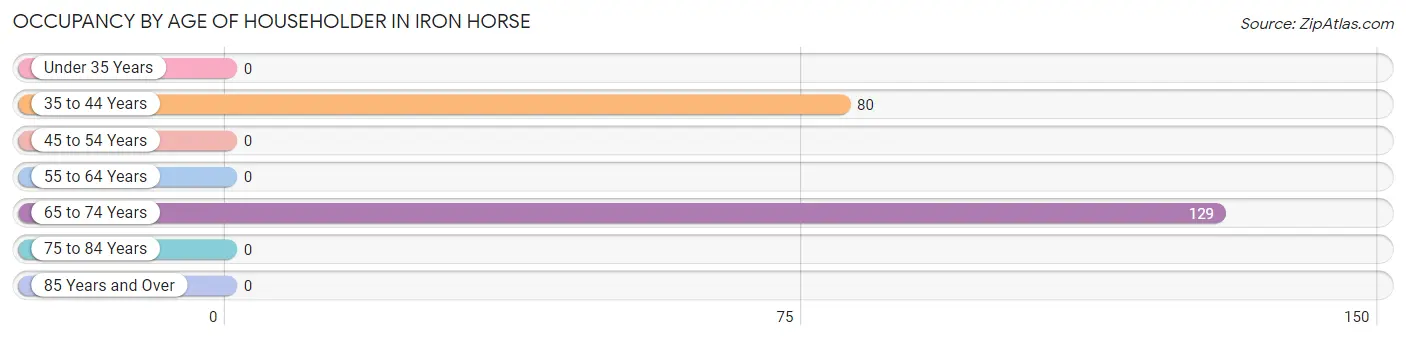
| Age Bracket | # Households | % Households |
| Under 35 Years | 0 | 0.0% |
| 35 to 44 Years | 80 | 38.3% |
| 45 to 54 Years | 0 | 0.0% |
| 55 to 64 Years | 0 | 0.0% |
| 65 to 74 Years | 129 | 61.7% |
| 75 to 84 Years | 0 | 0.0% |
| 85 Years and Over | 0 | 0.0% |
| Total | 209 | 100.0% |
Housing Finances in Iron Horse
Median Income by Occupancy in Iron Horse
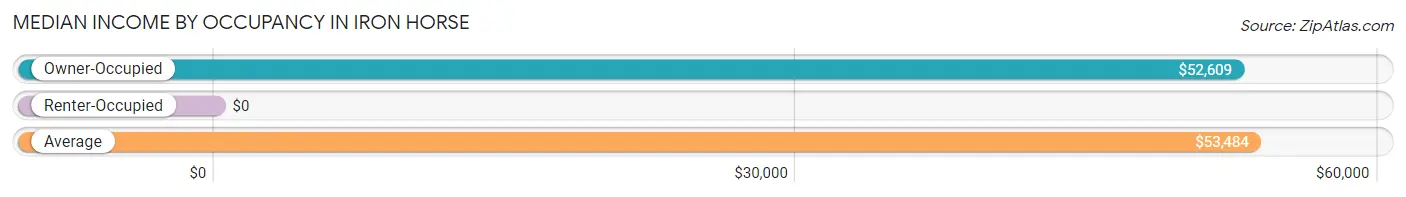
| Occupancy Type | # Households | Median Income |
| Owner-Occupied | 153 (73.2%) | $52,609 |
| Renter-Occupied | 56 (26.8%) | $0 |
| Average | 209 (100.0%) | $53,484 |
Occupancy by Householder Income Bracket in Iron Horse
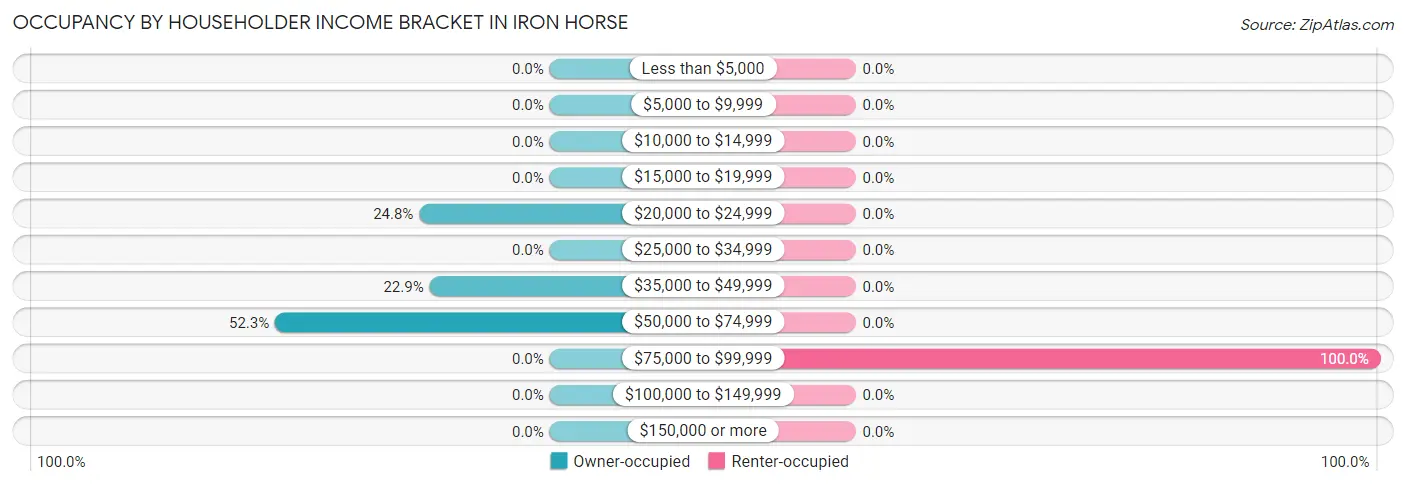
| Income Bracket | Owner-occupied | Renter-occupied |
| Less than $5,000 | 0 (0.0%) | 0 (0.0%) |
| $5,000 to $9,999 | 0 (0.0%) | 0 (0.0%) |
| $10,000 to $14,999 | 0 (0.0%) | 0 (0.0%) |
| $15,000 to $19,999 | 0 (0.0%) | 0 (0.0%) |
| $20,000 to $24,999 | 38 (24.8%) | 0 (0.0%) |
| $25,000 to $34,999 | 0 (0.0%) | 0 (0.0%) |
| $35,000 to $49,999 | 35 (22.9%) | 0 (0.0%) |
| $50,000 to $74,999 | 80 (52.3%) | 0 (0.0%) |
| $75,000 to $99,999 | 0 (0.0%) | 56 (100.0%) |
| $100,000 to $149,999 | 0 (0.0%) | 0 (0.0%) |
| $150,000 or more | 0 (0.0%) | 0 (0.0%) |
| Total | 153 (100.0%) | 56 (100.0%) |
Monthly Housing Cost Tiers in Iron Horse
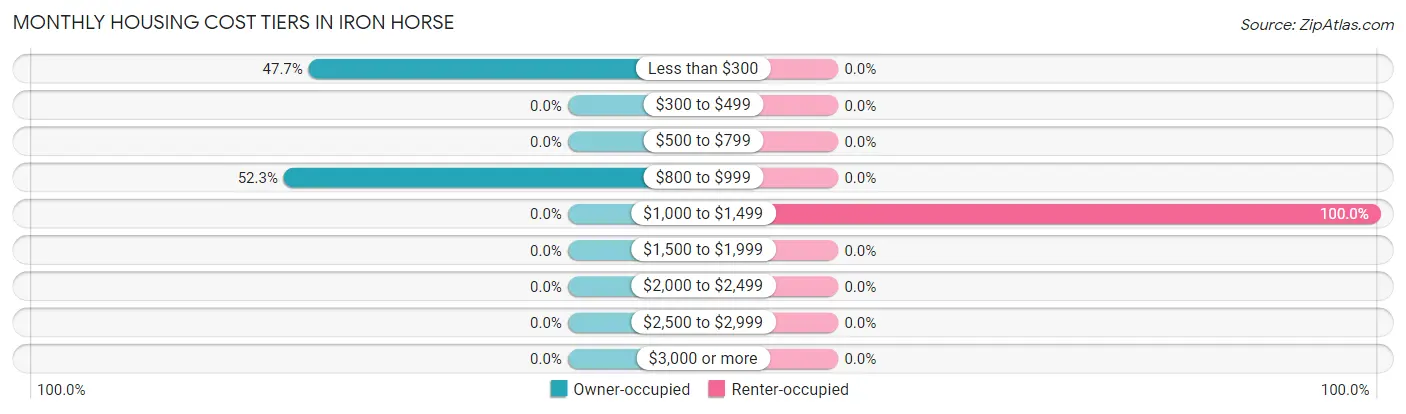
| Monthly Cost | Owner-occupied | Renter-occupied |
| Less than $300 | 73 (47.7%) | 0 (0.0%) |
| $300 to $499 | 0 (0.0%) | 0 (0.0%) |
| $500 to $799 | 0 (0.0%) | 0 (0.0%) |
| $800 to $999 | 80 (52.3%) | 0 (0.0%) |
| $1,000 to $1,499 | 0 (0.0%) | 56 (100.0%) |
| $1,500 to $1,999 | 0 (0.0%) | 0 (0.0%) |
| $2,000 to $2,499 | 0 (0.0%) | 0 (0.0%) |
| $2,500 to $2,999 | 0 (0.0%) | 0 (0.0%) |
| $3,000 or more | 0 (0.0%) | 0 (0.0%) |
| Total | 153 (100.0%) | 56 (100.0%) |
Physical Housing Characteristics in Iron Horse
Housing Structures in Iron Horse
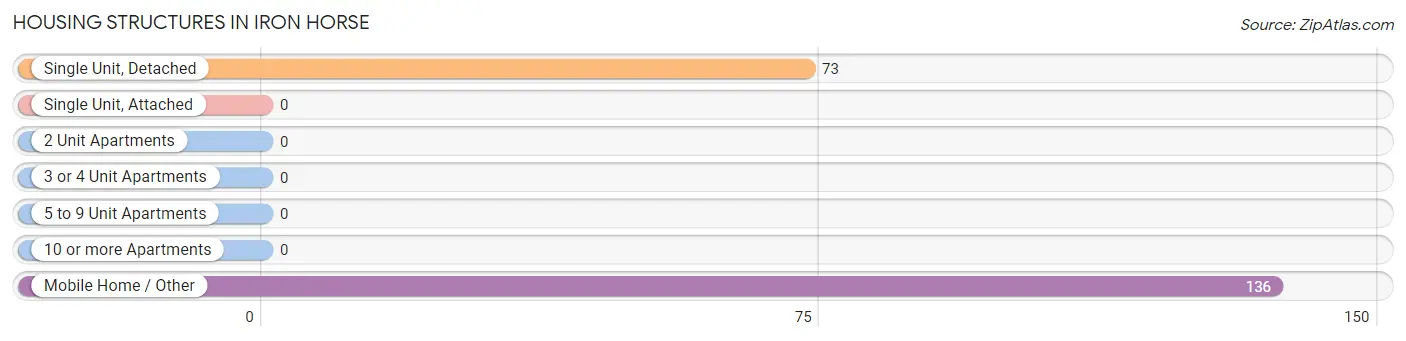
| Structure Type | # Housing Units | % Housing Units |
| Single Unit, Detached | 73 | 34.9% |
| Single Unit, Attached | 0 | 0.0% |
| 2 Unit Apartments | 0 | 0.0% |
| 3 or 4 Unit Apartments | 0 | 0.0% |
| 5 to 9 Unit Apartments | 0 | 0.0% |
| 10 or more Apartments | 0 | 0.0% |
| Mobile Home / Other | 136 | 65.1% |
| Total | 209 | 100.0% |
Housing Structures by Occupancy in Iron Horse
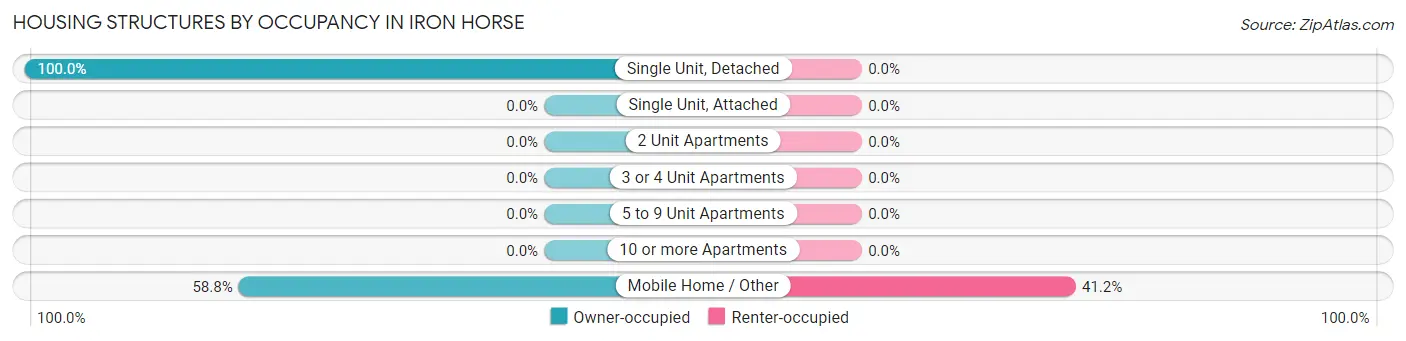
| Structure Type | Owner-occupied | Renter-occupied |
| Single Unit, Detached | 73 (100.0%) | 0 (0.0%) |
| Single Unit, Attached | 0 (0.0%) | 0 (0.0%) |
| 2 Unit Apartments | 0 (0.0%) | 0 (0.0%) |
| 3 or 4 Unit Apartments | 0 (0.0%) | 0 (0.0%) |
| 5 to 9 Unit Apartments | 0 (0.0%) | 0 (0.0%) |
| 10 or more Apartments | 0 (0.0%) | 0 (0.0%) |
| Mobile Home / Other | 80 (58.8%) | 56 (41.2%) |
| Total | 153 (73.2%) | 56 (26.8%) |
Housing Structures by Number of Rooms in Iron Horse
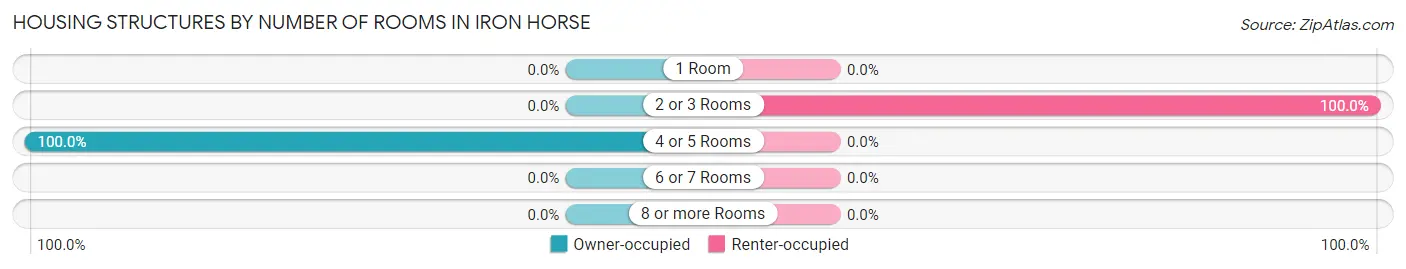
| Number of Rooms | Owner-occupied | Renter-occupied |
| 1 Room | 0 (0.0%) | 0 (0.0%) |
| 2 or 3 Rooms | 0 (0.0%) | 56 (100.0%) |
| 4 or 5 Rooms | 153 (100.0%) | 0 (0.0%) |
| 6 or 7 Rooms | 0 (0.0%) | 0 (0.0%) |
| 8 or more Rooms | 0 (0.0%) | 0 (0.0%) |
| Total | 153 (100.0%) | 56 (100.0%) |
Housing Structure by Heating Type in Iron Horse
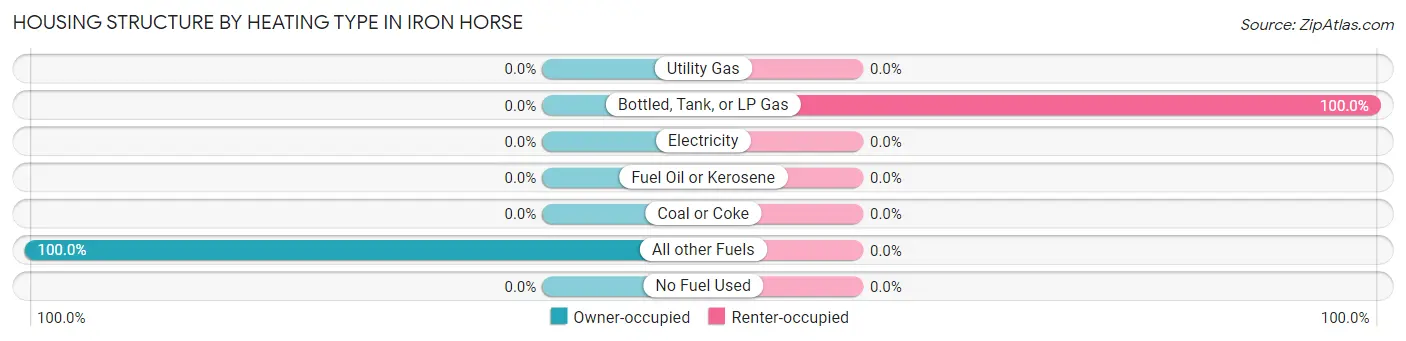
| Heating Type | Owner-occupied | Renter-occupied |
| Utility Gas | 0 (0.0%) | 0 (0.0%) |
| Bottled, Tank, or LP Gas | 0 (0.0%) | 56 (100.0%) |
| Electricity | 0 (0.0%) | 0 (0.0%) |
| Fuel Oil or Kerosene | 0 (0.0%) | 0 (0.0%) |
| Coal or Coke | 0 (0.0%) | 0 (0.0%) |
| All other Fuels | 153 (100.0%) | 0 (0.0%) |
| No Fuel Used | 0 (0.0%) | 0 (0.0%) |
| Total | 153 (100.0%) | 56 (100.0%) |
Household Vehicle Usage in Iron Horse
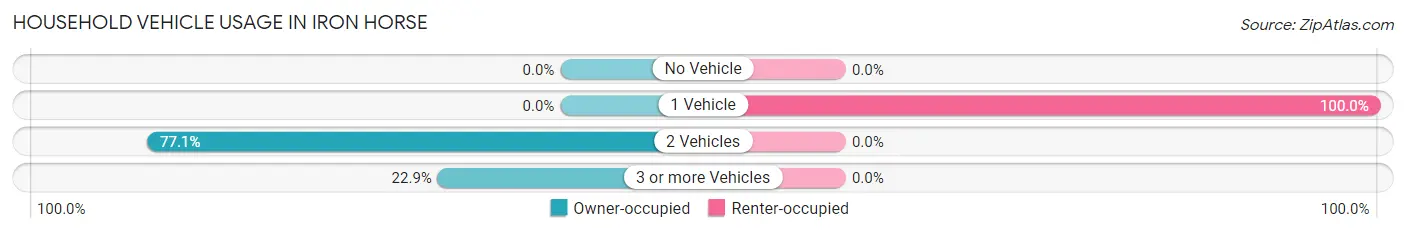
| Vehicles per Household | Owner-occupied | Renter-occupied |
| No Vehicle | 0 (0.0%) | 0 (0.0%) |
| 1 Vehicle | 0 (0.0%) | 56 (100.0%) |
| 2 Vehicles | 118 (77.1%) | 0 (0.0%) |
| 3 or more Vehicles | 35 (22.9%) | 0 (0.0%) |
| Total | 153 (100.0%) | 56 (100.0%) |
Real Estate & Mortgages in Iron Horse
Real Estate and Mortgage Overview in Iron Horse
| Characteristic | Without Mortgage | With Mortgage |
| Housing Units | 73 | 80 |
| Median Property Value | - | - |
| Median Household Income | - | - |
| Monthly Housing Costs | - | - |
| Real Estate Taxes | - | - |
Property Value by Mortgage Status in Iron Horse
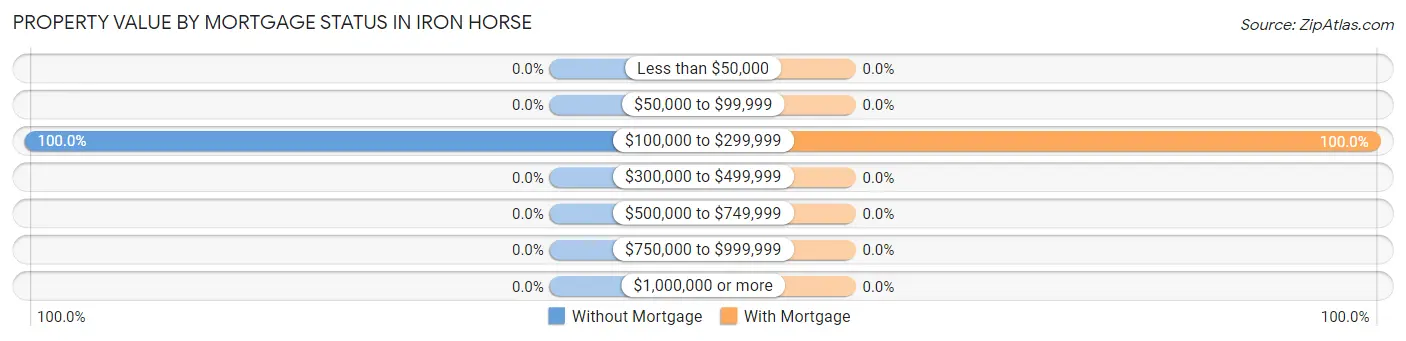
| Property Value | Without Mortgage | With Mortgage |
| Less than $50,000 | 0 (0.0%) | 0 (0.0%) |
| $50,000 to $99,999 | 0 (0.0%) | 0 (0.0%) |
| $100,000 to $299,999 | 73 (100.0%) | 80 (100.0%) |
| $300,000 to $499,999 | 0 (0.0%) | 0 (0.0%) |
| $500,000 to $749,999 | 0 (0.0%) | 0 (0.0%) |
| $750,000 to $999,999 | 0 (0.0%) | 0 (0.0%) |
| $1,000,000 or more | 0 (0.0%) | 0 (0.0%) |
| Total | 73 (100.0%) | 80 (100.0%) |
Household Income by Mortgage Status in Iron Horse
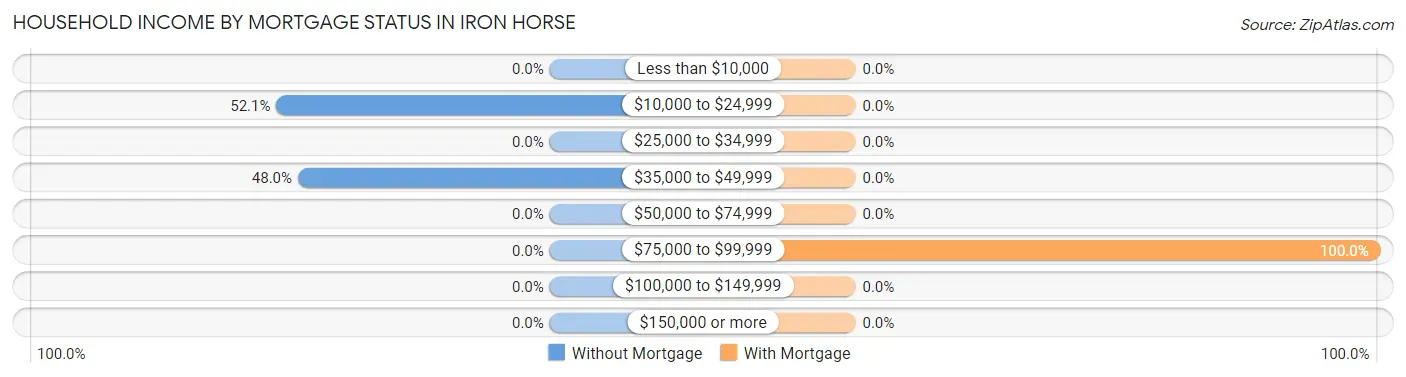
| Household Income | Without Mortgage | With Mortgage |
| Less than $10,000 | 0 (0.0%) | 0 (0.0%) |
| $10,000 to $24,999 | 38 (52.0%) | 0 (0.0%) |
| $25,000 to $34,999 | 0 (0.0%) | 0 (0.0%) |
| $35,000 to $49,999 | 35 (47.9%) | 0 (0.0%) |
| $50,000 to $74,999 | 0 (0.0%) | 0 (0.0%) |
| $75,000 to $99,999 | 0 (0.0%) | 80 (100.0%) |
| $100,000 to $149,999 | 0 (0.0%) | 0 (0.0%) |
| $150,000 or more | 0 (0.0%) | 0 (0.0%) |
| Total | 73 (100.0%) | 80 (100.0%) |
Property Value to Household Income Ratio in Iron Horse
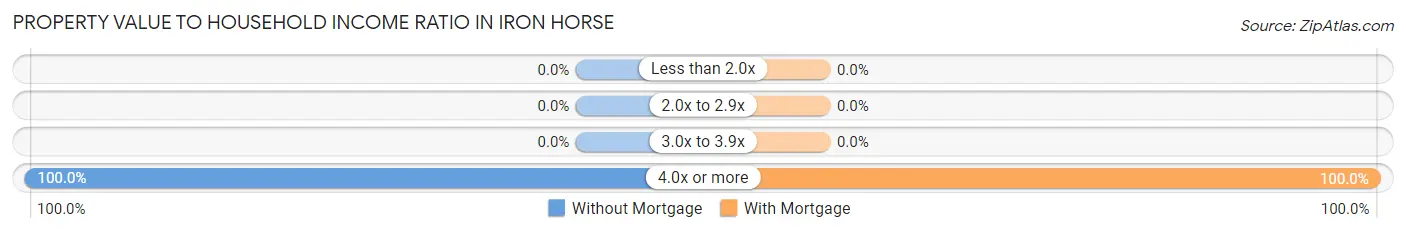
| Value-to-Income Ratio | Without Mortgage | With Mortgage |
| Less than 2.0x | 0 (0.0%) | 0 (0.0%) |
| 2.0x to 2.9x | 0 (0.0%) | 0 (0.0%) |
| 3.0x to 3.9x | 0 (0.0%) | 0 (0.0%) |
| 4.0x or more | 73 (100.0%) | 80 (100.0%) |
| Total | 73 (100.0%) | 80 (100.0%) |
Real Estate Taxes by Mortgage Status in Iron Horse
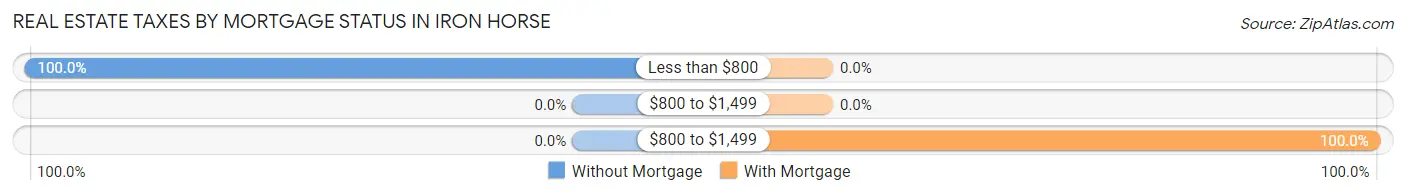
| Property Taxes | Without Mortgage | With Mortgage |
| Less than $800 | 73 (100.0%) | 0 (0.0%) |
| $800 to $1,499 | 0 (0.0%) | 0 (0.0%) |
| $800 to $1,499 | 0 (0.0%) | 80 (100.0%) |
| Total | 73 (100.0%) | 80 (100.0%) |
Health & Disability in Iron Horse
Health Insurance Coverage by Age in Iron Horse
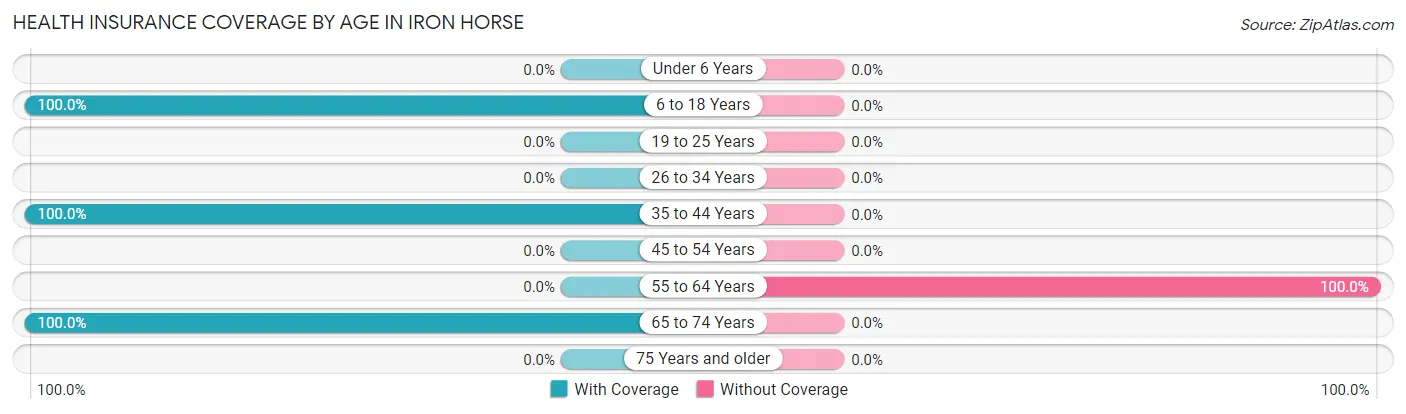
| Age Bracket | With Coverage | Without Coverage |
| Under 6 Years | 0 (0.0%) | 0 (0.0%) |
| 6 to 18 Years | 59 (100.0%) | 0 (0.0%) |
| 19 to 25 Years | 0 (0.0%) | 0 (0.0%) |
| 26 to 34 Years | 0 (0.0%) | 0 (0.0%) |
| 35 to 44 Years | 129 (100.0%) | 0 (0.0%) |
| 45 to 54 Years | 0 (0.0%) | 0 (0.0%) |
| 55 to 64 Years | 0 (0.0%) | 50 (100.0%) |
| 65 to 74 Years | 180 (100.0%) | 0 (0.0%) |
| 75 Years and older | 0 (0.0%) | 0 (0.0%) |
| Total | 368 (88.0%) | 50 (12.0%) |
Health Insurance Coverage by Citizenship Status in Iron Horse
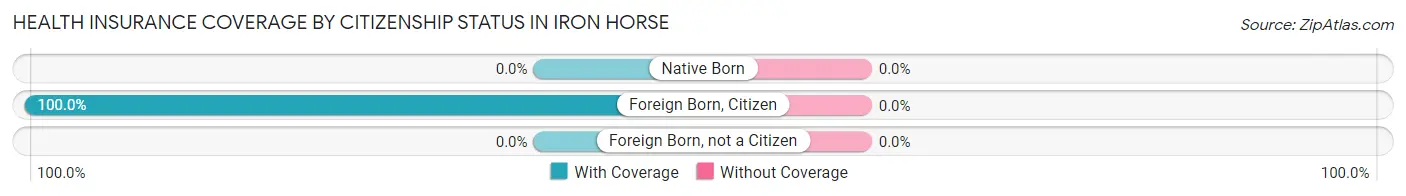
| Citizenship Status | With Coverage | Without Coverage |
| Native Born | 0 (0.0%) | 0 (0.0%) |
| Foreign Born, Citizen | 59 (100.0%) | 0 (0.0%) |
| Foreign Born, not a Citizen | 0 (0.0%) | 0 (0.0%) |
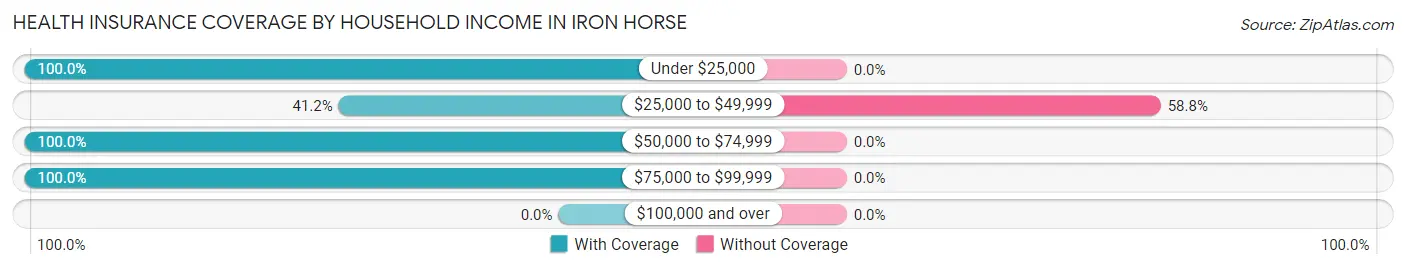
Health Insurance Coverage by Household Income in Iron Horse
| Household Income | With Coverage | Without Coverage |
| Under $25,000 | 38 (100.0%) | 0 (0.0%) |
| $25,000 to $49,999 | 35 (41.2%) | 50 (58.8%) |
| $50,000 to $74,999 | 188 (100.0%) | 0 (0.0%) |
| $75,000 to $99,999 | 107 (100.0%) | 0 (0.0%) |
| $100,000 and over | 0 (0.0%) | 0 (0.0%) |
Public vs Private Health Insurance Coverage by Age in Iron Horse
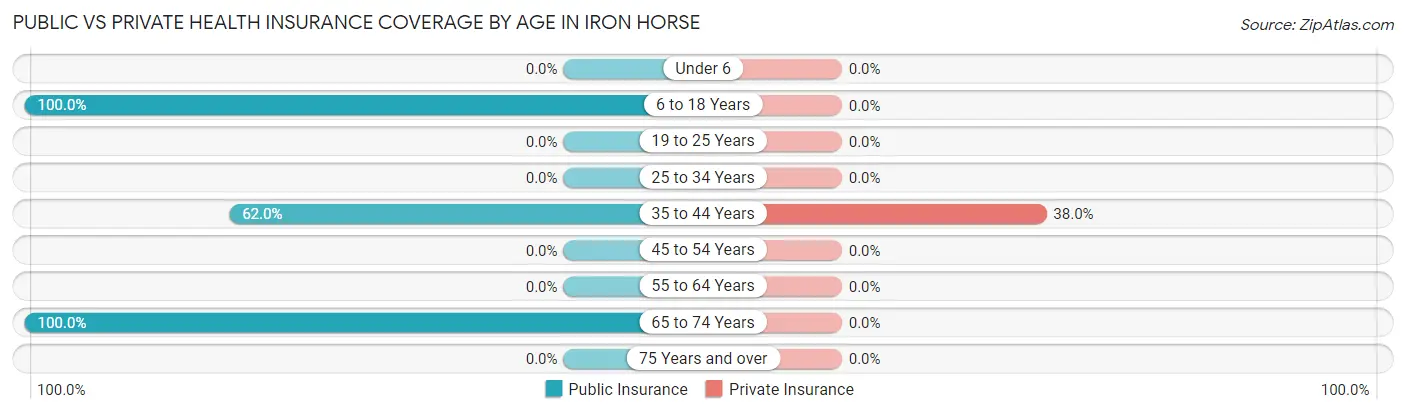
| Age Bracket | Public Insurance | Private Insurance |
| Under 6 | 0 (0.0%) | 0 (0.0%) |
| 6 to 18 Years | 59 (100.0%) | 0 (0.0%) |
| 19 to 25 Years | 0 (0.0%) | 0 (0.0%) |
| 25 to 34 Years | 0 (0.0%) | 0 (0.0%) |
| 35 to 44 Years | 80 (62.0%) | 49 (38.0%) |
| 45 to 54 Years | 0 (0.0%) | 0 (0.0%) |
| 55 to 64 Years | 0 (0.0%) | 0 (0.0%) |
| 65 to 74 Years | 180 (100.0%) | 0 (0.0%) |
| 75 Years and over | 0 (0.0%) | 0 (0.0%) |
| Total | 319 (76.3%) | 49 (11.7%) |
Disability Status by Sex by Age in Iron Horse
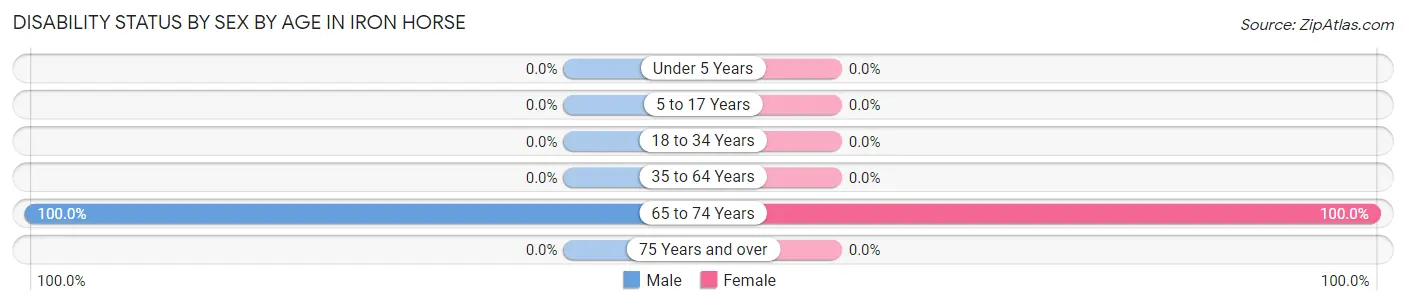
| Age Bracket | Male | Female |
| Under 5 Years | 0 (0.0%) | 0 (0.0%) |
| 5 to 17 Years | 0 (0.0%) | 0 (0.0%) |
| 18 to 34 Years | 0 (0.0%) | 0 (0.0%) |
| 35 to 64 Years | 0 (0.0%) | 0 (0.0%) |
| 65 to 74 Years | 94 (100.0%) | 86 (100.0%) |
| 75 Years and over | 0 (0.0%) | 0 (0.0%) |
Disability Class by Sex by Age in Iron Horse
Disability Class: Hearing Difficulty
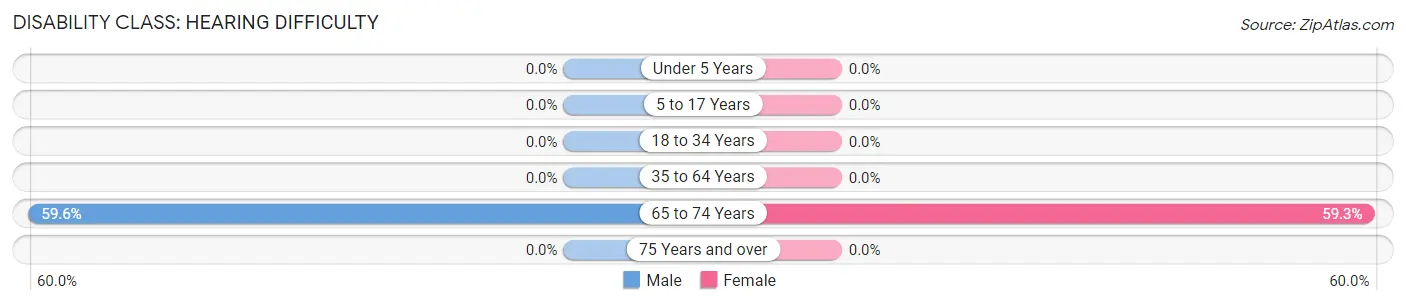
| Age Bracket | Male | Female |
| Under 5 Years | 0 (0.0%) | 0 (0.0%) |
| 5 to 17 Years | 0 (0.0%) | 0 (0.0%) |
| 18 to 34 Years | 0 (0.0%) | 0 (0.0%) |
| 35 to 64 Years | 0 (0.0%) | 0 (0.0%) |
| 65 to 74 Years | 56 (59.6%) | 51 (59.3%) |
| 75 Years and over | 0 (0.0%) | 0 (0.0%) |
Disability Class: Vision Difficulty
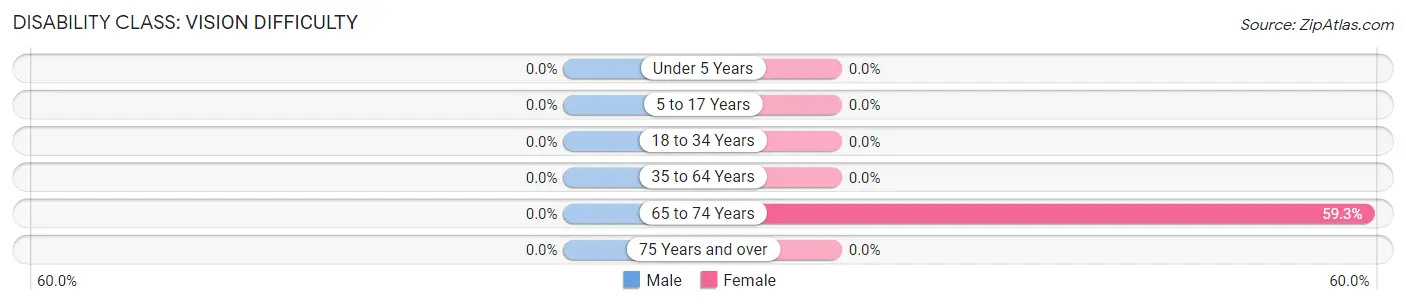
| Age Bracket | Male | Female |
| Under 5 Years | 0 (0.0%) | 0 (0.0%) |
| 5 to 17 Years | 0 (0.0%) | 0 (0.0%) |
| 18 to 34 Years | 0 (0.0%) | 0 (0.0%) |
| 35 to 64 Years | 0 (0.0%) | 0 (0.0%) |
| 65 to 74 Years | 0 (0.0%) | 51 (59.3%) |
| 75 Years and over | 0 (0.0%) | 0 (0.0%) |
Disability Class: Cognitive Difficulty

| Age Bracket | Male | Female |
| 5 to 17 Years | 0 (0.0%) | 0 (0.0%) |
| 18 to 34 Years | 0 (0.0%) | 0 (0.0%) |
| 35 to 64 Years | 0 (0.0%) | 0 (0.0%) |
| 65 to 74 Years | 38 (40.4%) | 0 (0.0%) |
| 75 Years and over | 0 (0.0%) | 0 (0.0%) |
Disability Class: Ambulatory Difficulty
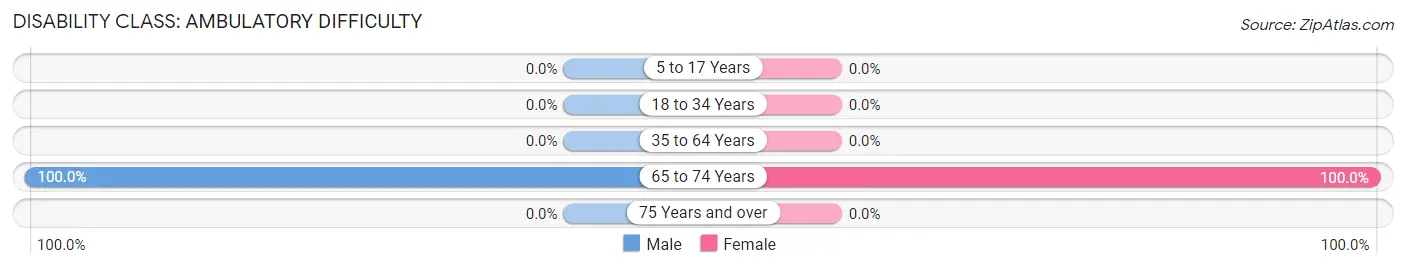
| Age Bracket | Male | Female |
| 5 to 17 Years | 0 (0.0%) | 0 (0.0%) |
| 18 to 34 Years | 0 (0.0%) | 0 (0.0%) |
| 35 to 64 Years | 0 (0.0%) | 0 (0.0%) |
| 65 to 74 Years | 94 (100.0%) | 86 (100.0%) |
| 75 Years and over | 0 (0.0%) | 0 (0.0%) |
Disability Class: Self-Care Difficulty
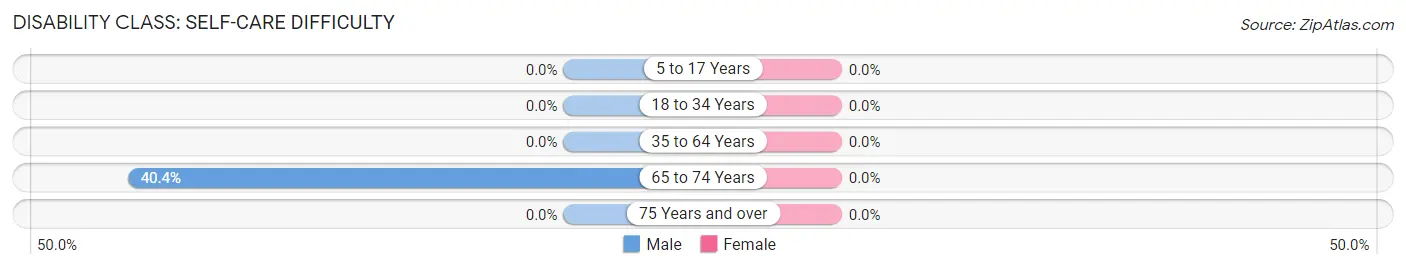
| Age Bracket | Male | Female |
| 5 to 17 Years | 0 (0.0%) | 0 (0.0%) |
| 18 to 34 Years | 0 (0.0%) | 0 (0.0%) |
| 35 to 64 Years | 0 (0.0%) | 0 (0.0%) |
| 65 to 74 Years | 38 (40.4%) | 0 (0.0%) |
| 75 Years and over | 0 (0.0%) | 0 (0.0%) |
Technology Access in Iron Horse
Computing Device Access in Iron Horse
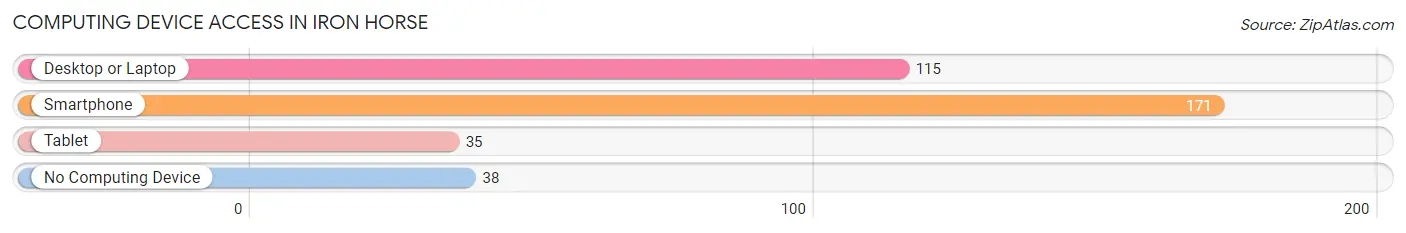
| Device Type | # Households | % Households |
| Desktop or Laptop | 115 | 55.0% |
| Smartphone | 171 | 81.8% |
| Tablet | 35 | 16.8% |
| No Computing Device | 38 | 18.2% |
| Total | 209 | 100.0% |
Internet Access in Iron Horse
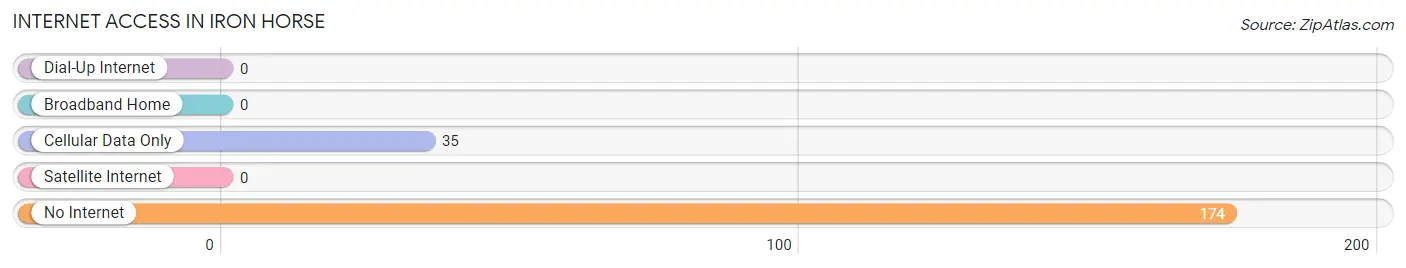
| Internet Type | # Households | % Households |
| Dial-Up Internet | 0 | 0.0% |
| Broadband Home | 0 | 0.0% |
| Cellular Data Only | 35 | 16.8% |
| Satellite Internet | 0 | 0.0% |
| No Internet | 174 | 83.3% |
| Total | 209 | 100.0% |
Iron Horse Summary
History
Iron Horse, California is a small town located in the Sierra Nevada foothills of El Dorado County. It was founded in 1849 by a group of miners who were searching for gold. The town was named after the Iron Horse, a steam locomotive that was used to transport the miners and their supplies to the area. The town quickly grew and became a bustling mining community.
In the late 1800s, Iron Horse was a major stop on the Central Pacific Railroad. The railroad brought in many new settlers and businesses, and the town flourished. The town was also home to a number of saloons, hotels, and other businesses.
In the early 1900s, Iron Horse began to decline as the gold rush ended and the railroad moved on. The town was nearly abandoned by the 1930s, but a few hardy souls remained. In the 1950s, the town was revitalized when the Iron Horse Inn was built. The inn was a popular destination for tourists and locals alike.
In the 1970s, Iron Horse began to experience a resurgence. The town was designated as a California Historical Landmark in 1975, and the Iron Horse Inn was restored and reopened. The town also became a popular destination for outdoor recreation, with hiking, camping, and fishing in the nearby lakes and rivers.
Today, Iron Horse is a small but vibrant community. The town is home to a variety of businesses, including restaurants, shops, and galleries. The Iron Horse Inn is still a popular destination, and the town is a popular spot for outdoor recreation.
Geography
Iron Horse is located in the Sierra Nevada foothills of El Dorado County, California. The town is situated at an elevation of 2,400 feet, and is surrounded by rolling hills and forests. The nearby American River provides a source of recreation for the town, and the nearby lakes and rivers are popular spots for fishing and camping.
The climate in Iron Horse is mild and temperate, with hot summers and cool winters. The average high temperature in the summer is around 90 degrees Fahrenheit, and the average low temperature in the winter is around 30 degrees Fahrenheit.
Economy
Iron Horse’s economy is largely based on tourism and outdoor recreation. The town is a popular destination for hikers, campers, and fishermen, and the Iron Horse Inn is a popular destination for tourists. The town also has a number of restaurants, shops, and galleries.
The town is also home to a number of small businesses, including a lumber mill, a sawmill, and a few small farms. The town is also home to a number of wineries, and the nearby American River provides a source of recreation for the town.
Demographics
As of the 2010 census, Iron Horse had a population of 1,845. The population is largely white (90.2%), with a small Hispanic population (4.2%) and a small African American population (2.2%). The median household income is $50,000, and the median age is 44.
Iron Horse is a small but vibrant community. The town is home to a variety of businesses, and the nearby lakes and rivers provide a source of recreation for the town. The town is also home to a number of wineries, and the Iron Horse Inn is a popular destination for tourists.
Common Questions
What is Per Capita Income in Iron Horse?
Per Capita income in Iron Horse is $22,722.
What is the Median Household income in Iron Horse?
Median Household Income in Iron Horse is $53,484.
What is Inequality or Gini Index in Iron Horse?
Inequality or Gini Index in Iron Horse is 0.19.
What is the Total Population of Iron Horse?
Total Population of Iron Horse is 418.
What is the Total Male Population of Iron Horse?
Total Male Population of Iron Horse is 252.
What is the Total Female Population of Iron Horse?
Total Female Population of Iron Horse is 166.
What is the Ratio of Males per 100 Females in Iron Horse?
There are 151.81 Males per 100 Females in Iron Horse.
What is the Ratio of Females per 100 Males in Iron Horse?
There are 65.87 Females per 100 Males in Iron Horse.
What is the Median Population Age in Iron Horse?
Median Population Age in Iron Horse is 56.4 Years.
What is the Average Family Size in Iron Horse
Average Family Size in Iron Horse is 2.4 People.
What is the Average Household Size in Iron Horse
Average Household Size in Iron Horse is 2.0 People.
How Large is the Labor Force in Iron Horse?
There are 49 People in the Labor Forcein in Iron Horse.
What is the Percentage of People in the Labor Force in Iron Horse?
13.6% of People are in the Labor Force in Iron Horse.