Cities with the Highest Percentage of Local Government Employees in Oklahoma
RELATED REPORTS & OPTIONS
Local Government Employees
Oklahoma
Compare Cities
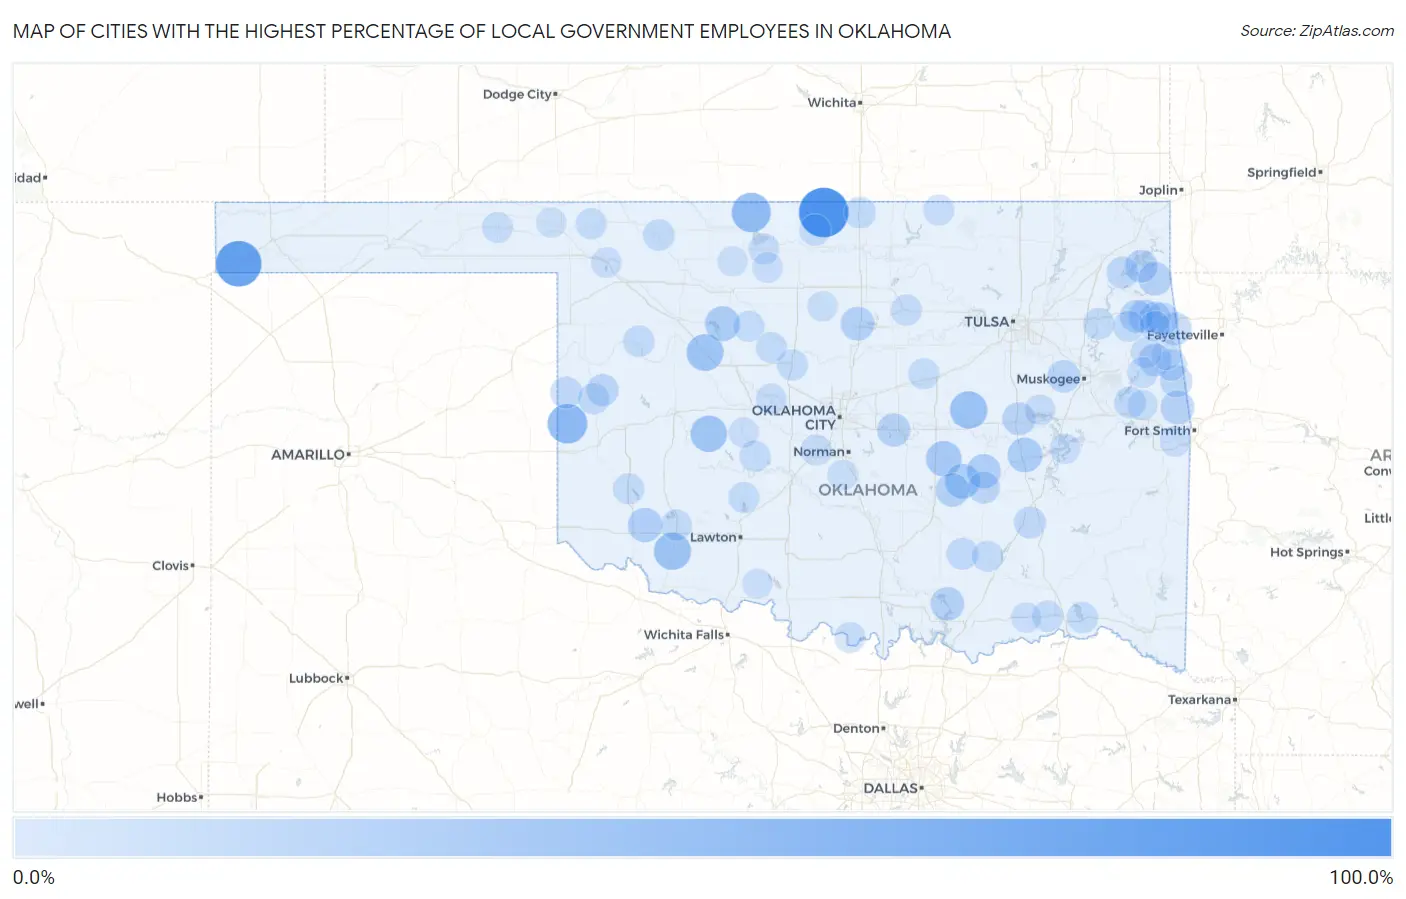
Map of Cities with the Highest Percentage of Local Government Employees in Oklahoma
0.0%
100.0%
Cities with the Highest Percentage of Local Government Employees in Oklahoma
| City | % Local Government Employees | vs State | vs National | |
| 1. | Renfrow | 100.0% | 6.3%(+93.7)#1 | 7.2%(+92.8)#33 |
| 2. | Felt | 82.8% | 6.3%(+76.4)#2 | 7.2%(+75.5)#78 |
| 3. | Durham | 70.0% | 6.3%(+63.7)#3 | 7.2%(+62.8)#115 |
| 4. | Lawtonka Acres | 63.2% | 6.3%(+56.8)#4 | 7.2%(+55.9)#147 |
| 5. | Sweetwater | 56.1% | 6.3%(+49.7)#5 | 7.2%(+48.8)#197 |
| 6. | Amorita | 53.8% | 6.3%(+47.5)#6 | 7.2%(+46.6)#227 |
| 7. | Eagle | 50.0% | 6.3%(+43.7)#7 | 7.2%(+42.8)#301 |
| 8. | Washita | 48.9% | 6.3%(+42.5)#8 | 7.2%(+41.7)#314 |
| 9. | Lovell | 48.0% | 6.3%(+41.7)#9 | 7.2%(+40.8)#327 |
| 10. | Ixl | 46.2% | 6.3%(+39.8)#10 | 7.2%(+38.9)#359 |
| 11. | Manitou | 45.3% | 6.3%(+39.0)#11 | 7.2%(+38.1)#370 |
| 12. | Oakwood | 43.8% | 6.3%(+37.4)#12 | 7.2%(+36.5)#400 |
| 13. | Colony | 42.4% | 6.3%(+36.0)#13 | 7.2%(+35.1)#427 |
| 14. | Scipio | 41.9% | 6.3%(+35.6)#14 | 7.2%(+34.7)#435 |
| 15. | Cave Spring | 40.5% | 6.3%(+34.1)#15 | 7.2%(+33.2)#464 |
| 16. | Pumpkin Hollow | 38.5% | 6.3%(+32.1)#16 | 7.2%(+31.2)#511 |
| 17. | Lima | 38.5% | 6.3%(+32.1)#17 | 7.2%(+31.2)#512 |
| 18. | Longdale | 35.5% | 6.3%(+29.1)#18 | 7.2%(+28.3)#628 |
| 19. | Spaulding | 35.3% | 6.3%(+28.9)#19 | 7.2%(+28.1)#634 |
| 20. | Hanna | 34.8% | 6.3%(+28.4)#20 | 7.2%(+27.6)#658 |
| 21. | Bentley | 34.2% | 6.3%(+27.9)#21 | 7.2%(+27.0)#686 |
| 22. | Friendship | 33.3% | 6.3%(+27.0)#22 | 7.2%(+26.1)#739 |
| 23. | Horntown | 32.6% | 6.3%(+26.2)#23 | 7.2%(+25.3)#770 |
| 24. | Orlando | 30.6% | 6.3%(+24.3)#24 | 7.2%(+23.4)#872 |
| 25. | Belfonte | 30.3% | 6.3%(+23.9)#25 | 7.2%(+23.0)#892 |
| 26. | Deer Lick | 30.0% | 6.3%(+23.7)#26 | 7.2%(+22.8)#902 |
| 27. | Sasakwa | 30.0% | 6.3%(+23.7)#27 | 7.2%(+22.8)#904 |
| 28. | Bee | 29.4% | 6.3%(+23.1)#28 | 7.2%(+22.2)#935 |
| 29. | Dale | 28.8% | 6.3%(+22.5)#29 | 7.2%(+21.6)#967 |
| 30. | Twin Oaks | 27.9% | 6.3%(+21.5)#30 | 7.2%(+20.6)#1,034 |
| 31. | Watts | 27.6% | 6.3%(+21.3)#31 | 7.2%(+20.4)#1,048 |
| 32. | Oak Hill-Piney | 27.4% | 6.3%(+21.1)#32 | 7.2%(+20.2)#1,064 |
| 33. | Leach | 27.3% | 6.3%(+20.9)#33 | 7.2%(+20.0)#1,076 |
| 34. | Dewar | 27.1% | 6.3%(+20.8)#34 | 7.2%(+19.9)#1,096 |
| 35. | Titanic | 26.6% | 6.3%(+20.3)#35 | 7.2%(+19.4)#1,145 |
| 36. | Dennis | 26.6% | 6.3%(+20.2)#36 | 7.2%(+19.4)#1,147 |
| 37. | Dripping Springs | 26.1% | 6.3%(+19.7)#37 | 7.2%(+18.9)#1,195 |
| 38. | Bache | 25.9% | 6.3%(+19.6)#38 | 7.2%(+18.7)#1,203 |
| 39. | Taft | 25.6% | 6.3%(+19.3)#39 | 7.2%(+18.4)#1,226 |
| 40. | Canadian Shores | 24.6% | 6.3%(+18.3)#40 | 7.2%(+17.4)#1,349 |
| 41. | Bell | 24.5% | 6.3%(+18.1)#41 | 7.2%(+17.3)#1,364 |
| 42. | Calvin | 24.0% | 6.3%(+17.7)#42 | 7.2%(+16.8)#1,399 |
| 43. | Strong City | 23.8% | 6.3%(+17.5)#43 | 7.2%(+16.6)#1,427 |
| 44. | Bug Tussle | 23.6% | 6.3%(+17.3)#44 | 7.2%(+16.4)#1,442 |
| 45. | Grand Lake Towne | 23.1% | 6.3%(+16.7)#45 | 7.2%(+15.8)#1,513 |
| 46. | Baron | 23.0% | 6.3%(+16.7)#46 | 7.2%(+15.8)#1,524 |
| 47. | Reydon | 23.0% | 6.3%(+16.6)#47 | 7.2%(+15.7)#1,531 |
| 48. | Sparrowhawk | 22.9% | 6.3%(+16.5)#48 | 7.2%(+15.7)#1,545 |
| 49. | Pittsburg | 22.8% | 6.3%(+16.5)#49 | 7.2%(+15.6)#1,551 |
| 50. | Flint Creek | 22.6% | 6.3%(+16.3)#50 | 7.2%(+15.4)#1,571 |
| 51. | Clarita | 22.6% | 6.3%(+16.2)#51 | 7.2%(+15.4)#1,582 |
| 52. | Lowrey | 22.3% | 6.3%(+16.0)#52 | 7.2%(+15.1)#1,628 |
| 53. | Box | 22.2% | 6.3%(+15.9)#53 | 7.2%(+15.0)#1,657 |
| 54. | Braman | 22.0% | 6.3%(+15.7)#54 | 7.2%(+14.8)#1,685 |
| 55. | Freedom | 22.0% | 6.3%(+15.6)#55 | 7.2%(+14.8)#1,689 |
| 56. | Medford | 21.4% | 6.3%(+15.1)#56 | 7.2%(+14.2)#1,772 |
| 57. | Camargo | 21.4% | 6.3%(+15.1)#57 | 7.2%(+14.2)#1,775 |
| 58. | Bryant | 21.4% | 6.3%(+15.1)#58 | 7.2%(+14.2)#1,783 |
| 59. | Murphy | 21.3% | 6.3%(+14.9)#59 | 7.2%(+14.0)#1,799 |
| 60. | Fairfield | 21.1% | 6.3%(+14.7)#60 | 7.2%(+13.9)#1,837 |
| 61. | Cheyenne | 20.9% | 6.3%(+14.5)#61 | 7.2%(+13.6)#1,875 |
| 62. | Mountain Park | 20.8% | 6.3%(+14.5)#62 | 7.2%(+13.6)#1,893 |
| 63. | Teresita | 20.4% | 6.3%(+14.1)#63 | 7.2%(+13.2)#1,974 |
| 64. | Lehigh | 20.2% | 6.3%(+13.9)#64 | 7.2%(+13.0)#2,007 |
| 65. | Sawyer | 20.0% | 6.3%(+13.7)#65 | 7.2%(+12.8)#2,035 |
| 66. | Kendrick | 20.0% | 6.3%(+13.7)#66 | 7.2%(+12.8)#2,051 |
| 67. | Granite | 19.9% | 6.3%(+13.5)#67 | 7.2%(+12.6)#2,088 |
| 68. | Gracemont | 19.8% | 6.3%(+13.5)#68 | 7.2%(+12.6)#2,094 |
| 69. | Okeene | 19.8% | 6.3%(+13.4)#69 | 7.2%(+12.5)#2,104 |
| 70. | Glencoe | 19.7% | 6.3%(+13.3)#70 | 7.2%(+12.4)#2,125 |
| 71. | Apache | 19.5% | 6.3%(+13.2)#71 | 7.2%(+12.3)#2,150 |
| 72. | Kingfisher | 19.4% | 6.3%(+13.1)#72 | 7.2%(+12.2)#2,162 |
| 73. | Buffalo | 19.4% | 6.3%(+13.0)#73 | 7.2%(+12.2)#2,173 |
| 74. | Barber | 19.4% | 6.3%(+13.0)#74 | 7.2%(+12.1)#2,186 |
| 75. | Loyal | 19.4% | 6.3%(+13.0)#75 | 7.2%(+12.1)#2,190 |
| 76. | Soper | 19.3% | 6.3%(+13.0)#76 | 7.2%(+12.1)#2,194 |
| 77. | Beaver | 19.3% | 6.3%(+13.0)#77 | 7.2%(+12.1)#2,198 |
| 78. | Jet | 19.0% | 6.3%(+12.7)#78 | 7.2%(+11.8)#2,263 |
| 79. | Leon | 19.0% | 6.3%(+12.7)#79 | 7.2%(+11.8)#2,272 |
| 80. | Eldon | 18.8% | 6.3%(+12.5)#80 | 7.2%(+11.6)#2,332 |
| 81. | Bridge Creek | 18.8% | 6.3%(+12.4)#81 | 7.2%(+11.6)#2,347 |
| 82. | Grainola | 18.8% | 6.3%(+12.4)#82 | 7.2%(+11.5)#2,373 |
| 83. | Tenkiller | 18.7% | 6.3%(+12.3)#83 | 7.2%(+11.5)#2,379 |
| 84. | Hitchita | 18.2% | 6.3%(+11.8)#84 | 7.2%(+11.0)#2,529 |
| 85. | Calumet | 18.0% | 6.3%(+11.7)#85 | 7.2%(+10.8)#2,557 |
| 86. | Fort Coffee | 17.8% | 6.3%(+11.4)#86 | 7.2%(+10.6)#2,630 |
| 87. | Goltry | 17.8% | 6.3%(+11.4)#87 | 7.2%(+10.5)#2,636 |
| 88. | Preston | 17.5% | 6.3%(+11.1)#88 | 7.2%(+10.2)#2,739 |
| 89. | Fort Supply | 17.3% | 6.3%(+10.9)#89 | 7.2%(+10.0)#2,806 |
| 90. | Chewey | 17.2% | 6.3%(+10.9)#90 | 7.2%(+10.0)#2,811 |
| 91. | Longtown | 17.1% | 6.3%(+10.7)#91 | 7.2%(+9.83)#2,867 |
| 92. | Boswell | 16.9% | 6.3%(+10.6)#92 | 7.2%(+9.67)#2,918 |
| 93. | Washington | 16.9% | 6.3%(+10.5)#93 | 7.2%(+9.66)#2,924 |
| 94. | Lookeba | 16.7% | 6.3%(+10.3)#94 | 7.2%(+9.44)#3,028 |
| 95. | Dwight Mission | 16.7% | 6.3%(+10.3)#95 | 7.2%(+9.44)#3,042 |
| 96. | Douglas | 16.7% | 6.3%(+10.3)#96 | 7.2%(+9.44)#3,043 |
| 97. | Carmen | 16.4% | 6.3%(+10.1)#97 | 7.2%(+9.18)#3,153 |
| 98. | West Peavine | 16.2% | 6.3%(+9.83)#98 | 7.2%(+8.95)#3,254 |
| 99. | Gate | 15.9% | 6.3%(+9.56)#99 | 7.2%(+8.68)#3,372 |
| 100. | Temple | 15.8% | 6.3%(+9.46)#100 | 7.2%(+8.58)#3,428 |
Common Questions
What are the Top 10 Cities with the Highest Percentage of Local Government Employees in Oklahoma?
Top 10 Cities with the Highest Percentage of Local Government Employees in Oklahoma are:
What city has the Highest Percentage of Local Government Employees in Oklahoma?
Renfrow has the Highest Percentage of Local Government Employees in Oklahoma with 100.0%.
What is the Percentage of Local Government Employees in the State of Oklahoma?
Percentage of Local Government Employees in Oklahoma is 6.3%.
What is the Percentage of Local Government Employees in the United States?
Percentage of Local Government Employees in the United States is 7.2%.