Cities with the Highest Percentage of Local Government Employees in Vermont
RELATED REPORTS & OPTIONS
Local Government Employees
Vermont
Compare Cities
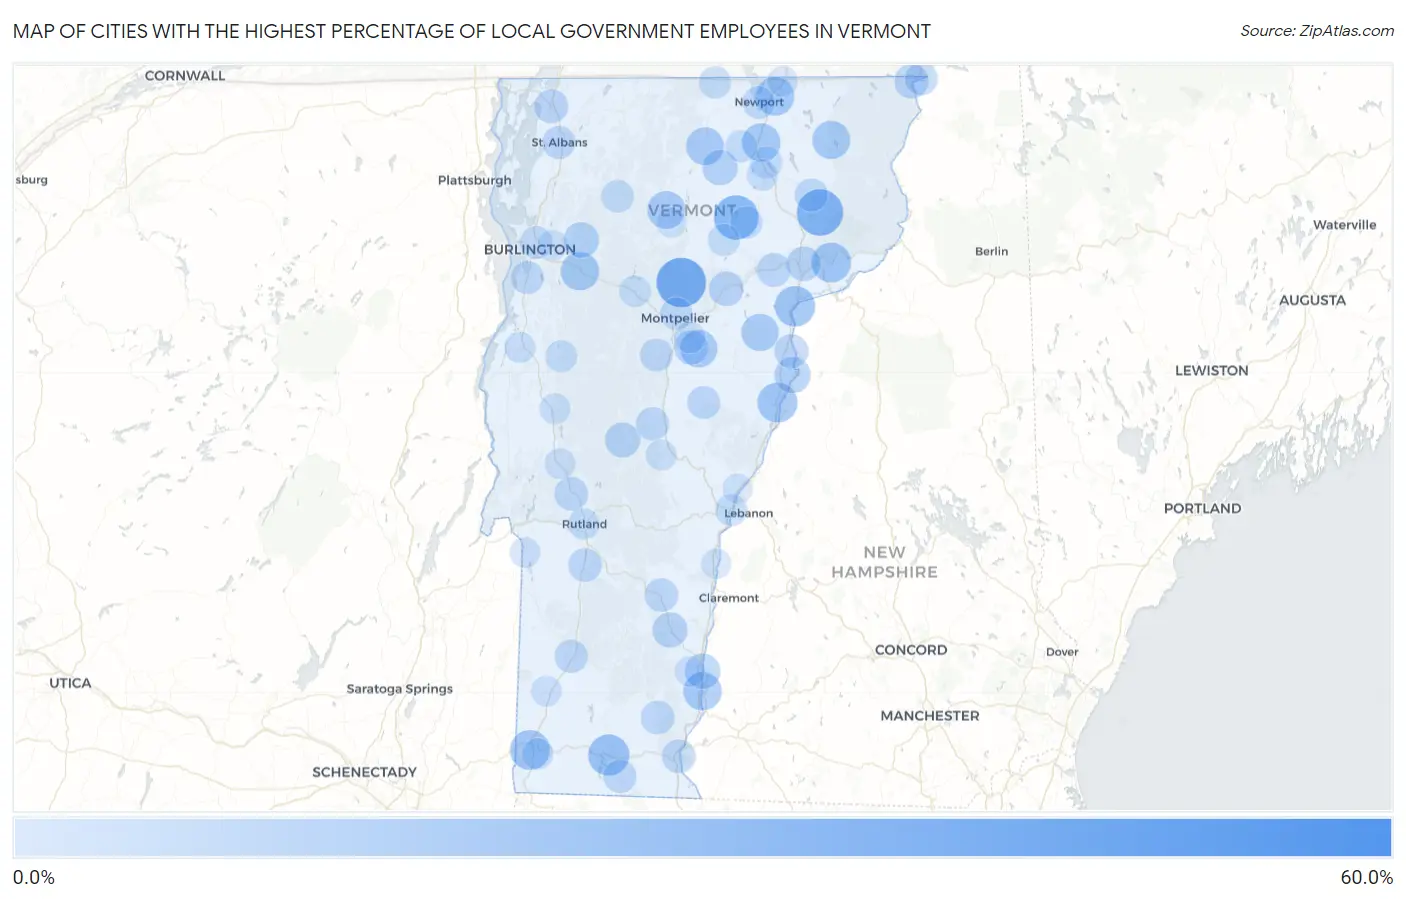
Map of Cities with the Highest Percentage of Local Government Employees in Vermont
0.0%
60.0%
Cities with the Highest Percentage of Local Government Employees in Vermont
| City | % Local Government Employees | vs State | vs National | |
| 1. | Jamaica | 53.6% | 7.8%(+45.7)#1 | 7.2%(+46.3)#233 |
| 2. | East Poultney | 42.4% | 7.8%(+34.6)#2 | 7.2%(+35.2)#426 |
| 3. | Worcester | 37.8% | 7.8%(+30.0)#3 | 7.2%(+30.6)#538 |
| 4. | Wardsboro | 36.2% | 7.8%(+28.3)#4 | 7.2%(+28.9)#600 |
| 5. | South Hero | 35.2% | 7.8%(+27.3)#5 | 7.2%(+27.9)#642 |
| 6. | East Burke | 32.5% | 7.8%(+24.7)#6 | 7.2%(+25.3)#771 |
| 7. | Townshend | 32.3% | 7.8%(+24.4)#7 | 7.2%(+25.0)#778 |
| 8. | Greensboro | 29.3% | 7.8%(+21.4)#8 | 7.2%(+22.0)#948 |
| 9. | Whitingham | 26.1% | 7.8%(+18.3)#9 | 7.2%(+18.9)#1,192 |
| 10. | Wilmington | 23.9% | 7.8%(+16.1)#10 | 7.2%(+16.7)#1,412 |
| 11. | Barnet | 22.6% | 7.8%(+14.8)#11 | 7.2%(+15.4)#1,583 |
| 12. | Lyndon Center | 22.2% | 7.8%(+14.4)#12 | 7.2%(+15.0)#1,651 |
| 13. | Gilman | 21.9% | 7.8%(+14.1)#13 | 7.2%(+14.7)#1,704 |
| 14. | Bradford | 21.8% | 7.8%(+13.9)#14 | 7.2%(+14.5)#1,721 |
| 15. | Old Bennington | 21.7% | 7.8%(+13.9)#15 | 7.2%(+14.5)#1,731 |
| 16. | Concord | 21.3% | 7.8%(+13.5)#16 | 7.2%(+14.1)#1,796 |
| 17. | Derby Center | 19.9% | 7.8%(+12.1)#17 | 7.2%(+12.7)#2,080 |
| 18. | South Lincoln | 19.6% | 7.8%(+11.8)#18 | 7.2%(+12.4)#2,132 |
| 19. | Westminster | 19.3% | 7.8%(+11.5)#19 | 7.2%(+12.1)#2,191 |
| 20. | Richmond | 19.3% | 7.8%(+11.5)#20 | 7.2%(+12.1)#2,203 |
| 21. | Orleans | 19.3% | 7.8%(+11.5)#21 | 7.2%(+12.0)#2,207 |
| 22. | Island Pond | 18.7% | 7.8%(+10.8)#22 | 7.2%(+11.4)#2,382 |
| 23. | Hyde Park | 18.3% | 7.8%(+10.5)#23 | 7.2%(+11.1)#2,484 |
| 24. | Lowell | 18.2% | 7.8%(+10.4)#24 | 7.2%(+11.0)#2,517 |
| 25. | Websterville | 17.6% | 7.8%(+9.83)#25 | 7.2%(+10.4)#2,666 |
| 26. | Groton | 17.5% | 7.8%(+9.71)#26 | 7.2%(+10.3)#2,709 |
| 27. | Highgate Center | 17.5% | 7.8%(+9.68)#27 | 7.2%(+10.3)#2,721 |
| 28. | Peacham | 16.4% | 7.8%(+8.57)#28 | 7.2%(+9.17)#3,158 |
| 29. | Newbury | 15.3% | 7.8%(+7.52)#29 | 7.2%(+8.11)#3,680 |
| 30. | Pawlet | 15.1% | 7.8%(+7.30)#30 | 7.2%(+7.90)#3,807 |
| 31. | East Charlotte | 14.6% | 7.8%(+6.81)#31 | 7.2%(+7.41)#4,098 |
| 32. | Jericho | 14.5% | 7.8%(+6.70)#32 | 7.2%(+7.29)#4,187 |
| 33. | Bellows Falls | 14.3% | 7.8%(+6.46)#33 | 7.2%(+7.06)#4,318 |
| 34. | Albany | 14.3% | 7.8%(+6.46)#34 | 7.2%(+7.06)#4,345 |
| 35. | Chester | 13.9% | 7.8%(+6.06)#35 | 7.2%(+6.65)#4,675 |
| 36. | Rochester | 13.6% | 7.8%(+5.77)#36 | 7.2%(+6.36)#4,877 |
| 37. | Bakersfield | 13.5% | 7.8%(+5.72)#37 | 7.2%(+6.31)#4,914 |
| 38. | Marshfield | 13.0% | 7.8%(+5.15)#38 | 7.2%(+5.75)#5,365 |
| 39. | St Johnsbury | 12.6% | 7.8%(+4.78)#39 | 7.2%(+5.37)#5,696 |
| 40. | Canaan | 12.5% | 7.8%(+4.68)#40 | 7.2%(+5.27)#5,782 |
| 41. | South Barre | 12.3% | 7.8%(+4.47)#41 | 7.2%(+5.06)#5,978 |
| 42. | Wells River | 12.0% | 7.8%(+4.14)#42 | 7.2%(+4.74)#6,347 |
| 43. | Swanton | 11.9% | 7.8%(+4.08)#43 | 7.2%(+4.67)#6,414 |
| 44. | Danville | 11.5% | 7.8%(+3.68)#44 | 7.2%(+4.28)#6,845 |
| 45. | Newfane | 11.4% | 7.8%(+3.58)#45 | 7.2%(+4.18)#6,977 |
| 46. | Pittsford | 11.4% | 7.8%(+3.53)#46 | 7.2%(+4.13)#7,020 |
| 47. | Wallingford | 11.3% | 7.8%(+3.49)#47 | 7.2%(+4.09)#7,077 |
| 48. | Brattleboro | 11.3% | 7.8%(+3.44)#48 | 7.2%(+4.04)#7,133 |
| 49. | Proctorsville | 11.2% | 7.8%(+3.34)#49 | 7.2%(+3.94)#7,254 |
| 50. | Weston | 11.1% | 7.8%(+3.29)#50 | 7.2%(+3.88)#7,360 |
| 51. | Randolph | 11.0% | 7.8%(+3.13)#51 | 7.2%(+3.73)#7,531 |
| 52. | Manchester Center | 10.9% | 7.8%(+3.04)#52 | 7.2%(+3.64)#7,634 |
| 53. | West Pawlet | 10.8% | 7.8%(+3.02)#53 | 7.2%(+3.62)#7,658 |
| 54. | Jacksonville | 10.8% | 7.8%(+2.93)#54 | 7.2%(+3.53)#7,785 |
| 55. | St Albans | 10.7% | 7.8%(+2.86)#55 | 7.2%(+3.46)#7,882 |
| 56. | Shelburne | 10.6% | 7.8%(+2.74)#56 | 7.2%(+3.34)#8,037 |
| 57. | West Burke | 10.4% | 7.8%(+2.63)#57 | 7.2%(+3.22)#8,222 |
| 58. | Chelsea | 10.4% | 7.8%(+2.56)#58 | 7.2%(+3.15)#8,317 |
| 59. | Northfield | 10.3% | 7.8%(+2.52)#59 | 7.2%(+3.12)#8,392 |
| 60. | Beecher Falls | 10.3% | 7.8%(+2.43)#60 | 7.2%(+3.03)#8,511 |
| 61. | Harmonyville | 10.2% | 7.8%(+2.37)#61 | 7.2%(+2.96)#8,603 |
| 62. | North Hyde Park | 10.1% | 7.8%(+2.30)#62 | 7.2%(+2.89)#8,704 |
| 63. | Jeffersonville | 10.0% | 7.8%(+2.23)#63 | 7.2%(+2.82)#8,812 |
| 64. | Stratton Mountain | 10.0% | 7.8%(+2.18)#64 | 7.2%(+2.77)#8,934 |
| 65. | Newport | 10.0% | 7.8%(+2.17)#65 | 7.2%(+2.76)#8,950 |
| 66. | Winooski | 9.8% | 7.8%(+2.02)#66 | 7.2%(+2.61)#9,171 |
| 67. | Montpelier | 9.7% | 7.8%(+1.88)#67 | 7.2%(+2.47)#9,425 |
| 68. | Huntington Center | 9.7% | 7.8%(+1.86)#68 | 7.2%(+2.45)#9,465 |
| 69. | Greensboro Bend | 9.2% | 7.8%(+1.33)#69 | 7.2%(+1.93)#10,443 |
| 70. | North Troy | 9.1% | 7.8%(+1.30)#70 | 7.2%(+1.90)#10,493 |
| 71. | Hardwick | 8.9% | 7.8%(+1.05)#71 | 7.2%(+1.64)#10,986 |
| 72. | Barton | 8.8% | 7.8%(+0.965)#72 | 7.2%(+1.56)#11,138 |
| 73. | Irasburg | 8.7% | 7.8%(+0.928)#73 | 7.2%(+1.52)#11,231 |
| 74. | Bristol | 8.7% | 7.8%(+0.851)#74 | 7.2%(+1.45)#11,386 |
| 75. | Stamford | 8.6% | 7.8%(+0.762)#75 | 7.2%(+1.36)#11,566 |
| 76. | White River Junction | 8.5% | 7.8%(+0.712)#76 | 7.2%(+1.31)#11,660 |
| 77. | Sheffield | 8.3% | 7.8%(+0.512)#77 | 7.2%(+1.11)#12,090 |
| 78. | Waterbury | 8.3% | 7.8%(+0.443)#78 | 7.2%(+1.04)#12,216 |
| 79. | Rutland | 8.1% | 7.8%(+0.235)#79 | 7.2%(+0.828)#12,669 |
| 80. | Barre | 7.9% | 7.8%(+0.108)#80 | 7.2%(+0.702)#12,950 |
| 81. | Lunenburg | 7.9% | 7.8%(+0.053)#81 | 7.2%(+0.646)#13,079 |
| 82. | Bennington | 7.7% | 7.8%(-0.109)#82 | 7.2%(+0.485)#13,458 |
| 83. | Glover | 7.7% | 7.8%(-0.129)#83 | 7.2%(+0.465)#13,516 |
| 84. | South Londonderry | 7.5% | 7.8%(-0.295)#84 | 7.2%(+0.299)#13,917 |
| 85. | Vergennes | 7.3% | 7.8%(-0.562)#85 | 7.2%(+0.032)#14,562 |
| 86. | Pownal Center | 7.1% | 7.8%(-0.679)#86 | 7.2%(-0.085)#14,845 |
| 87. | Bethel | 7.0% | 7.8%(-0.819)#87 | 7.2%(-0.225)#15,211 |
| 88. | Brandon | 7.0% | 7.8%(-0.825)#88 | 7.2%(-0.231)#15,222 |
| 89. | East Middlebury | 7.0% | 7.8%(-0.829)#89 | 7.2%(-0.235)#15,233 |
| 90. | Derby Line | 6.7% | 7.8%(-1.15)#90 | 7.2%(-0.561)#16,074 |
| 91. | Arlington | 6.5% | 7.8%(-1.30)#91 | 7.2%(-0.706)#16,469 |
| 92. | Sutton | 6.5% | 7.8%(-1.37)#92 | 7.2%(-0.776)#16,664 |
| 93. | Proctor | 6.4% | 7.8%(-1.43)#93 | 7.2%(-0.839)#16,833 |
| 94. | Saxtons River | 6.3% | 7.8%(-1.50)#94 | 7.2%(-0.902)#17,006 |
| 95. | Poultney | 6.1% | 7.8%(-1.69)#95 | 7.2%(-1.09)#17,495 |
| 96. | Windsor | 6.1% | 7.8%(-1.73)#96 | 7.2%(-1.13)#17,612 |
| 97. | Morrisville | 5.8% | 7.8%(-1.98)#97 | 7.2%(-1.38)#18,247 |
| 98. | Norwich | 5.8% | 7.8%(-2.00)#98 | 7.2%(-1.41)#18,304 |
| 99. | Essex Junction | 5.8% | 7.8%(-2.06)#99 | 7.2%(-1.47)#18,448 |
| 100. | Underhill Flats | 5.7% | 7.8%(-2.11)#100 | 7.2%(-1.52)#18,611 |
1
2Common Questions
What are the Top 10 Cities with the Highest Percentage of Local Government Employees in Vermont?
Top 10 Cities with the Highest Percentage of Local Government Employees in Vermont are:
#1
37.8%
#2
32.5%
#3
29.3%
#4
23.9%
#5
22.6%
#6
21.8%
#7
21.7%
#8
21.3%
#9
19.9%
#10
19.3%
What city has the Highest Percentage of Local Government Employees in Vermont?
Worcester has the Highest Percentage of Local Government Employees in Vermont with 37.8%.
What is the Percentage of Local Government Employees in the State of Vermont?
Percentage of Local Government Employees in Vermont is 7.8%.
What is the Percentage of Local Government Employees in the United States?
Percentage of Local Government Employees in the United States is 7.2%.