Brooktrails, CA Map & Demographics
Brooktrails Map
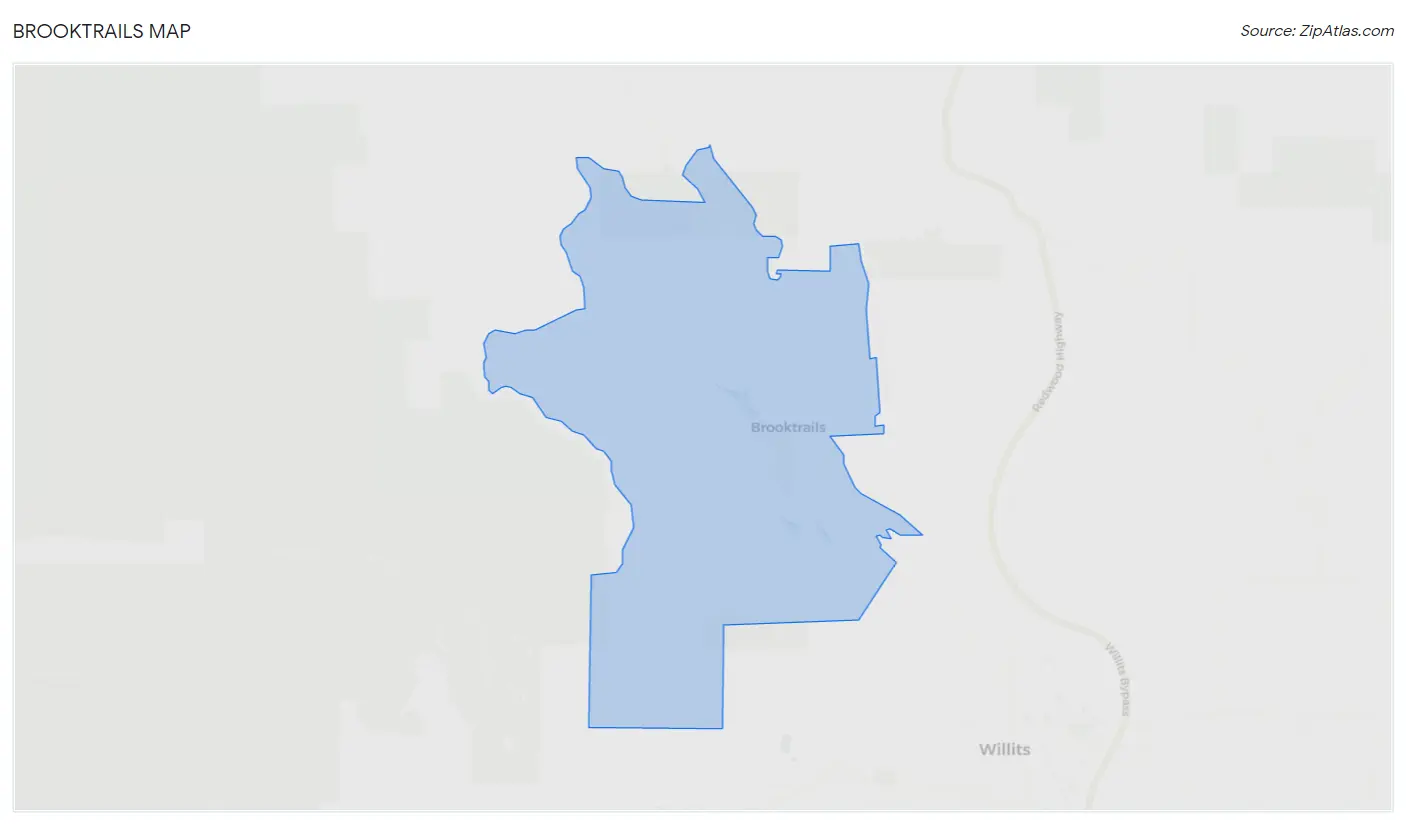
Brooktrails Overview
$34,091
PER CAPITA INCOME
$116,580
AVG FAMILY INCOME
$94,457
AVG HOUSEHOLD INCOME
18.5%
WAGE / INCOME GAP [ % ]
81.5¢/ $1
WAGE / INCOME GAP [ $ ]
0.27
INEQUALITY / GINI INDEX
4,440
TOTAL POPULATION
2,266
MALE POPULATION
2,174
FEMALE POPULATION
104.23
MALES / 100 FEMALES
95.94
FEMALES / 100 MALES
33.3
MEDIAN AGE
3.4
AVG FAMILY SIZE
3.0
AVG HOUSEHOLD SIZE
2,239
LABOR FORCE [ PEOPLE ]
70.9%
PERCENT IN LABOR FORCE
3.8%
UNEMPLOYMENT RATE
Income in Brooktrails
Income Overview in Brooktrails
Per Capita Income in Brooktrails is $34,091, while median incomes of families and households are $116,580 and $94,457 respectively.
| Characteristic | Number | Measure |
| Per Capita Income | 4,440 | $34,091 |
| Median Family Income | 1,137 | $116,580 |
| Mean Family Income | 1,137 | $104,578 |
| Median Household Income | 1,500 | $94,457 |
| Mean Household Income | 1,500 | $94,328 |
| Income Deficit | 1,137 | $0 |
| Wage / Income Gap (%) | 4,440 | 18.45% |
| Wage / Income Gap ($) | 4,440 | 81.55¢ per $1 |
| Gini / Inequality Index | 4,440 | 0.27 |
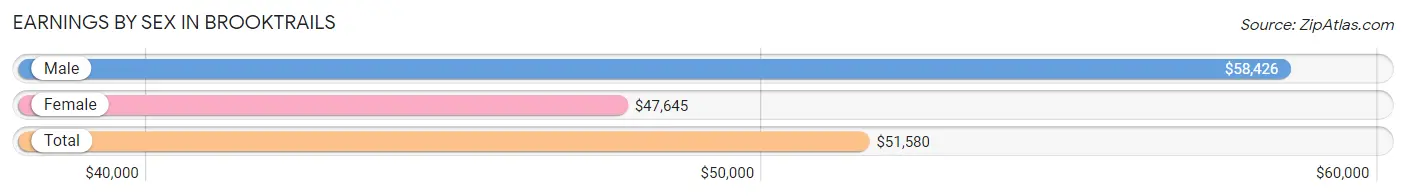
Earnings by Sex in Brooktrails
Average Earnings in Brooktrails are $51,580, $58,426 for men and $47,645 for women, a difference of 18.4%.
| Sex | Number | Average Earnings |
| Male | 1,331 (58.6%) | $58,426 |
| Female | 939 (41.4%) | $47,645 |
| Total | 2,270 (100.0%) | $51,580 |
Earnings by Sex by Income Bracket in Brooktrails
The most common earnings brackets in Brooktrails are $55,000 to $64,999 for men (245 | 18.4%) and $75,000 to $99,999 for women (270 | 28.7%).
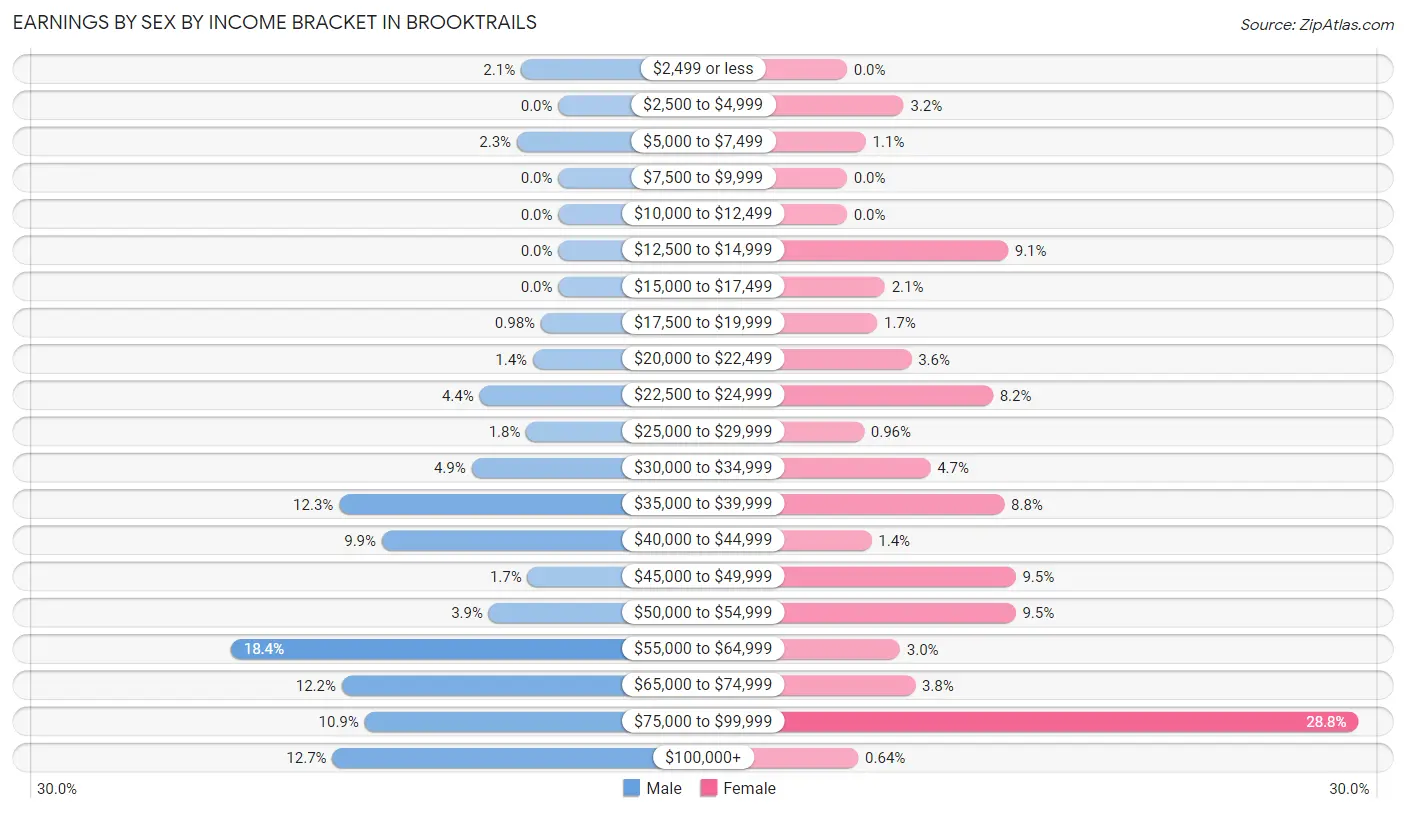
| Income | Male | Female |
| $2,499 or less | 28 (2.1%) | 0 (0.0%) |
| $2,500 to $4,999 | 0 (0.0%) | 30 (3.2%) |
| $5,000 to $7,499 | 31 (2.3%) | 10 (1.1%) |
| $7,500 to $9,999 | 0 (0.0%) | 0 (0.0%) |
| $10,000 to $12,499 | 0 (0.0%) | 0 (0.0%) |
| $12,500 to $14,999 | 0 (0.0%) | 85 (9.0%) |
| $15,000 to $17,499 | 0 (0.0%) | 20 (2.1%) |
| $17,500 to $19,999 | 13 (1.0%) | 16 (1.7%) |
| $20,000 to $22,499 | 19 (1.4%) | 34 (3.6%) |
| $22,500 to $24,999 | 59 (4.4%) | 77 (8.2%) |
| $25,000 to $29,999 | 24 (1.8%) | 9 (1.0%) |
| $30,000 to $34,999 | 65 (4.9%) | 44 (4.7%) |
| $35,000 to $39,999 | 164 (12.3%) | 83 (8.8%) |
| $40,000 to $44,999 | 132 (9.9%) | 13 (1.4%) |
| $45,000 to $49,999 | 23 (1.7%) | 89 (9.5%) |
| $50,000 to $54,999 | 52 (3.9%) | 89 (9.5%) |
| $55,000 to $64,999 | 245 (18.4%) | 28 (3.0%) |
| $65,000 to $74,999 | 162 (12.2%) | 36 (3.8%) |
| $75,000 to $99,999 | 145 (10.9%) | 270 (28.7%) |
| $100,000+ | 169 (12.7%) | 6 (0.6%) |
| Total | 1,331 (100.0%) | 939 (100.0%) |
Earnings by Sex by Educational Attainment in Brooktrails
Average earnings in Brooktrails are $59,096 for men and $50,440 for women, a difference of 14.6%. Men with an educational attainment of bachelor's degree enjoy the highest average annual earnings of $71,098, while those with college or associate's degree education earn the least with $38,533. Women with an educational attainment of high school diploma earn the most with the average annual earnings of $90,273, while those with college or associate's degree education have the smallest earnings of $48,261.
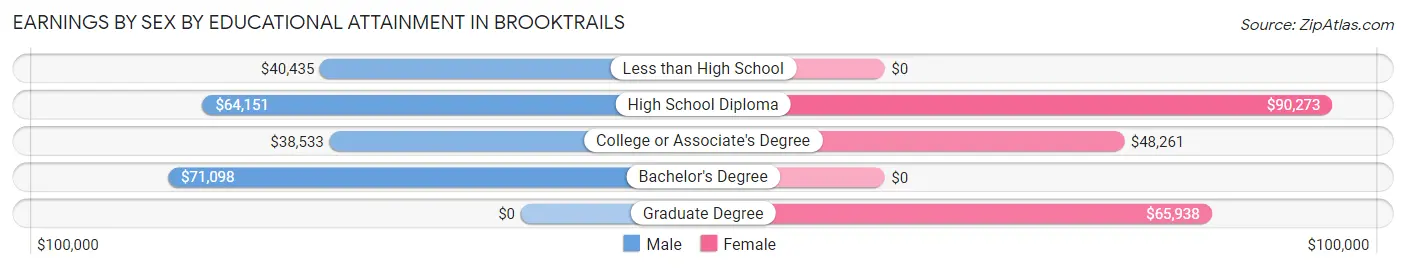
| Educational Attainment | Male Income | Female Income |
| Less than High School | $40,435 | $0 |
| High School Diploma | $64,151 | $90,273 |
| College or Associate's Degree | $38,533 | $48,261 |
| Bachelor's Degree | $71,098 | $0 |
| Graduate Degree | - | - |
| Total | $59,096 | $50,440 |
Family Income in Brooktrails
Family Income Brackets in Brooktrails
According to the Brooktrails family income data, there are 489 families falling into the $100,000 to $149,999 income range, which is the most common income bracket and makes up 43.0% of all families. Conversely, the less than $10,000 income bracket is the least frequent group with only 7 families (0.6%) belonging to this category.
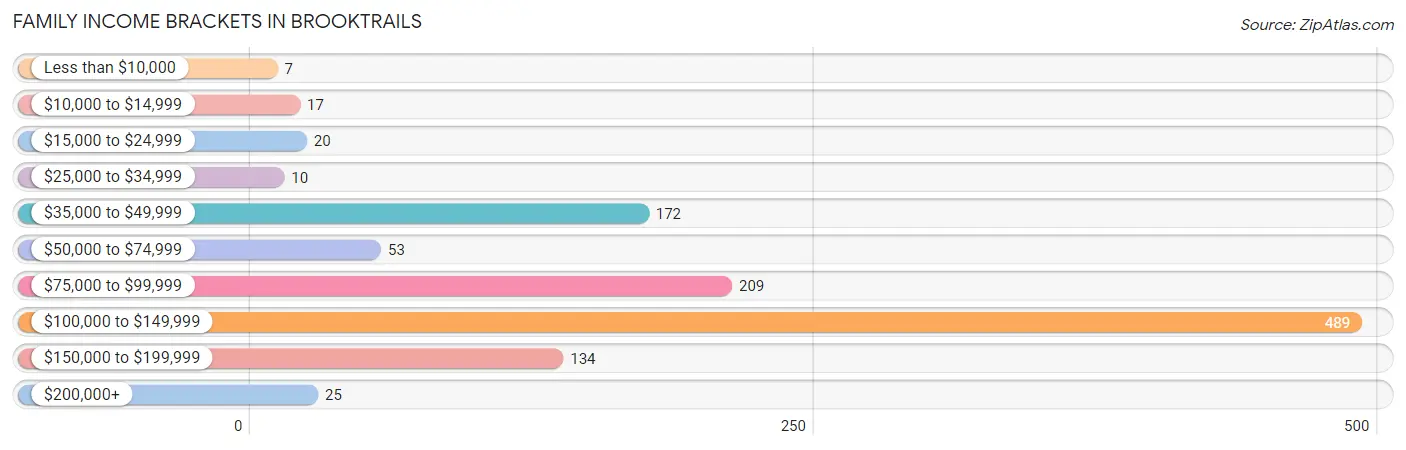
| Income Bracket | # Families | % Families |
| Less than $10,000 | 7 | 0.6% |
| $10,000 to $14,999 | 17 | 1.5% |
| $15,000 to $24,999 | 20 | 1.8% |
| $25,000 to $34,999 | 10 | 0.9% |
| $35,000 to $49,999 | 172 | 15.1% |
| $50,000 to $74,999 | 53 | 4.7% |
| $75,000 to $99,999 | 209 | 18.4% |
| $100,000 to $149,999 | 489 | 43.0% |
| $150,000 to $199,999 | 134 | 11.8% |
| $200,000+ | 25 | 2.2% |
Family Income by Famaliy Size in Brooktrails
2-person families (464 | 40.8%) account for the highest median family income in Brooktrails with $127,869 per family, while 2-person families (464 | 40.8%) have the highest median income of $63,934 per family member.
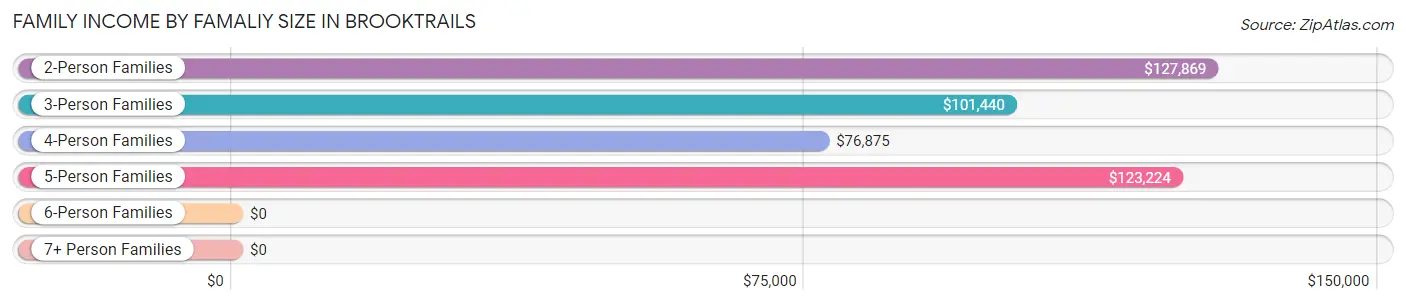
| Income Bracket | # Families | Median Income |
| 2-Person Families | 464 (40.8%) | $127,869 |
| 3-Person Families | 173 (15.2%) | $101,440 |
| 4-Person Families | 325 (28.6%) | $76,875 |
| 5-Person Families | 160 (14.1%) | $123,224 |
| 6-Person Families | 15 (1.3%) | $0 |
| 7+ Person Families | 0 (0.0%) | $0 |
| Total | 1,137 (100.0%) | $116,580 |
Family Income by Number of Earners in Brooktrails
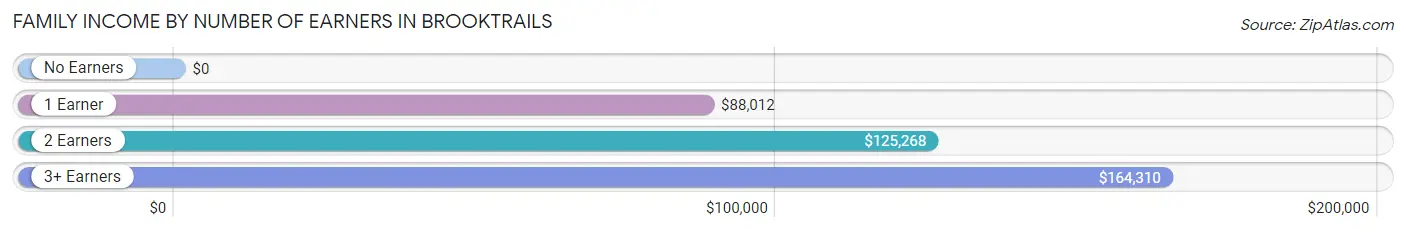
| Number of Earners | # Families | Median Income |
| No Earners | 7 (0.6%) | $0 |
| 1 Earner | 459 (40.4%) | $88,012 |
| 2 Earners | 629 (55.3%) | $125,268 |
| 3+ Earners | 42 (3.7%) | $164,310 |
| Total | 1,137 (100.0%) | $116,580 |
Household Income in Brooktrails
Household Income Brackets in Brooktrails
With 580 households falling in the category, the $100,000 to $149,999 income range is the most frequent in Brooktrails, accounting for 38.7% of all households. In contrast, only 8 households (0.5%) fall into the less than $10,000 income bracket, making it the least populous group.
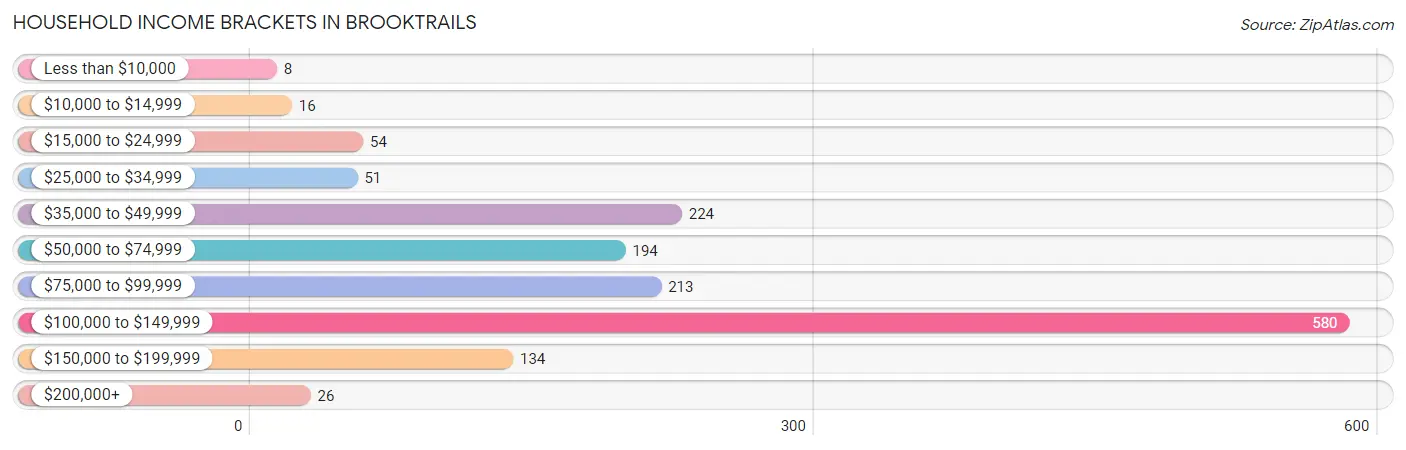
| Income Bracket | # Households | % Households |
| Less than $10,000 | 8 | 0.5% |
| $10,000 to $14,999 | 16 | 1.1% |
| $15,000 to $24,999 | 54 | 3.6% |
| $25,000 to $34,999 | 51 | 3.4% |
| $35,000 to $49,999 | 224 | 14.9% |
| $50,000 to $74,999 | 194 | 12.9% |
| $75,000 to $99,999 | 213 | 14.2% |
| $100,000 to $149,999 | 580 | 38.7% |
| $150,000 to $199,999 | 134 | 8.9% |
| $200,000+ | 26 | 1.7% |
Household Income by Householder Age in Brooktrails
The median household income in Brooktrails is $94,457, with the highest median household income of $116,061 found in the 45 to 64 years age bracket for the primary householder. A total of 469 households (31.3%) fall into this category. Meanwhile, the 15 to 24 years age bracket for the primary householder has the lowest median household income of $0, with 77 households (5.1%) in this group.
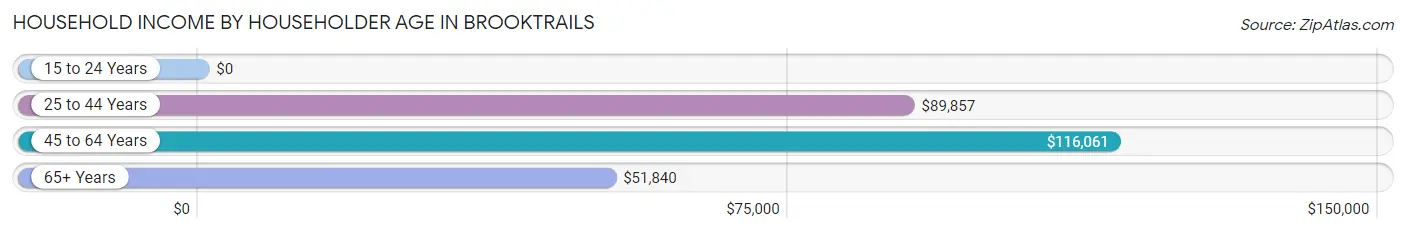
| Income Bracket | # Households | Median Income |
| 15 to 24 Years | 77 (5.1%) | $0 |
| 25 to 44 Years | 623 (41.5%) | $89,857 |
| 45 to 64 Years | 469 (31.3%) | $116,061 |
| 65+ Years | 331 (22.1%) | $51,840 |
| Total | 1,500 (100.0%) | $94,457 |
Poverty in Brooktrails
Income Below Poverty by Sex and Age in Brooktrails
With 3.4% poverty level for males and 6.2% for females among the residents of Brooktrails, 6 to 11 year old males and 18 to 24 year old females are the most vulnerable to poverty, with 22 males (7.4%) and 30 females (26.3%) in their respective age groups living below the poverty level.
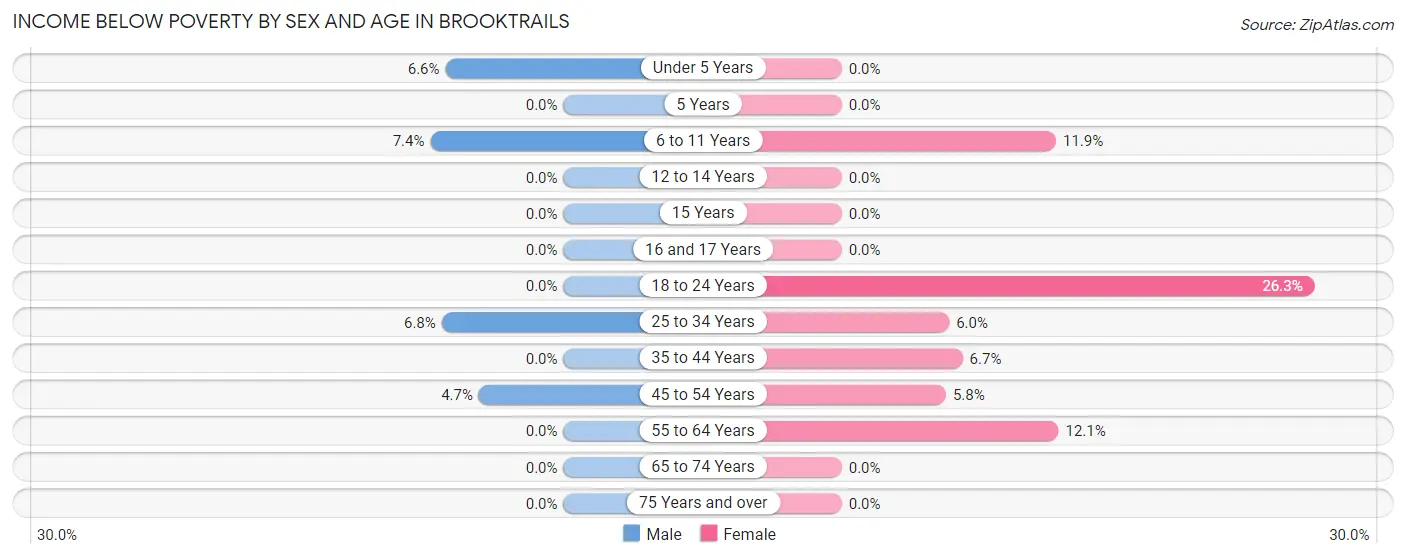
| Age Bracket | Male | Female |
| Under 5 Years | 14 (6.6%) | 0 (0.0%) |
| 5 Years | 0 (0.0%) | 0 (0.0%) |
| 6 to 11 Years | 22 (7.4%) | 26 (11.9%) |
| 12 to 14 Years | 0 (0.0%) | 0 (0.0%) |
| 15 Years | 0 (0.0%) | 0 (0.0%) |
| 16 and 17 Years | 0 (0.0%) | 0 (0.0%) |
| 18 to 24 Years | 0 (0.0%) | 30 (26.3%) |
| 25 to 34 Years | 23 (6.8%) | 22 (6.0%) |
| 35 to 44 Years | 0 (0.0%) | 22 (6.7%) |
| 45 to 54 Years | 17 (4.7%) | 20 (5.8%) |
| 55 to 64 Years | 0 (0.0%) | 14 (12.1%) |
| 65 to 74 Years | 0 (0.0%) | 0 (0.0%) |
| 75 Years and over | 0 (0.0%) | 0 (0.0%) |
| Total | 76 (3.4%) | 134 (6.2%) |
Income Above Poverty by Sex and Age in Brooktrails
According to the poverty statistics in Brooktrails, males aged 5 years and females aged under 5 years are the age groups that are most secure financially, with 100.0% of males and 100.0% of females in these age groups living above the poverty line.
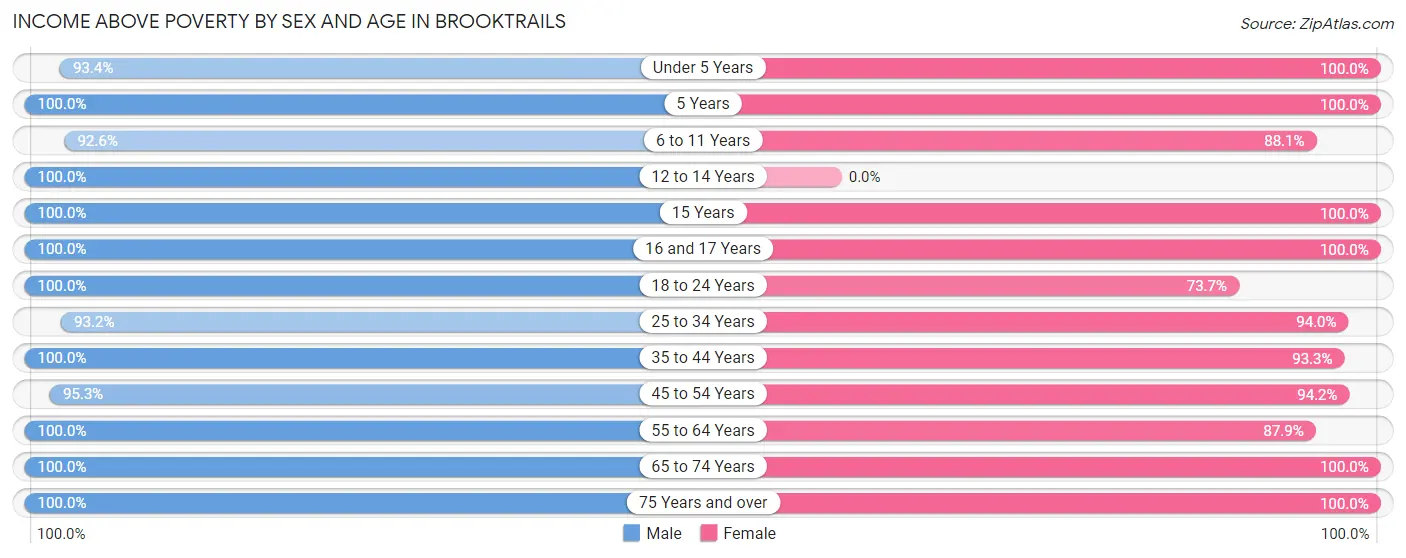
| Age Bracket | Male | Female |
| Under 5 Years | 199 (93.4%) | 335 (100.0%) |
| 5 Years | 27 (100.0%) | 37 (100.0%) |
| 6 to 11 Years | 275 (92.6%) | 192 (88.1%) |
| 12 to 14 Years | 120 (100.0%) | 0 (0.0%) |
| 15 Years | 27 (100.0%) | 8 (100.0%) |
| 16 and 17 Years | 27 (100.0%) | 18 (100.0%) |
| 18 to 24 Years | 130 (100.0%) | 84 (73.7%) |
| 25 to 34 Years | 316 (93.2%) | 346 (94.0%) |
| 35 to 44 Years | 272 (100.0%) | 305 (93.3%) |
| 45 to 54 Years | 344 (95.3%) | 325 (94.2%) |
| 55 to 64 Years | 234 (100.0%) | 102 (87.9%) |
| 65 to 74 Years | 124 (100.0%) | 196 (100.0%) |
| 75 Years and over | 95 (100.0%) | 92 (100.0%) |
| Total | 2,190 (96.7%) | 2,040 (93.8%) |
Income Below Poverty Among Married-Couple Families in Brooktrails
The poverty statistics for married-couple families in Brooktrails show that 2.4% or 24 of the total 982 families live below the poverty line. Families with 1 or 2 children have the highest poverty rate of 4.5%, comprising of 17 families. On the other hand, families with 3 or 4 children have the lowest poverty rate of 0.0%, which includes 0 families.
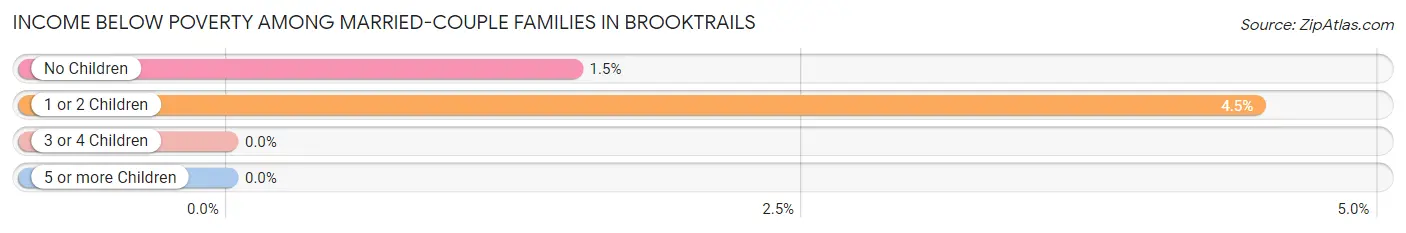
| Children | Above Poverty | Below Poverty |
| No Children | 461 (98.5%) | 7 (1.5%) |
| 1 or 2 Children | 363 (95.5%) | 17 (4.5%) |
| 3 or 4 Children | 134 (100.0%) | 0 (0.0%) |
| 5 or more Children | 0 (0.0%) | 0 (0.0%) |
| Total | 958 (97.6%) | 24 (2.4%) |
Income Below Poverty Among Single-Parent Households in Brooktrails
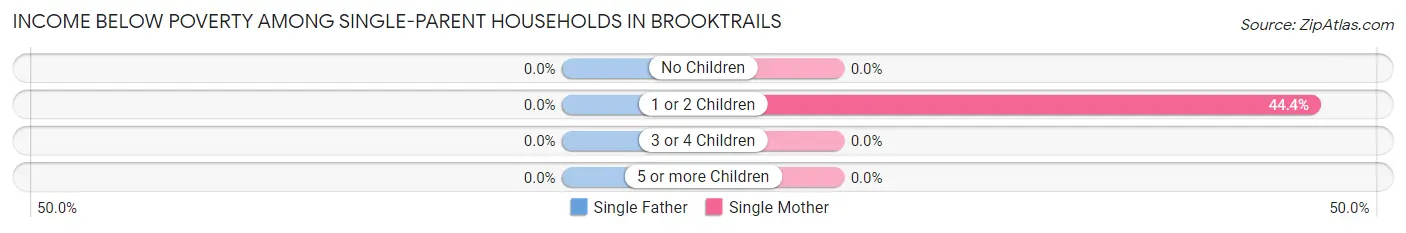
| Children | Single Father | Single Mother |
| No Children | 0 (0.0%) | 0 (0.0%) |
| 1 or 2 Children | 0 (0.0%) | 20 (44.4%) |
| 3 or 4 Children | 0 (0.0%) | 0 (0.0%) |
| 5 or more Children | 0 (0.0%) | 0 (0.0%) |
| Total | 0 (0.0%) | 20 (15.5%) |
Income Below Poverty Among Married-Couple vs Single-Parent Households in Brooktrails
The poverty data for Brooktrails shows that 24 of the married-couple family households (2.4%) and 20 of the single-parent households (12.9%) are living below the poverty level. Within the married-couple family households, those with 1 or 2 children have the highest poverty rate, with 17 households (4.5%) falling below the poverty line. Among the single-parent households, those with 1 or 2 children have the highest poverty rate, with 20 household (28.2%) living below poverty.
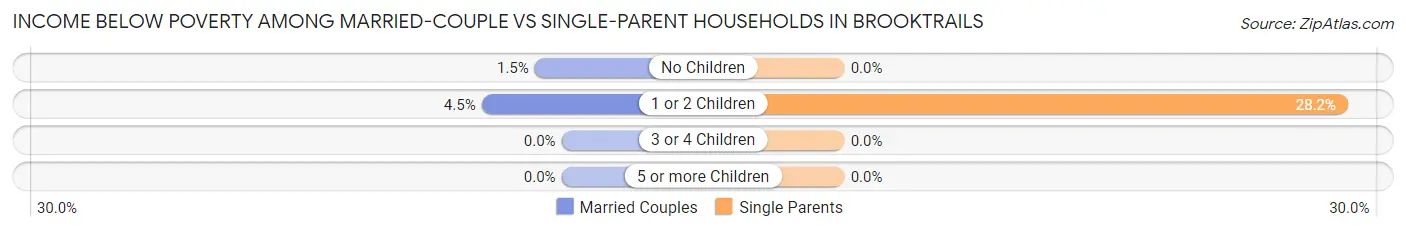
| Children | Married-Couple Families | Single-Parent Households |
| No Children | 7 (1.5%) | 0 (0.0%) |
| 1 or 2 Children | 17 (4.5%) | 20 (28.2%) |
| 3 or 4 Children | 0 (0.0%) | 0 (0.0%) |
| 5 or more Children | 0 (0.0%) | 0 (0.0%) |
| Total | 24 (2.4%) | 20 (12.9%) |
Race in Brooktrails
The most populous races in Brooktrails are White / Caucasian (3,344 | 75.3%), Hispanic or Latino (1,058 | 23.8%), and Two or more Races (786 | 17.7%).
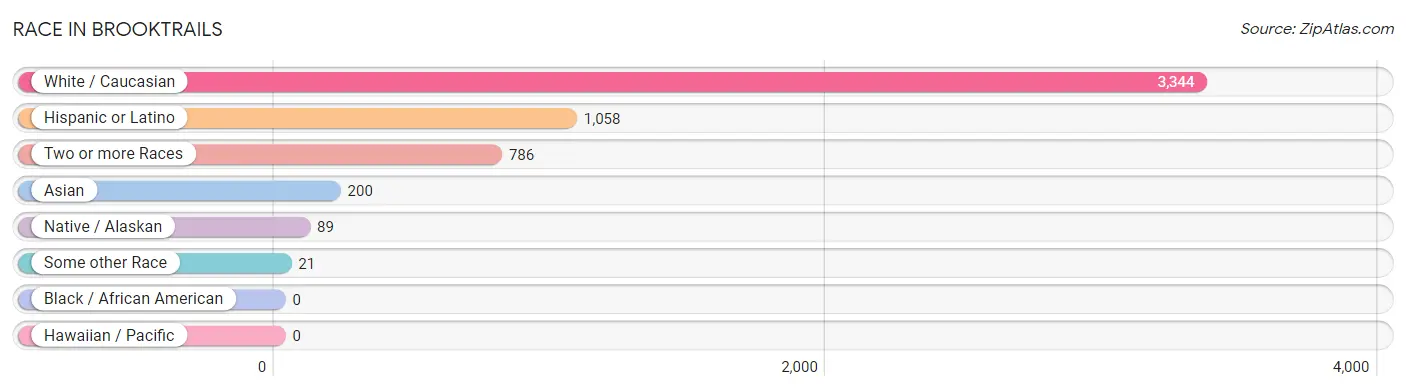
| Race | # Population | % Population |
| Asian | 200 | 4.5% |
| Black / African American | 0 | 0.0% |
| Hawaiian / Pacific | 0 | 0.0% |
| Hispanic or Latino | 1,058 | 23.8% |
| Native / Alaskan | 89 | 2.0% |
| White / Caucasian | 3,344 | 75.3% |
| Two or more Races | 786 | 17.7% |
| Some other Race | 21 | 0.5% |
| Total | 4,440 | 100.0% |
Ancestry in Brooktrails
The most populous ancestries reported in Brooktrails are Mexican (1,024 | 23.1%), German (846 | 19.1%), English (524 | 11.8%), Irish (522 | 11.8%), and Dutch (240 | 5.4%), together accounting for 71.1% of all Brooktrails residents.
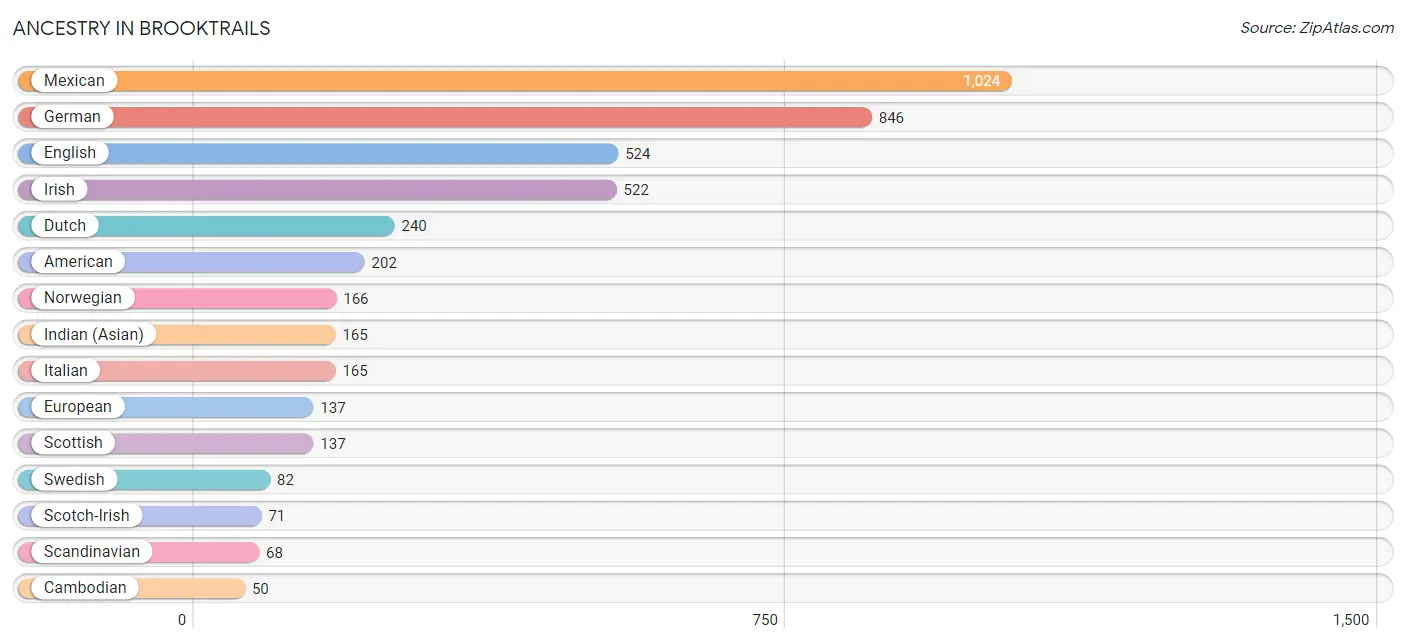
| Ancestry | # Population | % Population |
| American | 202 | 4.5% |
| Bhutanese | 7 | 0.2% |
| Cambodian | 50 | 1.1% |
| Cherokee | 2 | 0.1% |
| Creek | 2 | 0.1% |
| Croatian | 10 | 0.2% |
| Danish | 13 | 0.3% |
| Dutch | 240 | 5.4% |
| Eastern European | 11 | 0.3% |
| English | 524 | 11.8% |
| European | 137 | 3.1% |
| Finnish | 36 | 0.8% |
| French | 45 | 1.0% |
| German | 846 | 19.1% |
| Indian (Asian) | 165 | 3.7% |
| Irish | 522 | 11.8% |
| Italian | 165 | 3.7% |
| Korean | 18 | 0.4% |
| Mexican | 1,024 | 23.1% |
| Norwegian | 166 | 3.7% |
| Paiute | 6 | 0.1% |
| Polish | 44 | 1.0% |
| Portuguese | 49 | 1.1% |
| Romanian | 40 | 0.9% |
| Russian | 13 | 0.3% |
| Scandinavian | 68 | 1.5% |
| Scotch-Irish | 71 | 1.6% |
| Scottish | 137 | 3.1% |
| Slavic | 13 | 0.3% |
| Swedish | 82 | 1.8% |
| Welsh | 18 | 0.4% | View All 31 Rows |
Immigrants in Brooktrails
The most numerous immigrant groups reported in Brooktrails came from Asia (175 | 3.9%), Eastern Asia (175 | 3.9%), China (165 | 3.7%), Central America (62 | 1.4%), and Latin America (62 | 1.4%), together accounting for 14.4% of all Brooktrails residents.
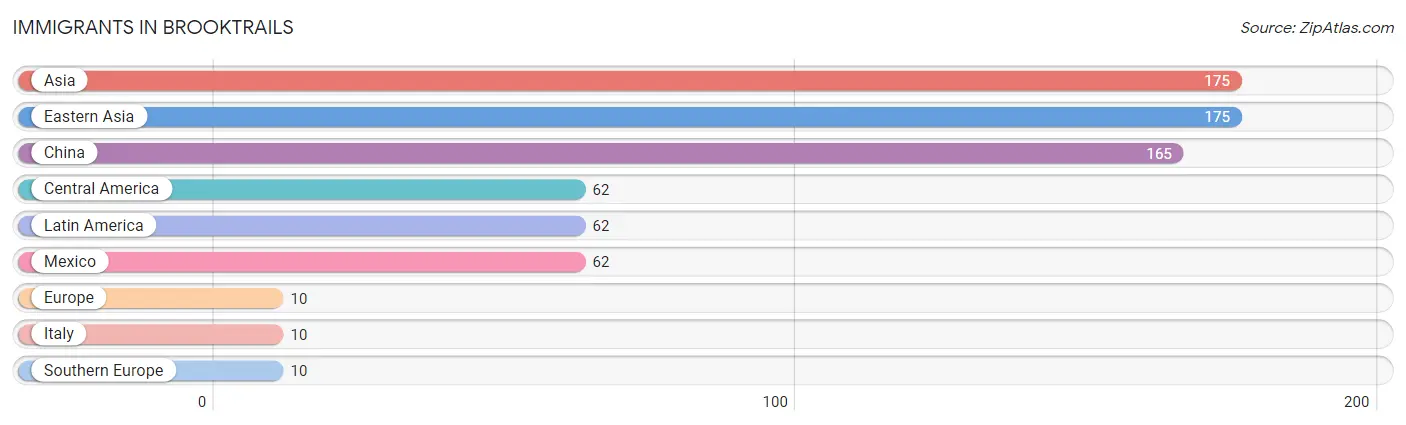
| Immigration Origin | # Population | % Population |
| Asia | 175 | 3.9% |
| Central America | 62 | 1.4% |
| China | 165 | 3.7% |
| Eastern Asia | 175 | 3.9% |
| Europe | 10 | 0.2% |
| Italy | 10 | 0.2% |
| Latin America | 62 | 1.4% |
| Mexico | 62 | 1.4% |
| Southern Europe | 10 | 0.2% | View All 9 Rows |
Sex and Age in Brooktrails
Sex and Age in Brooktrails
The most populous age groups in Brooktrails are 5 to 9 Years (276 | 12.2%) for men and Under 5 Years (335 | 15.4%) for women.
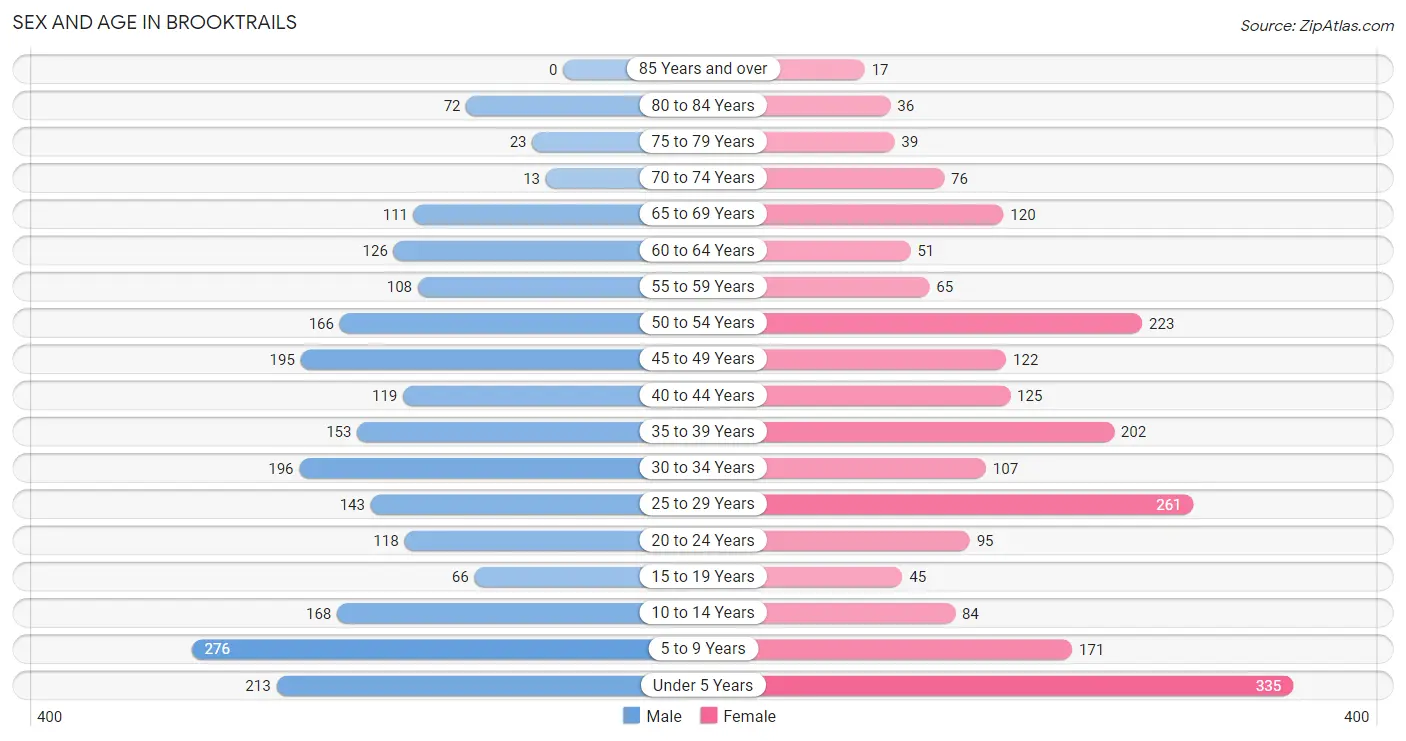
| Age Bracket | Male | Female |
| Under 5 Years | 213 (9.4%) | 335 (15.4%) |
| 5 to 9 Years | 276 (12.2%) | 171 (7.9%) |
| 10 to 14 Years | 168 (7.4%) | 84 (3.9%) |
| 15 to 19 Years | 66 (2.9%) | 45 (2.1%) |
| 20 to 24 Years | 118 (5.2%) | 95 (4.4%) |
| 25 to 29 Years | 143 (6.3%) | 261 (12.0%) |
| 30 to 34 Years | 196 (8.6%) | 107 (4.9%) |
| 35 to 39 Years | 153 (6.8%) | 202 (9.3%) |
| 40 to 44 Years | 119 (5.2%) | 125 (5.8%) |
| 45 to 49 Years | 195 (8.6%) | 122 (5.6%) |
| 50 to 54 Years | 166 (7.3%) | 223 (10.3%) |
| 55 to 59 Years | 108 (4.8%) | 65 (3.0%) |
| 60 to 64 Years | 126 (5.6%) | 51 (2.4%) |
| 65 to 69 Years | 111 (4.9%) | 120 (5.5%) |
| 70 to 74 Years | 13 (0.6%) | 76 (3.5%) |
| 75 to 79 Years | 23 (1.0%) | 39 (1.8%) |
| 80 to 84 Years | 72 (3.2%) | 36 (1.7%) |
| 85 Years and over | 0 (0.0%) | 17 (0.8%) |
| Total | 2,266 (100.0%) | 2,174 (100.0%) |
Families and Households in Brooktrails
Median Family Size in Brooktrails
The median family size in Brooktrails is 3.44 persons per family, with single male/father families (26 | 2.3%) accounting for the largest median family size of 4.08 persons per family. On the other hand, married-couple families (982 | 86.4%) represent the smallest median family size with 3.39 persons per family.
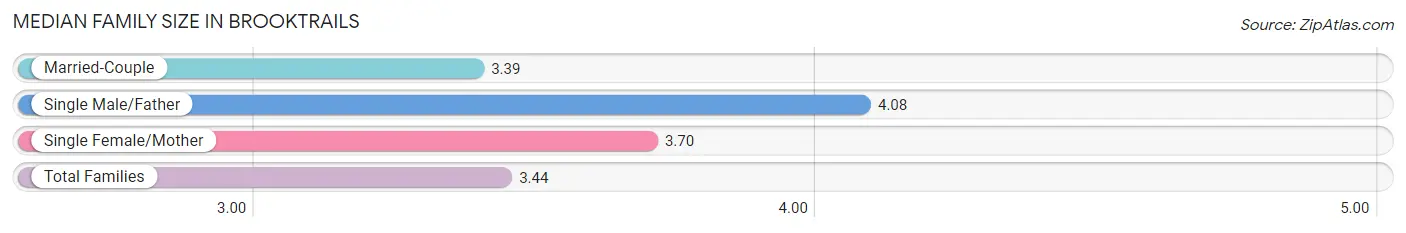
| Family Type | # Families | Family Size |
| Married-Couple | 982 (86.4%) | 3.39 |
| Single Male/Father | 26 (2.3%) | 4.08 |
| Single Female/Mother | 129 (11.4%) | 3.70 |
| Total Families | 1,137 (100.0%) | 3.44 |
Median Household Size in Brooktrails
The median household size in Brooktrails is 2.96 persons per household, with single male/father households (26 | 1.7%) accounting for the largest median household size of 4.54 persons per household. non-family households (363 | 24.2%) represent the smallest median household size with 1.27 persons per household.
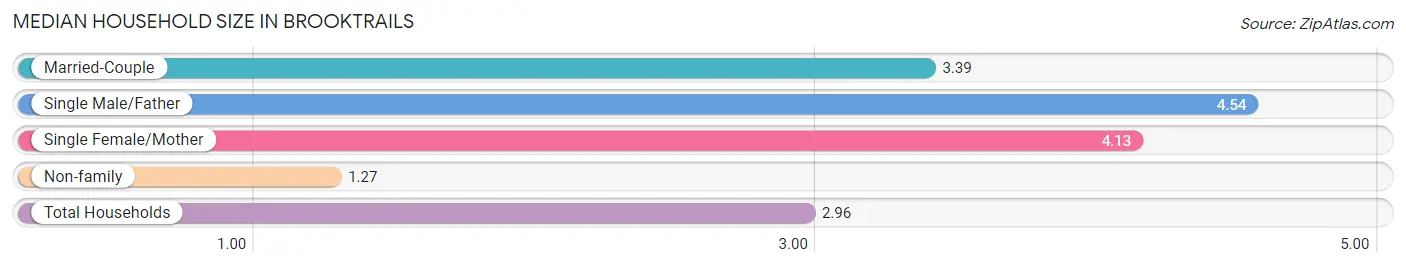
| Household Type | # Households | Household Size |
| Married-Couple | 982 (65.5%) | 3.39 |
| Single Male/Father | 26 (1.7%) | 4.54 |
| Single Female/Mother | 129 (8.6%) | 4.13 |
| Non-family | 363 (24.2%) | 1.27 |
| Total Households | 1,500 (100.0%) | 2.96 |
Household Size by Marriage Status in Brooktrails
Out of a total of 1,500 households in Brooktrails, 1,137 (75.8%) are family households, while 363 (24.2%) are nonfamily households. The most numerous type of family households are 2-person households, comprising 441, and the most common type of nonfamily households are 1-person households, comprising 288.
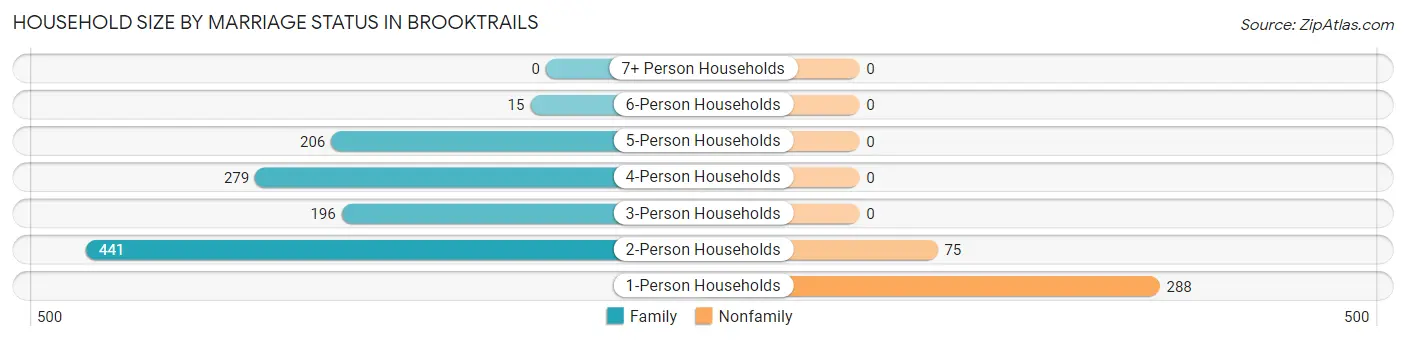
| Household Size | Family Households | Nonfamily Households |
| 1-Person Households | - | 288 (19.2%) |
| 2-Person Households | 441 (29.4%) | 75 (5.0%) |
| 3-Person Households | 196 (13.1%) | 0 (0.0%) |
| 4-Person Households | 279 (18.6%) | 0 (0.0%) |
| 5-Person Households | 206 (13.7%) | 0 (0.0%) |
| 6-Person Households | 15 (1.0%) | 0 (0.0%) |
| 7+ Person Households | 0 (0.0%) | 0 (0.0%) |
| Total | 1,137 (75.8%) | 363 (24.2%) |
Female Fertility in Brooktrails
Fertility by Age in Brooktrails
Average fertility rate in Brooktrails is 68.0 births per 1,000 women. Women in the age bracket of 20 to 34 years have the highest fertility rate with 138.0 births per 1,000 women. Women in the age bracket of 20 to 34 years acount for 84.2% of all women with births.
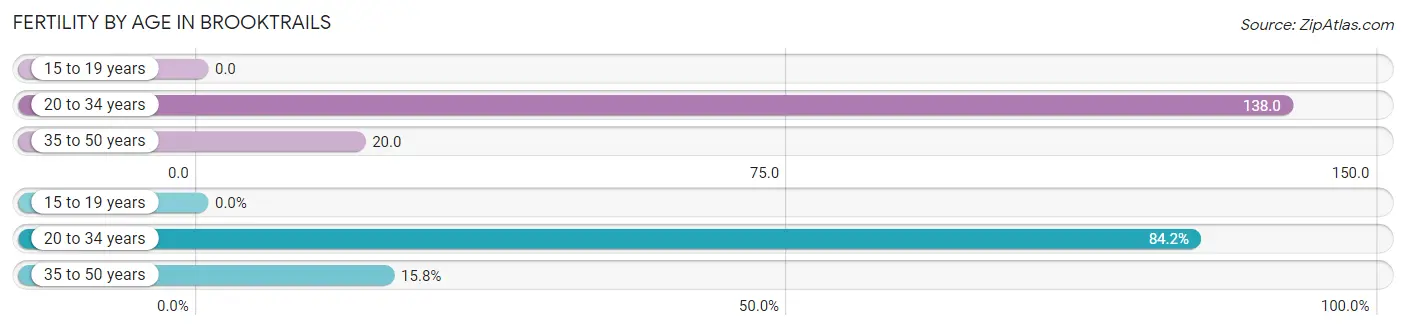
| Age Bracket | Women with Births | Births / 1,000 Women |
| 15 to 19 years | 0 (0.0%) | 0.0 |
| 20 to 34 years | 64 (84.2%) | 138.0 |
| 35 to 50 years | 12 (15.8%) | 20.0 |
| Total | 76 (100.0%) | 68.0 |
Fertility by Age by Marriage Status in Brooktrails
76.3% of women with births (76) in Brooktrails are married. The highest percentage of unmarried women with births falls into 20 to 34 years age bracket with 28.1% of them unmarried at the time of birth, while the lowest percentage of unmarried women with births belong to 35 to 50 years age bracket with 0.0% of them unmarried.
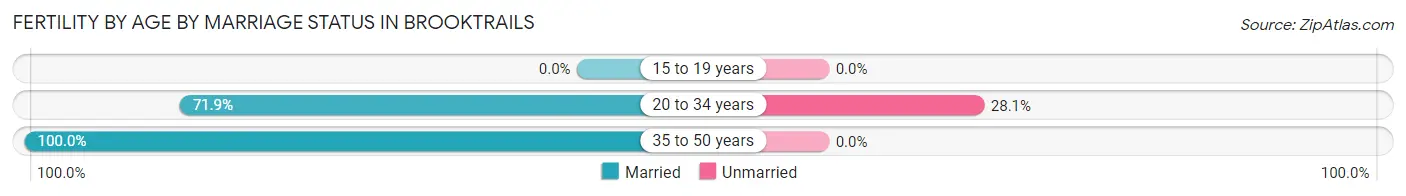
| Age Bracket | Married | Unmarried |
| 15 to 19 years | 0 (0.0%) | 0 (0.0%) |
| 20 to 34 years | 46 (71.9%) | 18 (28.1%) |
| 35 to 50 years | 12 (100.0%) | 0 (0.0%) |
| Total | 58 (76.3%) | 18 (23.7%) |
Fertility by Education in Brooktrails
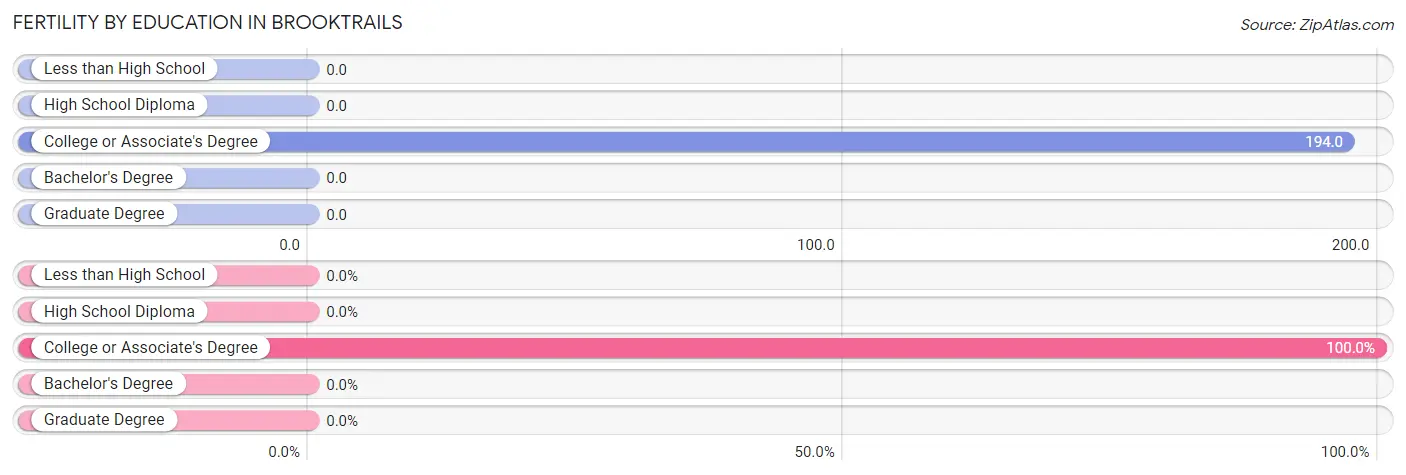
| Educational Attainment | Women with Births | Births / 1,000 Women |
| Less than High School | 0 (0.0%) | 0.0 |
| High School Diploma | 0 (0.0%) | 0.0 |
| College or Associate's Degree | 76 (100.0%) | 194.0 |
| Bachelor's Degree | 0 (0.0%) | 0.0 |
| Graduate Degree | 0 (0.0%) | 0.0 |
| Total | 76 (100.0%) | 68.0 |
Fertility by Education by Marriage Status in Brooktrails
23.7% of women with births in Brooktrails are unmarried. Women with the educational attainment of college or associate's degree are most likely to be married with 76.3% of them married at childbirth, while women with the educational attainment of college or associate's degree are least likely to be married with 23.7% of them unmarried at childbirth.
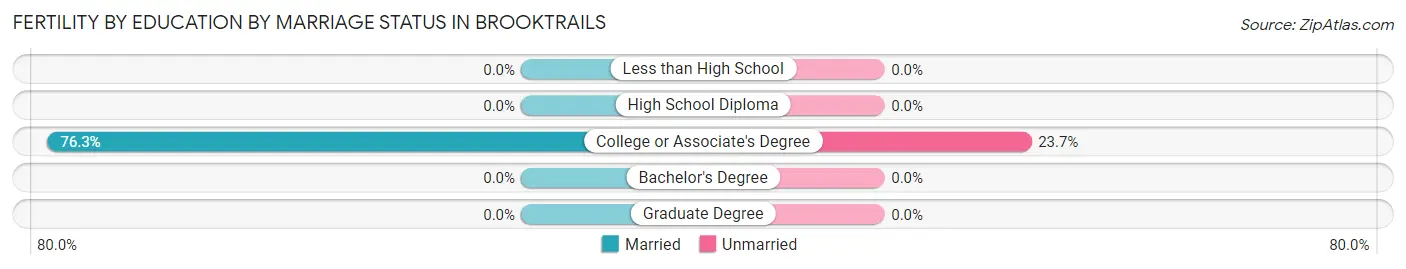
| Educational Attainment | Married | Unmarried |
| Less than High School | 0 (0.0%) | 0 (0.0%) |
| High School Diploma | 0 (0.0%) | 0 (0.0%) |
| College or Associate's Degree | 58 (76.3%) | 18 (23.7%) |
| Bachelor's Degree | 0 (0.0%) | 0 (0.0%) |
| Graduate Degree | 0 (0.0%) | 0 (0.0%) |
| Total | 58 (76.3%) | 18 (23.7%) |
Employment Characteristics in Brooktrails
Employment by Class of Employer in Brooktrails
Among the 2,149 employed individuals in Brooktrails, private company employees (1,260 | 58.6%), local government employees (449 | 20.9%), and not-for-profit organizations (277 | 12.9%) make up the most common classes of employment.
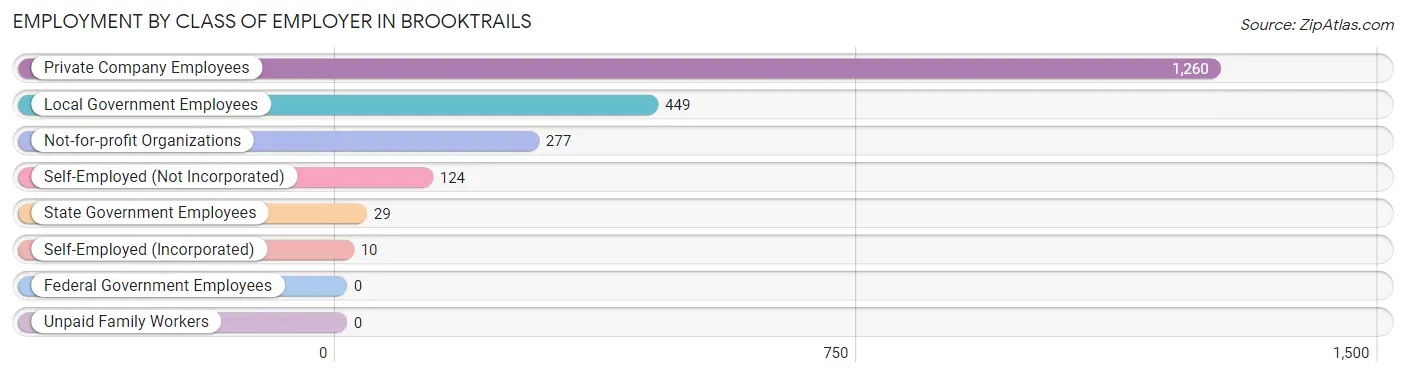
| Employer Class | # Employees | % Employees |
| Private Company Employees | 1,260 | 58.6% |
| Self-Employed (Incorporated) | 10 | 0.5% |
| Self-Employed (Not Incorporated) | 124 | 5.8% |
| Not-for-profit Organizations | 277 | 12.9% |
| Local Government Employees | 449 | 20.9% |
| State Government Employees | 29 | 1.3% |
| Federal Government Employees | 0 | 0.0% |
| Unpaid Family Workers | 0 | 0.0% |
| Total | 2,149 | 100.0% |
Employment Status by Age in Brooktrails
According to the labor force statistics for Brooktrails, out of the total population over 16 years of age (3,158), 70.9% or 2,239 individuals are in the labor force, with 3.8% or 85 of them unemployed. The age group with the highest labor force participation rate is 45 to 54 years, with 98.2% or 693 individuals in the labor force. Within the labor force, the 16 to 19 years age range has the highest percentage of unemployed individuals, with 53.8% or 14 of them being unemployed.
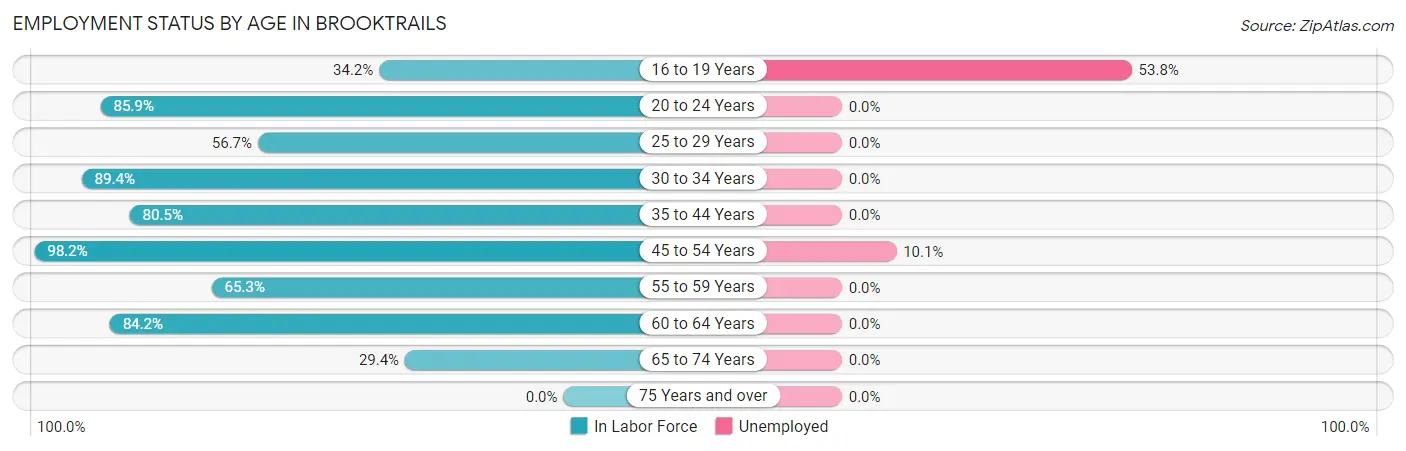
| Age Bracket | In Labor Force | Unemployed |
| 16 to 19 Years | 26 (34.2%) | 14 (53.8%) |
| 20 to 24 Years | 183 (85.9%) | 0 (0.0%) |
| 25 to 29 Years | 229 (56.7%) | 0 (0.0%) |
| 30 to 34 Years | 271 (89.4%) | 0 (0.0%) |
| 35 to 44 Years | 482 (80.5%) | 0 (0.0%) |
| 45 to 54 Years | 693 (98.2%) | 70 (10.1%) |
| 55 to 59 Years | 113 (65.3%) | 0 (0.0%) |
| 60 to 64 Years | 149 (84.2%) | 0 (0.0%) |
| 65 to 74 Years | 94 (29.4%) | 0 (0.0%) |
| 75 Years and over | 0 (0.0%) | 0 (0.0%) |
| Total | 2,239 (70.9%) | 85 (3.8%) |
Employment Status by Educational Attainment in Brooktrails
According to labor force statistics for Brooktrails, 82.0% of individuals (1,937) out of the total population between 25 and 64 years of age (2,362) are in the labor force, with 3.6% or 70 of them being unemployed. The group with the highest labor force participation rate are those with the educational attainment of bachelor's degree or higher, with 89.5% or 316 individuals in the labor force. Within the labor force, individuals with college / associate degree education have the highest percentage of unemployment, with 9.0% or 51 of them being unemployed.
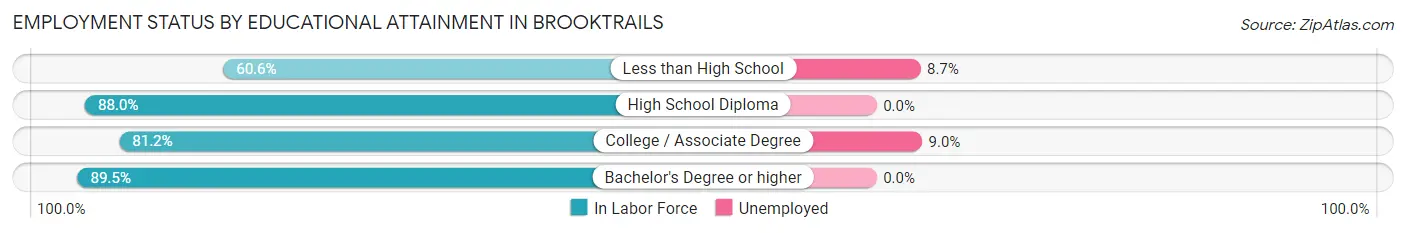
| Educational Attainment | In Labor Force | Unemployed |
| Less than High School | 218 (60.6%) | 31 (8.7%) |
| High School Diploma | 834 (88.0%) | 0 (0.0%) |
| College / Associate Degree | 569 (81.2%) | 63 (9.0%) |
| Bachelor's Degree or higher | 316 (89.5%) | 0 (0.0%) |
| Total | 1,937 (82.0%) | 85 (3.6%) |
Employment Occupations by Sex in Brooktrails
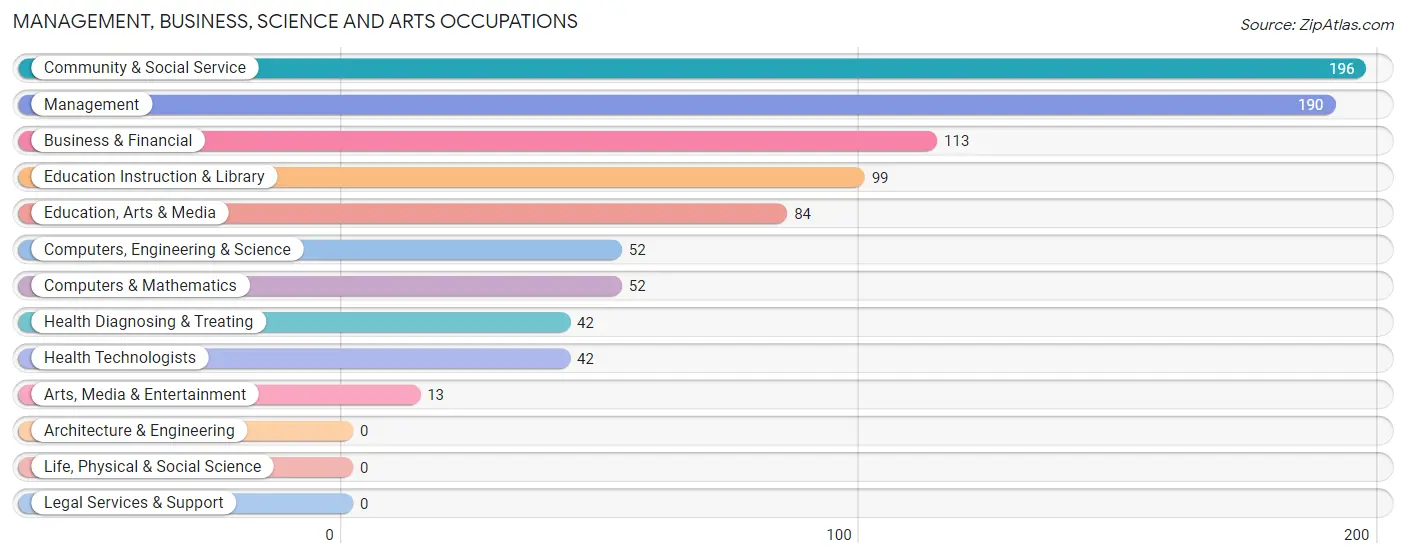
Management, Business, Science and Arts Occupations
The most common Management, Business, Science and Arts occupations in Brooktrails are Community & Social Service (196 | 9.1%), Management (190 | 8.8%), Business & Financial (113 | 5.2%), Education Instruction & Library (99 | 4.6%), and Education, Arts & Media (84 | 3.9%).
Management, Business, Science and Arts Occupations by Sex
Within the Management, Business, Science and Arts occupations in Brooktrails, the most male-oriented occupations are Business & Financial (100.0%), Computers, Engineering & Science (100.0%), and Computers & Mathematics (100.0%), while the most female-oriented occupations are Arts, Media & Entertainment (100.0%), Health Diagnosing & Treating (100.0%), and Health Technologists (100.0%).
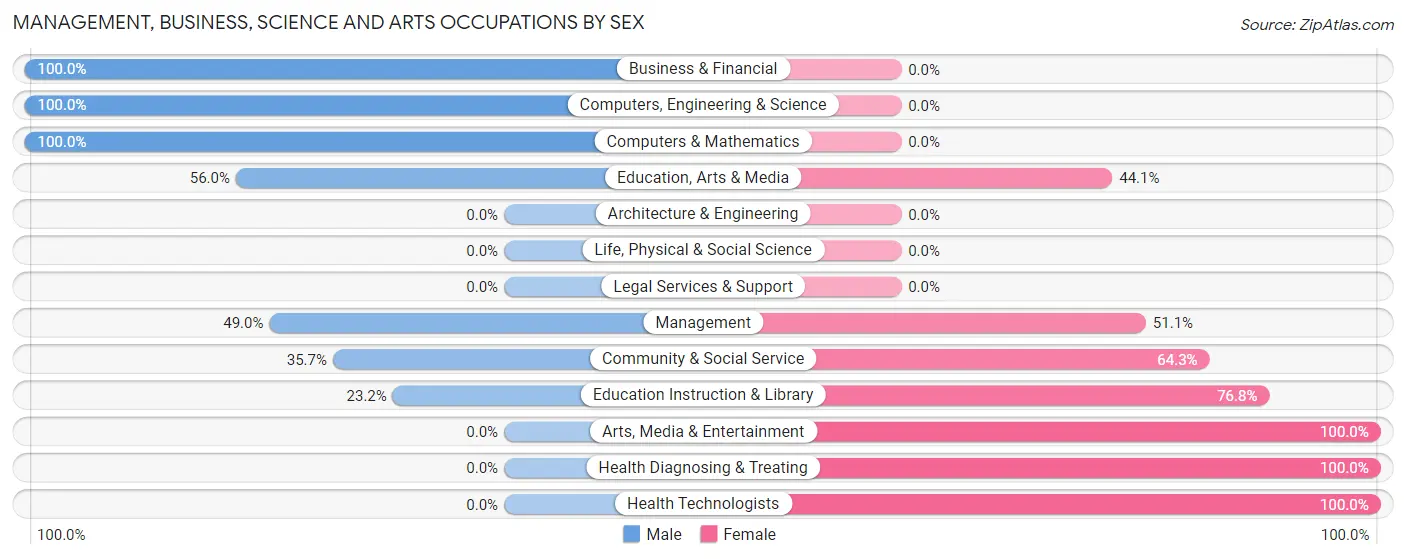
| Occupation | Male | Female |
| Management | 93 (48.9%) | 97 (51.0%) |
| Business & Financial | 113 (100.0%) | 0 (0.0%) |
| Computers, Engineering & Science | 52 (100.0%) | 0 (0.0%) |
| Computers & Mathematics | 52 (100.0%) | 0 (0.0%) |
| Architecture & Engineering | 0 (0.0%) | 0 (0.0%) |
| Life, Physical & Social Science | 0 (0.0%) | 0 (0.0%) |
| Community & Social Service | 70 (35.7%) | 126 (64.3%) |
| Education, Arts & Media | 47 (55.9%) | 37 (44.1%) |
| Legal Services & Support | 0 (0.0%) | 0 (0.0%) |
| Education Instruction & Library | 23 (23.2%) | 76 (76.8%) |
| Arts, Media & Entertainment | 0 (0.0%) | 13 (100.0%) |
| Health Diagnosing & Treating | 0 (0.0%) | 42 (100.0%) |
| Health Technologists | 0 (0.0%) | 42 (100.0%) |
| Total (Category) | 328 (55.3%) | 265 (44.7%) |
| Total (Overall) | 1,300 (60.3%) | 856 (39.7%) |
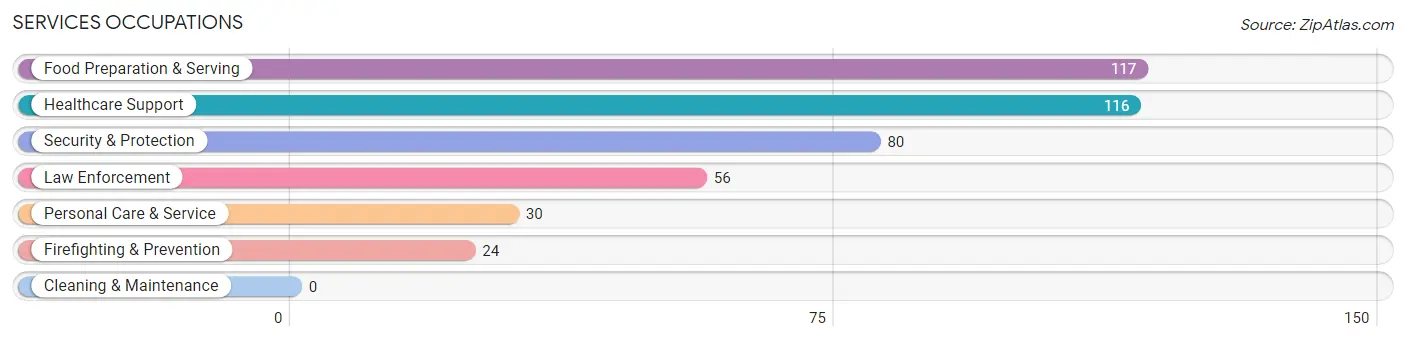
Services Occupations
The most common Services occupations in Brooktrails are Food Preparation & Serving (117 | 5.4%), Healthcare Support (116 | 5.4%), Security & Protection (80 | 3.7%), Law Enforcement (56 | 2.6%), and Personal Care & Service (30 | 1.4%).
Services Occupations by Sex
Within the Services occupations in Brooktrails, the most male-oriented occupations are Firefighting & Prevention (100.0%), Security & Protection (97.5%), and Law Enforcement (96.4%), while the most female-oriented occupations are Personal Care & Service (100.0%), Food Preparation & Serving (59.0%), and Healthcare Support (41.4%).
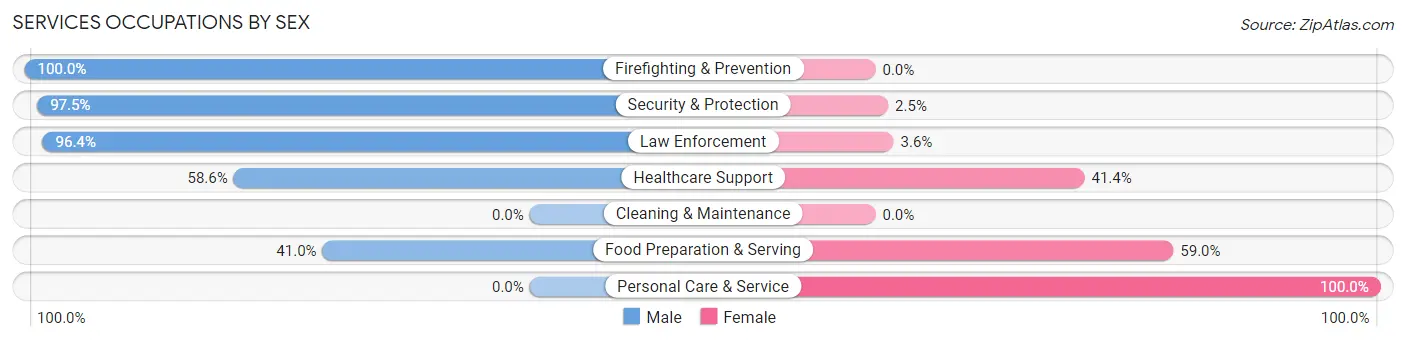
| Occupation | Male | Female |
| Healthcare Support | 68 (58.6%) | 48 (41.4%) |
| Security & Protection | 78 (97.5%) | 2 (2.5%) |
| Firefighting & Prevention | 24 (100.0%) | 0 (0.0%) |
| Law Enforcement | 54 (96.4%) | 2 (3.6%) |
| Food Preparation & Serving | 48 (41.0%) | 69 (59.0%) |
| Cleaning & Maintenance | 0 (0.0%) | 0 (0.0%) |
| Personal Care & Service | 0 (0.0%) | 30 (100.0%) |
| Total (Category) | 194 (56.6%) | 149 (43.4%) |
| Total (Overall) | 1,300 (60.3%) | 856 (39.7%) |
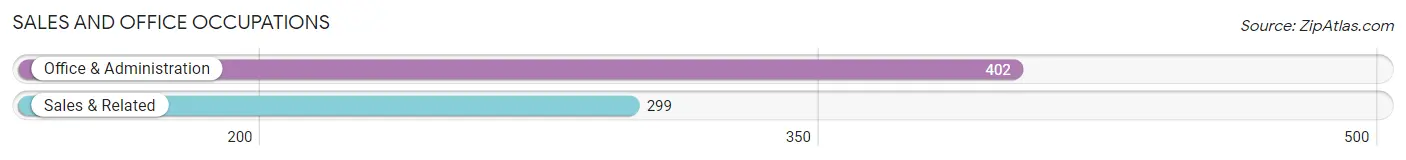
Sales and Office Occupations
The most common Sales and Office occupations in Brooktrails are Office & Administration (402 | 18.6%), and Sales & Related (299 | 13.9%).
Sales and Office Occupations by Sex
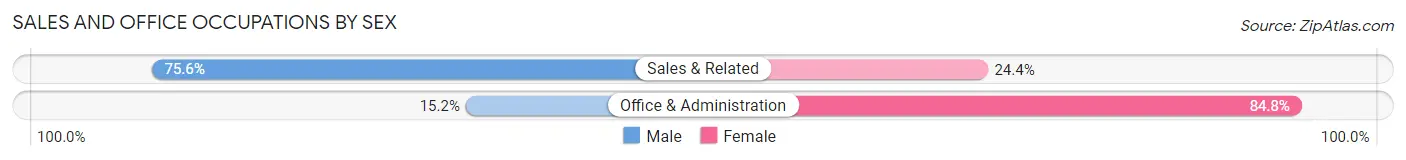
| Occupation | Male | Female |
| Sales & Related | 226 (75.6%) | 73 (24.4%) |
| Office & Administration | 61 (15.2%) | 341 (84.8%) |
| Total (Category) | 287 (40.9%) | 414 (59.1%) |
| Total (Overall) | 1,300 (60.3%) | 856 (39.7%) |
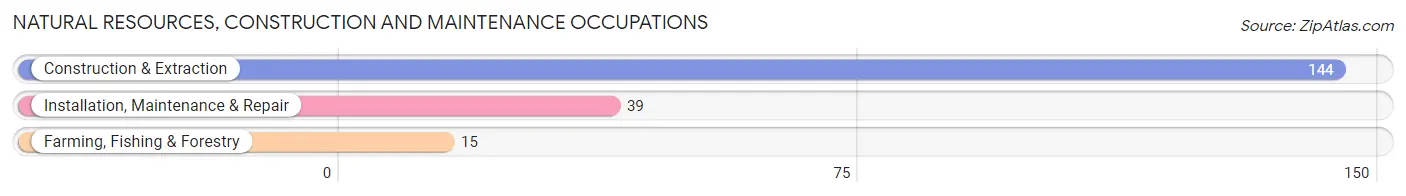
Natural Resources, Construction and Maintenance Occupations
The most common Natural Resources, Construction and Maintenance occupations in Brooktrails are Construction & Extraction (144 | 6.7%), Installation, Maintenance & Repair (39 | 1.8%), and Farming, Fishing & Forestry (15 | 0.7%).
Natural Resources, Construction and Maintenance Occupations by Sex
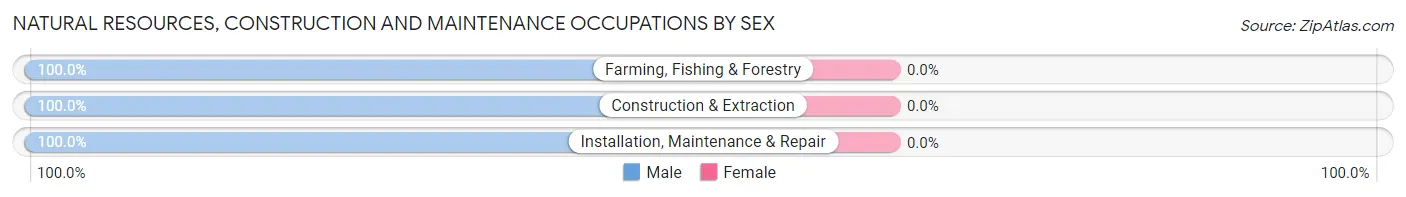
| Occupation | Male | Female |
| Farming, Fishing & Forestry | 15 (100.0%) | 0 (0.0%) |
| Construction & Extraction | 144 (100.0%) | 0 (0.0%) |
| Installation, Maintenance & Repair | 39 (100.0%) | 0 (0.0%) |
| Total (Category) | 198 (100.0%) | 0 (0.0%) |
| Total (Overall) | 1,300 (60.3%) | 856 (39.7%) |
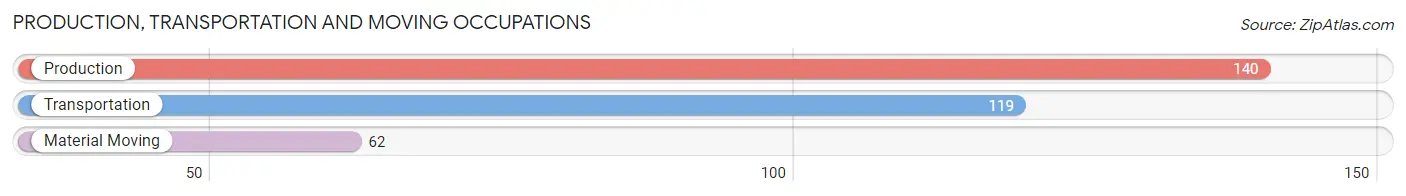
Production, Transportation and Moving Occupations
The most common Production, Transportation and Moving occupations in Brooktrails are Production (140 | 6.5%), Transportation (119 | 5.5%), and Material Moving (62 | 2.9%).
Production, Transportation and Moving Occupations by Sex
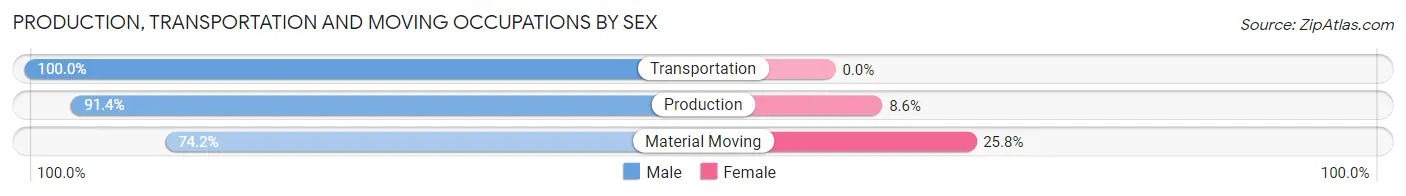
| Occupation | Male | Female |
| Production | 128 (91.4%) | 12 (8.6%) |
| Transportation | 119 (100.0%) | 0 (0.0%) |
| Material Moving | 46 (74.2%) | 16 (25.8%) |
| Total (Category) | 293 (91.3%) | 28 (8.7%) |
| Total (Overall) | 1,300 (60.3%) | 856 (39.7%) |
Employment Industries by Sex in Brooktrails
Employment Industries in Brooktrails
The major employment industries in Brooktrails include Public Administration (335 | 15.5%), Health Care & Social Assistance (309 | 14.3%), Manufacturing (299 | 13.9%), Retail Trade (268 | 12.4%), and Construction (209 | 9.7%).
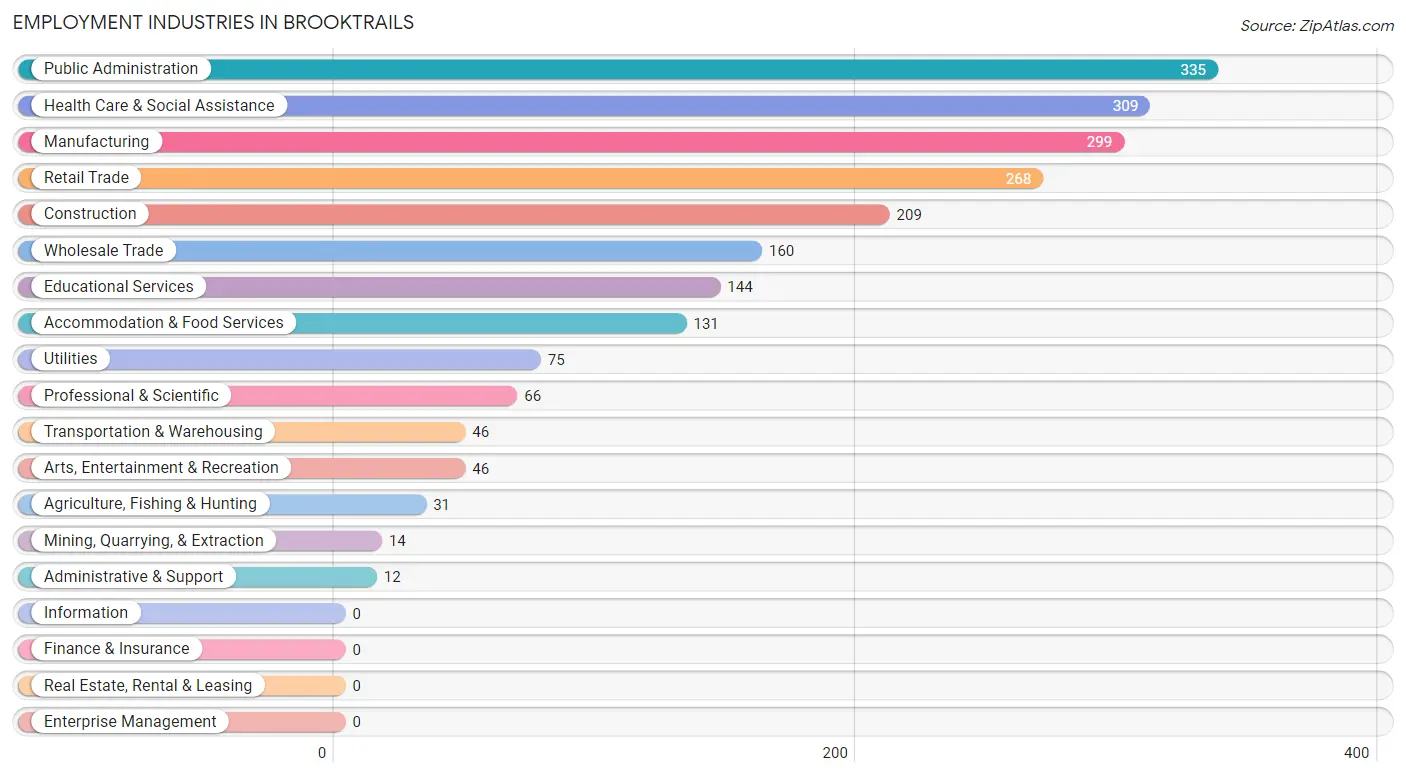
Employment Industries by Sex in Brooktrails
The Brooktrails industries that see more men than women are Mining, Quarrying, & Extraction (100.0%), Construction (100.0%), and Utilities (100.0%), whereas the industries that tend to have a higher number of women are Accommodation & Food Services (87.8%), Educational Services (84.0%), and Public Administration (64.2%).
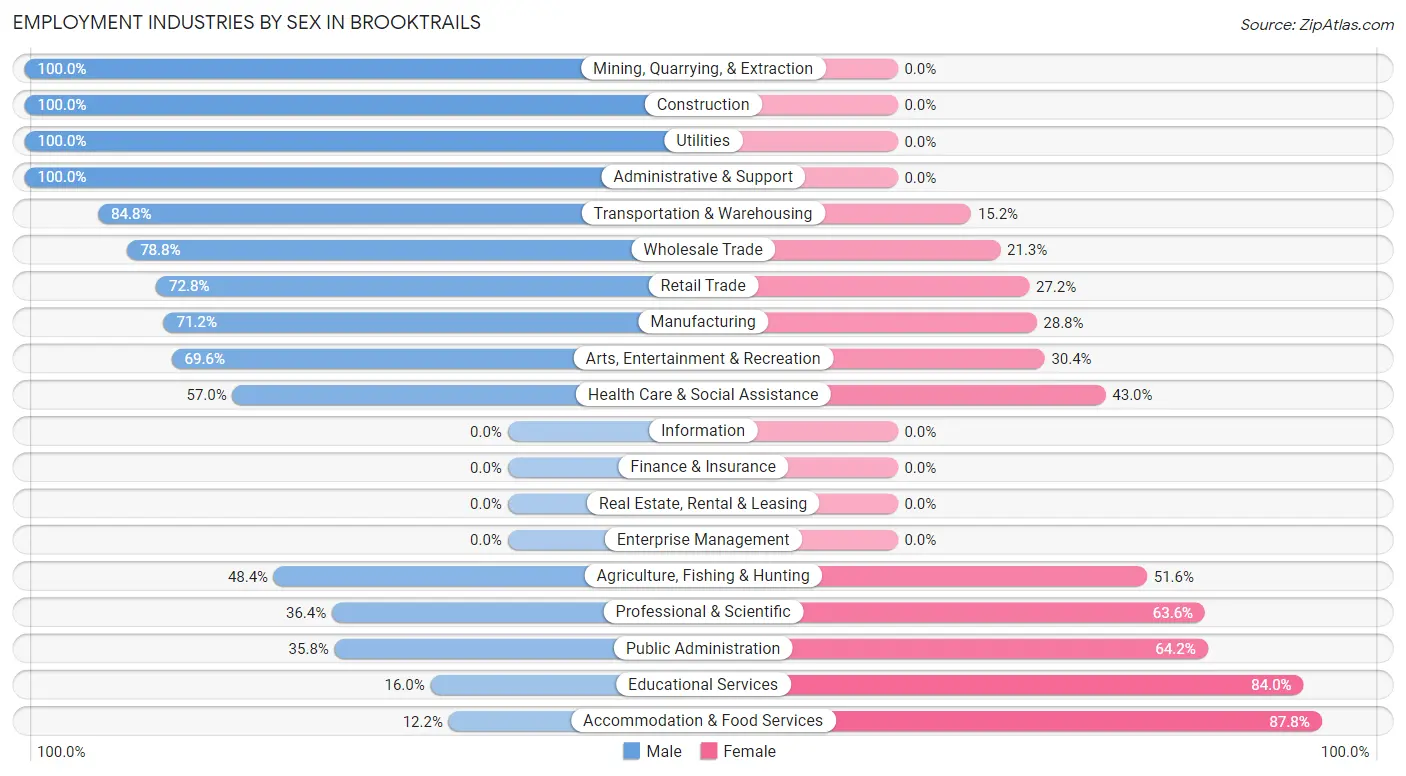
| Industry | Male | Female |
| Agriculture, Fishing & Hunting | 15 (48.4%) | 16 (51.6%) |
| Mining, Quarrying, & Extraction | 14 (100.0%) | 0 (0.0%) |
| Construction | 209 (100.0%) | 0 (0.0%) |
| Manufacturing | 213 (71.2%) | 86 (28.8%) |
| Wholesale Trade | 126 (78.7%) | 34 (21.2%) |
| Retail Trade | 195 (72.8%) | 73 (27.2%) |
| Transportation & Warehousing | 39 (84.8%) | 7 (15.2%) |
| Utilities | 75 (100.0%) | 0 (0.0%) |
| Information | 0 (0.0%) | 0 (0.0%) |
| Finance & Insurance | 0 (0.0%) | 0 (0.0%) |
| Real Estate, Rental & Leasing | 0 (0.0%) | 0 (0.0%) |
| Professional & Scientific | 24 (36.4%) | 42 (63.6%) |
| Enterprise Management | 0 (0.0%) | 0 (0.0%) |
| Administrative & Support | 12 (100.0%) | 0 (0.0%) |
| Educational Services | 23 (16.0%) | 121 (84.0%) |
| Health Care & Social Assistance | 176 (57.0%) | 133 (43.0%) |
| Arts, Entertainment & Recreation | 32 (69.6%) | 14 (30.4%) |
| Accommodation & Food Services | 16 (12.2%) | 115 (87.8%) |
| Public Administration | 120 (35.8%) | 215 (64.2%) |
| Total | 1,300 (60.3%) | 856 (39.7%) |
Education in Brooktrails
School Enrollment in Brooktrails
The most common levels of schooling among the 1,161 students in Brooktrails are elementary school (408 | 35.1%), middle school (179 | 15.4%), and kindergarten (158 | 13.6%).
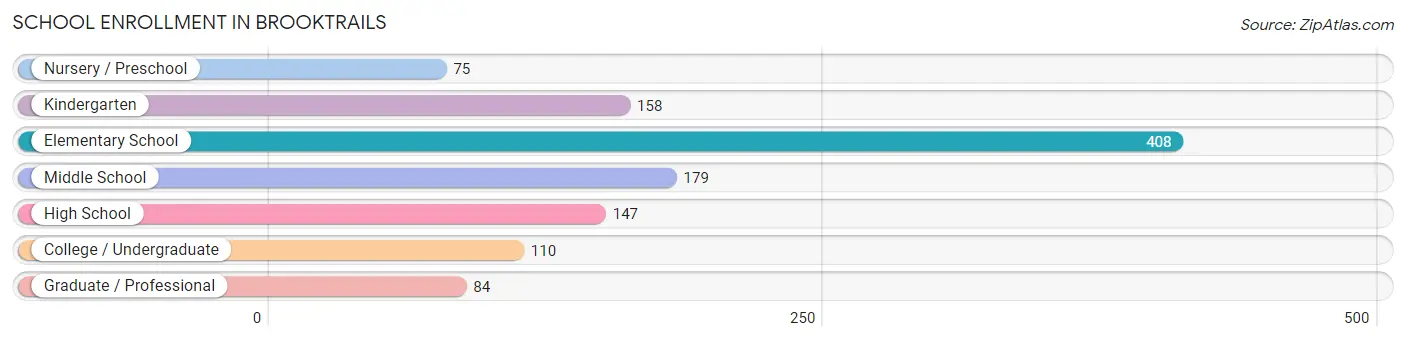
| School Level | # Students | % Students |
| Nursery / Preschool | 75 | 6.5% |
| Kindergarten | 158 | 13.6% |
| Elementary School | 408 | 35.1% |
| Middle School | 179 | 15.4% |
| High School | 147 | 12.7% |
| College / Undergraduate | 110 | 9.5% |
| Graduate / Professional | 84 | 7.2% |
| Total | 1,161 | 100.0% |
School Enrollment by Age by Funding Source in Brooktrails
Out of a total of 1,161 students who are enrolled in schools in Brooktrails, 49 (4.2%) attend a private institution, while the remaining 1,112 (95.8%) are enrolled in public schools. The age group of 3 to 4 year olds has the highest likelihood of being enrolled in private schools, with 24 (12.4% in the age bracket) enrolled. Conversely, the age group of 10 to 14 year olds has the lowest likelihood of being enrolled in a private school, with 252 (100.0% in the age bracket) attending a public institution.
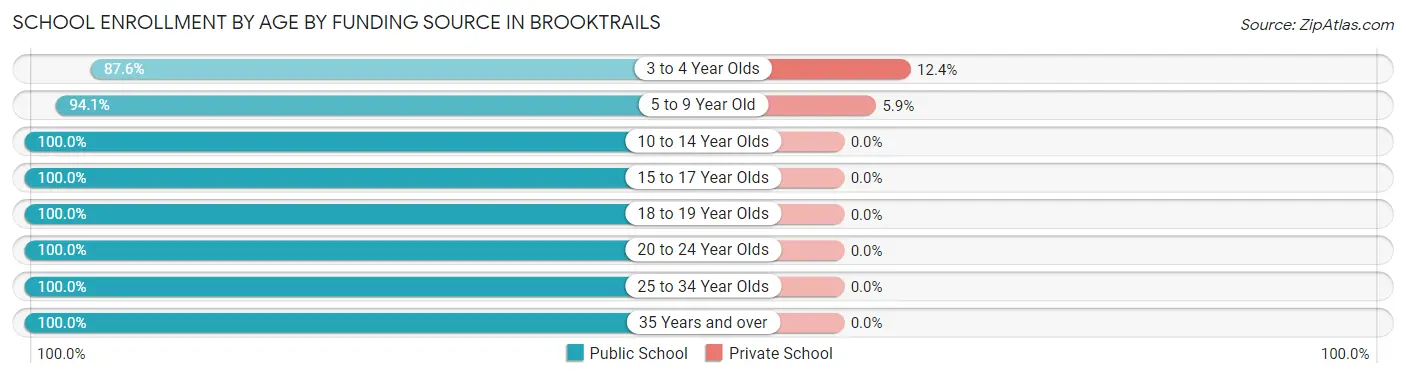
| Age Bracket | Public School | Private School |
| 3 to 4 Year Olds | 170 (87.6%) | 24 (12.4%) |
| 5 to 9 Year Old | 397 (94.1%) | 25 (5.9%) |
| 10 to 14 Year Olds | 252 (100.0%) | 0 (0.0%) |
| 15 to 17 Year Olds | 80 (100.0%) | 0 (0.0%) |
| 18 to 19 Year Olds | 19 (100.0%) | 0 (0.0%) |
| 20 to 24 Year Olds | 49 (100.0%) | 0 (0.0%) |
| 25 to 34 Year Olds | 119 (100.0%) | 0 (0.0%) |
| 35 Years and over | 26 (100.0%) | 0 (0.0%) |
| Total | 1,112 (95.8%) | 49 (4.2%) |
Educational Attainment by Field of Study in Brooktrails
Business (130 | 19.1%), social sciences (117 | 17.2%), literature & languages (97 | 14.2%), engineering (83 | 12.2%), and visual & performing arts (71 | 10.4%) are the most common fields of study among 681 individuals in Brooktrails who have obtained a bachelor's degree or higher.
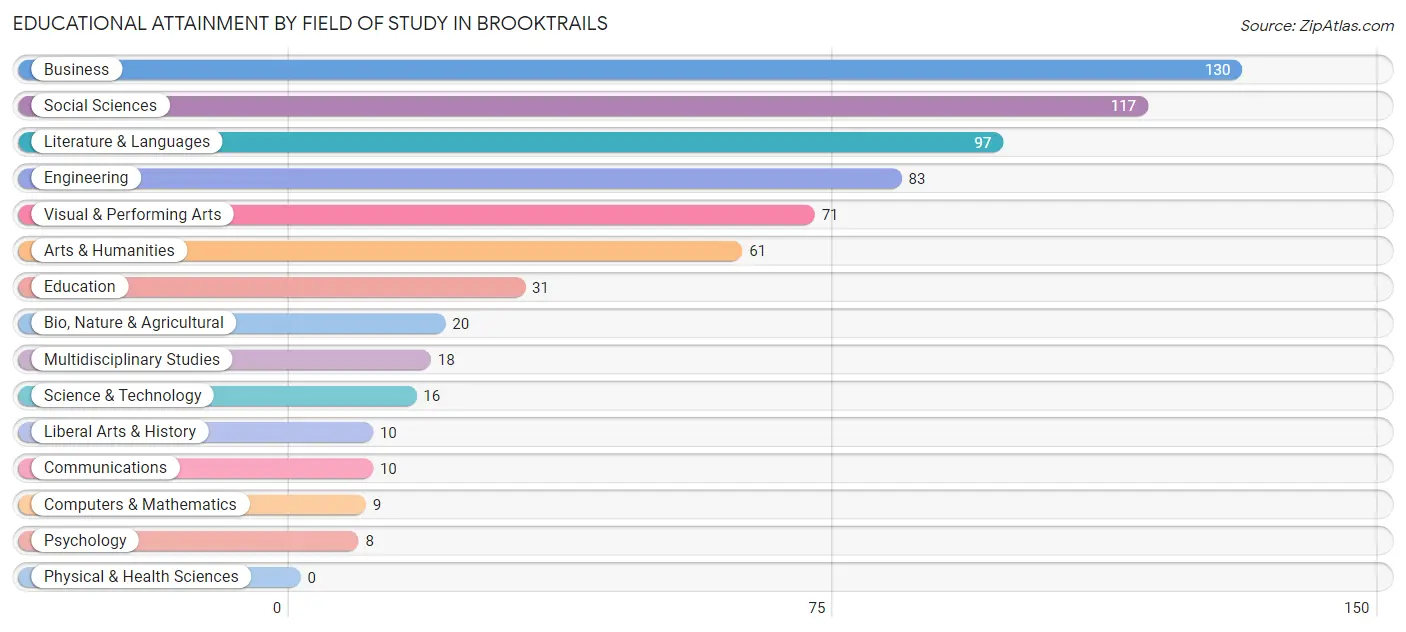
| Field of Study | # Graduates | % Graduates |
| Computers & Mathematics | 9 | 1.3% |
| Bio, Nature & Agricultural | 20 | 2.9% |
| Physical & Health Sciences | 0 | 0.0% |
| Psychology | 8 | 1.2% |
| Social Sciences | 117 | 17.2% |
| Engineering | 83 | 12.2% |
| Multidisciplinary Studies | 18 | 2.6% |
| Science & Technology | 16 | 2.4% |
| Business | 130 | 19.1% |
| Education | 31 | 4.5% |
| Literature & Languages | 97 | 14.2% |
| Liberal Arts & History | 10 | 1.5% |
| Visual & Performing Arts | 71 | 10.4% |
| Communications | 10 | 1.5% |
| Arts & Humanities | 61 | 9.0% |
| Total | 681 | 100.0% |
Transportation & Commute in Brooktrails
Vehicle Availability by Sex in Brooktrails
The most prevalent vehicle ownership categories in Brooktrails are males with 2 vehicles (554, accounting for 42.6%) and females with 2 vehicles (271, making up 65.2%).
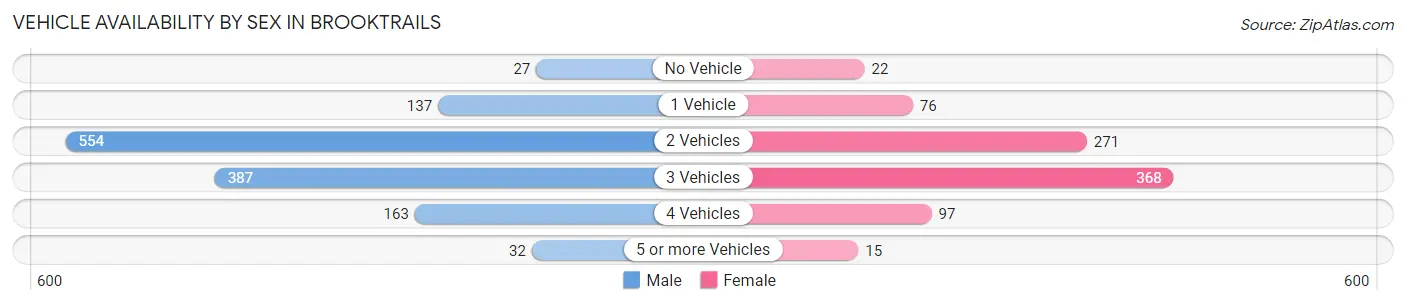
| Vehicles Available | Male | Female |
| No Vehicle | 27 (2.1%) | 22 (2.6%) |
| 1 Vehicle | 137 (10.5%) | 76 (8.9%) |
| 2 Vehicles | 554 (42.6%) | 271 (31.9%) |
| 3 Vehicles | 387 (29.8%) | 368 (43.3%) |
| 4 Vehicles | 163 (12.5%) | 97 (11.4%) |
| 5 or more Vehicles | 32 (2.5%) | 15 (1.8%) |
| Total | 1,300 (100.0%) | 849 (100.0%) |
Commute Time in Brooktrails
The most frequently occuring commute durations in Brooktrails are 30 to 34 minutes (760 commuters, 35.7%), 10 to 14 minutes (404 commuters, 19.0%), and 15 to 19 minutes (319 commuters, 15.0%).
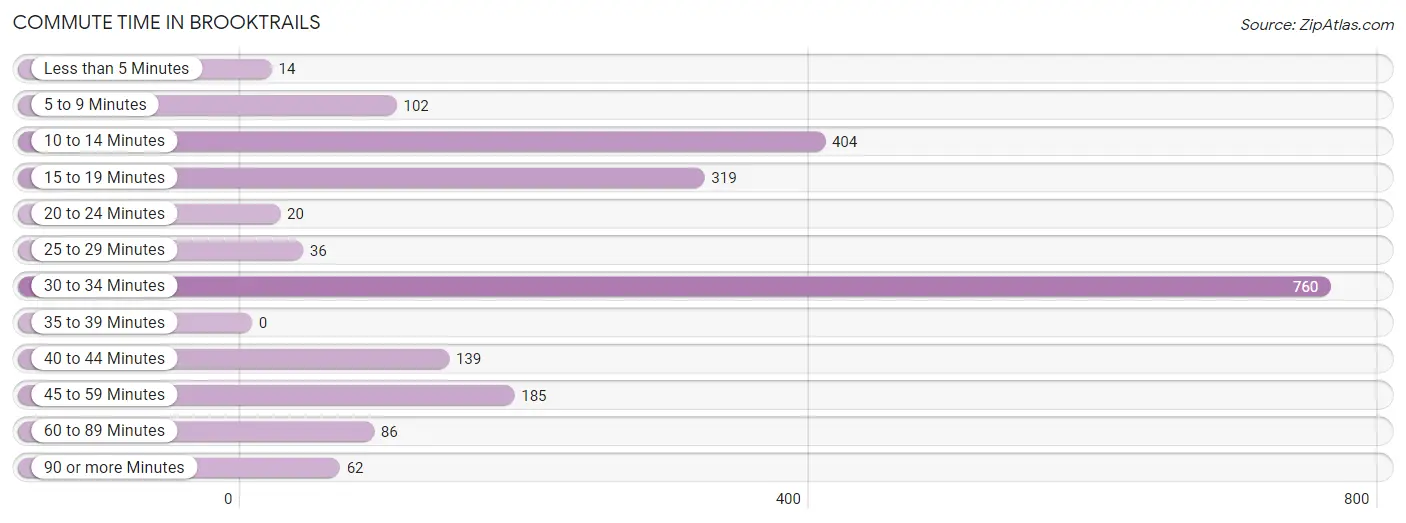
| Commute Time | # Commuters | % Commuters |
| Less than 5 Minutes | 14 | 0.7% |
| 5 to 9 Minutes | 102 | 4.8% |
| 10 to 14 Minutes | 404 | 19.0% |
| 15 to 19 Minutes | 319 | 15.0% |
| 20 to 24 Minutes | 20 | 0.9% |
| 25 to 29 Minutes | 36 | 1.7% |
| 30 to 34 Minutes | 760 | 35.7% |
| 35 to 39 Minutes | 0 | 0.0% |
| 40 to 44 Minutes | 139 | 6.5% |
| 45 to 59 Minutes | 185 | 8.7% |
| 60 to 89 Minutes | 86 | 4.0% |
| 90 or more Minutes | 62 | 2.9% |
Commute Time by Sex in Brooktrails
The most common commute times in Brooktrails are 30 to 34 minutes (419 commuters, 32.7%) for males and 30 to 34 minutes (341 commuters, 40.3%) for females.
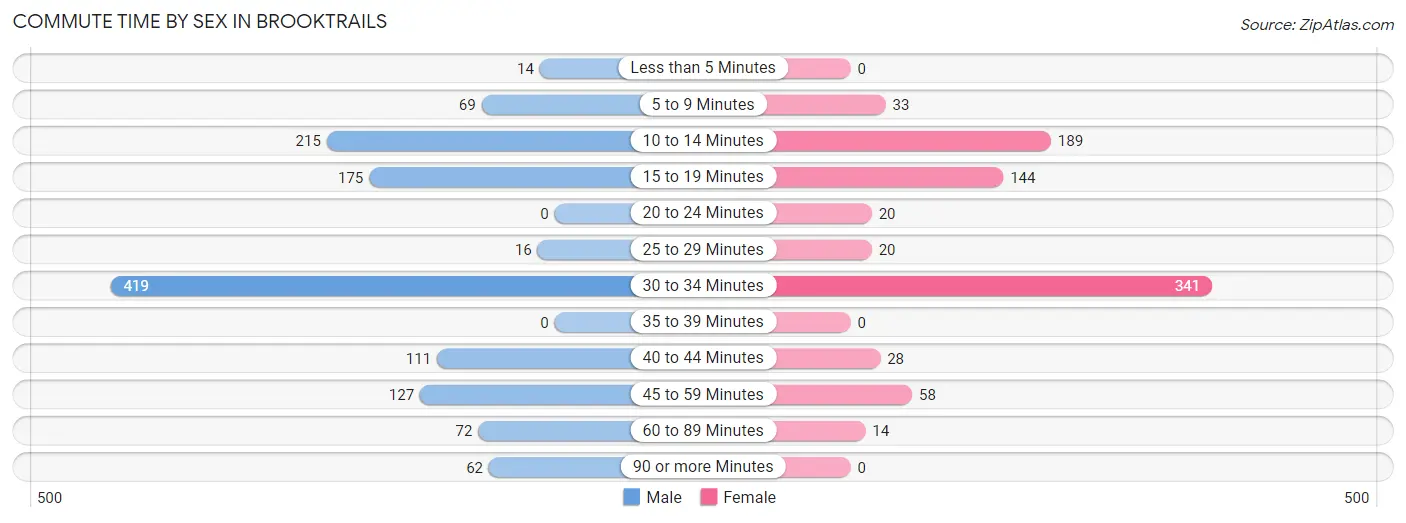
| Commute Time | Male | Female |
| Less than 5 Minutes | 14 (1.1%) | 0 (0.0%) |
| 5 to 9 Minutes | 69 (5.4%) | 33 (3.9%) |
| 10 to 14 Minutes | 215 (16.8%) | 189 (22.3%) |
| 15 to 19 Minutes | 175 (13.7%) | 144 (17.0%) |
| 20 to 24 Minutes | 0 (0.0%) | 20 (2.4%) |
| 25 to 29 Minutes | 16 (1.3%) | 20 (2.4%) |
| 30 to 34 Minutes | 419 (32.7%) | 341 (40.3%) |
| 35 to 39 Minutes | 0 (0.0%) | 0 (0.0%) |
| 40 to 44 Minutes | 111 (8.7%) | 28 (3.3%) |
| 45 to 59 Minutes | 127 (9.9%) | 58 (6.9%) |
| 60 to 89 Minutes | 72 (5.6%) | 14 (1.7%) |
| 90 or more Minutes | 62 (4.8%) | 0 (0.0%) |
Time of Departure to Work by Sex in Brooktrails
The most frequent times of departure to work in Brooktrails are 7:00 AM to 7:29 AM (297, 23.2%) for males and 7:30 AM to 7:59 AM (248, 29.3%) for females.
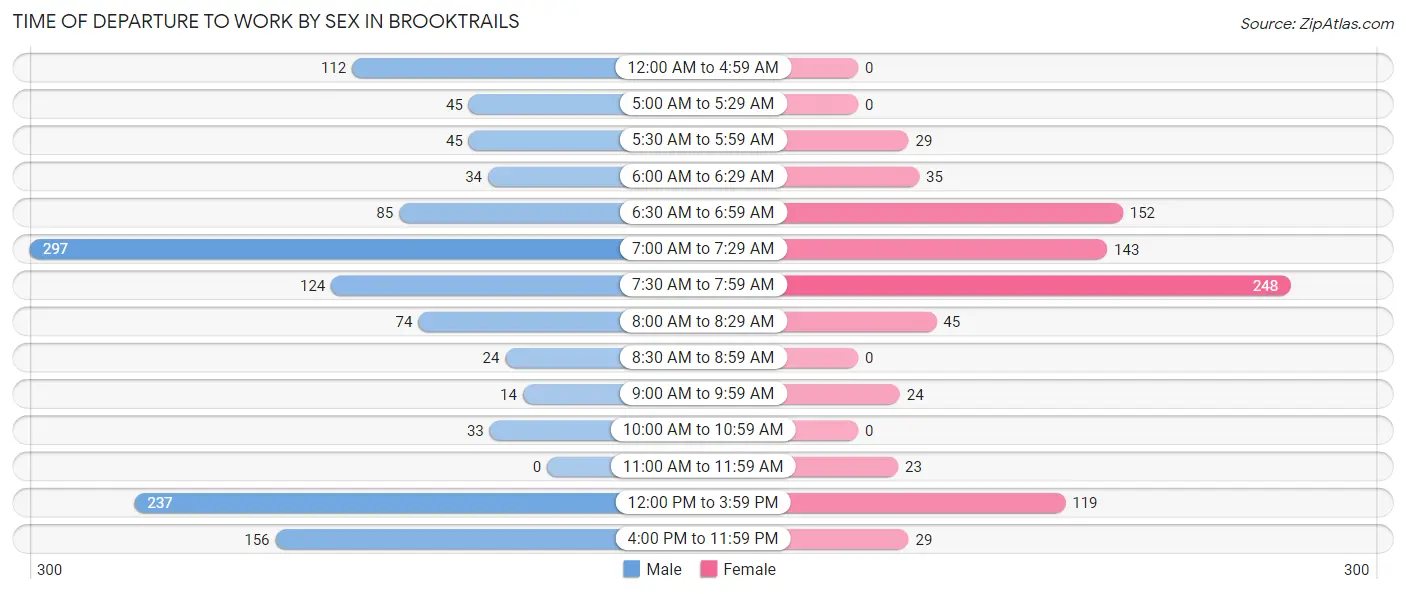
| Time of Departure | Male | Female |
| 12:00 AM to 4:59 AM | 112 (8.7%) | 0 (0.0%) |
| 5:00 AM to 5:29 AM | 45 (3.5%) | 0 (0.0%) |
| 5:30 AM to 5:59 AM | 45 (3.5%) | 29 (3.4%) |
| 6:00 AM to 6:29 AM | 34 (2.7%) | 35 (4.1%) |
| 6:30 AM to 6:59 AM | 85 (6.6%) | 152 (17.9%) |
| 7:00 AM to 7:29 AM | 297 (23.2%) | 143 (16.9%) |
| 7:30 AM to 7:59 AM | 124 (9.7%) | 248 (29.3%) |
| 8:00 AM to 8:29 AM | 74 (5.8%) | 45 (5.3%) |
| 8:30 AM to 8:59 AM | 24 (1.9%) | 0 (0.0%) |
| 9:00 AM to 9:59 AM | 14 (1.1%) | 24 (2.8%) |
| 10:00 AM to 10:59 AM | 33 (2.6%) | 0 (0.0%) |
| 11:00 AM to 11:59 AM | 0 (0.0%) | 23 (2.7%) |
| 12:00 PM to 3:59 PM | 237 (18.5%) | 119 (14.1%) |
| 4:00 PM to 11:59 PM | 156 (12.2%) | 29 (3.4%) |
| Total | 1,280 (100.0%) | 847 (100.0%) |
Housing Occupancy in Brooktrails
Occupancy by Ownership in Brooktrails
Of the total 1,500 dwellings in Brooktrails, owner-occupied units account for 1,080 (72.0%), while renter-occupied units make up 420 (28.0%).
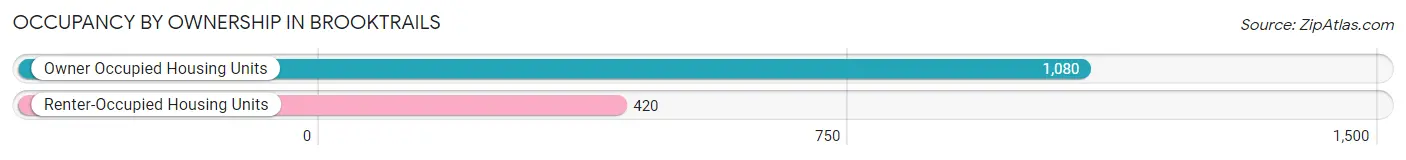
| Occupancy | # Housing Units | % Housing Units |
| Owner Occupied Housing Units | 1,080 | 72.0% |
| Renter-Occupied Housing Units | 420 | 28.0% |
| Total Occupied Housing Units | 1,500 | 100.0% |
Occupancy by Household Size in Brooktrails
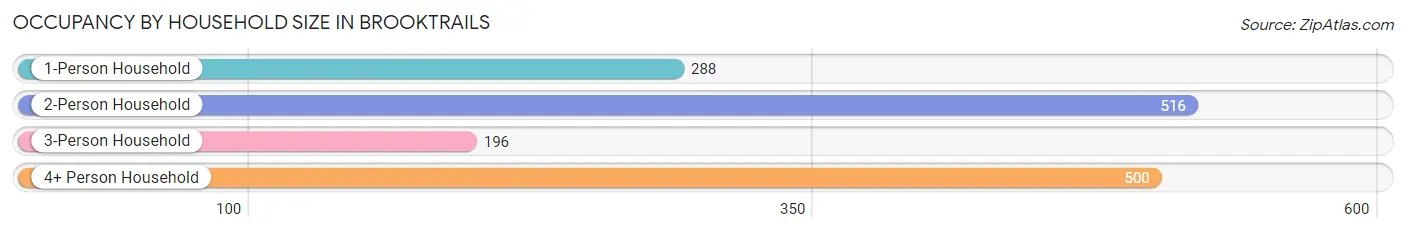
| Household Size | # Housing Units | % Housing Units |
| 1-Person Household | 288 | 19.2% |
| 2-Person Household | 516 | 34.4% |
| 3-Person Household | 196 | 13.1% |
| 4+ Person Household | 500 | 33.3% |
| Total Housing Units | 1,500 | 100.0% |
Occupancy by Ownership by Household Size in Brooktrails
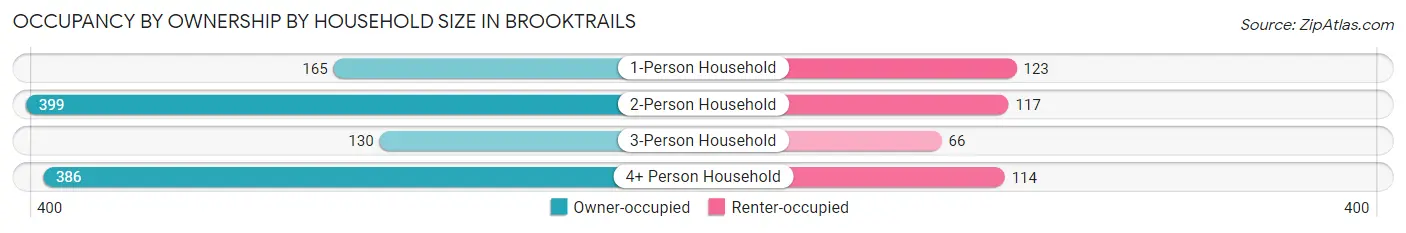
| Household Size | Owner-occupied | Renter-occupied |
| 1-Person Household | 165 (57.3%) | 123 (42.7%) |
| 2-Person Household | 399 (77.3%) | 117 (22.7%) |
| 3-Person Household | 130 (66.3%) | 66 (33.7%) |
| 4+ Person Household | 386 (77.2%) | 114 (22.8%) |
| Total Housing Units | 1,080 (72.0%) | 420 (28.0%) |
Occupancy by Educational Attainment in Brooktrails
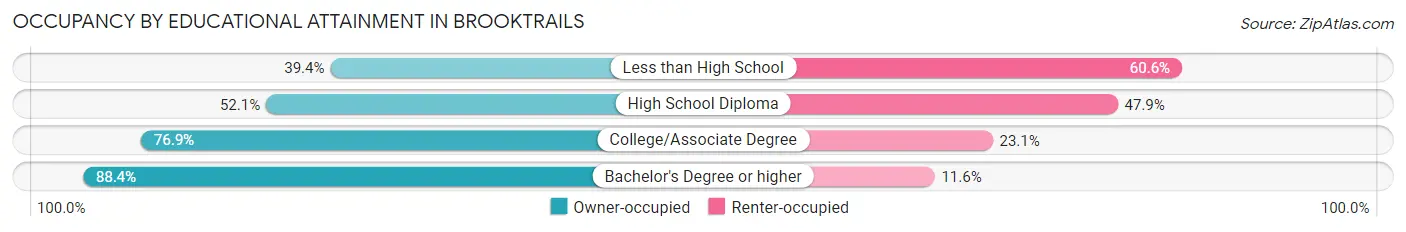
| Household Size | Owner-occupied | Renter-occupied |
| Less than High School | 13 (39.4%) | 20 (60.6%) |
| High School Diploma | 207 (52.1%) | 190 (47.9%) |
| College/Associate Degree | 577 (76.9%) | 173 (23.1%) |
| Bachelor's Degree or higher | 283 (88.4%) | 37 (11.6%) |
Occupancy by Age of Householder in Brooktrails
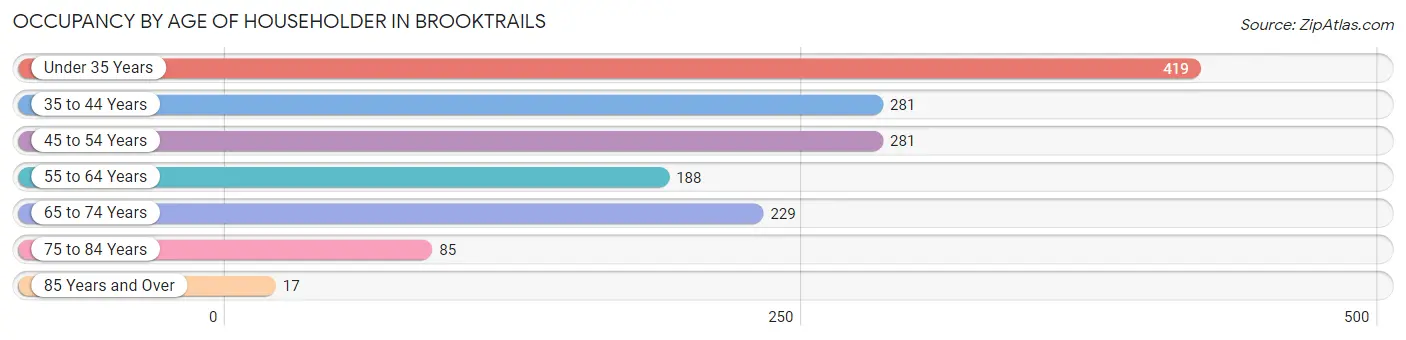
| Age Bracket | # Households | % Households |
| Under 35 Years | 419 | 27.9% |
| 35 to 44 Years | 281 | 18.7% |
| 45 to 54 Years | 281 | 18.7% |
| 55 to 64 Years | 188 | 12.5% |
| 65 to 74 Years | 229 | 15.3% |
| 75 to 84 Years | 85 | 5.7% |
| 85 Years and Over | 17 | 1.1% |
| Total | 1,500 | 100.0% |
Housing Finances in Brooktrails
Median Income by Occupancy in Brooktrails
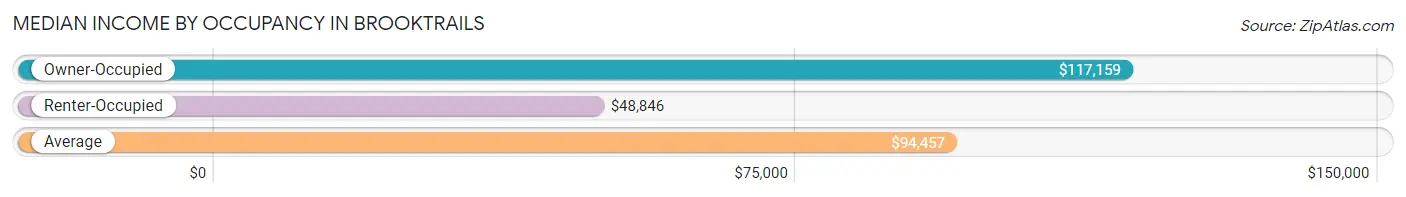
| Occupancy Type | # Households | Median Income |
| Owner-Occupied | 1,080 (72.0%) | $117,159 |
| Renter-Occupied | 420 (28.0%) | $48,846 |
| Average | 1,500 (100.0%) | $94,457 |
Occupancy by Householder Income Bracket in Brooktrails
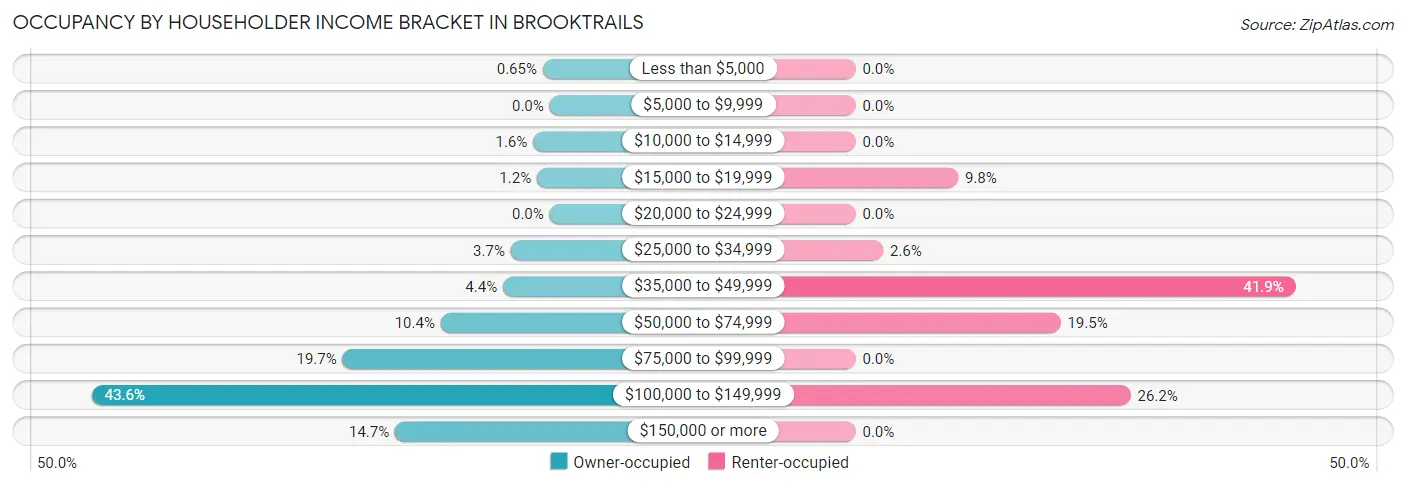
| Income Bracket | Owner-occupied | Renter-occupied |
| Less than $5,000 | 7 (0.6%) | 0 (0.0%) |
| $5,000 to $9,999 | 0 (0.0%) | 0 (0.0%) |
| $10,000 to $14,999 | 17 (1.6%) | 0 (0.0%) |
| $15,000 to $19,999 | 13 (1.2%) | 41 (9.8%) |
| $20,000 to $24,999 | 0 (0.0%) | 0 (0.0%) |
| $25,000 to $34,999 | 40 (3.7%) | 11 (2.6%) |
| $35,000 to $49,999 | 48 (4.4%) | 176 (41.9%) |
| $50,000 to $74,999 | 112 (10.4%) | 82 (19.5%) |
| $75,000 to $99,999 | 213 (19.7%) | 0 (0.0%) |
| $100,000 to $149,999 | 471 (43.6%) | 110 (26.2%) |
| $150,000 or more | 159 (14.7%) | 0 (0.0%) |
| Total | 1,080 (100.0%) | 420 (100.0%) |
Monthly Housing Cost Tiers in Brooktrails
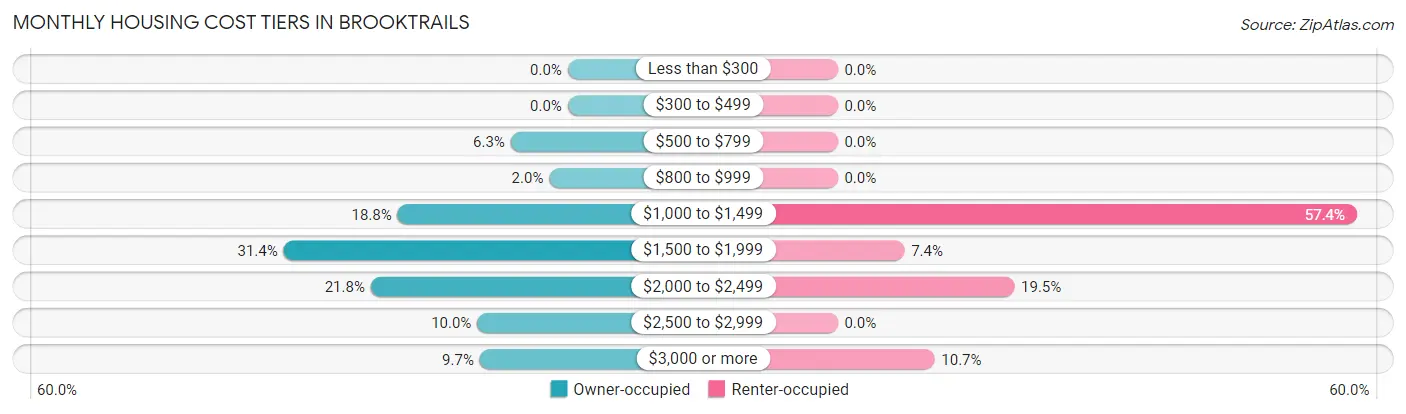
| Monthly Cost | Owner-occupied | Renter-occupied |
| Less than $300 | 0 (0.0%) | 0 (0.0%) |
| $300 to $499 | 0 (0.0%) | 0 (0.0%) |
| $500 to $799 | 68 (6.3%) | 0 (0.0%) |
| $800 to $999 | 22 (2.0%) | 0 (0.0%) |
| $1,000 to $1,499 | 203 (18.8%) | 241 (57.4%) |
| $1,500 to $1,999 | 339 (31.4%) | 31 (7.4%) |
| $2,000 to $2,499 | 235 (21.8%) | 82 (19.5%) |
| $2,500 to $2,999 | 108 (10.0%) | 0 (0.0%) |
| $3,000 or more | 105 (9.7%) | 45 (10.7%) |
| Total | 1,080 (100.0%) | 420 (100.0%) |
Physical Housing Characteristics in Brooktrails
Housing Structures in Brooktrails
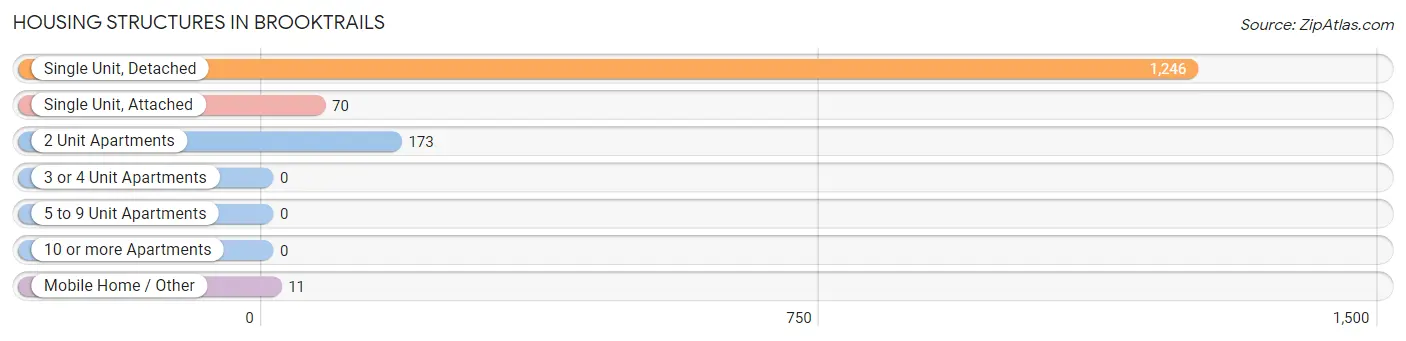
| Structure Type | # Housing Units | % Housing Units |
| Single Unit, Detached | 1,246 | 83.1% |
| Single Unit, Attached | 70 | 4.7% |
| 2 Unit Apartments | 173 | 11.5% |
| 3 or 4 Unit Apartments | 0 | 0.0% |
| 5 to 9 Unit Apartments | 0 | 0.0% |
| 10 or more Apartments | 0 | 0.0% |
| Mobile Home / Other | 11 | 0.7% |
| Total | 1,500 | 100.0% |
Housing Structures by Occupancy in Brooktrails
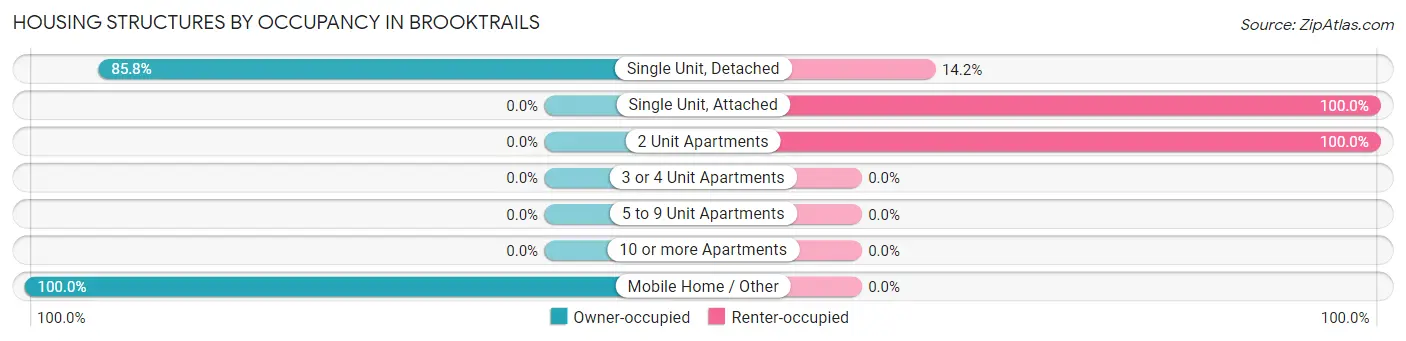
| Structure Type | Owner-occupied | Renter-occupied |
| Single Unit, Detached | 1,069 (85.8%) | 177 (14.2%) |
| Single Unit, Attached | 0 (0.0%) | 70 (100.0%) |
| 2 Unit Apartments | 0 (0.0%) | 173 (100.0%) |
| 3 or 4 Unit Apartments | 0 (0.0%) | 0 (0.0%) |
| 5 to 9 Unit Apartments | 0 (0.0%) | 0 (0.0%) |
| 10 or more Apartments | 0 (0.0%) | 0 (0.0%) |
| Mobile Home / Other | 11 (100.0%) | 0 (0.0%) |
| Total | 1,080 (72.0%) | 420 (28.0%) |
Housing Structures by Number of Rooms in Brooktrails
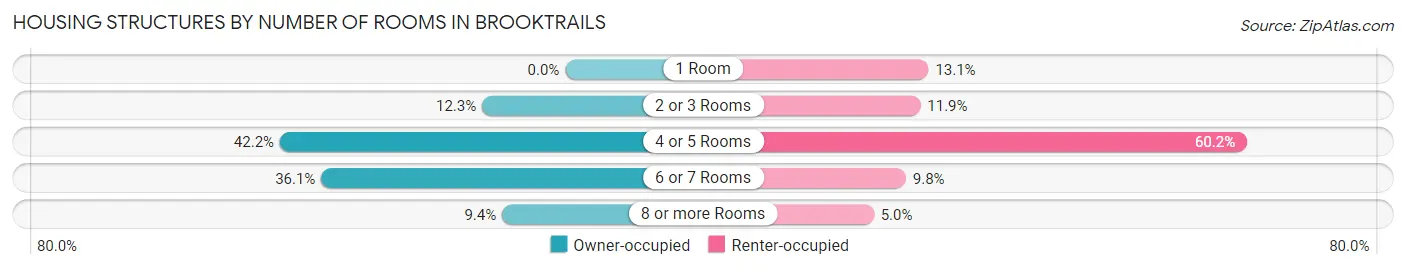
| Number of Rooms | Owner-occupied | Renter-occupied |
| 1 Room | 0 (0.0%) | 55 (13.1%) |
| 2 or 3 Rooms | 133 (12.3%) | 50 (11.9%) |
| 4 or 5 Rooms | 456 (42.2%) | 253 (60.2%) |
| 6 or 7 Rooms | 390 (36.1%) | 41 (9.8%) |
| 8 or more Rooms | 101 (9.3%) | 21 (5.0%) |
| Total | 1,080 (100.0%) | 420 (100.0%) |
Housing Structure by Heating Type in Brooktrails
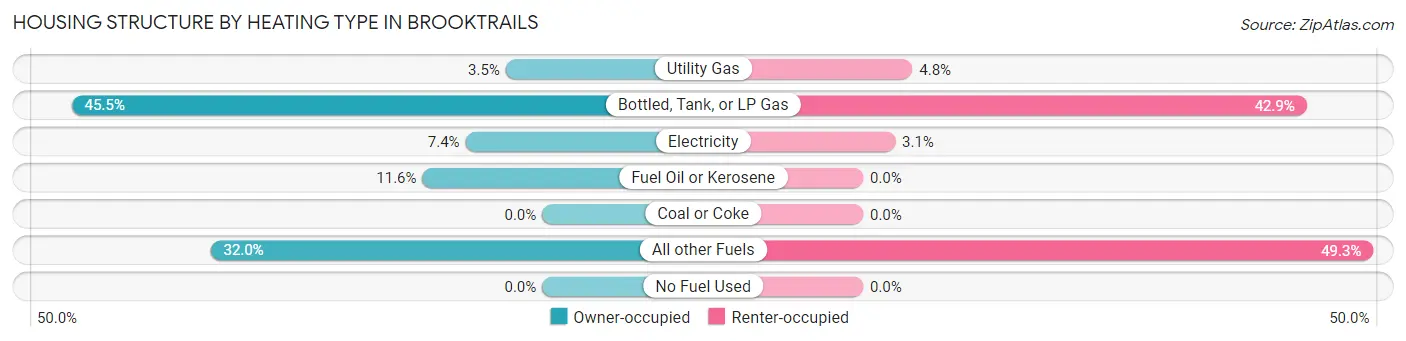
| Heating Type | Owner-occupied | Renter-occupied |
| Utility Gas | 38 (3.5%) | 20 (4.8%) |
| Bottled, Tank, or LP Gas | 491 (45.5%) | 180 (42.9%) |
| Electricity | 80 (7.4%) | 13 (3.1%) |
| Fuel Oil or Kerosene | 125 (11.6%) | 0 (0.0%) |
| Coal or Coke | 0 (0.0%) | 0 (0.0%) |
| All other Fuels | 346 (32.0%) | 207 (49.3%) |
| No Fuel Used | 0 (0.0%) | 0 (0.0%) |
| Total | 1,080 (100.0%) | 420 (100.0%) |
Household Vehicle Usage in Brooktrails
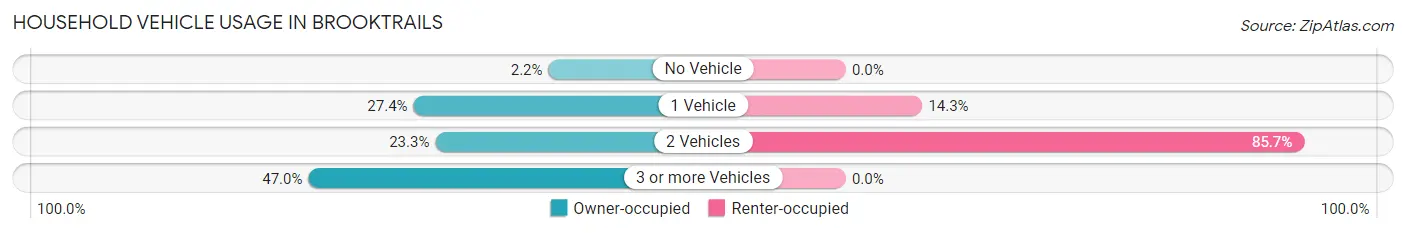
| Vehicles per Household | Owner-occupied | Renter-occupied |
| No Vehicle | 24 (2.2%) | 0 (0.0%) |
| 1 Vehicle | 296 (27.4%) | 60 (14.3%) |
| 2 Vehicles | 252 (23.3%) | 360 (85.7%) |
| 3 or more Vehicles | 508 (47.0%) | 0 (0.0%) |
| Total | 1,080 (100.0%) | 420 (100.0%) |
Real Estate & Mortgages in Brooktrails
Real Estate and Mortgage Overview in Brooktrails
| Characteristic | Without Mortgage | With Mortgage |
| Housing Units | 113 | 967 |
| Median Property Value | $389,700 | $351,100 |
| Median Household Income | $89,957 | $159 |
| Monthly Housing Costs | $946 | $105 |
| Real Estate Taxes | $2,639 | $35 |
Property Value by Mortgage Status in Brooktrails
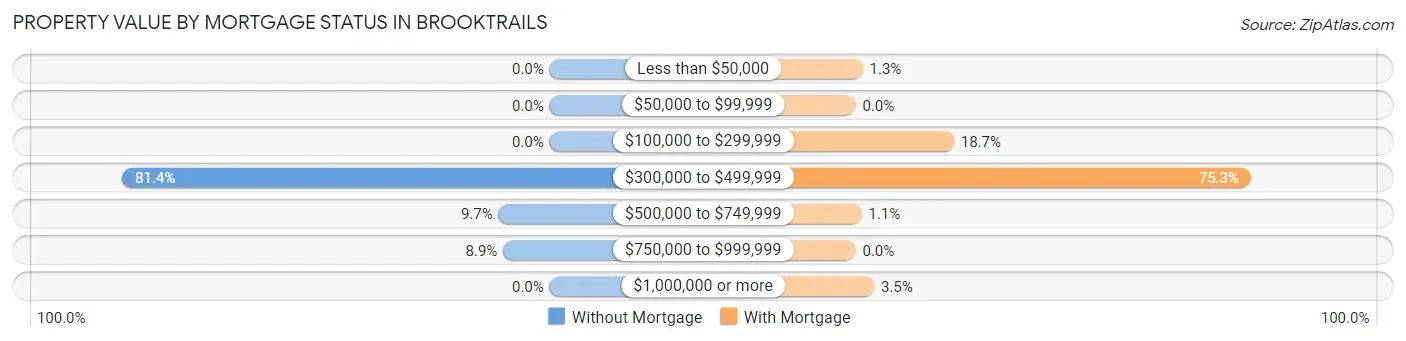
| Property Value | Without Mortgage | With Mortgage |
| Less than $50,000 | 0 (0.0%) | 13 (1.3%) |
| $50,000 to $99,999 | 0 (0.0%) | 0 (0.0%) |
| $100,000 to $299,999 | 0 (0.0%) | 181 (18.7%) |
| $300,000 to $499,999 | 92 (81.4%) | 728 (75.3%) |
| $500,000 to $749,999 | 11 (9.7%) | 11 (1.1%) |
| $750,000 to $999,999 | 10 (8.8%) | 0 (0.0%) |
| $1,000,000 or more | 0 (0.0%) | 34 (3.5%) |
| Total | 113 (100.0%) | 967 (100.0%) |
Household Income by Mortgage Status in Brooktrails
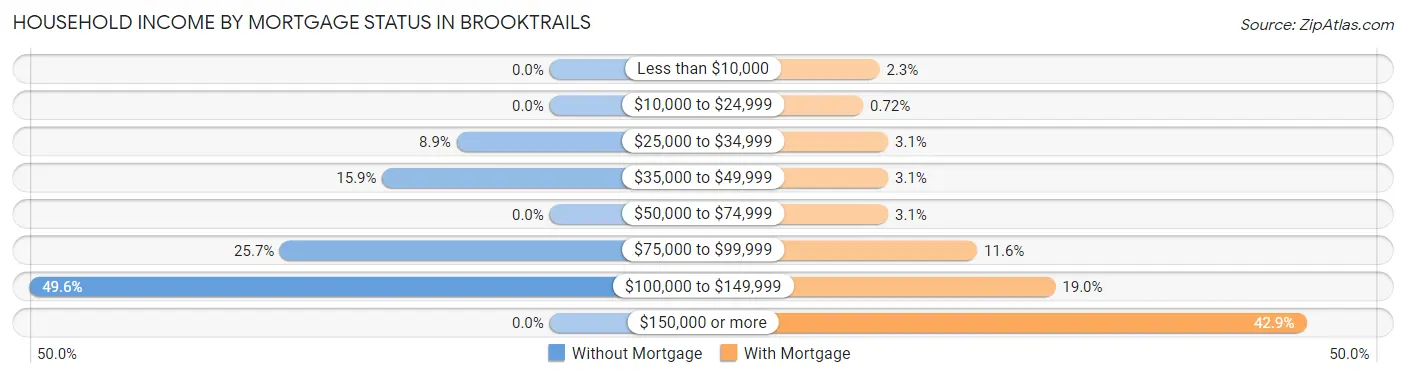
| Household Income | Without Mortgage | With Mortgage |
| Less than $10,000 | 0 (0.0%) | 22 (2.3%) |
| $10,000 to $24,999 | 0 (0.0%) | 7 (0.7%) |
| $25,000 to $34,999 | 10 (8.8%) | 30 (3.1%) |
| $35,000 to $49,999 | 18 (15.9%) | 30 (3.1%) |
| $50,000 to $74,999 | 0 (0.0%) | 30 (3.1%) |
| $75,000 to $99,999 | 29 (25.7%) | 112 (11.6%) |
| $100,000 to $149,999 | 56 (49.6%) | 184 (19.0%) |
| $150,000 or more | 0 (0.0%) | 415 (42.9%) |
| Total | 113 (100.0%) | 967 (100.0%) |
Property Value to Household Income Ratio in Brooktrails
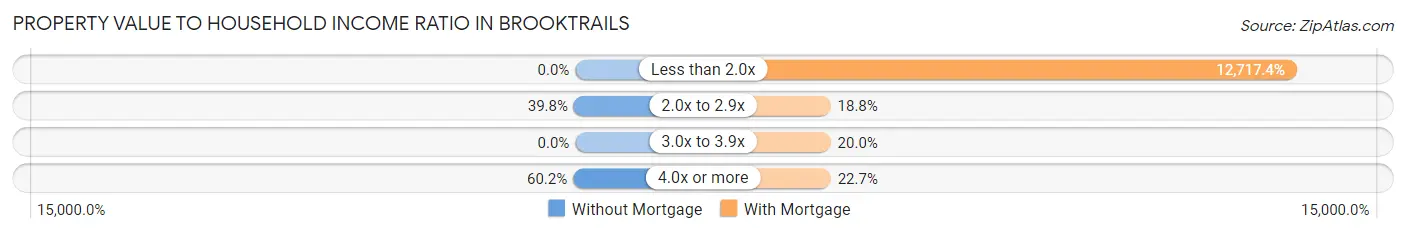
| Value-to-Income Ratio | Without Mortgage | With Mortgage |
| Less than 2.0x | 0 (0.0%) | 122,977 (12,717.4%) |
| 2.0x to 2.9x | 45 (39.8%) | 182 (18.8%) |
| 3.0x to 3.9x | 0 (0.0%) | 193 (20.0%) |
| 4.0x or more | 68 (60.2%) | 219 (22.7%) |
| Total | 113 (100.0%) | 967 (100.0%) |
Real Estate Taxes by Mortgage Status in Brooktrails
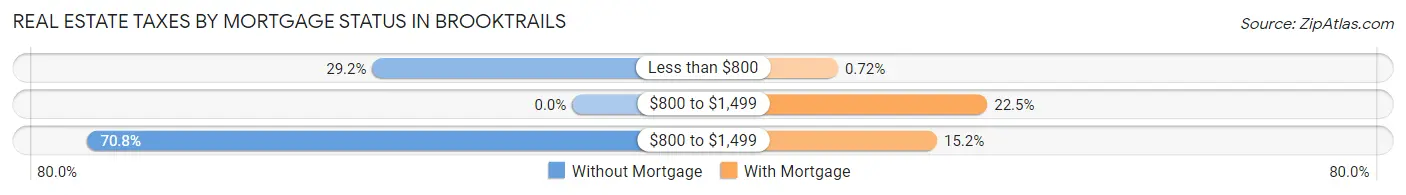
| Property Taxes | Without Mortgage | With Mortgage |
| Less than $800 | 33 (29.2%) | 7 (0.7%) |
| $800 to $1,499 | 0 (0.0%) | 218 (22.5%) |
| $800 to $1,499 | 80 (70.8%) | 147 (15.2%) |
| Total | 113 (100.0%) | 967 (100.0%) |
Health & Disability in Brooktrails
Health Insurance Coverage by Age in Brooktrails
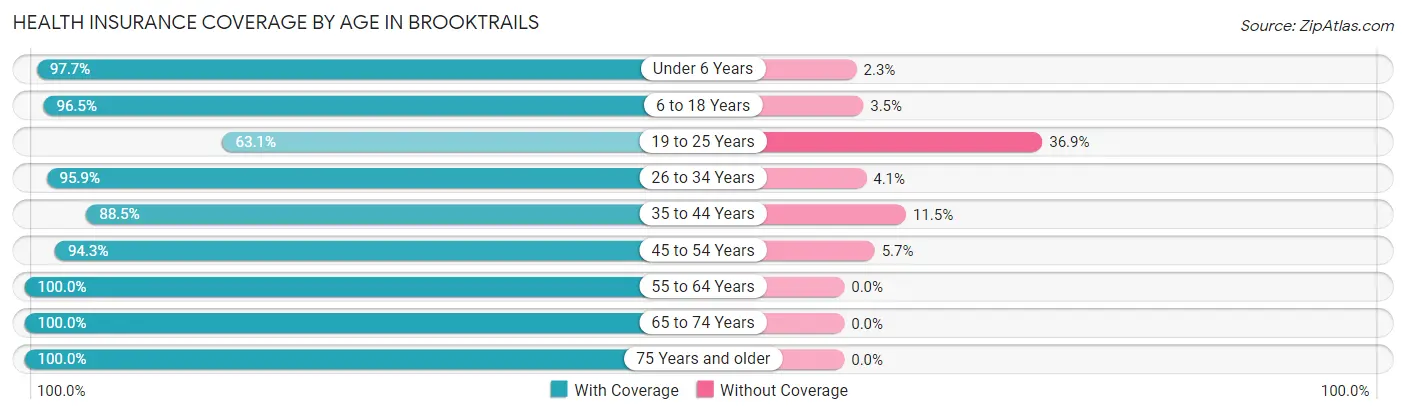
| Age Bracket | With Coverage | Without Coverage |
| Under 6 Years | 598 (97.7%) | 14 (2.3%) |
| 6 to 18 Years | 708 (96.5%) | 26 (3.5%) |
| 19 to 25 Years | 234 (63.1%) | 137 (36.9%) |
| 26 to 34 Years | 538 (95.9%) | 23 (4.1%) |
| 35 to 44 Years | 530 (88.5%) | 69 (11.5%) |
| 45 to 54 Years | 666 (94.3%) | 40 (5.7%) |
| 55 to 64 Years | 350 (100.0%) | 0 (0.0%) |
| 65 to 74 Years | 320 (100.0%) | 0 (0.0%) |
| 75 Years and older | 187 (100.0%) | 0 (0.0%) |
| Total | 4,131 (93.0%) | 309 (7.0%) |
Health Insurance Coverage by Citizenship Status in Brooktrails
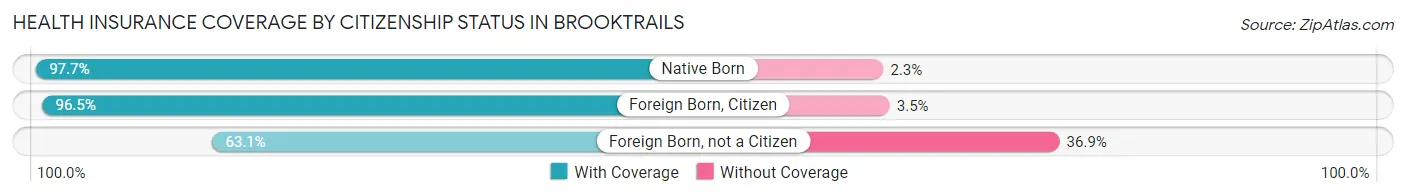
| Citizenship Status | With Coverage | Without Coverage |
| Native Born | 598 (97.7%) | 14 (2.3%) |
| Foreign Born, Citizen | 708 (96.5%) | 26 (3.5%) |
| Foreign Born, not a Citizen | 234 (63.1%) | 137 (36.9%) |
Health Insurance Coverage by Household Income in Brooktrails
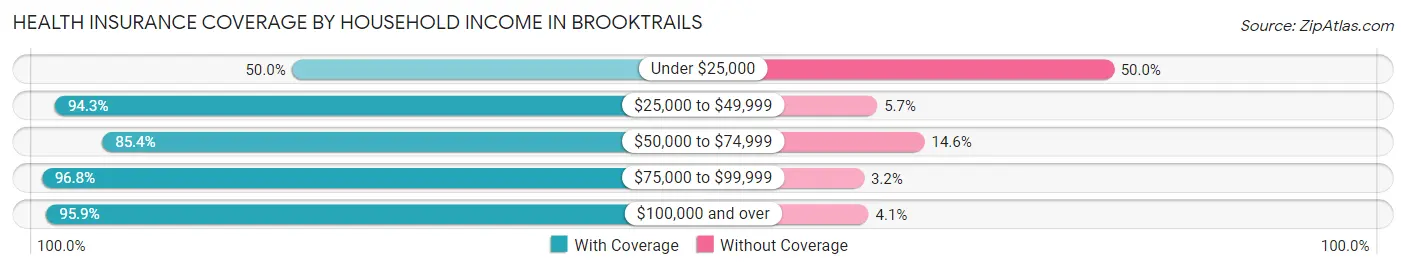
| Household Income | With Coverage | Without Coverage |
| Under $25,000 | 90 (50.0%) | 90 (50.0%) |
| $25,000 to $49,999 | 513 (94.3%) | 31 (5.7%) |
| $50,000 to $74,999 | 346 (85.4%) | 59 (14.6%) |
| $75,000 to $99,999 | 691 (96.8%) | 23 (3.2%) |
| $100,000 and over | 2,491 (95.9%) | 106 (4.1%) |
Public vs Private Health Insurance Coverage by Age in Brooktrails
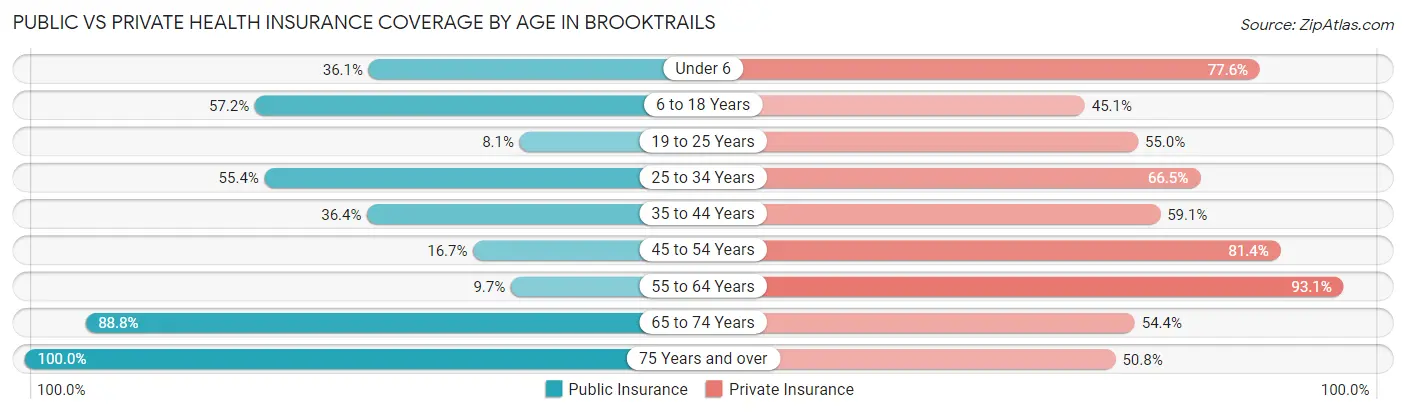
| Age Bracket | Public Insurance | Private Insurance |
| Under 6 | 221 (36.1%) | 475 (77.6%) |
| 6 to 18 Years | 420 (57.2%) | 331 (45.1%) |
| 19 to 25 Years | 30 (8.1%) | 204 (55.0%) |
| 25 to 34 Years | 311 (55.4%) | 373 (66.5%) |
| 35 to 44 Years | 218 (36.4%) | 354 (59.1%) |
| 45 to 54 Years | 118 (16.7%) | 575 (81.4%) |
| 55 to 64 Years | 34 (9.7%) | 326 (93.1%) |
| 65 to 74 Years | 284 (88.7%) | 174 (54.4%) |
| 75 Years and over | 187 (100.0%) | 95 (50.8%) |
| Total | 1,823 (41.1%) | 2,907 (65.5%) |
Disability Status by Sex by Age in Brooktrails
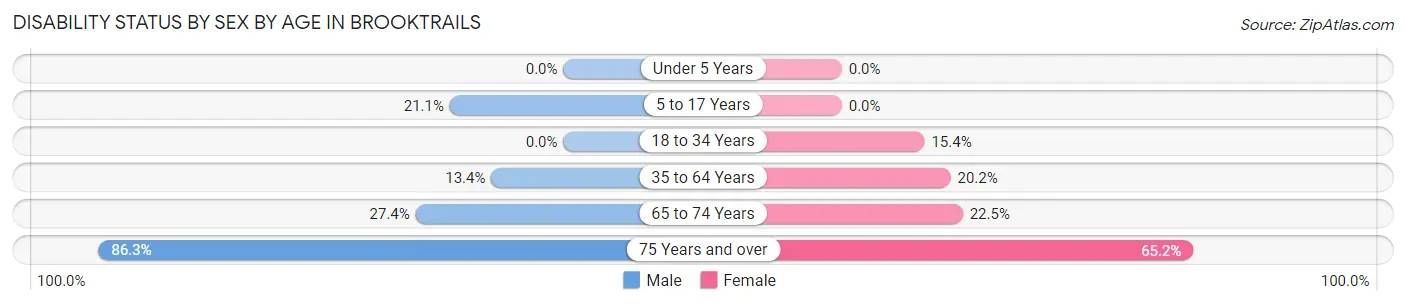
| Age Bracket | Male | Female |
| Under 5 Years | 0 (0.0%) | 0 (0.0%) |
| 5 to 17 Years | 105 (21.1%) | 0 (0.0%) |
| 18 to 34 Years | 0 (0.0%) | 74 (15.3%) |
| 35 to 64 Years | 116 (13.4%) | 159 (20.2%) |
| 65 to 74 Years | 34 (27.4%) | 44 (22.5%) |
| 75 Years and over | 82 (86.3%) | 60 (65.2%) |
Disability Class by Sex by Age in Brooktrails
Disability Class: Hearing Difficulty
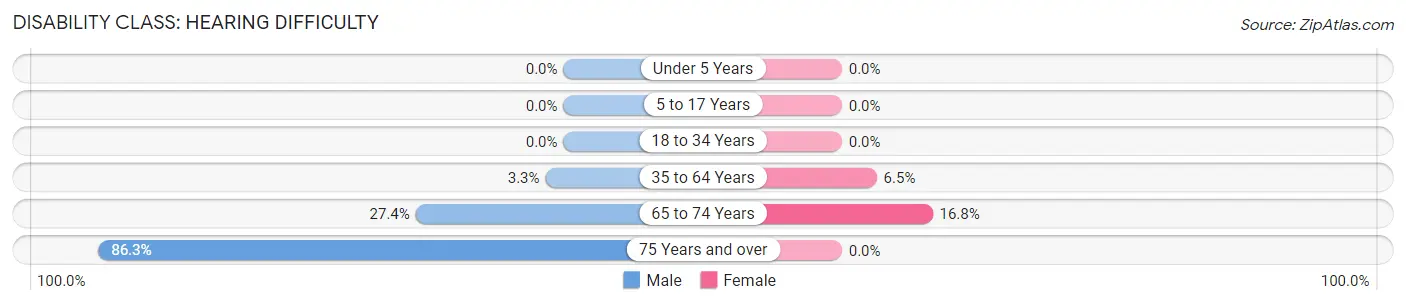
| Age Bracket | Male | Female |
| Under 5 Years | 0 (0.0%) | 0 (0.0%) |
| 5 to 17 Years | 0 (0.0%) | 0 (0.0%) |
| 18 to 34 Years | 0 (0.0%) | 0 (0.0%) |
| 35 to 64 Years | 29 (3.3%) | 51 (6.5%) |
| 65 to 74 Years | 34 (27.4%) | 33 (16.8%) |
| 75 Years and over | 82 (86.3%) | 0 (0.0%) |
Disability Class: Vision Difficulty
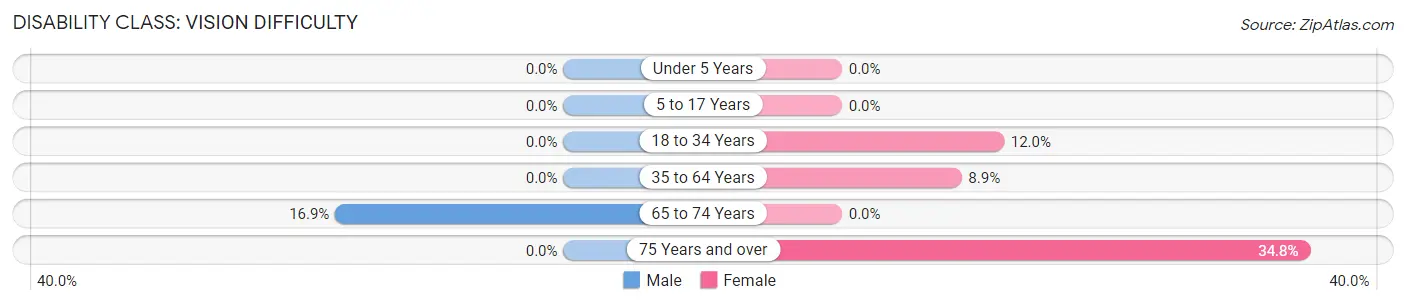
| Age Bracket | Male | Female |
| Under 5 Years | 0 (0.0%) | 0 (0.0%) |
| 5 to 17 Years | 0 (0.0%) | 0 (0.0%) |
| 18 to 34 Years | 0 (0.0%) | 58 (12.0%) |
| 35 to 64 Years | 0 (0.0%) | 70 (8.9%) |
| 65 to 74 Years | 21 (16.9%) | 0 (0.0%) |
| 75 Years and over | 0 (0.0%) | 32 (34.8%) |
Disability Class: Cognitive Difficulty
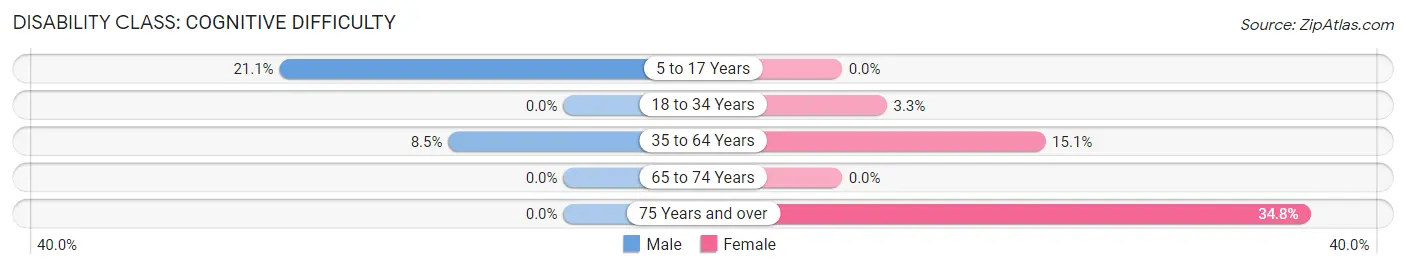
| Age Bracket | Male | Female |
| 5 to 17 Years | 105 (21.1%) | 0 (0.0%) |
| 18 to 34 Years | 0 (0.0%) | 16 (3.3%) |
| 35 to 64 Years | 74 (8.5%) | 119 (15.1%) |
| 65 to 74 Years | 0 (0.0%) | 0 (0.0%) |
| 75 Years and over | 0 (0.0%) | 32 (34.8%) |
Disability Class: Ambulatory Difficulty
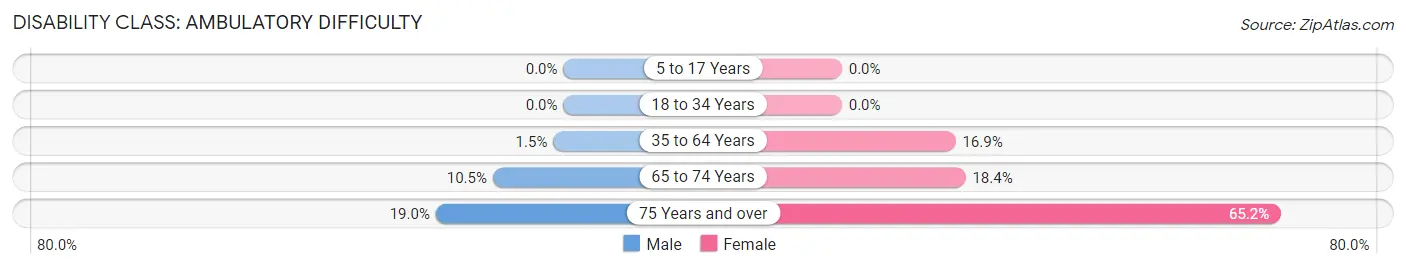
| Age Bracket | Male | Female |
| 5 to 17 Years | 0 (0.0%) | 0 (0.0%) |
| 18 to 34 Years | 0 (0.0%) | 0 (0.0%) |
| 35 to 64 Years | 13 (1.5%) | 133 (16.9%) |
| 65 to 74 Years | 13 (10.5%) | 36 (18.4%) |
| 75 Years and over | 18 (19.0%) | 60 (65.2%) |
Disability Class: Self-Care Difficulty
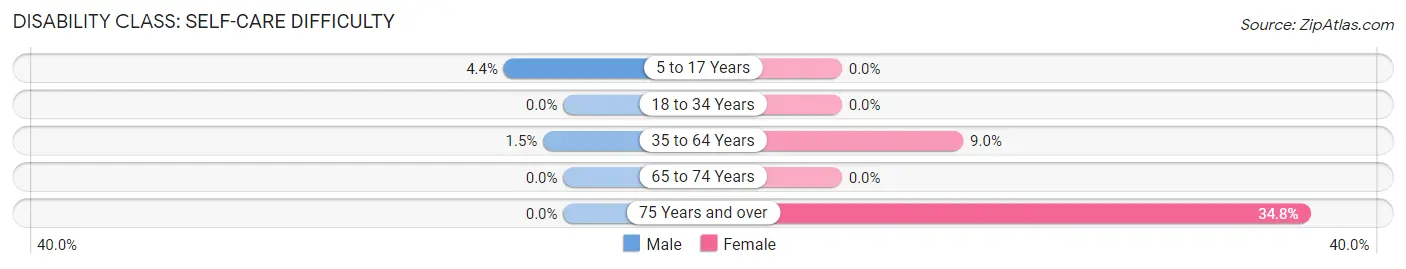
| Age Bracket | Male | Female |
| 5 to 17 Years | 22 (4.4%) | 0 (0.0%) |
| 18 to 34 Years | 0 (0.0%) | 0 (0.0%) |
| 35 to 64 Years | 13 (1.5%) | 71 (9.0%) |
| 65 to 74 Years | 0 (0.0%) | 0 (0.0%) |
| 75 Years and over | 0 (0.0%) | 32 (34.8%) |
Technology Access in Brooktrails
Computing Device Access in Brooktrails
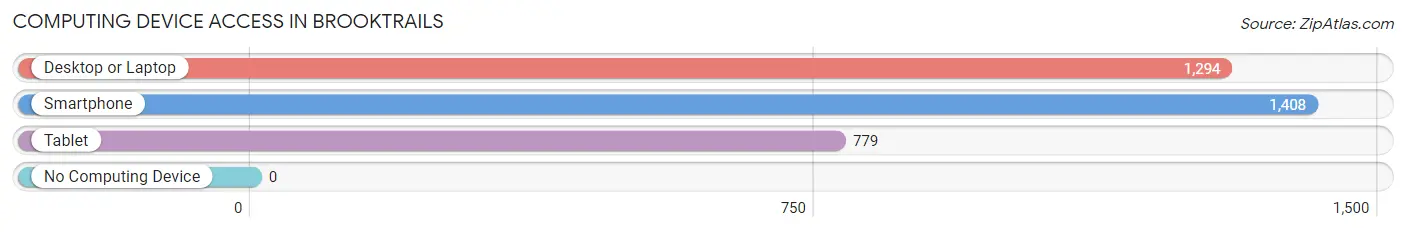
| Device Type | # Households | % Households |
| Desktop or Laptop | 1,294 | 86.3% |
| Smartphone | 1,408 | 93.9% |
| Tablet | 779 | 51.9% |
| No Computing Device | 0 | 0.0% |
| Total | 1,500 | 100.0% |
Internet Access in Brooktrails
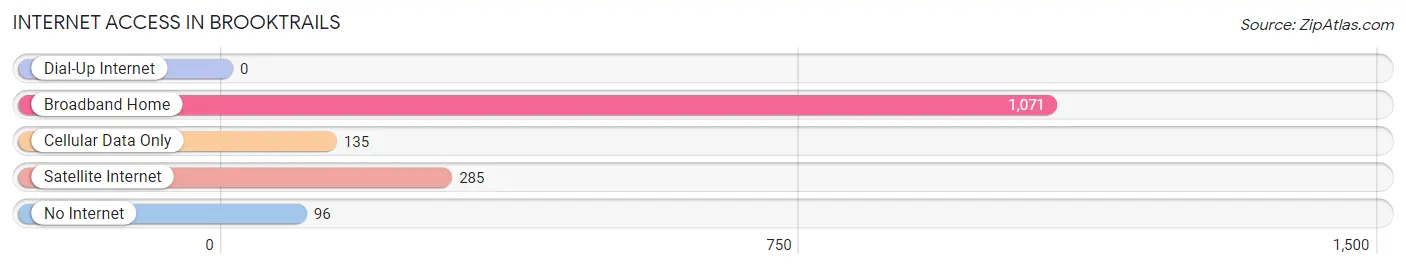
| Internet Type | # Households | % Households |
| Dial-Up Internet | 0 | 0.0% |
| Broadband Home | 1,071 | 71.4% |
| Cellular Data Only | 135 | 9.0% |
| Satellite Internet | 285 | 19.0% |
| No Internet | 96 | 6.4% |
| Total | 1,500 | 100.0% |
Brooktrails Summary
History
The area now known as Brooktrails, California was originally inhabited by the Pomo Native Americans. The first European settlers arrived in the area in the late 1800s, and the first post office was established in 1891. The area was originally known as “Brooktrail”, but the name was changed to “Brooktrails” in the early 1900s.
The area was primarily used for logging and ranching until the 1950s, when the first residential development began. The first homes were built in the area in the late 1950s, and the first golf course was built in the early 1960s. The area was officially incorporated as a town in 1964.
In the 1970s, the area began to experience rapid growth, as more people moved to the area to take advantage of the mild climate and scenic beauty. The population of Brooktrails grew from just over 1,000 in 1970 to over 5,000 in 1980.
Geography
Brooktrails is located in Mendocino County, California, about 10 miles north of Willits. The town is situated in a valley surrounded by hills and mountains, and is located at an elevation of 1,400 feet. The area is known for its mild climate, with temperatures rarely dropping below freezing in the winter and rarely exceeding 90 degrees in the summer.
The town is located in the redwood forest, and is home to several parks and trails. The most popular park is the Brooktrails Community Park, which features a playground, picnic areas, and a lake.
Economy
The economy of Brooktrails is primarily based on tourism and agriculture. The town is home to several wineries, and is a popular destination for wine tasting. The area is also home to several farms, which produce a variety of fruits and vegetables.
The town is also home to several businesses, including restaurants, retail stores, and professional services. The town is also home to a small airport, which serves as a hub for private and charter flights.
Demographics
As of the 2010 census, the population of Brooktrails was 5,845. The racial makeup of the town was 87.3% White, 0.7% African American, 0.7% Native American, 0.7% Asian, 0.2% Pacific Islander, 8.2% from other races, and 2.2% from two or more races. Hispanic or Latino of any race were 16.2% of the population.
The median household income in Brooktrails was $45,938, and the median family income was $51,938. The per capita income for the town was $22,938. About 11.2% of families and 14.2% of the population were below the poverty line, including 18.2% of those under age 18 and 8.2% of those age 65 or over.
Common Questions
What is Per Capita Income in Brooktrails?
Per Capita income in Brooktrails is $34,091.
What is the Median Family Income in Brooktrails?
Median Family Income in Brooktrails is $116,580.
What is the Median Household income in Brooktrails?
Median Household Income in Brooktrails is $94,457.
What is Income or Wage Gap in Brooktrails?
Income or Wage Gap in Brooktrails is 18.5%.
Women in Brooktrails earn 81.5 cents for every dollar earned by a man.
What is Inequality or Gini Index in Brooktrails?
Inequality or Gini Index in Brooktrails is 0.27.
What is the Total Population of Brooktrails?
Total Population of Brooktrails is 4,440.
What is the Total Male Population of Brooktrails?
Total Male Population of Brooktrails is 2,266.
What is the Total Female Population of Brooktrails?
Total Female Population of Brooktrails is 2,174.
What is the Ratio of Males per 100 Females in Brooktrails?
There are 104.23 Males per 100 Females in Brooktrails.
What is the Ratio of Females per 100 Males in Brooktrails?
There are 95.94 Females per 100 Males in Brooktrails.
What is the Median Population Age in Brooktrails?
Median Population Age in Brooktrails is 33.3 Years.
What is the Average Family Size in Brooktrails
Average Family Size in Brooktrails is 3.4 People.
What is the Average Household Size in Brooktrails
Average Household Size in Brooktrails is 3.0 People.
How Large is the Labor Force in Brooktrails?
There are 2,239 People in the Labor Forcein in Brooktrails.
What is the Percentage of People in the Labor Force in Brooktrails?
70.9% of People are in the Labor Force in Brooktrails.
What is the Unemployment Rate in Brooktrails?
Unemployment Rate in Brooktrails is 3.8%.