Cities with the Highest Percentage of Local Government Employees in Tennessee
RELATED REPORTS & OPTIONS
Local Government Employees
Tennessee
Compare Cities
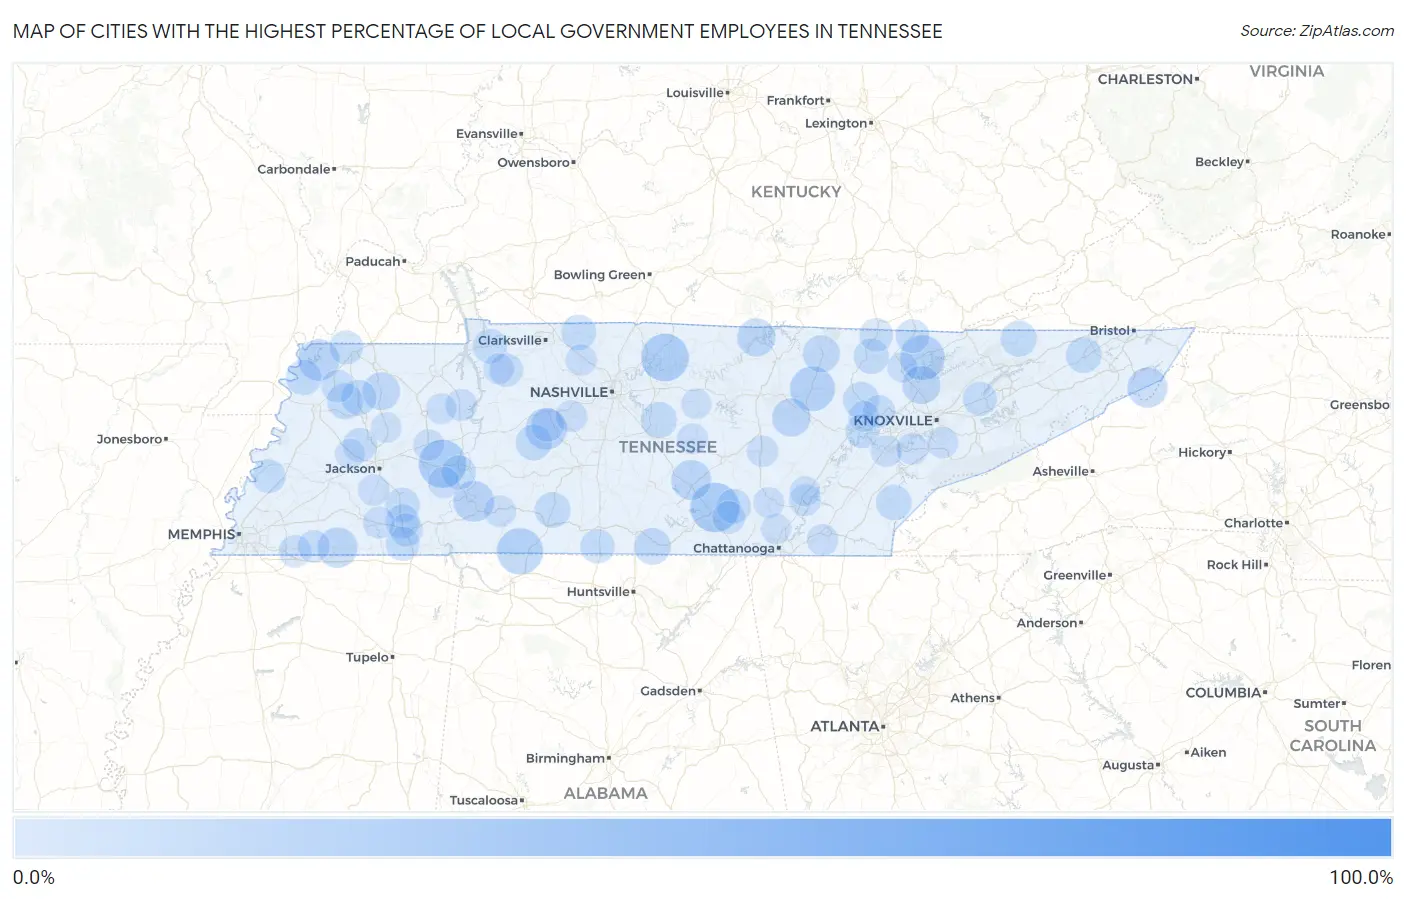
Map of Cities with the Highest Percentage of Local Government Employees in Tennessee
0.0%
100.0%
Cities with the Highest Percentage of Local Government Employees in Tennessee
| City | % Local Government Employees | vs State | vs National | |
| 1. | Pocahontas | 100.0% | 7.1%(+92.9)#1 | 7.2%(+92.8)#6 |
| 2. | Mercer | 100.0% | 7.1%(+92.9)#2 | 7.2%(+92.8)#32 |
| 3. | Luray | 67.2% | 7.1%(+60.1)#3 | 7.2%(+59.9)#129 |
| 4. | Palmersville | 50.0% | 7.1%(+42.9)#4 | 7.2%(+42.8)#275 |
| 5. | Tuckers Crossroads | 50.0% | 7.1%(+42.9)#5 | 7.2%(+42.8)#287 |
| 6. | Morris Chapel | 46.3% | 7.1%(+39.3)#6 | 7.2%(+39.1)#354 |
| 7. | Briceville | 42.7% | 7.1%(+35.7)#7 | 7.2%(+35.5)#420 |
| 8. | Belvidere | 37.5% | 7.1%(+30.4)#8 | 7.2%(+30.3)#549 |
| 9. | Pelham | 32.1% | 7.1%(+25.1)#9 | 7.2%(+24.9)#780 |
| 10. | Chesterfield | 30.5% | 7.1%(+23.4)#10 | 7.2%(+23.2)#883 |
| 11. | Castalian Springs | 30.3% | 7.1%(+23.3)#11 | 7.2%(+23.1)#889 |
| 12. | Essary Springs | 30.0% | 7.1%(+22.9)#12 | 7.2%(+22.8)#903 |
| 13. | Yuma | 29.5% | 7.1%(+22.5)#13 | 7.2%(+22.3)#929 |
| 14. | Leoma | 29.1% | 7.1%(+22.0)#14 | 7.2%(+21.9)#952 |
| 15. | Iron City | 28.8% | 7.1%(+21.7)#15 | 7.2%(+21.6)#969 |
| 16. | Clarkrange | 27.3% | 7.1%(+20.3)#16 | 7.2%(+20.1)#1,071 |
| 17. | Fincastle | 27.2% | 7.1%(+20.1)#17 | 7.2%(+20.0)#1,087 |
| 18. | Randolph | 25.0% | 7.1%(+17.9)#18 | 7.2%(+17.8)#1,283 |
| 19. | Wildersville | 24.6% | 7.1%(+17.6)#19 | 7.2%(+17.4)#1,347 |
| 20. | Wrigley | 23.9% | 7.1%(+16.8)#20 | 7.2%(+16.7)#1,417 |
| 21. | Samburg | 23.8% | 7.1%(+16.8)#21 | 7.2%(+16.6)#1,426 |
| 22. | Clifton | 23.2% | 7.1%(+16.1)#22 | 7.2%(+15.9)#1,499 |
| 23. | Grand Junction | 22.4% | 7.1%(+15.3)#23 | 7.2%(+15.2)#1,615 |
| 24. | New Union | 22.2% | 7.1%(+15.2)#24 | 7.2%(+15.0)#1,641 |
| 25. | Roan Mountain | 22.2% | 7.1%(+15.2)#25 | 7.2%(+15.0)#1,644 |
| 26. | Norene | 21.6% | 7.1%(+14.6)#26 | 7.2%(+14.4)#1,748 |
| 27. | Pleasant Hill | 20.5% | 7.1%(+13.5)#27 | 7.2%(+13.3)#1,952 |
| 28. | Norris | 20.2% | 7.1%(+13.2)#28 | 7.2%(+13.0)#2,006 |
| 29. | Celina | 20.1% | 7.1%(+13.0)#29 | 7.2%(+12.8)#2,029 |
| 30. | Greenfield | 19.8% | 7.1%(+12.7)#30 | 7.2%(+12.6)#2,098 |
| 31. | Jamestown | 19.2% | 7.1%(+12.2)#31 | 7.2%(+12.0)#2,212 |
| 32. | Flintville | 18.8% | 7.1%(+11.7)#32 | 7.2%(+11.5)#2,362 |
| 33. | Walterhill | 18.4% | 7.1%(+11.4)#33 | 7.2%(+11.2)#2,442 |
| 34. | Wartburg | 18.4% | 7.1%(+11.4)#34 | 7.2%(+11.2)#2,452 |
| 35. | Oak Grove Cdp Sumner County | 18.3% | 7.1%(+11.3)#35 | 7.2%(+11.1)#2,487 |
| 36. | Centerville | 18.1% | 7.1%(+11.0)#36 | 7.2%(+10.8)#2,554 |
| 37. | Sneedville | 17.9% | 7.1%(+10.8)#37 | 7.2%(+10.7)#2,601 |
| 38. | Walnut Grove Cdp Sumner County | 17.8% | 7.1%(+10.8)#38 | 7.2%(+10.6)#2,622 |
| 39. | Yorkville | 17.8% | 7.1%(+10.7)#39 | 7.2%(+10.6)#2,628 |
| 40. | Ethridge | 17.7% | 7.1%(+10.7)#40 | 7.2%(+10.5)#2,641 |
| 41. | Fall Branch | 17.7% | 7.1%(+10.7)#41 | 7.2%(+10.5)#2,647 |
| 42. | Ridgely | 17.5% | 7.1%(+10.4)#42 | 7.2%(+10.2)#2,731 |
| 43. | Tellico Plains | 17.4% | 7.1%(+10.3)#43 | 7.2%(+10.2)#2,770 |
| 44. | Rutherford | 17.3% | 7.1%(+10.3)#44 | 7.2%(+10.1)#2,777 |
| 45. | Huntsville | 17.2% | 7.1%(+10.1)#45 | 7.2%(+9.94)#2,833 |
| 46. | Adams | 17.2% | 7.1%(+10.1)#46 | 7.2%(+9.94)#2,835 |
| 47. | Finger | 16.8% | 7.1%(+9.72)#47 | 7.2%(+9.55)#2,962 |
| 48. | Coalmont | 16.6% | 7.1%(+9.50)#48 | 7.2%(+9.33)#3,086 |
| 49. | Dover | 16.4% | 7.1%(+9.38)#49 | 7.2%(+9.21)#3,141 |
| 50. | Chewalla | 16.3% | 7.1%(+9.27)#50 | 7.2%(+9.10)#3,185 |
| 51. | Decaturville | 16.2% | 7.1%(+9.14)#51 | 7.2%(+8.96)#3,240 |
| 52. | Elkton | 16.2% | 7.1%(+9.11)#52 | 7.2%(+8.93)#3,260 |
| 53. | Gadsden | 16.1% | 7.1%(+9.03)#53 | 7.2%(+8.86)#3,296 |
| 54. | Bethel Springs | 16.0% | 7.1%(+8.96)#54 | 7.2%(+8.78)#3,331 |
| 55. | Ramer | 15.9% | 7.1%(+8.86)#55 | 7.2%(+8.68)#3,366 |
| 56. | Midtown | 15.8% | 7.1%(+8.79)#56 | 7.2%(+8.62)#3,407 |
| 57. | New Market | 15.8% | 7.1%(+8.79)#57 | 7.2%(+8.62)#3,408 |
| 58. | Woodland Mills | 15.8% | 7.1%(+8.77)#58 | 7.2%(+8.60)#3,416 |
| 59. | Jellico | 15.7% | 7.1%(+8.65)#59 | 7.2%(+8.48)#3,489 |
| 60. | Burlison | 15.7% | 7.1%(+8.65)#60 | 7.2%(+8.47)#3,491 |
| 61. | Hampton | 15.6% | 7.1%(+8.59)#61 | 7.2%(+8.42)#3,528 |
| 62. | Winfield | 15.5% | 7.1%(+8.43)#62 | 7.2%(+8.26)#3,603 |
| 63. | Erin | 15.3% | 7.1%(+8.28)#63 | 7.2%(+8.11)#3,683 |
| 64. | Selmer | 15.3% | 7.1%(+8.25)#64 | 7.2%(+8.08)#3,698 |
| 65. | Lyles | 15.2% | 7.1%(+8.16)#65 | 7.2%(+7.99)#3,746 |
| 66. | Pinson | 14.7% | 7.1%(+7.69)#66 | 7.2%(+7.52)#4,034 |
| 67. | Tracy City | 14.6% | 7.1%(+7.53)#67 | 7.2%(+7.36)#4,141 |
| 68. | Coalfield | 14.5% | 7.1%(+7.48)#68 | 7.2%(+7.30)#4,177 |
| 69. | Trimble | 14.5% | 7.1%(+7.44)#69 | 7.2%(+7.27)#4,204 |
| 70. | Rossville | 14.3% | 7.1%(+7.23)#70 | 7.2%(+7.06)#4,320 |
| 71. | Moscow | 14.2% | 7.1%(+7.11)#71 | 7.2%(+6.94)#4,457 |
| 72. | Sale Creek | 14.0% | 7.1%(+6.94)#72 | 7.2%(+6.76)#4,586 |
| 73. | Waynesboro | 14.0% | 7.1%(+6.92)#73 | 7.2%(+6.75)#4,593 |
| 74. | Hornsby | 13.9% | 7.1%(+6.88)#74 | 7.2%(+6.71)#4,628 |
| 75. | Camden | 13.9% | 7.1%(+6.86)#75 | 7.2%(+6.69)#4,643 |
| 76. | Fairview | 13.9% | 7.1%(+6.85)#76 | 7.2%(+6.68)#4,651 |
| 77. | Friendsville | 13.7% | 7.1%(+6.66)#77 | 7.2%(+6.48)#4,785 |
| 78. | Medon | 13.4% | 7.1%(+6.35)#78 | 7.2%(+6.17)#5,025 |
| 79. | South Cleveland | 13.4% | 7.1%(+6.32)#79 | 7.2%(+6.15)#5,039 |
| 80. | Wildwood | 13.3% | 7.1%(+6.29)#80 | 7.2%(+6.12)#5,064 |
| 81. | Scotts Hill | 13.3% | 7.1%(+6.23)#81 | 7.2%(+6.05)#5,122 |
| 82. | Spencer | 13.2% | 7.1%(+6.19)#82 | 7.2%(+6.01)#5,149 |
| 83. | Loudon | 13.1% | 7.1%(+6.04)#83 | 7.2%(+5.87)#5,261 |
| 84. | Pleasant View | 13.0% | 7.1%(+5.94)#84 | 7.2%(+5.77)#5,347 |
| 85. | Parker S Crossroads | 13.0% | 7.1%(+5.92)#85 | 7.2%(+5.75)#5,364 |
| 86. | Oakdale | 12.8% | 7.1%(+5.74)#86 | 7.2%(+5.56)#5,529 |
| 87. | Finley | 12.8% | 7.1%(+5.72)#87 | 7.2%(+5.54)#5,544 |
| 88. | Dunlap | 12.8% | 7.1%(+5.72)#88 | 7.2%(+5.54)#5,545 |
| 89. | Woodbury | 12.7% | 7.1%(+5.69)#89 | 7.2%(+5.51)#5,571 |
| 90. | Tennessee Ridge | 12.7% | 7.1%(+5.67)#90 | 7.2%(+5.49)#5,590 |
| 91. | Hollow Rock | 12.6% | 7.1%(+5.57)#91 | 7.2%(+5.39)#5,668 |
| 92. | Milan | 12.5% | 7.1%(+5.41)#92 | 7.2%(+5.24)#5,825 |
| 93. | Cosby | 12.3% | 7.1%(+5.24)#93 | 7.2%(+5.07)#5,966 |
| 94. | Fairmount | 12.3% | 7.1%(+5.23)#94 | 7.2%(+5.06)#5,986 |
| 95. | Biltmore | 12.3% | 7.1%(+5.22)#95 | 7.2%(+5.04)#6,014 |
| 96. | Alexandria | 12.2% | 7.1%(+5.15)#96 | 7.2%(+4.98)#6,077 |
| 97. | Graysville | 12.0% | 7.1%(+4.97)#97 | 7.2%(+4.80)#6,284 |
| 98. | Caryville | 12.0% | 7.1%(+4.95)#98 | 7.2%(+4.78)#6,303 |
| 99. | Blanche | 11.9% | 7.1%(+4.87)#99 | 7.2%(+4.70)#6,380 |
| 100. | Bells | 11.9% | 7.1%(+4.87)#100 | 7.2%(+4.69)#6,386 |
Common Questions
What are the Top 10 Cities with the Highest Percentage of Local Government Employees in Tennessee?
Top 10 Cities with the Highest Percentage of Local Government Employees in Tennessee are:
#1
32.1%
#2
30.5%
#3
30.3%
#4
28.8%
#5
27.3%
#6
27.2%
#7
23.9%
#8
23.8%
#9
23.2%
#10
22.4%
What city has the Highest Percentage of Local Government Employees in Tennessee?
Pelham has the Highest Percentage of Local Government Employees in Tennessee with 32.1%.
What is the Percentage of Local Government Employees in the State of Tennessee?
Percentage of Local Government Employees in Tennessee is 7.1%.
What is the Percentage of Local Government Employees in the United States?
Percentage of Local Government Employees in the United States is 7.2%.