Cities with the Highest Percentage of Local Government Employees in South Carolina
RELATED REPORTS & OPTIONS
Local Government Employees
South Carolina
Compare Cities
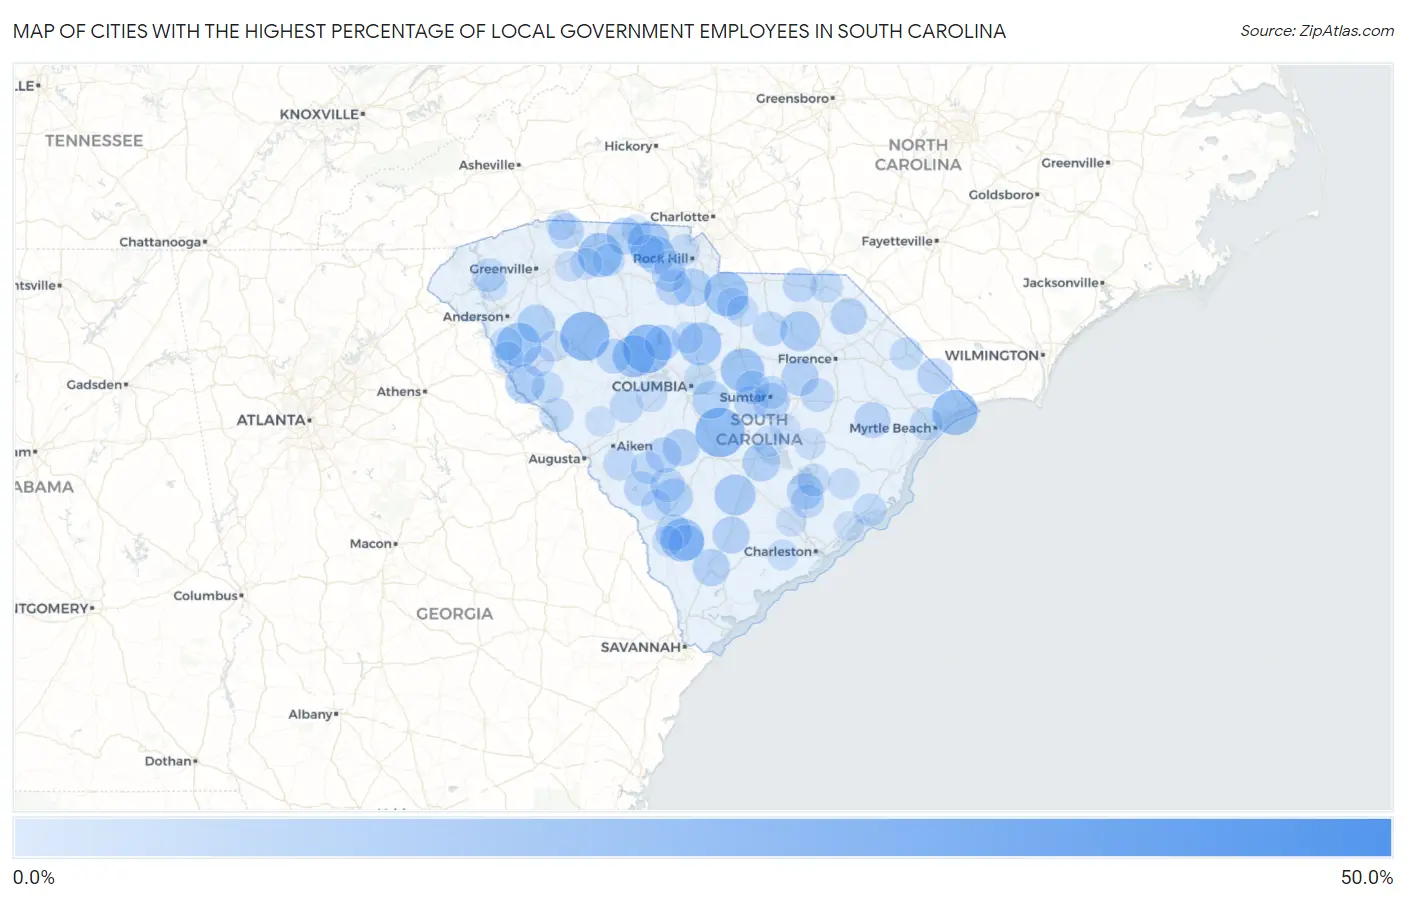
Map of Cities with the Highest Percentage of Local Government Employees in South Carolina
0.0%
50.0%
Cities with the Highest Percentage of Local Government Employees in South Carolina
| City | % Local Government Employees | vs State | vs National | |
| 1. | Zion | 48.3% | 6.4%(+41.9)#1 | 7.2%(+41.0)#320 |
| 2. | Pauline | 47.2% | 6.4%(+40.8)#2 | 7.2%(+39.9)#338 |
| 3. | Adams Run | 39.7% | 6.4%(+33.4)#3 | 7.2%(+32.5)#479 |
| 4. | Lobeco | 31.0% | 6.4%(+24.6)#4 | 7.2%(+23.7)#837 |
| 5. | Foreston | 30.0% | 6.4%(+23.6)#5 | 7.2%(+22.8)#899 |
| 6. | St Matthews | 27.0% | 6.4%(+20.7)#6 | 7.2%(+19.8)#1,103 |
| 7. | Mountville | 26.8% | 6.4%(+20.4)#7 | 7.2%(+19.6)#1,122 |
| 8. | Pomaria | 26.2% | 6.4%(+19.8)#8 | 7.2%(+19.0)#1,183 |
| 9. | South Union | 24.8% | 6.4%(+18.5)#9 | 7.2%(+17.6)#1,324 |
| 10. | Atlantic Beach | 23.3% | 6.4%(+17.0)#10 | 7.2%(+16.1)#1,481 |
| 11. | Elliott | 23.0% | 6.4%(+16.7)#11 | 7.2%(+15.8)#1,525 |
| 12. | Elgin | 22.4% | 6.4%(+16.1)#12 | 7.2%(+15.2)#1,610 |
| 13. | Antreville | 22.4% | 6.4%(+16.0)#13 | 7.2%(+15.1)#1,618 |
| 14. | Glendale | 22.1% | 6.4%(+15.7)#14 | 7.2%(+14.9)#1,673 |
| 15. | Boykin | 21.6% | 6.4%(+15.2)#15 | 7.2%(+14.3)#1,758 |
| 16. | Hampton | 21.4% | 6.4%(+15.1)#16 | 7.2%(+14.2)#1,773 |
| 17. | Ridgeway | 20.9% | 6.4%(+14.6)#17 | 7.2%(+13.7)#1,863 |
| 18. | Unity | 20.6% | 6.4%(+14.2)#18 | 7.2%(+13.3)#1,944 |
| 19. | Prosperity | 20.3% | 6.4%(+13.9)#19 | 7.2%(+13.1)#1,995 |
| 20. | Smyrna | 20.0% | 6.4%(+13.6)#20 | 7.2%(+12.8)#2,063 |
| 21. | Dunbar | 19.9% | 6.4%(+13.6)#21 | 7.2%(+12.7)#2,074 |
| 22. | Reevesville | 19.3% | 6.4%(+12.9)#22 | 7.2%(+12.1)#2,202 |
| 23. | North Hartsville | 18.4% | 6.4%(+12.0)#23 | 7.2%(+11.2)#2,464 |
| 24. | Mount Carmel | 17.6% | 6.4%(+11.3)#24 | 7.2%(+10.4)#2,665 |
| 25. | Richburg | 16.7% | 6.4%(+10.3)#25 | 7.2%(+9.44)#3,003 |
| 26. | Olar | 16.7% | 6.4%(+10.3)#26 | 7.2%(+9.44)#3,013 |
| 27. | Honea Path | 16.6% | 6.4%(+10.2)#27 | 7.2%(+9.37)#3,072 |
| 28. | Hopkins | 16.3% | 6.4%(+9.99)#28 | 7.2%(+9.12)#3,177 |
| 29. | Vance | 16.3% | 6.4%(+9.97)#29 | 7.2%(+9.10)#3,187 |
| 30. | Sharon | 16.1% | 6.4%(+9.79)#30 | 7.2%(+8.92)#3,268 |
| 31. | Yemassee | 15.9% | 6.4%(+9.50)#31 | 7.2%(+8.62)#3,405 |
| 32. | Lynchburg | 15.8% | 6.4%(+9.43)#32 | 7.2%(+8.56)#3,441 |
| 33. | East Gaffney | 15.7% | 6.4%(+9.36)#33 | 7.2%(+8.49)#3,485 |
| 34. | Livingston | 15.7% | 6.4%(+9.33)#34 | 7.2%(+8.46)#3,501 |
| 35. | Walterboro | 15.5% | 6.4%(+9.14)#35 | 7.2%(+8.26)#3,602 |
| 36. | South Sumter | 15.4% | 6.4%(+9.04)#36 | 7.2%(+8.17)#3,644 |
| 37. | Blenheim | 15.2% | 6.4%(+8.80)#37 | 7.2%(+7.92)#3,796 |
| 38. | Brunson | 14.9% | 6.4%(+8.56)#38 | 7.2%(+7.68)#3,942 |
| 39. | Pinopolis | 14.8% | 6.4%(+8.45)#39 | 7.2%(+7.58)#4,003 |
| 40. | Varnville | 14.8% | 6.4%(+8.40)#40 | 7.2%(+7.53)#4,026 |
| 41. | Helena | 14.7% | 6.4%(+8.39)#41 | 7.2%(+7.51)#4,036 |
| 42. | Hemingway | 14.5% | 6.4%(+8.11)#42 | 7.2%(+7.24)#4,228 |
| 43. | Loris | 14.4% | 6.4%(+8.09)#43 | 7.2%(+7.22)#4,239 |
| 44. | Eureka Mill | 14.3% | 6.4%(+7.95)#44 | 7.2%(+7.08)#4,315 |
| 45. | Springfield | 14.3% | 6.4%(+7.93)#45 | 7.2%(+7.06)#4,334 |
| 46. | Jenkinsville | 14.3% | 6.4%(+7.93)#46 | 7.2%(+7.06)#4,374 |
| 47. | Campobello | 14.1% | 6.4%(+7.76)#47 | 7.2%(+6.89)#4,509 |
| 48. | Silverstreet | 13.6% | 6.4%(+7.20)#48 | 7.2%(+6.33)#4,899 |
| 49. | Snelling | 13.5% | 6.4%(+7.18)#49 | 7.2%(+6.31)#4,915 |
| 50. | Bethune | 13.5% | 6.4%(+7.16)#50 | 7.2%(+6.29)#4,930 |
| 51. | Chesterfield | 13.4% | 6.4%(+7.04)#51 | 7.2%(+6.17)#5,028 |
| 52. | Hilda | 13.3% | 6.4%(+6.93)#52 | 7.2%(+6.06)#5,120 |
| 53. | Lowrys | 13.0% | 6.4%(+6.61)#53 | 7.2%(+5.74)#5,375 |
| 54. | North Santee | 12.9% | 6.4%(+6.57)#54 | 7.2%(+5.70)#5,411 |
| 55. | Wedgefield | 12.9% | 6.4%(+6.55)#55 | 7.2%(+5.68)#5,420 |
| 56. | Oakland | 12.9% | 6.4%(+6.55)#56 | 7.2%(+5.68)#5,424 |
| 57. | Parksville | 12.8% | 6.4%(+6.47)#57 | 7.2%(+5.59)#5,505 |
| 58. | Olanta | 12.8% | 6.4%(+6.43)#58 | 7.2%(+5.56)#5,533 |
| 59. | Hickory Grove | 12.8% | 6.4%(+6.41)#59 | 7.2%(+5.54)#5,550 |
| 60. | Six Mile | 12.5% | 6.4%(+6.17)#60 | 7.2%(+5.30)#5,746 |
| 61. | Moncks Corner | 12.5% | 6.4%(+6.11)#61 | 7.2%(+5.24)#5,820 |
| 62. | New Ellenton | 12.4% | 6.4%(+6.09)#62 | 7.2%(+5.22)#5,833 |
| 63. | Monetta | 12.3% | 6.4%(+5.99)#63 | 7.2%(+5.12)#5,919 |
| 64. | Forestbrook | 12.1% | 6.4%(+5.71)#64 | 7.2%(+4.84)#6,239 |
| 65. | Iva | 12.1% | 6.4%(+5.70)#65 | 7.2%(+4.82)#6,256 |
| 66. | Mcclellanville | 12.0% | 6.4%(+5.62)#66 | 7.2%(+4.74)#6,338 |
| 67. | Williston | 12.0% | 6.4%(+5.61)#67 | 7.2%(+4.74)#6,351 |
| 68. | Mulberry | 11.9% | 6.4%(+5.55)#68 | 7.2%(+4.68)#6,408 |
| 69. | Wallace | 11.8% | 6.4%(+5.49)#69 | 7.2%(+4.61)#6,474 |
| 70. | Nichols | 11.8% | 6.4%(+5.41)#70 | 7.2%(+4.54)#6,554 |
| 71. | Bonneau | 11.7% | 6.4%(+5.35)#71 | 7.2%(+4.47)#6,629 |
| 72. | Pacolet | 11.5% | 6.4%(+5.18)#72 | 7.2%(+4.31)#6,792 |
| 73. | Heath Springs | 11.5% | 6.4%(+5.14)#73 | 7.2%(+4.26)#6,860 |
| 74. | Arcadia Lakes | 11.4% | 6.4%(+5.08)#74 | 7.2%(+4.21)#6,927 |
| 75. | Buford | 11.3% | 6.4%(+4.94)#75 | 7.2%(+4.06)#7,104 |
| 76. | Lowndesville | 11.1% | 6.4%(+4.76)#76 | 7.2%(+3.88)#7,334 |
| 77. | Troy | 11.1% | 6.4%(+4.76)#77 | 7.2%(+3.88)#7,337 |
| 78. | Winnsboro Mills | 10.7% | 6.4%(+4.37)#78 | 7.2%(+3.50)#7,825 |
| 79. | Mcconnells | 10.7% | 6.4%(+4.34)#79 | 7.2%(+3.46)#7,869 |
| 80. | Newport | 10.7% | 6.4%(+4.32)#80 | 7.2%(+3.45)#7,893 |
| 81. | Jamestown | 10.6% | 6.4%(+4.28)#81 | 7.2%(+3.41)#7,951 |
| 82. | Roebuck | 10.6% | 6.4%(+4.27)#82 | 7.2%(+3.39)#7,968 |
| 83. | Gilbert | 10.6% | 6.4%(+4.21)#83 | 7.2%(+3.34)#8,038 |
| 84. | Summerton | 10.5% | 6.4%(+4.13)#84 | 7.2%(+3.25)#8,173 |
| 85. | Hodges | 10.3% | 6.4%(+3.99)#85 | 7.2%(+3.12)#8,384 |
| 86. | Kershaw | 10.3% | 6.4%(+3.99)#86 | 7.2%(+3.11)#8,396 |
| 87. | Greeleyville | 10.3% | 6.4%(+3.92)#87 | 7.2%(+3.05)#8,483 |
| 88. | Clemson University | 10.0% | 6.4%(+3.68)#88 | 7.2%(+2.81)#8,830 |
| 89. | Kline | 10.0% | 6.4%(+3.64)#89 | 7.2%(+2.77)#8,920 |
| 90. | Manning | 10.0% | 6.4%(+3.63)#90 | 7.2%(+2.75)#8,957 |
| 91. | Hollywood | 10.0% | 6.4%(+3.60)#91 | 7.2%(+2.73)#8,991 |
| 92. | Lincolnville | 9.9% | 6.4%(+3.55)#92 | 7.2%(+2.68)#9,069 |
| 93. | Gifford | 9.9% | 6.4%(+3.52)#93 | 7.2%(+2.65)#9,115 |
| 94. | Blacksburg | 9.8% | 6.4%(+3.47)#94 | 7.2%(+2.60)#9,187 |
| 95. | Abbeville | 9.8% | 6.4%(+3.47)#95 | 7.2%(+2.60)#9,192 |
| 96. | Reidville | 9.7% | 6.4%(+3.32)#96 | 7.2%(+2.45)#9,478 |
| 97. | Landrum | 9.7% | 6.4%(+3.30)#97 | 7.2%(+2.43)#9,509 |
| 98. | Awendaw | 9.3% | 6.4%(+2.91)#98 | 7.2%(+2.03)#10,231 |
| 99. | Trenton | 9.3% | 6.4%(+2.90)#99 | 7.2%(+2.03)#10,238 |
| 100. | Central | 9.3% | 6.4%(+2.90)#100 | 7.2%(+2.03)#10,245 |
Common Questions
What are the Top 10 Cities with the Highest Percentage of Local Government Employees in South Carolina?
Top 10 Cities with the Highest Percentage of Local Government Employees in South Carolina are:
#1
27.0%
#2
26.8%
#3
26.2%
#4
23.3%
#5
22.4%
#6
22.4%
#7
22.1%
#8
21.6%
#9
21.4%
#10
20.9%
What city has the Highest Percentage of Local Government Employees in South Carolina?
St Matthews has the Highest Percentage of Local Government Employees in South Carolina with 27.0%.
What is the Percentage of Local Government Employees in the State of South Carolina?
Percentage of Local Government Employees in South Carolina is 6.4%.
What is the Percentage of Local Government Employees in the United States?
Percentage of Local Government Employees in the United States is 7.2%.