Cities with the Highest Percentage of Local Government Employees in Ohio
RELATED REPORTS & OPTIONS
Local Government Employees
Ohio
Compare Cities
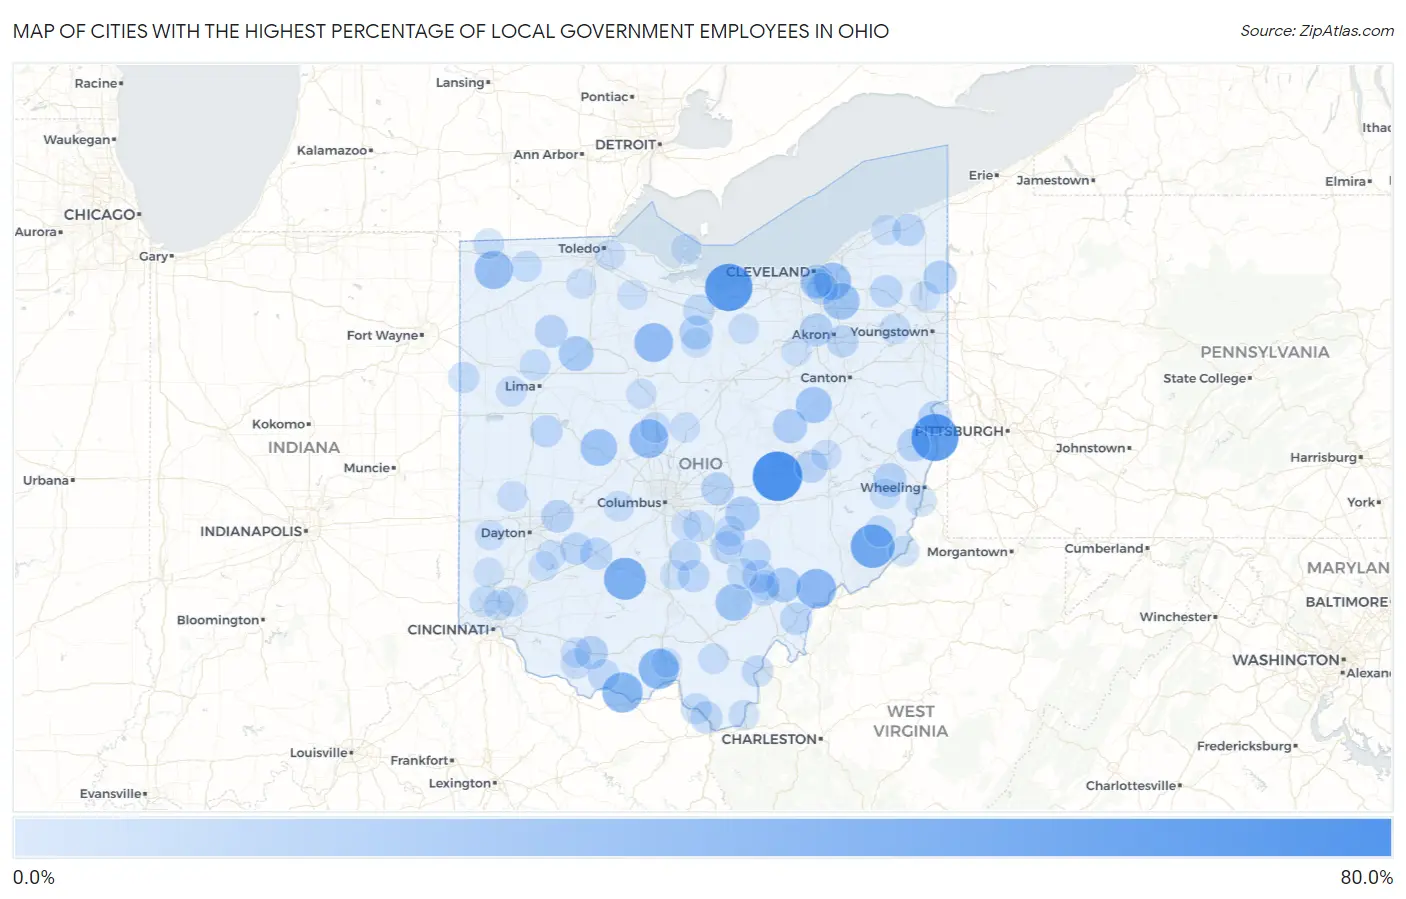
Map of Cities with the Highest Percentage of Local Government Employees in Ohio
0.0%
80.0%
Cities with the Highest Percentage of Local Government Employees in Ohio
| City | % Local Government Employees | vs State | vs National | |
| 1. | Trinway | 69.6% | 7.4%(+62.2)#1 | 7.2%(+62.4)#118 |
| 2. | Beulah Beach | 63.2% | 7.4%(+55.7)#2 | 7.2%(+55.9)#148 |
| 3. | Pottery Addition | 62.3% | 7.4%(+54.9)#3 | 7.2%(+55.1)#152 |
| 4. | Graysville | 52.2% | 7.4%(+44.7)#4 | 7.2%(+44.9)#246 |
| 5. | Good Hope | 48.2% | 7.4%(+40.8)#5 | 7.2%(+41.0)#322 |
| 6. | Mcdermott | 43.1% | 7.4%(+35.6)#6 | 7.2%(+35.9)#414 |
| 7. | Rome Stout | 42.9% | 7.4%(+35.4)#7 | 7.2%(+35.6)#418 |
| 8. | Vincent | 41.4% | 7.4%(+33.9)#8 | 7.2%(+34.2)#454 |
| 9. | Melmore | 38.7% | 7.4%(+31.3)#9 | 7.2%(+31.5)#505 |
| 10. | Radnor | 38.5% | 7.4%(+31.0)#10 | 7.2%(+31.2)#510 |
| 11. | Pulaski | 37.2% | 7.4%(+29.8)#11 | 7.2%(+30.0)#559 |
| 12. | North Randall | 34.6% | 7.4%(+27.1)#12 | 7.2%(+27.4)#668 |
| 13. | Bass Lake | 33.5% | 7.4%(+26.0)#13 | 7.2%(+26.3)#704 |
| 14. | East Liberty | 33.3% | 7.4%(+25.9)#14 | 7.2%(+26.1)#711 |
| 15. | Twinsburg Heights | 33.2% | 7.4%(+25.8)#15 | 7.2%(+26.0)#743 |
| 16. | Zaleski | 32.9% | 7.4%(+25.5)#16 | 7.2%(+25.7)#754 |
| 17. | Winesburg | 31.5% | 7.4%(+24.1)#17 | 7.2%(+24.3)#806 |
| 18. | Rawson | 28.3% | 7.4%(+20.8)#18 | 7.2%(+21.1)#1,007 |
| 19. | Amesville | 27.5% | 7.4%(+20.0)#19 | 7.2%(+20.2)#1,063 |
| 20. | Glenford | 27.1% | 7.4%(+19.7)#20 | 7.2%(+19.9)#1,097 |
| 21. | Lake Buckhorn | 25.9% | 7.4%(+18.5)#21 | 7.2%(+18.7)#1,205 |
| 22. | Holiday Lakes | 25.2% | 7.4%(+17.8)#22 | 7.2%(+18.0)#1,262 |
| 23. | Kinsman Center | 24.6% | 7.4%(+17.2)#23 | 7.2%(+17.4)#1,352 |
| 24. | Lafferty | 24.4% | 7.4%(+16.9)#24 | 7.2%(+17.1)#1,374 |
| 25. | Cuyahoga Heights | 23.8% | 7.4%(+16.4)#25 | 7.2%(+16.6)#1,423 |
| 26. | Winchester | 23.8% | 7.4%(+16.3)#26 | 7.2%(+16.5)#1,431 |
| 27. | Pigeon Creek | 23.4% | 7.4%(+16.0)#27 | 7.2%(+16.2)#1,467 |
| 28. | Bloomingdale | 23.3% | 7.4%(+15.8)#28 | 7.2%(+16.0)#1,489 |
| 29. | Stratton | 23.2% | 7.4%(+15.8)#29 | 7.2%(+16.0)#1,493 |
| 30. | Sharon Center | 23.1% | 7.4%(+15.7)#30 | 7.2%(+15.9)#1,502 |
| 31. | Granville South | 22.9% | 7.4%(+15.5)#31 | 7.2%(+15.7)#1,539 |
| 32. | Plainfield | 22.6% | 7.4%(+15.1)#32 | 7.2%(+15.4)#1,581 |
| 33. | Green Meadows | 22.4% | 7.4%(+14.9)#33 | 7.2%(+15.1)#1,623 |
| 34. | Buchtel | 22.3% | 7.4%(+14.9)#34 | 7.2%(+15.1)#1,627 |
| 35. | West Leipsic | 22.0% | 7.4%(+14.5)#35 | 7.2%(+14.7)#1,690 |
| 36. | Parkman | 21.2% | 7.4%(+13.8)#36 | 7.2%(+14.0)#1,802 |
| 37. | Tuppers Plains | 21.2% | 7.4%(+13.7)#37 | 7.2%(+14.0)#1,815 |
| 38. | Austinburg | 21.1% | 7.4%(+13.6)#38 | 7.2%(+13.8)#1,842 |
| 39. | Octa | 21.1% | 7.4%(+13.6)#39 | 7.2%(+13.8)#1,849 |
| 40. | Shawnee Hills | 21.0% | 7.4%(+13.6)#40 | 7.2%(+13.8)#1,850 |
| 41. | Coal Grove | 20.7% | 7.4%(+13.3)#41 | 7.2%(+13.5)#1,915 |
| 42. | Jackson Center | 20.6% | 7.4%(+13.1)#42 | 7.2%(+13.3)#1,948 |
| 43. | Sawyerwood | 20.5% | 7.4%(+13.1)#43 | 7.2%(+13.3)#1,954 |
| 44. | Hide A Way Hills | 20.2% | 7.4%(+12.8)#44 | 7.2%(+13.0)#2,009 |
| 45. | Jersey | 20.2% | 7.4%(+12.7)#45 | 7.2%(+12.9)#2,013 |
| 46. | Adelphi | 20.1% | 7.4%(+12.7)#46 | 7.2%(+12.9)#2,019 |
| 47. | Valley View | 19.9% | 7.4%(+12.5)#47 | 7.2%(+12.7)#2,076 |
| 48. | West Union | 19.9% | 7.4%(+12.5)#48 | 7.2%(+12.7)#2,081 |
| 49. | The Plains | 19.8% | 7.4%(+12.4)#49 | 7.2%(+12.6)#2,092 |
| 50. | Stoutsville | 19.5% | 7.4%(+12.0)#50 | 7.2%(+12.2)#2,156 |
| 51. | Gallipolis | 19.4% | 7.4%(+12.0)#51 | 7.2%(+12.2)#2,163 |
| 52. | Shawnee | 19.2% | 7.4%(+11.8)#52 | 7.2%(+12.0)#2,213 |
| 53. | Woodsfield | 19.1% | 7.4%(+11.6)#53 | 7.2%(+11.8)#2,256 |
| 54. | Hanging Rock | 18.7% | 7.4%(+11.2)#54 | 7.2%(+11.4)#2,384 |
| 55. | Monroeville | 18.5% | 7.4%(+11.0)#55 | 7.2%(+11.2)#2,434 |
| 56. | Wren | 18.4% | 7.4%(+10.9)#56 | 7.2%(+11.2)#2,462 |
| 57. | Carroll | 18.4% | 7.4%(+10.9)#57 | 7.2%(+11.2)#2,465 |
| 58. | Brooklyn Heights | 18.1% | 7.4%(+10.7)#58 | 7.2%(+10.9)#2,546 |
| 59. | Haydenville | 18.0% | 7.4%(+10.6)#59 | 7.2%(+10.8)#2,569 |
| 60. | Pettisville | 17.6% | 7.4%(+10.1)#60 | 7.2%(+10.3)#2,698 |
| 61. | Vaughnsville | 17.5% | 7.4%(+10.1)#61 | 7.2%(+10.3)#2,707 |
| 62. | Sardis | 17.4% | 7.4%(+9.97)#62 | 7.2%(+10.2)#2,757 |
| 63. | Pleasant Run | 17.4% | 7.4%(+9.96)#63 | 7.2%(+10.2)#2,760 |
| 64. | Highpoint | 17.4% | 7.4%(+9.96)#64 | 7.2%(+10.2)#2,761 |
| 65. | Waldo | 17.2% | 7.4%(+9.78)#65 | 7.2%(+9.99)#2,820 |
| 66. | Shadyside | 17.2% | 7.4%(+9.71)#66 | 7.2%(+9.93)#2,838 |
| 67. | Reedurban | 16.9% | 7.4%(+9.50)#67 | 7.2%(+9.71)#2,900 |
| 68. | Rushville | 16.9% | 7.4%(+9.47)#68 | 7.2%(+9.68)#2,912 |
| 69. | Rochester | 16.9% | 7.4%(+9.46)#69 | 7.2%(+9.67)#2,922 |
| 70. | Craig Beach | 16.9% | 7.4%(+9.43)#70 | 7.2%(+9.65)#2,928 |
| 71. | Oak Hill | 16.6% | 7.4%(+9.19)#71 | 7.2%(+9.41)#3,052 |
| 72. | Bethesda | 16.5% | 7.4%(+9.09)#72 | 7.2%(+9.31)#3,097 |
| 73. | Athalia | 16.5% | 7.4%(+9.09)#73 | 7.2%(+9.30)#3,102 |
| 74. | Pioneer | 16.5% | 7.4%(+9.05)#74 | 7.2%(+9.26)#3,115 |
| 75. | Ludlow Falls | 16.5% | 7.4%(+9.01)#75 | 7.2%(+9.23)#3,123 |
| 76. | Spencerville | 16.4% | 7.4%(+9.01)#76 | 7.2%(+9.22)#3,130 |
| 77. | Lafayette | 16.4% | 7.4%(+9.00)#77 | 7.2%(+9.21)#3,137 |
| 78. | Russellville | 16.4% | 7.4%(+8.98)#78 | 7.2%(+9.20)#3,145 |
| 79. | Northwood | 16.4% | 7.4%(+8.92)#79 | 7.2%(+9.14)#3,167 |
| 80. | Glendale | 16.3% | 7.4%(+8.85)#80 | 7.2%(+9.07)#3,203 |
| 81. | Madison | 16.2% | 7.4%(+8.75)#81 | 7.2%(+8.96)#3,239 |
| 82. | Lake Waynoka | 16.1% | 7.4%(+8.61)#82 | 7.2%(+8.83)#3,308 |
| 83. | Bremen | 15.9% | 7.4%(+8.46)#83 | 7.2%(+8.68)#3,374 |
| 84. | Fulton | 15.9% | 7.4%(+8.43)#84 | 7.2%(+8.65)#3,390 |
| 85. | Newcomerstown | 15.8% | 7.4%(+8.35)#85 | 7.2%(+8.57)#3,431 |
| 86. | Morral | 15.8% | 7.4%(+8.32)#86 | 7.2%(+8.54)#3,464 |
| 87. | Chauncey | 15.7% | 7.4%(+8.30)#87 | 7.2%(+8.52)#3,469 |
| 88. | Lucasville | 15.7% | 7.4%(+8.24)#88 | 7.2%(+8.46)#3,495 |
| 89. | Spring Valley | 15.6% | 7.4%(+8.19)#89 | 7.2%(+8.41)#3,536 |
| 90. | Put In Bay | 15.6% | 7.4%(+8.18)#90 | 7.2%(+8.40)#3,547 |
| 91. | West Alexandria | 15.5% | 7.4%(+8.10)#91 | 7.2%(+8.31)#3,586 |
| 92. | Lithopolis | 15.4% | 7.4%(+7.91)#92 | 7.2%(+8.12)#3,677 |
| 93. | Sterling | 15.3% | 7.4%(+7.81)#93 | 7.2%(+8.03)#3,736 |
| 94. | Celeryville | 15.2% | 7.4%(+7.77)#94 | 7.2%(+7.99)#3,755 |
| 95. | Tontogany | 15.2% | 7.4%(+7.75)#95 | 7.2%(+7.97)#3,770 |
| 96. | Kingston | 15.2% | 7.4%(+7.75)#96 | 7.2%(+7.97)#3,772 |
| 97. | Seven Mile | 15.1% | 7.4%(+7.68)#97 | 7.2%(+7.90)#3,805 |
| 98. | Corwin | 15.0% | 7.4%(+7.60)#98 | 7.2%(+7.81)#3,860 |
| 99. | Helena | 15.0% | 7.4%(+7.59)#99 | 7.2%(+7.81)#3,867 |
| 100. | Cortland | 15.0% | 7.4%(+7.59)#100 | 7.2%(+7.81)#3,870 |
Common Questions
What are the Top 10 Cities with the Highest Percentage of Local Government Employees in Ohio?
Top 10 Cities with the Highest Percentage of Local Government Employees in Ohio are:
#1
69.6%
#2
63.2%
#3
62.3%
#4
52.2%
#5
48.2%
#6
43.1%
#7
42.9%
#8
41.4%
#9
38.7%
#10
38.5%
What city has the Highest Percentage of Local Government Employees in Ohio?
Trinway has the Highest Percentage of Local Government Employees in Ohio with 69.6%.
What is the Percentage of Local Government Employees in the State of Ohio?
Percentage of Local Government Employees in Ohio is 7.4%.
What is the Percentage of Local Government Employees in the United States?
Percentage of Local Government Employees in the United States is 7.2%.