Cities with the Highest Percentage of Local Government Employees in Georgia
RELATED REPORTS & OPTIONS
Local Government Employees
Georgia
Compare Cities
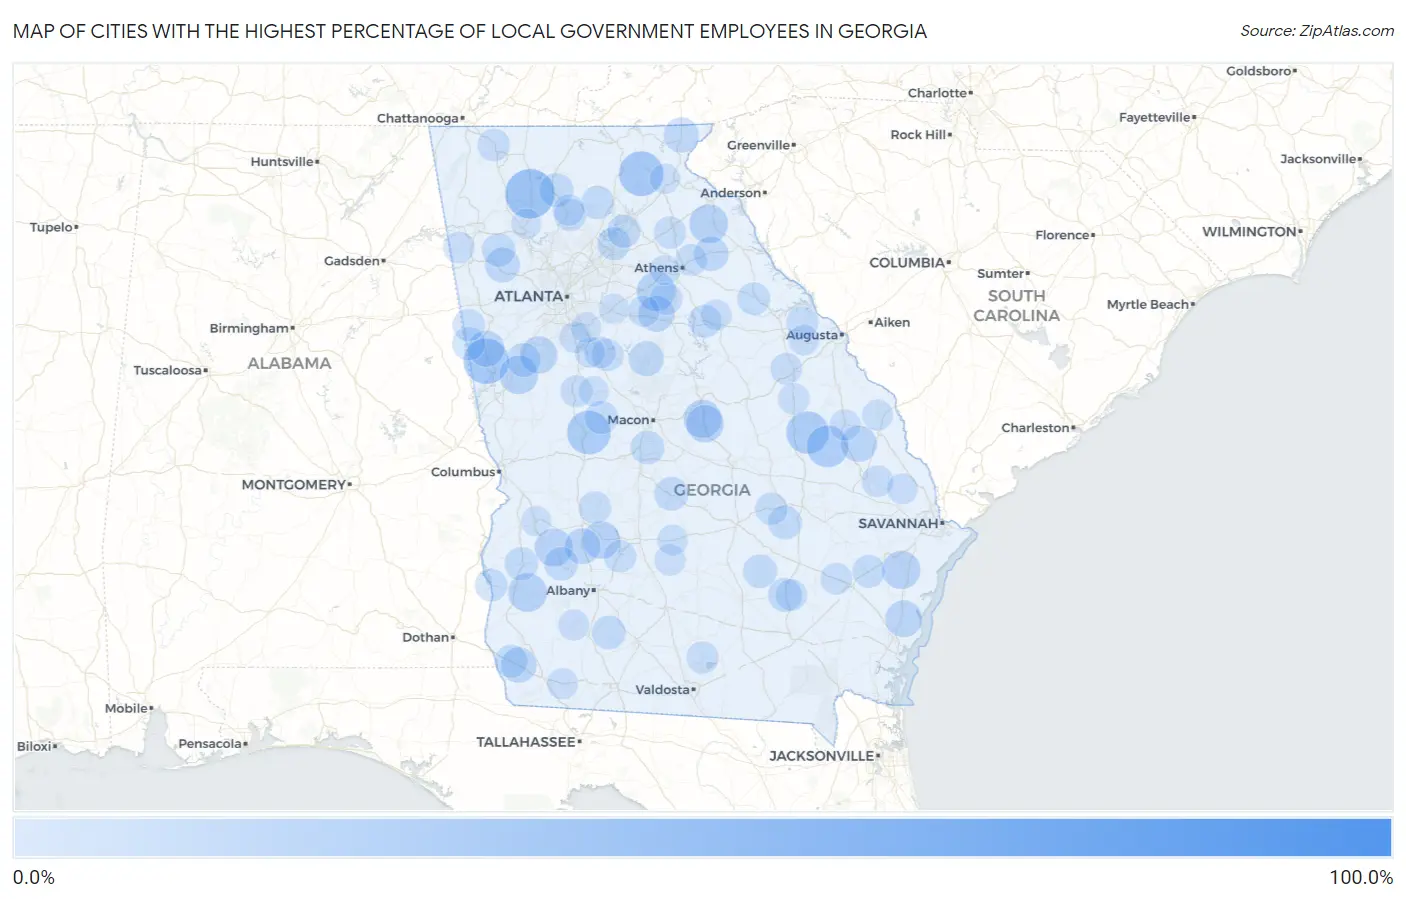
Map of Cities with the Highest Percentage of Local Government Employees in Georgia
0.0%
100.0%
Cities with the Highest Percentage of Local Government Employees in Georgia
| City | % Local Government Employees | vs State | vs National | |
| 1. | Millwood | 100.0% | 7.0%(+93.0)#1 | 7.2%(+92.8)#28 |
| 2. | Waynesville | 78.9% | 7.0%(+71.9)#2 | 7.2%(+71.6)#88 |
| 3. | Hickox | 52.8% | 7.0%(+45.8)#3 | 7.2%(+45.6)#238 |
| 4. | Juliette | 45.5% | 7.0%(+38.5)#4 | 7.2%(+38.2)#365 |
| 5. | Ranger | 42.9% | 7.0%(+35.9)#5 | 7.2%(+35.6)#417 |
| 6. | Franklin | 36.8% | 7.0%(+29.8)#6 | 7.2%(+29.5)#576 |
| 7. | Yonah | 35.6% | 7.0%(+28.6)#7 | 7.2%(+28.4)#624 |
| 8. | Salem | 33.8% | 7.0%(+26.8)#8 | 7.2%(+26.5)#700 |
| 9. | Summertown | 31.9% | 7.0%(+24.9)#9 | 7.2%(+24.7)#790 |
| 10. | Garfield | 31.0% | 7.0%(+24.0)#10 | 7.2%(+23.7)#842 |
| 11. | Good Hope | 26.7% | 7.0%(+19.7)#11 | 7.2%(+19.5)#1,130 |
| 12. | Franklin Springs | 26.4% | 7.0%(+19.4)#12 | 7.2%(+19.2)#1,161 |
| 13. | Edison | 26.2% | 7.0%(+19.2)#13 | 7.2%(+18.9)#1,185 |
| 14. | Lone Oak | 25.7% | 7.0%(+18.7)#14 | 7.2%(+18.5)#1,219 |
| 15. | Riceboro | 25.3% | 7.0%(+18.3)#15 | 7.2%(+18.1)#1,259 |
| 16. | Antioch | 25.3% | 7.0%(+18.3)#16 | 7.2%(+18.0)#1,260 |
| 17. | Parrott | 25.0% | 7.0%(+18.0)#17 | 7.2%(+17.8)#1,288 |
| 18. | Mcintyre | 24.9% | 7.0%(+17.9)#18 | 7.2%(+17.7)#1,315 |
| 19. | Dixie | 24.6% | 7.0%(+17.6)#19 | 7.2%(+17.3)#1,358 |
| 20. | Irwinton | 24.4% | 7.0%(+17.4)#20 | 7.2%(+17.2)#1,368 |
| 21. | Leslie | 24.1% | 7.0%(+17.1)#21 | 7.2%(+16.8)#1,397 |
| 22. | Turin | 23.9% | 7.0%(+16.9)#22 | 7.2%(+16.7)#1,419 |
| 23. | Darien | 23.0% | 7.0%(+16.0)#23 | 7.2%(+15.8)#1,529 |
| 24. | Rocky Ford | 22.5% | 7.0%(+15.5)#24 | 7.2%(+15.3)#1,602 |
| 25. | Centralhatchee | 22.3% | 7.0%(+15.4)#25 | 7.2%(+15.1)#1,626 |
| 26. | Rutledge | 22.2% | 7.0%(+15.2)#26 | 7.2%(+15.0)#1,643 |
| 27. | Smithville | 21.4% | 7.0%(+14.4)#27 | 7.2%(+14.2)#1,774 |
| 28. | Iron City | 21.2% | 7.0%(+14.2)#28 | 7.2%(+13.9)#1,817 |
| 29. | Mountain City | 20.8% | 7.0%(+13.9)#29 | 7.2%(+13.6)#1,879 |
| 30. | Monticello | 20.5% | 7.0%(+13.5)#30 | 7.2%(+13.3)#1,953 |
| 31. | Braswell | 20.1% | 7.0%(+13.1)#31 | 7.2%(+12.9)#2,020 |
| 32. | Comer | 19.7% | 7.0%(+12.7)#32 | 7.2%(+12.5)#2,115 |
| 33. | Talking Rock | 19.0% | 7.0%(+12.1)#33 | 7.2%(+11.8)#2,271 |
| 34. | Moreland | 19.0% | 7.0%(+12.0)#34 | 7.2%(+11.8)#2,283 |
| 35. | Hawkinsville | 18.9% | 7.0%(+12.0)#35 | 7.2%(+11.7)#2,305 |
| 36. | Alston | 18.8% | 7.0%(+11.9)#36 | 7.2%(+11.6)#2,335 |
| 37. | Alma | 18.8% | 7.0%(+11.8)#37 | 7.2%(+11.5)#2,355 |
| 38. | Centerville | 18.7% | 7.0%(+11.7)#38 | 7.2%(+11.5)#2,380 |
| 39. | Sale City | 18.7% | 7.0%(+11.7)#39 | 7.2%(+11.4)#2,383 |
| 40. | Denton | 18.6% | 7.0%(+11.7)#40 | 7.2%(+11.4)#2,388 |
| 41. | Naylor | 18.5% | 7.0%(+11.5)#41 | 7.2%(+11.3)#2,426 |
| 42. | Dawson | 18.4% | 7.0%(+11.4)#42 | 7.2%(+11.2)#2,454 |
| 43. | Taylorsville | 18.3% | 7.0%(+11.3)#43 | 7.2%(+11.0)#2,498 |
| 44. | Cuthbert | 18.1% | 7.0%(+11.1)#44 | 7.2%(+10.8)#2,552 |
| 45. | Dawsonville | 17.9% | 7.0%(+10.9)#45 | 7.2%(+10.6)#2,603 |
| 46. | Culloden | 17.7% | 7.0%(+10.7)#46 | 7.2%(+10.5)#2,648 |
| 47. | Greensboro | 17.6% | 7.0%(+10.6)#47 | 7.2%(+10.4)#2,688 |
| 48. | Ephesus | 17.6% | 7.0%(+10.6)#48 | 7.2%(+10.4)#2,689 |
| 49. | Rest Haven | 17.4% | 7.0%(+10.4)#49 | 7.2%(+10.2)#2,766 |
| 50. | Donalsonville | 17.4% | 7.0%(+10.4)#50 | 7.2%(+10.2)#2,769 |
| 51. | Oakwood | 17.3% | 7.0%(+10.3)#51 | 7.2%(+10.1)#2,792 |
| 52. | Washington | 16.9% | 7.0%(+9.97)#52 | 7.2%(+9.72)#2,897 |
| 53. | Fort Gaines | 16.8% | 7.0%(+9.83)#53 | 7.2%(+9.59)#2,948 |
| 54. | Ludowici | 16.8% | 7.0%(+9.82)#54 | 7.2%(+9.57)#2,950 |
| 55. | Tunnel Hill | 16.7% | 7.0%(+9.72)#55 | 7.2%(+9.48)#2,986 |
| 56. | Andersonville | 16.7% | 7.0%(+9.68)#56 | 7.2%(+9.44)#3,005 |
| 57. | Mershon | 16.7% | 7.0%(+9.68)#57 | 7.2%(+9.44)#3,046 |
| 58. | Warwick | 16.6% | 7.0%(+9.62)#58 | 7.2%(+9.37)#3,068 |
| 59. | Mount Vernon | 16.5% | 7.0%(+9.56)#59 | 7.2%(+9.31)#3,094 |
| 60. | Commerce | 16.5% | 7.0%(+9.55)#60 | 7.2%(+9.31)#3,096 |
| 61. | Bostwick | 16.5% | 7.0%(+9.47)#61 | 7.2%(+9.23)#3,122 |
| 62. | Ball Ground | 16.4% | 7.0%(+9.45)#62 | 7.2%(+9.21)#3,143 |
| 63. | Bowdon | 16.4% | 7.0%(+9.37)#63 | 7.2%(+9.12)#3,175 |
| 64. | Jenkinsburg | 16.3% | 7.0%(+9.33)#64 | 7.2%(+9.08)#3,192 |
| 65. | Appling | 16.1% | 7.0%(+9.10)#65 | 7.2%(+8.86)#3,293 |
| 66. | Ray City | 16.0% | 7.0%(+9.02)#66 | 7.2%(+8.77)#3,332 |
| 67. | Hull | 15.9% | 7.0%(+8.89)#67 | 7.2%(+8.65)#3,392 |
| 68. | Meansville | 15.9% | 7.0%(+8.87)#68 | 7.2%(+8.63)#3,400 |
| 69. | Axson | 15.7% | 7.0%(+8.75)#69 | 7.2%(+8.51)#3,475 |
| 70. | Rockingham | 15.6% | 7.0%(+8.60)#70 | 7.2%(+8.36)#3,562 |
| 71. | Odum | 15.6% | 7.0%(+8.57)#71 | 7.2%(+8.33)#3,578 |
| 72. | Stapleton | 15.5% | 7.0%(+8.51)#72 | 7.2%(+8.27)#3,599 |
| 73. | Brooklet | 15.4% | 7.0%(+8.41)#73 | 7.2%(+8.17)#3,645 |
| 74. | Smarr | 15.4% | 7.0%(+8.40)#74 | 7.2%(+8.16)#3,654 |
| 75. | Louisville | 15.2% | 7.0%(+8.25)#75 | 7.2%(+8.01)#3,742 |
| 76. | Nelson | 15.2% | 7.0%(+8.19)#76 | 7.2%(+7.95)#3,781 |
| 77. | Cave Spring | 15.1% | 7.0%(+8.15)#77 | 7.2%(+7.91)#3,803 |
| 78. | Locust Grove | 15.1% | 7.0%(+8.11)#78 | 7.2%(+7.86)#3,833 |
| 79. | Cataula | 14.9% | 7.0%(+7.93)#79 | 7.2%(+7.69)#3,940 |
| 80. | Rebecca | 14.9% | 7.0%(+7.88)#80 | 7.2%(+7.64)#3,969 |
| 81. | Social Circle | 14.9% | 7.0%(+7.87)#81 | 7.2%(+7.63)#3,973 |
| 82. | Lovejoy | 14.7% | 7.0%(+7.69)#82 | 7.2%(+7.44)#4,076 |
| 83. | Hortense | 14.6% | 7.0%(+7.65)#83 | 7.2%(+7.41)#4,093 |
| 84. | Millen | 14.6% | 7.0%(+7.58)#84 | 7.2%(+7.34)#4,154 |
| 85. | Climax | 14.5% | 7.0%(+7.53)#85 | 7.2%(+7.29)#4,190 |
| 86. | Newton | 14.4% | 7.0%(+7.39)#86 | 7.2%(+7.14)#4,283 |
| 87. | Rochelle | 14.3% | 7.0%(+7.30)#87 | 7.2%(+7.06)#4,322 |
| 88. | Union Point | 14.2% | 7.0%(+7.19)#88 | 7.2%(+6.94)#4,454 |
| 89. | Hiltonia | 14.2% | 7.0%(+7.17)#89 | 7.2%(+6.92)#4,469 |
| 90. | Guyton | 14.1% | 7.0%(+7.15)#90 | 7.2%(+6.91)#4,480 |
| 91. | Harlem | 14.1% | 7.0%(+7.15)#91 | 7.2%(+6.91)#4,484 |
| 92. | Heron Bay | 13.5% | 7.0%(+6.51)#92 | 7.2%(+6.26)#4,954 |
| 93. | Sterling | 13.5% | 7.0%(+6.49)#93 | 7.2%(+6.25)#4,969 |
| 94. | Stockbridge | 13.4% | 7.0%(+6.44)#94 | 7.2%(+6.20)#5,003 |
| 95. | Clarkesville | 13.3% | 7.0%(+6.36)#95 | 7.2%(+6.12)#5,067 |
| 96. | Richland | 13.3% | 7.0%(+6.35)#96 | 7.2%(+6.11)#5,070 |
| 97. | White | 13.2% | 7.0%(+6.21)#97 | 7.2%(+5.96)#5,187 |
| 98. | Barnesville | 13.2% | 7.0%(+6.18)#98 | 7.2%(+5.93)#5,206 |
| 99. | Conyers | 13.1% | 7.0%(+6.14)#99 | 7.2%(+5.89)#5,249 |
| 100. | Bogart | 13.1% | 7.0%(+6.11)#100 | 7.2%(+5.87)#5,260 |
Common Questions
What are the Top 10 Cities with the Highest Percentage of Local Government Employees in Georgia?
Top 10 Cities with the Highest Percentage of Local Government Employees in Georgia are:
#1
42.9%
#2
36.8%
#3
35.6%
#4
33.8%
#5
31.9%
#6
31.0%
#7
26.7%
#8
26.4%
#9
26.2%
#10
25.7%
What city has the Highest Percentage of Local Government Employees in Georgia?
Ranger has the Highest Percentage of Local Government Employees in Georgia with 42.9%.
What is the Percentage of Local Government Employees in the State of Georgia?
Percentage of Local Government Employees in Georgia is 7.0%.
What is the Percentage of Local Government Employees in the United States?
Percentage of Local Government Employees in the United States is 7.2%.