Cities with the Highest Percentage of Local Government Employees in Indiana
RELATED REPORTS & OPTIONS
Local Government Employees
Indiana
Compare Cities
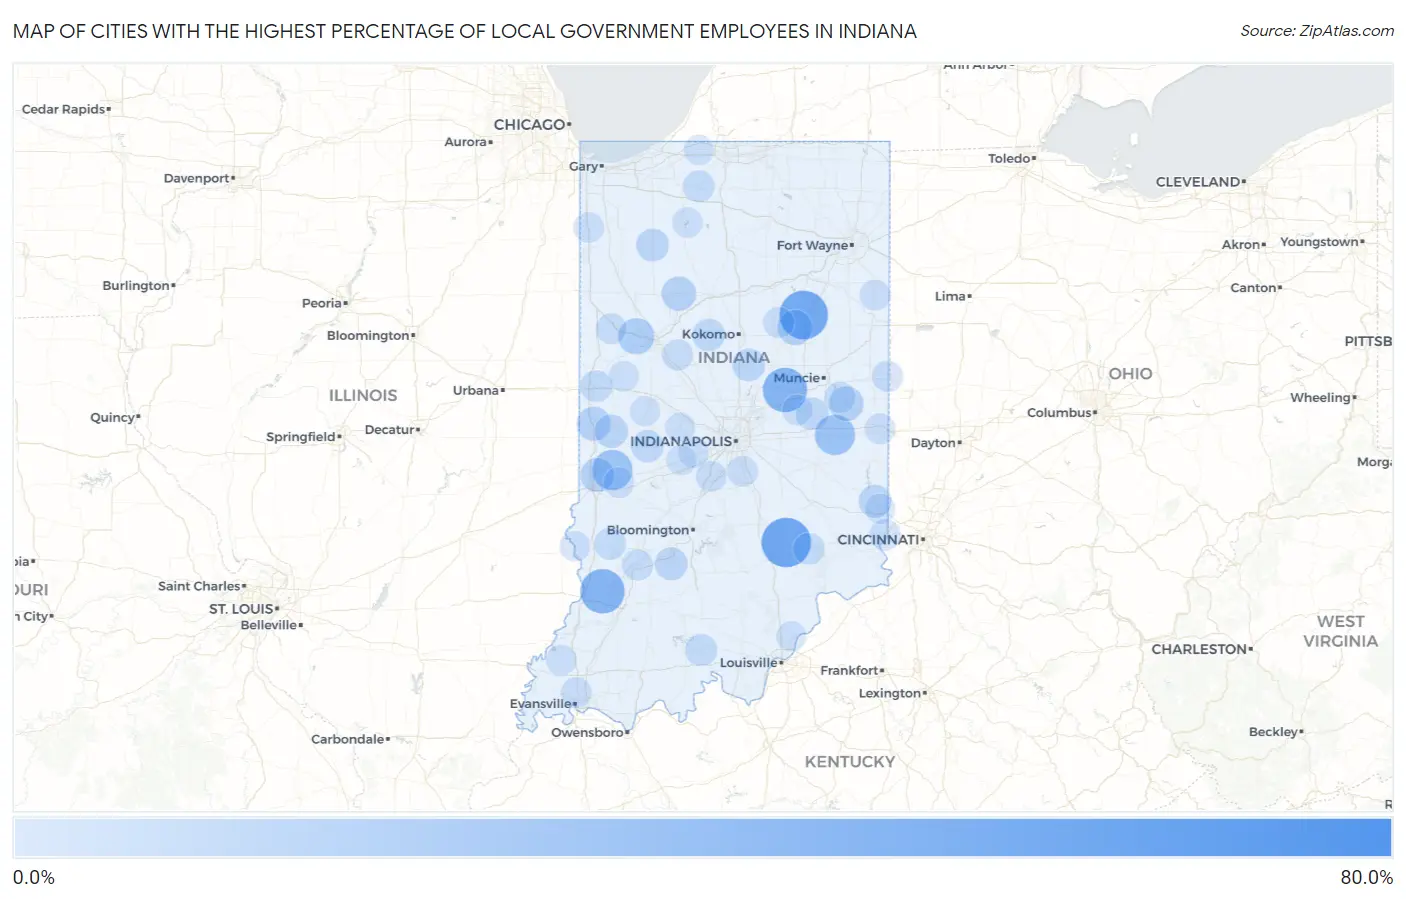
Map of Cities with the Highest Percentage of Local Government Employees in Indiana
0.0%
80.0%
Cities with the Highest Percentage of Local Government Employees in Indiana
| City | % Local Government Employees | vs State | vs National | |
| 1. | Scircleville | 72.7% | 6.2%(+66.6)#1 | 7.2%(+65.5)#101 |
| 2. | Hobbs | 60.4% | 6.2%(+54.2)#2 | 7.2%(+53.2)#166 |
| 3. | Scipio | 55.9% | 6.2%(+49.8)#3 | 7.2%(+48.7)#199 |
| 4. | Landess | 53.7% | 6.2%(+47.5)#4 | 7.2%(+46.4)#232 |
| 5. | Big Lake | 51.7% | 6.2%(+45.6)#5 | 7.2%(+44.5)#254 |
| 6. | Taswell | 46.4% | 6.2%(+40.3)#6 | 7.2%(+39.2)#351 |
| 7. | Cowan | 45.9% | 6.2%(+39.8)#7 | 7.2%(+38.7)#360 |
| 8. | Ragsdale | 44.4% | 6.2%(+38.3)#8 | 7.2%(+37.2)#382 |
| 9. | River Forest | 44.4% | 6.2%(+38.3)#9 | 7.2%(+37.2)#387 |
| 10. | Buckskin | 42.9% | 6.2%(+36.7)#10 | 7.2%(+35.6)#416 |
| 11. | Millgrove | 42.4% | 6.2%(+36.3)#11 | 7.2%(+35.2)#425 |
| 12. | Grayford | 40.0% | 6.2%(+33.8)#12 | 7.2%(+32.8)#472 |
| 13. | Sandusky | 40.0% | 6.2%(+33.8)#13 | 7.2%(+32.8)#476 |
| 14. | Blue Ridge | 39.3% | 6.2%(+33.2)#14 | 7.2%(+32.1)#486 |
| 15. | Graysville | 36.8% | 6.2%(+30.7)#15 | 7.2%(+29.6)#573 |
| 16. | Fontanet | 35.1% | 6.2%(+28.9)#16 | 7.2%(+27.8)#646 |
| 17. | Straughn | 35.0% | 6.2%(+28.8)#17 | 7.2%(+27.7)#650 |
| 18. | Wyatt | 34.5% | 6.2%(+28.4)#18 | 7.2%(+27.3)#671 |
| 19. | Gwynneville | 34.5% | 6.2%(+28.3)#19 | 7.2%(+27.2)#674 |
| 20. | Petroleum | 34.4% | 6.2%(+28.2)#20 | 7.2%(+27.1)#677 |
| 21. | Andersonville | 33.0% | 6.2%(+26.8)#21 | 7.2%(+25.8)#750 |
| 22. | Chain-O-Lakes | 31.5% | 6.2%(+25.3)#22 | 7.2%(+24.3)#809 |
| 23. | Bridgeton | 31.4% | 6.2%(+25.3)#23 | 7.2%(+24.2)#816 |
| 24. | New London | 31.2% | 6.2%(+25.1)#24 | 7.2%(+24.0)#826 |
| 25. | Mariah Hill | 27.0% | 6.2%(+20.8)#25 | 7.2%(+19.8)#1,110 |
| 26. | Montmorenci | 26.0% | 6.2%(+19.8)#26 | 7.2%(+18.7)#1,200 |
| 27. | Webster | 25.0% | 6.2%(+18.8)#27 | 7.2%(+17.8)#1,285 |
| 28. | Flat Rock | 24.8% | 6.2%(+18.6)#28 | 7.2%(+17.6)#1,328 |
| 29. | Marion | 23.6% | 6.2%(+17.4)#29 | 7.2%(+16.4)#1,445 |
| 30. | Blairsville | 22.9% | 6.2%(+16.7)#30 | 7.2%(+15.6)#1,547 |
| 31. | Losantville | 22.7% | 6.2%(+16.6)#31 | 7.2%(+15.5)#1,559 |
| 32. | Rob Roy | 22.7% | 6.2%(+16.6)#32 | 7.2%(+15.5)#1,562 |
| 33. | Bennetts Switch | 22.6% | 6.2%(+16.4)#33 | 7.2%(+15.3)#1,588 |
| 34. | Idaville | 22.4% | 6.2%(+16.3)#34 | 7.2%(+15.2)#1,611 |
| 35. | Waynesville | 22.4% | 6.2%(+16.2)#35 | 7.2%(+15.1)#1,621 |
| 36. | North Terre Haute | 21.7% | 6.2%(+15.5)#36 | 7.2%(+14.4)#1,736 |
| 37. | Newport | 21.6% | 6.2%(+15.4)#37 | 7.2%(+14.4)#1,749 |
| 38. | Delaware | 21.5% | 6.2%(+15.3)#38 | 7.2%(+14.2)#1,770 |
| 39. | Union Mills | 21.1% | 6.2%(+14.9)#39 | 7.2%(+13.9)#1,832 |
| 40. | Patricksburg | 21.0% | 6.2%(+14.8)#40 | 7.2%(+13.8)#1,856 |
| 41. | Morris | 20.7% | 6.2%(+14.5)#41 | 7.2%(+13.4)#1,923 |
| 42. | Hillsdale | 20.4% | 6.2%(+14.2)#42 | 7.2%(+13.1)#1,983 |
| 43. | Bloomingdale | 20.0% | 6.2%(+13.8)#43 | 7.2%(+12.8)#2,036 |
| 44. | Mace | 20.0% | 6.2%(+13.8)#44 | 7.2%(+12.8)#2,045 |
| 45. | Everton | 19.3% | 6.2%(+13.1)#45 | 7.2%(+12.0)#2,205 |
| 46. | Owensburg | 19.0% | 6.2%(+12.9)#46 | 7.2%(+11.8)#2,264 |
| 47. | Medaryville | 18.9% | 6.2%(+12.7)#47 | 7.2%(+11.6)#2,328 |
| 48. | Cedar Grove | 18.8% | 6.2%(+12.6)#48 | 7.2%(+11.6)#2,344 |
| 49. | Tipton | 18.6% | 6.2%(+12.4)#49 | 7.2%(+11.3)#2,410 |
| 50. | Bringhurst | 18.4% | 6.2%(+12.2)#50 | 7.2%(+11.2)#2,448 |
| 51. | Chili | 18.4% | 6.2%(+12.2)#51 | 7.2%(+11.2)#2,449 |
| 52. | Burlington | 18.2% | 6.2%(+12.0)#52 | 7.2%(+11.0)#2,508 |
| 53. | Cadiz | 18.2% | 6.2%(+12.0)#53 | 7.2%(+11.0)#2,519 |
| 54. | Van Bibber Lake | 17.7% | 6.2%(+11.5)#54 | 7.2%(+10.5)#2,649 |
| 55. | Deer Creek | 17.5% | 6.2%(+11.4)#55 | 7.2%(+10.3)#2,706 |
| 56. | Homer | 17.5% | 6.2%(+11.3)#56 | 7.2%(+10.2)#2,741 |
| 57. | Fairbanks | 17.2% | 6.2%(+11.0)#57 | 7.2%(+9.97)#2,829 |
| 58. | Carrollton | 17.0% | 6.2%(+10.9)#58 | 7.2%(+9.81)#2,873 |
| 59. | Alford | 17.0% | 6.2%(+10.8)#59 | 7.2%(+9.79)#2,878 |
| 60. | English | 16.7% | 6.2%(+10.5)#60 | 7.2%(+9.44)#2,994 |
| 61. | Glezen | 16.7% | 6.2%(+10.5)#61 | 7.2%(+9.44)#3,010 |
| 62. | Covington | 16.6% | 6.2%(+10.4)#62 | 7.2%(+9.38)#3,065 |
| 63. | Dugger | 16.4% | 6.2%(+10.3)#63 | 7.2%(+9.22)#3,128 |
| 64. | Needmore | 16.3% | 6.2%(+10.1)#64 | 7.2%(+9.05)#3,209 |
| 65. | Walkerton | 16.1% | 6.2%(+9.92)#65 | 7.2%(+8.87)#3,290 |
| 66. | Butlerville | 16.0% | 6.2%(+9.88)#66 | 7.2%(+8.82)#3,316 |
| 67. | St. Anthony | 15.8% | 6.2%(+9.65)#67 | 7.2%(+8.60)#3,423 |
| 68. | Folsomville | 15.5% | 6.2%(+9.29)#68 | 7.2%(+8.24)#3,619 |
| 69. | Wawaka | 15.4% | 6.2%(+9.21)#69 | 7.2%(+8.16)#3,663 |
| 70. | Greendale | 15.3% | 6.2%(+9.15)#70 | 7.2%(+8.10)#3,686 |
| 71. | Sweetser | 15.1% | 6.2%(+8.96)#71 | 7.2%(+7.90)#3,804 |
| 72. | Mulberry | 15.1% | 6.2%(+8.92)#72 | 7.2%(+7.87)#3,826 |
| 73. | Lyford | 15.0% | 6.2%(+8.87)#73 | 7.2%(+7.81)#3,864 |
| 74. | Newberry | 14.9% | 6.2%(+8.72)#74 | 7.2%(+7.67)#3,954 |
| 75. | Union City | 14.8% | 6.2%(+8.67)#75 | 7.2%(+7.62)#3,977 |
| 76. | Blountsville | 14.7% | 6.2%(+8.53)#76 | 7.2%(+7.48)#4,056 |
| 77. | Oxford | 14.6% | 6.2%(+8.47)#77 | 7.2%(+7.42)#4,088 |
| 78. | Highland | 14.5% | 6.2%(+8.34)#78 | 7.2%(+7.29)#4,188 |
| 79. | Monroe | 14.5% | 6.2%(+8.31)#79 | 7.2%(+7.26)#4,213 |
| 80. | Pleasant Lake | 14.5% | 6.2%(+8.30)#80 | 7.2%(+7.24)#4,225 |
| 81. | New Whiteland | 14.5% | 6.2%(+8.29)#81 | 7.2%(+7.23)#4,229 |
| 82. | Spring Grove | 14.4% | 6.2%(+8.20)#82 | 7.2%(+7.14)#4,284 |
| 83. | Belleville | 14.3% | 6.2%(+8.11)#83 | 7.2%(+7.06)#4,328 |
| 84. | Bethany | 14.3% | 6.2%(+8.11)#84 | 7.2%(+7.06)#4,382 |
| 85. | Markleville | 14.2% | 6.2%(+8.01)#85 | 7.2%(+6.96)#4,435 |
| 86. | Rockford | 13.8% | 6.2%(+7.66)#86 | 7.2%(+6.61)#4,695 |
| 87. | Newbern | 13.8% | 6.2%(+7.66)#87 | 7.2%(+6.60)#4,701 |
| 88. | Staunton | 13.7% | 6.2%(+7.55)#88 | 7.2%(+6.50)#4,774 |
| 89. | Schneider | 13.6% | 6.2%(+7.46)#89 | 7.2%(+6.41)#4,849 |
| 90. | Merom | 13.6% | 6.2%(+7.39)#90 | 7.2%(+6.33)#4,898 |
| 91. | Newtown | 13.5% | 6.2%(+7.34)#91 | 7.2%(+6.29)#4,934 |
| 92. | Bass Lake | 13.5% | 6.2%(+7.28)#92 | 7.2%(+6.23)#4,978 |
| 93. | Clayton | 13.4% | 6.2%(+7.18)#93 | 7.2%(+6.13)#5,058 |
| 94. | Owensville | 13.3% | 6.2%(+7.15)#94 | 7.2%(+6.09)#5,100 |
| 95. | Charlestown | 13.3% | 6.2%(+7.12)#95 | 7.2%(+6.06)#5,119 |
| 96. | Stilesville | 13.2% | 6.2%(+7.06)#96 | 7.2%(+6.01)#5,153 |
| 97. | Lake Holiday | 13.2% | 6.2%(+7.05)#97 | 7.2%(+6.00)#5,160 |
| 98. | New Carlisle | 13.1% | 6.2%(+6.91)#98 | 7.2%(+5.86)#5,267 |
| 99. | New Trenton | 13.0% | 6.2%(+6.87)#99 | 7.2%(+5.82)#5,295 |
| 100. | North Salem | 13.0% | 6.2%(+6.86)#100 | 7.2%(+5.80)#5,316 |
Common Questions
What are the Top 10 Cities with the Highest Percentage of Local Government Employees in Indiana?
Top 10 Cities with the Highest Percentage of Local Government Employees in Indiana are:
#1
55.9%
#2
53.7%
#3
44.4%
#4
44.4%
#5
35.1%
#6
35.0%
#7
26.0%
#8
23.6%
#9
22.7%
#10
22.4%
What city has the Highest Percentage of Local Government Employees in Indiana?
Scipio has the Highest Percentage of Local Government Employees in Indiana with 55.9%.
What is the Percentage of Local Government Employees in the State of Indiana?
Percentage of Local Government Employees in Indiana is 6.2%.
What is the Percentage of Local Government Employees in the United States?
Percentage of Local Government Employees in the United States is 7.2%.