Cities with the Highest Percentage of Local Government Employees in Maryland
RELATED REPORTS & OPTIONS
Local Government Employees
Maryland
Compare Cities
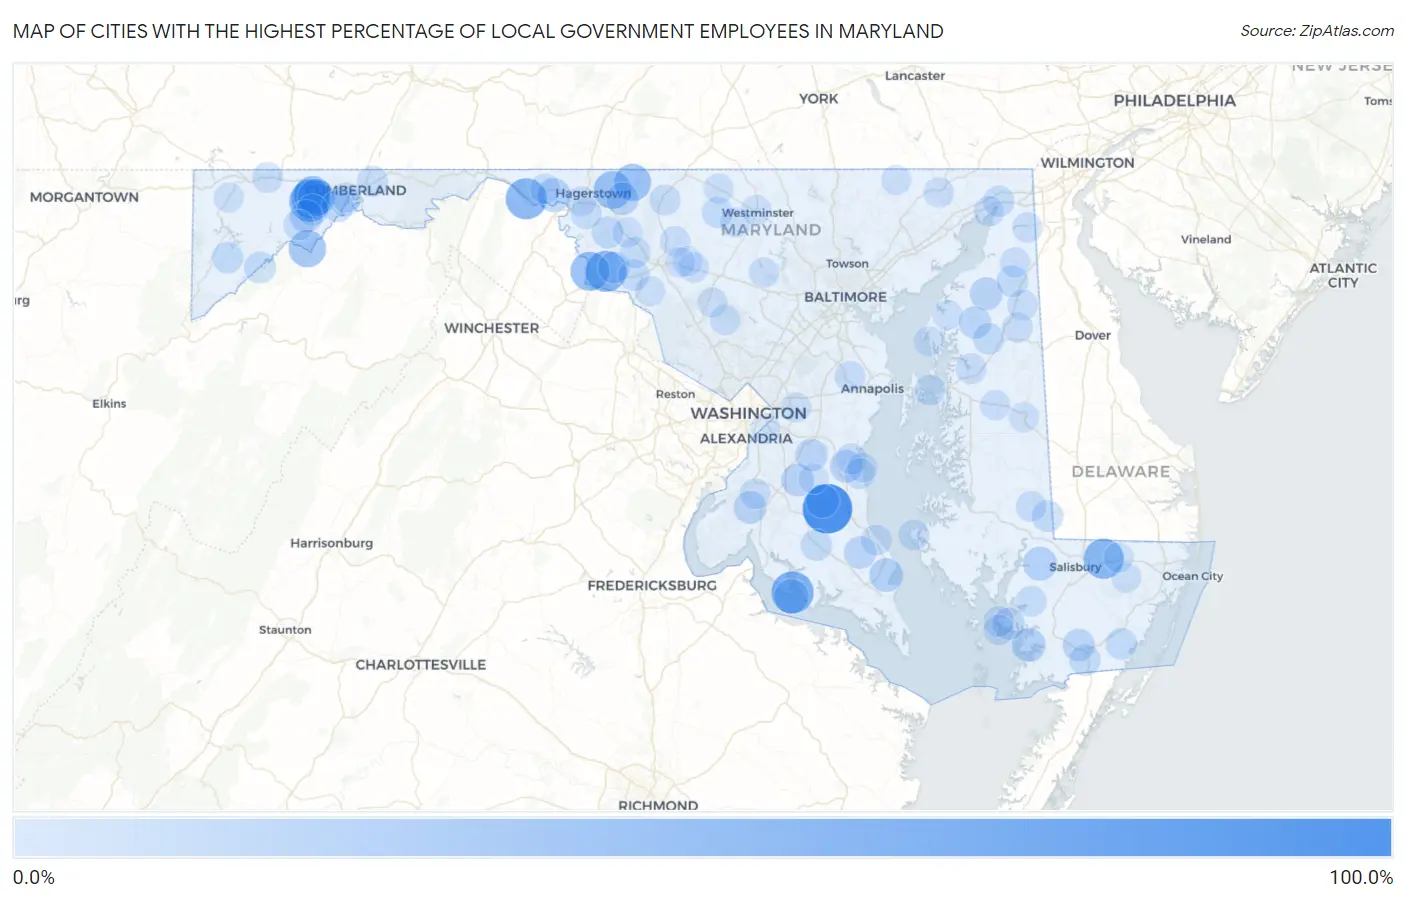
Map of Cities with the Highest Percentage of Local Government Employees in Maryland
0.0%
100.0%
Cities with the Highest Percentage of Local Government Employees in Maryland
| City | % Local Government Employees | vs State | vs National | |
| 1. | Eagle Harbor | 81.2% | 7.4%(+73.9)#1 | 7.2%(+74.0)#82 |
| 2. | Rock Point | 54.5% | 7.4%(+47.2)#2 | 7.2%(+47.3)#216 |
| 3. | Klondike | 50.7% | 7.4%(+43.4)#3 | 7.2%(+43.5)#266 |
| 4. | Big Pool | 50.0% | 7.4%(+42.6)#4 | 7.2%(+42.8)#289 |
| 5. | Brownsville | 50.0% | 7.4%(+42.6)#5 | 7.2%(+42.8)#306 |
| 6. | Parsonsburg | 47.3% | 7.4%(+39.9)#6 | 7.2%(+40.0)#336 |
| 7. | Carlos | 45.9% | 7.4%(+38.6)#7 | 7.2%(+38.7)#361 |
| 8. | Dargan | 42.9% | 7.4%(+35.5)#8 | 7.2%(+35.6)#415 |
| 9. | Midlothian | 38.2% | 7.4%(+30.8)#9 | 7.2%(+31.0)#525 |
| 10. | Chewsville | 38.2% | 7.4%(+30.8)#10 | 7.2%(+31.0)#526 |
| 11. | Edgemont | 36.3% | 7.4%(+28.9)#11 | 7.2%(+29.1)#596 |
| 12. | Mccoole | 36.2% | 7.4%(+28.8)#12 | 7.2%(+29.0)#598 |
| 13. | Shaft | 35.7% | 7.4%(+28.3)#13 | 7.2%(+28.5)#614 |
| 14. | Cedar Heights | 31.3% | 7.4%(+23.9)#14 | 7.2%(+24.1)#821 |
| 15. | Ten Mile Creek | 29.3% | 7.4%(+21.9)#15 | 7.2%(+22.1)#947 |
| 16. | Cobb Island | 27.1% | 7.4%(+19.8)#16 | 7.2%(+19.9)#1,094 |
| 17. | Quantico | 24.5% | 7.4%(+17.2)#17 | 7.2%(+17.3)#1,360 |
| 18. | Charlton | 24.4% | 7.4%(+17.0)#18 | 7.2%(+17.2)#1,369 |
| 19. | Drum Point | 24.3% | 7.4%(+16.9)#19 | 7.2%(+17.1)#1,378 |
| 20. | Fairmount | 23.8% | 7.4%(+16.4)#20 | 7.2%(+16.6)#1,425 |
| 21. | Aquasco | 23.2% | 7.4%(+15.9)#21 | 7.2%(+16.0)#1,491 |
| 22. | Kennedyville | 21.2% | 7.4%(+13.8)#22 | 7.2%(+13.9)#1,821 |
| 23. | Lonaconing | 21.0% | 7.4%(+13.6)#23 | 7.2%(+13.7)#1,858 |
| 24. | Cedarville | 20.9% | 7.4%(+13.5)#24 | 7.2%(+13.7)#1,866 |
| 25. | Pomfret | 20.9% | 7.4%(+13.5)#25 | 7.2%(+13.6)#1,876 |
| 26. | Owings | 20.7% | 7.4%(+13.3)#26 | 7.2%(+13.5)#1,913 |
| 27. | Pondsville | 20.6% | 7.4%(+13.3)#27 | 7.2%(+13.4)#1,928 |
| 28. | Croom | 20.3% | 7.4%(+12.9)#28 | 7.2%(+13.0)#1,998 |
| 29. | Broomes Island | 19.9% | 7.4%(+12.6)#29 | 7.2%(+12.7)#2,073 |
| 30. | Kingstown | 19.6% | 7.4%(+12.2)#30 | 7.2%(+12.3)#2,142 |
| 31. | West Pocomoke | 18.9% | 7.4%(+11.5)#31 | 7.2%(+11.7)#2,308 |
| 32. | Dames Quarter | 18.3% | 7.4%(+10.9)#32 | 7.2%(+11.1)#2,490 |
| 33. | Boonsboro | 17.5% | 7.4%(+10.1)#33 | 7.2%(+10.3)#2,719 |
| 34. | Green Valley | 17.3% | 7.4%(+9.91)#34 | 7.2%(+10.1)#2,802 |
| 35. | Burkittsville | 17.1% | 7.4%(+9.76)#35 | 7.2%(+9.92)#2,844 |
| 36. | Cresaptown | 17.1% | 7.4%(+9.69)#36 | 7.2%(+9.85)#2,860 |
| 37. | Gilmore | 17.1% | 7.4%(+9.67)#37 | 7.2%(+9.82)#2,870 |
| 38. | Kitzmiller | 17.0% | 7.4%(+9.66)#38 | 7.2%(+9.82)#2,871 |
| 39. | Galena | 16.7% | 7.4%(+9.28)#39 | 7.2%(+9.44)#2,997 |
| 40. | Girdletree | 16.7% | 7.4%(+9.28)#40 | 7.2%(+9.44)#3,022 |
| 41. | Church Hill | 16.6% | 7.4%(+9.25)#41 | 7.2%(+9.41)#3,051 |
| 42. | Mechanicsville | 16.6% | 7.4%(+9.22)#42 | 7.2%(+9.37)#3,067 |
| 43. | Sharptown | 16.5% | 7.4%(+9.12)#43 | 7.2%(+9.27)#3,111 |
| 44. | Deer Park | 16.2% | 7.4%(+8.83)#44 | 7.2%(+8.99)#3,231 |
| 45. | Jefferson | 16.1% | 7.4%(+8.73)#45 | 7.2%(+8.89)#3,283 |
| 46. | North East | 15.9% | 7.4%(+8.47)#46 | 7.2%(+8.62)#3,403 |
| 47. | Pocomoke City | 15.7% | 7.4%(+8.28)#47 | 7.2%(+8.43)#3,521 |
| 48. | Kent Narrows | 15.0% | 7.4%(+7.66)#48 | 7.2%(+7.81)#3,859 |
| 49. | Middletown | 14.9% | 7.4%(+7.54)#49 | 7.2%(+7.69)#3,935 |
| 50. | Union Bridge | 14.8% | 7.4%(+7.42)#50 | 7.2%(+7.57)#4,005 |
| 51. | Mount Vernon | 14.7% | 7.4%(+7.32)#51 | 7.2%(+7.48)#4,050 |
| 52. | Pleasant Grove | 14.7% | 7.4%(+7.32)#52 | 7.2%(+7.48)#4,052 |
| 53. | Grantsville | 14.6% | 7.4%(+7.17)#53 | 7.2%(+7.33)#4,160 |
| 54. | Centreville | 14.5% | 7.4%(+7.15)#54 | 7.2%(+7.31)#4,175 |
| 55. | Thurmont | 14.5% | 7.4%(+7.12)#55 | 7.2%(+7.28)#4,193 |
| 56. | Long Beach | 14.4% | 7.4%(+7.02)#56 | 7.2%(+7.17)#4,264 |
| 57. | Friendship | 14.3% | 7.4%(+6.90)#57 | 7.2%(+7.06)#4,340 |
| 58. | Taylors Island | 14.3% | 7.4%(+6.90)#58 | 7.2%(+7.06)#4,360 |
| 59. | Brookview | 14.3% | 7.4%(+6.90)#59 | 7.2%(+7.06)#4,381 |
| 60. | Crownsville | 14.3% | 7.4%(+6.88)#60 | 7.2%(+7.03)#4,395 |
| 61. | Chesapeake Beach | 14.2% | 7.4%(+6.85)#61 | 7.2%(+7.01)#4,404 |
| 62. | Millington | 14.2% | 7.4%(+6.81)#62 | 7.2%(+6.97)#4,424 |
| 63. | St James | 14.1% | 7.4%(+6.70)#63 | 7.2%(+6.85)#4,532 |
| 64. | Chance | 14.0% | 7.4%(+6.67)#64 | 7.2%(+6.82)#4,559 |
| 65. | Deal Island | 13.9% | 7.4%(+6.54)#65 | 7.2%(+6.70)#4,636 |
| 66. | Bensville | 13.9% | 7.4%(+6.49)#66 | 7.2%(+6.65)#4,676 |
| 67. | Barton | 13.8% | 7.4%(+6.43)#67 | 7.2%(+6.58)#4,712 |
| 68. | Laytonsville | 13.5% | 7.4%(+6.09)#68 | 7.2%(+6.25)#4,965 |
| 69. | Sudlersville | 13.5% | 7.4%(+6.08)#69 | 7.2%(+6.23)#4,974 |
| 70. | Myersville | 13.2% | 7.4%(+5.86)#70 | 7.2%(+6.02)#5,143 |
| 71. | Walkersville | 13.2% | 7.4%(+5.83)#71 | 7.2%(+5.99)#5,165 |
| 72. | Charlestown | 13.1% | 7.4%(+5.70)#72 | 7.2%(+5.86)#5,265 |
| 73. | Chesapeake City | 13.0% | 7.4%(+5.65)#73 | 7.2%(+5.80)#5,313 |
| 74. | Potomac Park | 12.9% | 7.4%(+5.55)#74 | 7.2%(+5.71)#5,399 |
| 75. | Queen Anne | 12.7% | 7.4%(+5.36)#75 | 7.2%(+5.52)#5,569 |
| 76. | Sykesville | 12.7% | 7.4%(+5.36)#76 | 7.2%(+5.51)#5,572 |
| 77. | Clear Spring | 12.7% | 7.4%(+5.29)#77 | 7.2%(+5.44)#5,626 |
| 78. | Darlington | 12.6% | 7.4%(+5.18)#78 | 7.2%(+5.33)#5,725 |
| 79. | Halfway | 12.5% | 7.4%(+5.14)#79 | 7.2%(+5.29)#5,753 |
| 80. | New Market | 12.5% | 7.4%(+5.12)#80 | 7.2%(+5.27)#5,764 |
| 81. | Cecilton | 12.5% | 7.4%(+5.09)#81 | 7.2%(+5.24)#5,818 |
| 82. | New Windsor | 12.5% | 7.4%(+5.07)#82 | 7.2%(+5.23)#5,826 |
| 83. | Adamstown | 12.4% | 7.4%(+5.04)#83 | 7.2%(+5.20)#5,849 |
| 84. | Westminster | 12.4% | 7.4%(+4.99)#84 | 7.2%(+5.15)#5,885 |
| 85. | Taneytown | 12.4% | 7.4%(+4.97)#85 | 7.2%(+5.12)#5,908 |
| 86. | Rock Hall | 12.3% | 7.4%(+4.96)#86 | 7.2%(+5.11)#5,923 |
| 87. | Pylesville | 12.3% | 7.4%(+4.94)#87 | 7.2%(+5.09)#5,940 |
| 88. | Denton | 12.3% | 7.4%(+4.92)#88 | 7.2%(+5.08)#5,951 |
| 89. | Linganore | 12.3% | 7.4%(+4.91)#89 | 7.2%(+5.07)#5,964 |
| 90. | Damascus | 12.3% | 7.4%(+4.88)#90 | 7.2%(+5.04)#6,018 |
| 91. | Spring Ridge | 12.2% | 7.4%(+4.85)#91 | 7.2%(+5.00)#6,051 |
| 92. | Hillcrest Heights | 12.2% | 7.4%(+4.85)#92 | 7.2%(+5.00)#6,060 |
| 93. | Powellville | 12.2% | 7.4%(+4.78)#93 | 7.2%(+4.93)#6,141 |
| 94. | Pittsville | 12.1% | 7.4%(+4.77)#94 | 7.2%(+4.92)#6,159 |
| 95. | Baden | 12.1% | 7.4%(+4.73)#95 | 7.2%(+4.89)#6,203 |
| 96. | Bowling Green | 12.1% | 7.4%(+4.72)#96 | 7.2%(+4.88)#6,207 |
| 97. | Accident | 12.1% | 7.4%(+4.68)#97 | 7.2%(+4.83)#6,250 |
| 98. | Fairlee | 11.9% | 7.4%(+4.50)#98 | 7.2%(+4.66)#6,427 |
| 99. | Lake Arbor | 11.9% | 7.4%(+4.49)#99 | 7.2%(+4.65)#6,438 |
| 100. | North Beach | 11.9% | 7.4%(+4.48)#100 | 7.2%(+4.64)#6,455 |
Common Questions
What are the Top 10 Cities with the Highest Percentage of Local Government Employees in Maryland?
Top 10 Cities with the Highest Percentage of Local Government Employees in Maryland are:
#1
81.2%
#2
54.5%
#3
50.7%
#4
50.0%
#5
50.0%
#6
47.3%
#7
45.9%
#8
42.9%
#9
38.2%
#10
38.2%
What city has the Highest Percentage of Local Government Employees in Maryland?
Eagle Harbor has the Highest Percentage of Local Government Employees in Maryland with 81.2%.
What is the Percentage of Local Government Employees in the State of Maryland?
Percentage of Local Government Employees in Maryland is 7.4%.
What is the Percentage of Local Government Employees in the United States?
Percentage of Local Government Employees in the United States is 7.2%.