Cities with the Highest Percentage of Local Government Employees in Utah
RELATED REPORTS & OPTIONS
Local Government Employees
Utah
Compare Cities
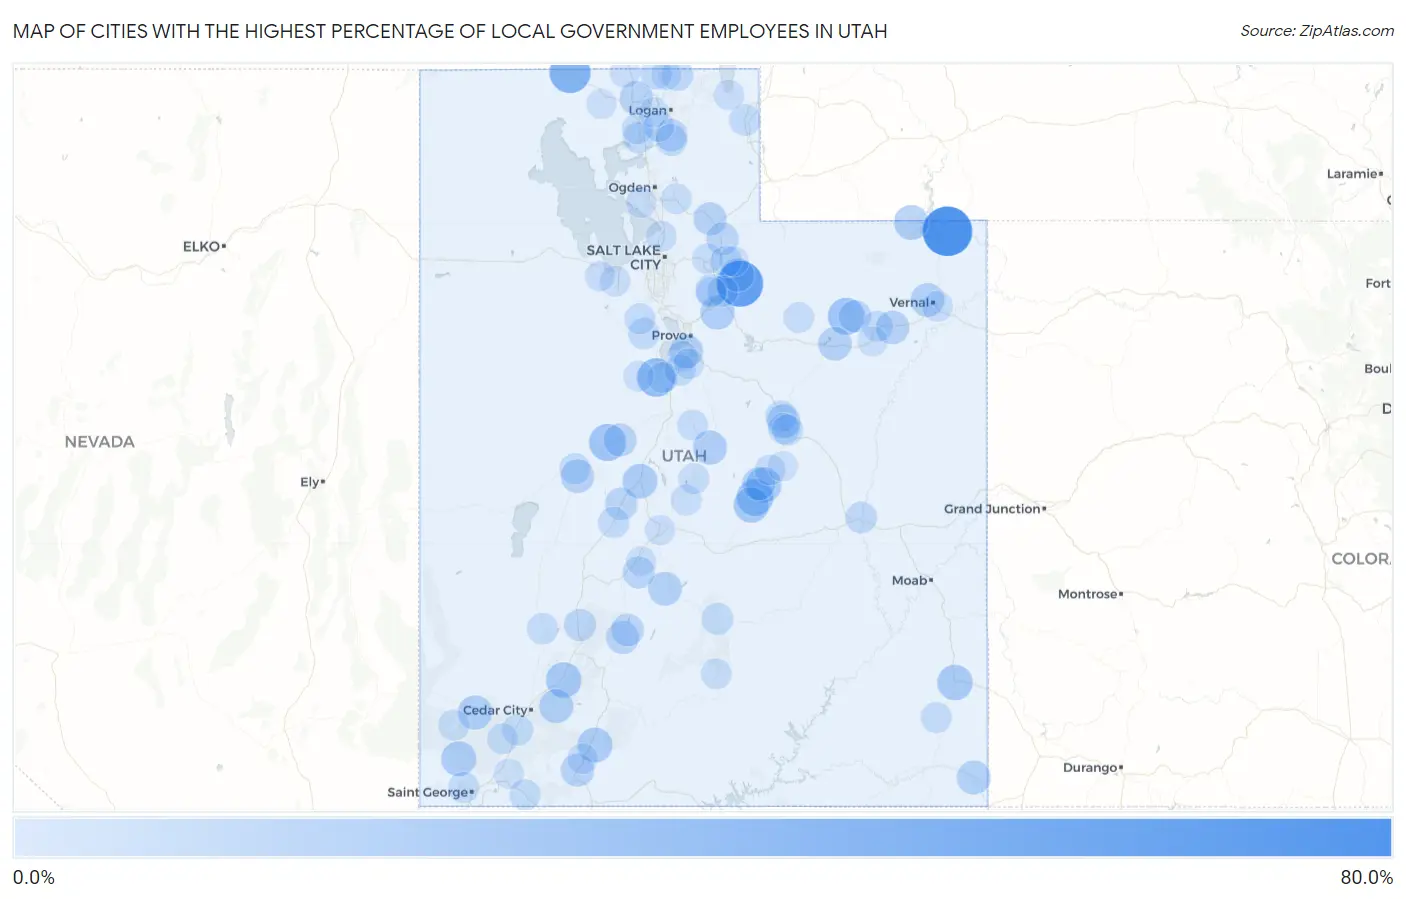
Map of Cities with the Highest Percentage of Local Government Employees in Utah
0.0%
80.0%
Cities with the Highest Percentage of Local Government Employees in Utah
| City | % Local Government Employees | vs State | vs National | |
| 1. | Dutch John | 62.5% | 6.5%(+56.0)#1 | 7.2%(+55.3)#151 |
| 2. | Woodland | 53.2% | 6.5%(+46.6)#2 | 7.2%(+45.9)#237 |
| 3. | Lapoint | 43.8% | 6.5%(+37.2)#3 | 7.2%(+36.5)#401 |
| 4. | Snowville | 39.0% | 6.5%(+32.5)#4 | 7.2%(+31.8)#499 |
| 5. | Elberta | 31.9% | 6.5%(+25.3)#5 | 7.2%(+24.6)#792 |
| 6. | Lynndyl | 28.0% | 6.5%(+21.5)#6 | 7.2%(+20.8)#1,023 |
| 7. | Altamont | 27.4% | 6.5%(+20.9)#7 | 7.2%(+20.2)#1,066 |
| 8. | Clawson | 27.3% | 6.5%(+20.7)#8 | 7.2%(+20.0)#1,083 |
| 9. | Paragonah | 23.9% | 6.5%(+17.4)#9 | 7.2%(+16.7)#1,418 |
| 10. | Castle Dale | 23.7% | 6.5%(+17.2)#10 | 7.2%(+16.5)#1,437 |
| 11. | Monticello | 23.6% | 6.5%(+17.1)#11 | 7.2%(+16.4)#1,443 |
| 12. | Ferron | 23.5% | 6.5%(+17.0)#12 | 7.2%(+16.3)#1,455 |
| 13. | Veyo | 22.7% | 6.5%(+16.2)#13 | 7.2%(+15.5)#1,566 |
| 14. | Alton | 22.5% | 6.5%(+16.0)#14 | 7.2%(+15.3)#1,593 |
| 15. | Manila | 22.2% | 6.5%(+15.7)#15 | 7.2%(+15.0)#1,649 |
| 16. | Scipio | 21.9% | 6.5%(+15.4)#16 | 7.2%(+14.7)#1,700 |
| 17. | Wallsburg | 20.7% | 6.5%(+14.2)#17 | 7.2%(+13.5)#1,912 |
| 18. | Newcastle | 20.7% | 6.5%(+14.2)#18 | 7.2%(+13.5)#1,916 |
| 19. | Spring City | 20.4% | 6.5%(+13.9)#19 | 7.2%(+13.2)#1,977 |
| 20. | Aneth | 20.0% | 6.5%(+13.5)#20 | 7.2%(+12.8)#2,038 |
| 21. | Brian Head | 20.0% | 6.5%(+13.5)#21 | 7.2%(+12.8)#2,053 |
| 22. | Maeser | 19.7% | 6.5%(+13.2)#22 | 7.2%(+12.5)#2,111 |
| 23. | Koosharem | 19.4% | 6.5%(+12.9)#23 | 7.2%(+12.2)#2,161 |
| 24. | Palmyra | 19.0% | 6.5%(+12.5)#24 | 7.2%(+11.8)#2,277 |
| 25. | Spring Glen | 18.8% | 6.5%(+12.3)#25 | 7.2%(+11.6)#2,340 |
| 26. | Duchesne | 18.8% | 6.5%(+12.2)#26 | 7.2%(+11.5)#2,356 |
| 27. | Fort Duchesne | 18.8% | 6.5%(+12.2)#27 | 7.2%(+11.5)#2,361 |
| 28. | Samak | 18.6% | 6.5%(+12.1)#28 | 7.2%(+11.4)#2,401 |
| 29. | Deseret | 18.6% | 6.5%(+12.0)#29 | 7.2%(+11.3)#2,414 |
| 30. | Orderville | 18.2% | 6.5%(+11.7)#30 | 7.2%(+11.0)#2,514 |
| 31. | Orangeville | 18.0% | 6.5%(+11.5)#31 | 7.2%(+10.8)#2,567 |
| 32. | Henefer | 17.8% | 6.5%(+11.3)#32 | 7.2%(+10.6)#2,629 |
| 33. | Riverside | 17.7% | 6.5%(+11.2)#33 | 7.2%(+10.5)#2,640 |
| 34. | Leamington | 17.5% | 6.5%(+10.9)#34 | 7.2%(+10.2)#2,737 |
| 35. | Circleville | 17.3% | 6.5%(+10.8)#35 | 7.2%(+10.1)#2,795 |
| 36. | Junction | 16.7% | 6.5%(+10.1)#36 | 7.2%(+9.44)#3,007 |
| 37. | Hoytsville | 16.5% | 6.5%(+9.92)#37 | 7.2%(+9.23)#3,121 |
| 38. | Holden | 16.3% | 6.5%(+9.79)#38 | 7.2%(+9.09)#3,188 |
| 39. | Bluebell | 15.9% | 6.5%(+9.38)#39 | 7.2%(+8.68)#3,370 |
| 40. | Paradise | 15.3% | 6.5%(+8.81)#40 | 7.2%(+8.12)#3,679 |
| 41. | Beaver | 15.3% | 6.5%(+8.76)#41 | 7.2%(+8.07)#3,707 |
| 42. | Monroe | 15.1% | 6.5%(+8.53)#42 | 7.2%(+7.83)#3,850 |
| 43. | Interlaken | 14.5% | 6.5%(+8.01)#43 | 7.2%(+7.32)#4,170 |
| 44. | Cove | 14.5% | 6.5%(+7.93)#44 | 7.2%(+7.23)#4,232 |
| 45. | Avon | 14.2% | 6.5%(+7.63)#45 | 7.2%(+6.93)#4,463 |
| 46. | Green River | 14.1% | 6.5%(+7.60)#46 | 7.2%(+6.90)#4,490 |
| 47. | Torrey | 14.0% | 6.5%(+7.42)#47 | 7.2%(+6.73)#4,610 |
| 48. | Corinne | 13.9% | 6.5%(+7.40)#48 | 7.2%(+6.71)#4,625 |
| 49. | Cornish | 13.9% | 6.5%(+7.38)#49 | 7.2%(+6.69)#4,645 |
| 50. | Helper | 13.9% | 6.5%(+7.36)#50 | 7.2%(+6.66)#4,658 |
| 51. | Randolph | 13.7% | 6.5%(+7.15)#51 | 7.2%(+6.46)#4,808 |
| 52. | Fairfield | 13.5% | 6.5%(+6.93)#52 | 7.2%(+6.23)#4,977 |
| 53. | West Wood | 13.2% | 6.5%(+6.71)#53 | 7.2%(+6.01)#5,148 |
| 54. | Kanarraville | 13.1% | 6.5%(+6.59)#54 | 7.2%(+5.90)#5,245 |
| 55. | Fillmore | 13.0% | 6.5%(+6.49)#55 | 7.2%(+5.80)#5,319 |
| 56. | Minersville | 13.0% | 6.5%(+6.43)#56 | 7.2%(+5.74)#5,371 |
| 57. | Spring Lake | 12.9% | 6.5%(+6.39)#57 | 7.2%(+5.69)#5,415 |
| 58. | Peoa | 12.9% | 6.5%(+6.33)#58 | 7.2%(+5.63)#5,461 |
| 59. | Roosevelt | 12.8% | 6.5%(+6.26)#59 | 7.2%(+5.57)#5,523 |
| 60. | Price | 12.7% | 6.5%(+6.16)#60 | 7.2%(+5.47)#5,607 |
| 61. | Apple Valley | 12.7% | 6.5%(+6.16)#61 | 7.2%(+5.46)#5,610 |
| 62. | Hinckley | 12.7% | 6.5%(+6.14)#62 | 7.2%(+5.44)#5,625 |
| 63. | Santa Clara | 12.6% | 6.5%(+6.04)#63 | 7.2%(+5.34)#5,717 |
| 64. | Bear River City | 12.5% | 6.5%(+5.97)#64 | 7.2%(+5.27)#5,766 |
| 65. | Wellsville | 12.4% | 6.5%(+5.89)#65 | 7.2%(+5.19)#5,854 |
| 66. | Blanding | 12.4% | 6.5%(+5.82)#66 | 7.2%(+5.12)#5,910 |
| 67. | Cedar Fort | 12.3% | 6.5%(+5.81)#67 | 7.2%(+5.12)#5,921 |
| 68. | Enterprise | 12.3% | 6.5%(+5.74)#68 | 7.2%(+5.04)#6,017 |
| 69. | Heber | 12.1% | 6.5%(+5.57)#69 | 7.2%(+4.88)#6,209 |
| 70. | Naples | 12.1% | 6.5%(+5.54)#70 | 7.2%(+4.84)#6,240 |
| 71. | Mayfield | 12.0% | 6.5%(+5.47)#71 | 7.2%(+4.77)#6,315 |
| 72. | Manti | 11.9% | 6.5%(+5.37)#72 | 7.2%(+4.68)#6,413 |
| 73. | Tabiona | 11.9% | 6.5%(+5.33)#73 | 7.2%(+4.64)#6,451 |
| 74. | New Harmony | 11.8% | 6.5%(+5.27)#74 | 7.2%(+4.58)#6,509 |
| 75. | Silver Summit | 11.7% | 6.5%(+5.18)#75 | 7.2%(+4.49)#6,615 |
| 76. | Benjamin | 11.7% | 6.5%(+5.17)#76 | 7.2%(+4.47)#6,632 |
| 77. | West Bountiful | 11.6% | 6.5%(+5.05)#77 | 7.2%(+4.36)#6,755 |
| 78. | Fountain Green | 11.5% | 6.5%(+4.99)#78 | 7.2%(+4.29)#6,833 |
| 79. | Mountain Green | 11.5% | 6.5%(+4.98)#79 | 7.2%(+4.28)#6,840 |
| 80. | Boulder | 11.5% | 6.5%(+4.97)#80 | 7.2%(+4.28)#6,846 |
| 81. | Goshen | 11.5% | 6.5%(+4.95)#81 | 7.2%(+4.25)#6,876 |
| 82. | Midway | 11.5% | 6.5%(+4.95)#82 | 7.2%(+4.25)#6,878 |
| 83. | Huntington | 11.5% | 6.5%(+4.94)#83 | 7.2%(+4.24)#6,891 |
| 84. | Erda | 11.4% | 6.5%(+4.91)#84 | 7.2%(+4.21)#6,922 |
| 85. | West Point | 11.4% | 6.5%(+4.87)#85 | 7.2%(+4.18)#6,976 |
| 86. | Glendale | 11.3% | 6.5%(+4.73)#86 | 7.2%(+4.03)#7,144 |
| 87. | Eureka | 11.2% | 6.5%(+4.69)#87 | 7.2%(+3.99)#7,193 |
| 88. | Salem | 11.2% | 6.5%(+4.68)#88 | 7.2%(+3.99)#7,206 |
| 89. | Portage | 11.1% | 6.5%(+4.58)#89 | 7.2%(+3.88)#7,328 |
| 90. | Laketown | 10.9% | 6.5%(+4.37)#90 | 7.2%(+3.67)#7,597 |
| 91. | Grantsville | 10.8% | 6.5%(+4.24)#91 | 7.2%(+3.54)#7,764 |
| 92. | Aurora | 10.6% | 6.5%(+4.07)#92 | 7.2%(+3.38)#7,989 |
| 93. | Oakley | 10.6% | 6.5%(+4.07)#93 | 7.2%(+3.37)#7,993 |
| 94. | La Verkin | 10.6% | 6.5%(+4.05)#94 | 7.2%(+3.35)#8,015 |
| 95. | Cleveland | 10.5% | 6.5%(+3.97)#95 | 7.2%(+3.27)#8,139 |
| 96. | Myton | 10.5% | 6.5%(+3.95)#96 | 7.2%(+3.25)#8,181 |
| 97. | Mendon | 10.4% | 6.5%(+3.91)#97 | 7.2%(+3.21)#8,228 |
| 98. | Howell | 10.4% | 6.5%(+3.84)#98 | 7.2%(+3.14)#8,351 |
| 99. | Central Valley | 10.3% | 6.5%(+3.78)#99 | 7.2%(+3.08)#8,446 |
| 100. | Lewiston | 10.2% | 6.5%(+3.63)#100 | 7.2%(+2.94)#8,642 |
Common Questions
What are the Top 10 Cities with the Highest Percentage of Local Government Employees in Utah?
Top 10 Cities with the Highest Percentage of Local Government Employees in Utah are:
#1
62.5%
#2
53.2%
#3
39.0%
#4
31.9%
#5
28.0%
#6
27.4%
#7
27.3%
#8
23.9%
#9
23.7%
#10
23.6%
What city has the Highest Percentage of Local Government Employees in Utah?
Dutch John has the Highest Percentage of Local Government Employees in Utah with 62.5%.
What is the Percentage of Local Government Employees in the State of Utah?
Percentage of Local Government Employees in Utah is 6.5%.
What is the Percentage of Local Government Employees in the United States?
Percentage of Local Government Employees in the United States is 7.2%.