Cities with the Highest Percentage of Local Government Employees in Oregon
RELATED REPORTS & OPTIONS
Local Government Employees
Oregon
Compare Cities
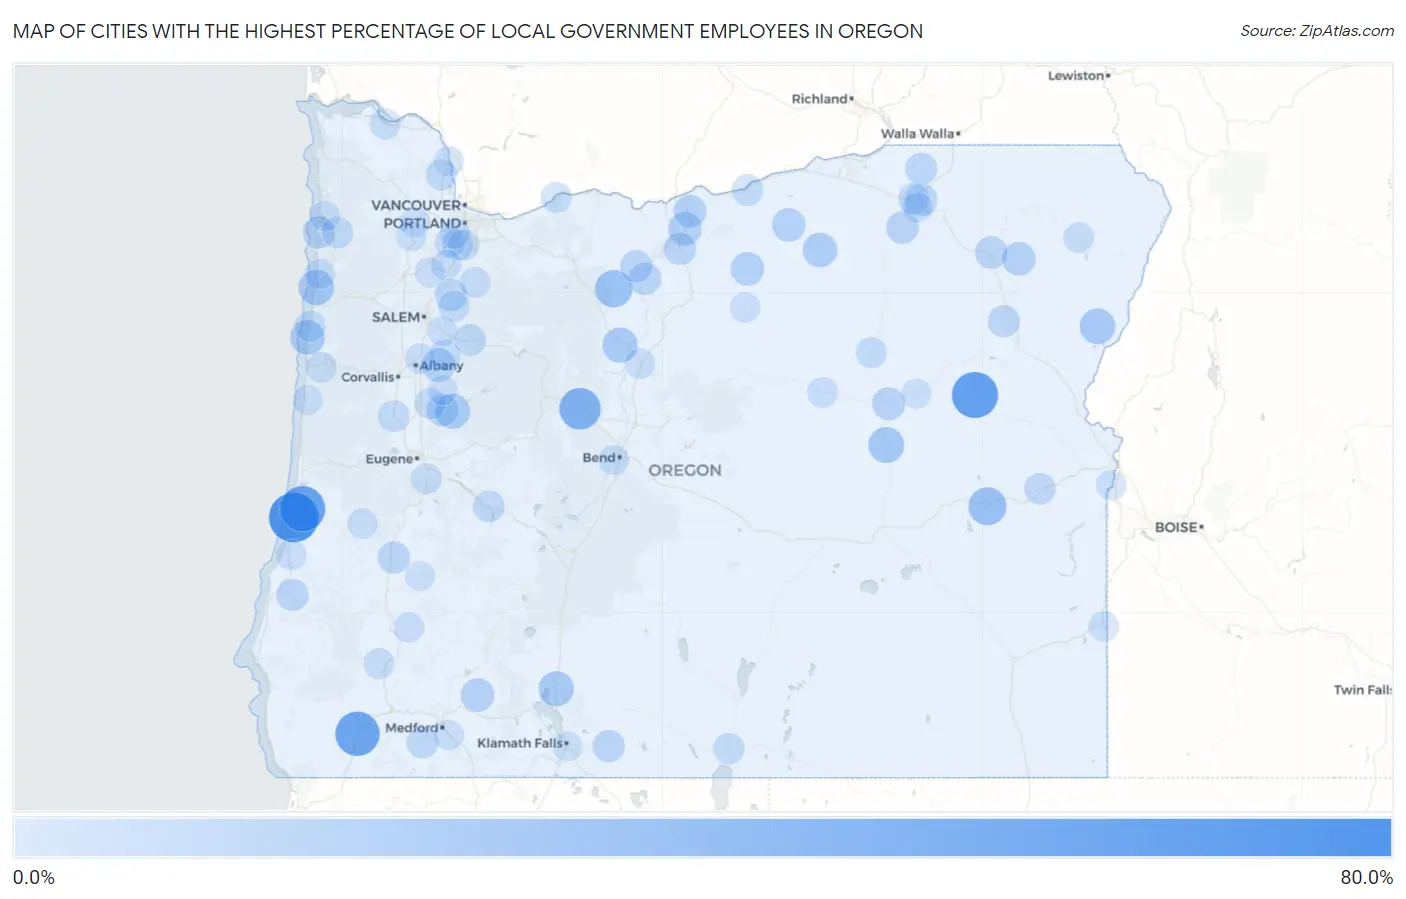
Map of Cities with the Highest Percentage of Local Government Employees in Oregon
0.0%
80.0%
Cities with the Highest Percentage of Local Government Employees in Oregon
| City | % Local Government Employees | vs State | vs National | |
| 1. | Winchester Bay | 79.1% | 6.9%(+72.1)#1 | 7.2%(+71.8)#86 |
| 2. | Unity | 66.7% | 6.9%(+59.7)#2 | 7.2%(+59.4)#131 |
| 3. | Gardiner | 64.7% | 6.9%(+57.8)#3 | 7.2%(+57.5)#139 |
| 4. | Selma | 60.4% | 6.9%(+53.5)#4 | 7.2%(+53.2)#165 |
| 5. | Beaver Marsh | 59.6% | 6.9%(+52.7)#5 | 7.2%(+52.4)#171 |
| 6. | Fort Klamath | 56.2% | 6.9%(+49.3)#6 | 7.2%(+49.0)#195 |
| 7. | Black Butte Ranch | 50.0% | 6.9%(+43.1)#7 | 7.2%(+42.8)#277 |
| 8. | Trent | 42.6% | 6.9%(+35.6)#8 | 7.2%(+35.3)#422 |
| 9. | Juntura | 37.5% | 6.9%(+30.6)#9 | 7.2%(+30.3)#553 |
| 10. | Pine Grove | 35.7% | 6.9%(+28.8)#10 | 7.2%(+28.5)#615 |
| 11. | Seneca | 30.6% | 6.9%(+23.6)#11 | 7.2%(+23.4)#873 |
| 12. | Halfway | 29.4% | 6.9%(+22.4)#12 | 7.2%(+22.1)#941 |
| 13. | Neskowin | 29.2% | 6.9%(+22.3)#13 | 7.2%(+22.0)#949 |
| 14. | Chiloquin | 27.9% | 6.9%(+21.0)#14 | 7.2%(+20.7)#1,028 |
| 15. | Warm Springs | 27.9% | 6.9%(+20.9)#15 | 7.2%(+20.6)#1,033 |
| 16. | Mckay | 27.7% | 6.9%(+20.8)#16 | 7.2%(+20.5)#1,044 |
| 17. | Holley | 27.2% | 6.9%(+20.2)#17 | 7.2%(+20.0)#1,089 |
| 18. | Jasper | 26.5% | 6.9%(+19.5)#18 | 7.2%(+19.2)#1,159 |
| 19. | Depoe Bay | 26.4% | 6.9%(+19.5)#19 | 7.2%(+19.2)#1,164 |
| 20. | Heppner | 25.6% | 6.9%(+18.7)#20 | 7.2%(+18.4)#1,230 |
| 21. | Cheshire | 25.0% | 6.9%(+18.1)#21 | 7.2%(+17.8)#1,280 |
| 22. | Moro | 22.7% | 6.9%(+15.7)#22 | 7.2%(+15.4)#1,569 |
| 23. | Butte Falls | 22.6% | 6.9%(+15.6)#23 | 7.2%(+15.4)#1,580 |
| 24. | Condon | 22.5% | 6.9%(+15.6)#24 | 7.2%(+15.3)#1,595 |
| 25. | Crabtree | 22.4% | 6.9%(+15.4)#25 | 7.2%(+15.2)#1,616 |
| 26. | Cove | 22.3% | 6.9%(+15.4)#26 | 7.2%(+15.1)#1,634 |
| 27. | Ione | 22.1% | 6.9%(+15.1)#27 | 7.2%(+14.8)#1,678 |
| 28. | Wasco | 20.7% | 6.9%(+13.7)#28 | 7.2%(+13.4)#1,924 |
| 29. | Canyon City | 20.4% | 6.9%(+13.4)#29 | 7.2%(+13.2)#1,980 |
| 30. | Pilot Rock | 20.3% | 6.9%(+13.4)#30 | 7.2%(+13.1)#1,991 |
| 31. | Rhododendron | 20.0% | 6.9%(+13.1)#31 | 7.2%(+12.8)#2,046 |
| 32. | Grass Valley | 19.3% | 6.9%(+12.4)#32 | 7.2%(+12.1)#2,201 |
| 33. | Island City | 19.1% | 6.9%(+12.1)#33 | 7.2%(+11.8)#2,255 |
| 34. | Mission | 18.8% | 6.9%(+11.9)#34 | 7.2%(+11.6)#2,336 |
| 35. | Orient | 18.8% | 6.9%(+11.9)#35 | 7.2%(+11.6)#2,345 |
| 36. | Maupin | 18.6% | 6.9%(+11.6)#36 | 7.2%(+11.4)#2,407 |
| 37. | Oakland | 18.5% | 6.9%(+11.6)#37 | 7.2%(+11.3)#2,416 |
| 38. | Saunders Lake | 18.3% | 6.9%(+11.4)#38 | 7.2%(+11.1)#2,480 |
| 39. | Mount Angel | 18.3% | 6.9%(+11.4)#39 | 7.2%(+11.1)#2,491 |
| 40. | Coquille | 18.2% | 6.9%(+11.3)#40 | 7.2%(+11.0)#2,511 |
| 41. | Tygh Valley | 18.2% | 6.9%(+11.2)#41 | 7.2%(+11.0)#2,530 |
| 42. | Crawfordsville | 18.1% | 6.9%(+11.2)#42 | 7.2%(+10.9)#2,550 |
| 43. | Oceanside | 17.9% | 6.9%(+11.0)#43 | 7.2%(+10.7)#2,589 |
| 44. | Bonanza | 17.9% | 6.9%(+11.0)#44 | 7.2%(+10.7)#2,598 |
| 45. | Haines | 17.9% | 6.9%(+10.9)#45 | 7.2%(+10.6)#2,607 |
| 46. | Crescent | 17.7% | 6.9%(+10.7)#46 | 7.2%(+10.5)#2,656 |
| 47. | Helix | 17.3% | 6.9%(+10.4)#47 | 7.2%(+10.1)#2,781 |
| 48. | Ruch | 16.5% | 6.9%(+9.57)#48 | 7.2%(+9.28)#3,109 |
| 49. | Oakridge | 16.2% | 6.9%(+9.24)#49 | 7.2%(+8.95)#3,248 |
| 50. | Harper | 16.2% | 6.9%(+9.24)#50 | 7.2%(+8.95)#3,251 |
| 51. | Mehama | 16.0% | 6.9%(+9.09)#51 | 7.2%(+8.80)#3,325 |
| 52. | Monroe | 15.9% | 6.9%(+8.99)#52 | 7.2%(+8.70)#3,360 |
| 53. | Arlington | 15.8% | 6.9%(+8.83)#53 | 7.2%(+8.54)#3,461 |
| 54. | Lakeview | 15.4% | 6.9%(+8.46)#54 | 7.2%(+8.17)#3,646 |
| 55. | Fairview | 15.1% | 6.9%(+8.13)#55 | 7.2%(+7.84)#3,844 |
| 56. | Gopher Flats | 15.0% | 6.9%(+8.06)#56 | 7.2%(+7.77)#3,888 |
| 57. | Warren | 15.0% | 6.9%(+8.04)#57 | 7.2%(+7.76)#3,901 |
| 58. | Scio | 14.7% | 6.9%(+7.73)#58 | 7.2%(+7.44)#4,078 |
| 59. | Silverton | 14.0% | 6.9%(+7.08)#59 | 7.2%(+6.79)#4,571 |
| 60. | Cascade Locks | 14.0% | 6.9%(+7.06)#60 | 7.2%(+6.77)#4,582 |
| 61. | Long Creek | 14.0% | 6.9%(+7.02)#61 | 7.2%(+6.73)#4,611 |
| 62. | Brownsville | 13.9% | 6.9%(+6.99)#62 | 7.2%(+6.70)#4,632 |
| 63. | Rivergrove | 13.8% | 6.9%(+6.87)#63 | 7.2%(+6.58)#4,715 |
| 64. | Lincoln Beach | 13.8% | 6.9%(+6.83)#64 | 7.2%(+6.54)#4,750 |
| 65. | Toledo | 13.7% | 6.9%(+6.75)#65 | 7.2%(+6.46)#4,804 |
| 66. | Stafford | 13.5% | 6.9%(+6.58)#66 | 7.2%(+6.29)#4,925 |
| 67. | Creswell | 13.5% | 6.9%(+6.53)#67 | 7.2%(+6.24)#4,970 |
| 68. | Glendale | 13.4% | 6.9%(+6.47)#68 | 7.2%(+6.18)#5,016 |
| 69. | Westport | 13.4% | 6.9%(+6.43)#69 | 7.2%(+6.14)#5,046 |
| 70. | Molalla | 13.3% | 6.9%(+6.41)#70 | 7.2%(+6.12)#5,062 |
| 71. | Enterprise | 13.1% | 6.9%(+6.17)#71 | 7.2%(+5.88)#5,257 |
| 72. | Juniper Canyon | 12.9% | 6.9%(+5.92)#72 | 7.2%(+5.63)#5,455 |
| 73. | Dayville | 12.5% | 6.9%(+5.56)#73 | 7.2%(+5.27)#5,783 |
| 74. | Glasgow | 12.3% | 6.9%(+5.40)#74 | 7.2%(+5.11)#5,925 |
| 75. | King City | 12.3% | 6.9%(+5.35)#75 | 7.2%(+5.06)#5,982 |
| 76. | Madras | 12.3% | 6.9%(+5.34)#76 | 7.2%(+5.05)#5,988 |
| 77. | Days Creek | 12.3% | 6.9%(+5.34)#77 | 7.2%(+5.05)#5,998 |
| 78. | Fossil | 12.2% | 6.9%(+5.27)#78 | 7.2%(+4.98)#6,074 |
| 79. | Butteville | 12.1% | 6.9%(+5.21)#79 | 7.2%(+4.92)#6,160 |
| 80. | Aumsville | 12.1% | 6.9%(+5.16)#80 | 7.2%(+4.87)#6,211 |
| 81. | Millersburg | 12.0% | 6.9%(+5.08)#81 | 7.2%(+4.79)#6,289 |
| 82. | Boring | 12.0% | 6.9%(+5.04)#82 | 7.2%(+4.75)#6,332 |
| 83. | Garibaldi | 11.7% | 6.9%(+4.81)#83 | 7.2%(+4.52)#6,578 |
| 84. | Nyssa | 11.7% | 6.9%(+4.79)#84 | 7.2%(+4.50)#6,602 |
| 85. | Jordan Valley | 11.7% | 6.9%(+4.75)#85 | 7.2%(+4.46)#6,642 |
| 86. | Tetherow | 11.7% | 6.9%(+4.73)#86 | 7.2%(+4.45)#6,662 |
| 87. | Tutuilla | 11.6% | 6.9%(+4.70)#87 | 7.2%(+4.41)#6,695 |
| 88. | Columbia City | 11.6% | 6.9%(+4.67)#88 | 7.2%(+4.39)#6,722 |
| 89. | Pacific City | 11.6% | 6.9%(+4.64)#89 | 7.2%(+4.35)#6,760 |
| 90. | Phoenix | 11.5% | 6.9%(+4.60)#90 | 7.2%(+4.31)#6,789 |
| 91. | Elkton | 11.5% | 6.9%(+4.60)#91 | 7.2%(+4.31)#6,804 |
| 92. | Waldport | 11.4% | 6.9%(+4.48)#92 | 7.2%(+4.19)#6,964 |
| 93. | St Paul | 11.3% | 6.9%(+4.34)#93 | 7.2%(+4.05)#7,116 |
| 94. | Sodaville | 11.3% | 6.9%(+4.33)#94 | 7.2%(+4.04)#7,129 |
| 95. | Metzger | 11.2% | 6.9%(+4.28)#95 | 7.2%(+4.00)#7,186 |
| 96. | Prairie City | 11.0% | 6.9%(+4.08)#96 | 7.2%(+3.79)#7,453 |
| 97. | Forest Grove | 11.0% | 6.9%(+4.06)#97 | 7.2%(+3.78)#7,468 |
| 98. | Glide | 11.0% | 6.9%(+4.06)#98 | 7.2%(+3.77)#7,475 |
| 99. | Klamath Falls | 10.9% | 6.9%(+3.99)#99 | 7.2%(+3.70)#7,565 |
| 100. | Gaston | 10.9% | 6.9%(+3.94)#100 | 7.2%(+3.65)#7,612 |
Common Questions
What are the Top 10 Cities with the Highest Percentage of Local Government Employees in Oregon?
Top 10 Cities with the Highest Percentage of Local Government Employees in Oregon are:
#1
79.1%
#2
66.7%
#3
64.7%
#4
60.4%
#5
50.0%
#6
37.5%
#7
35.7%
#8
30.6%
#9
29.4%
#10
29.2%
What city has the Highest Percentage of Local Government Employees in Oregon?
Winchester Bay has the Highest Percentage of Local Government Employees in Oregon with 79.1%.
What is the Percentage of Local Government Employees in the State of Oregon?
Percentage of Local Government Employees in Oregon is 6.9%.
What is the Percentage of Local Government Employees in the United States?
Percentage of Local Government Employees in the United States is 7.2%.