Cities with the Highest Percentage of Local Government Employees in Virginia
RELATED REPORTS & OPTIONS
Local Government Employees
Virginia
Compare Cities
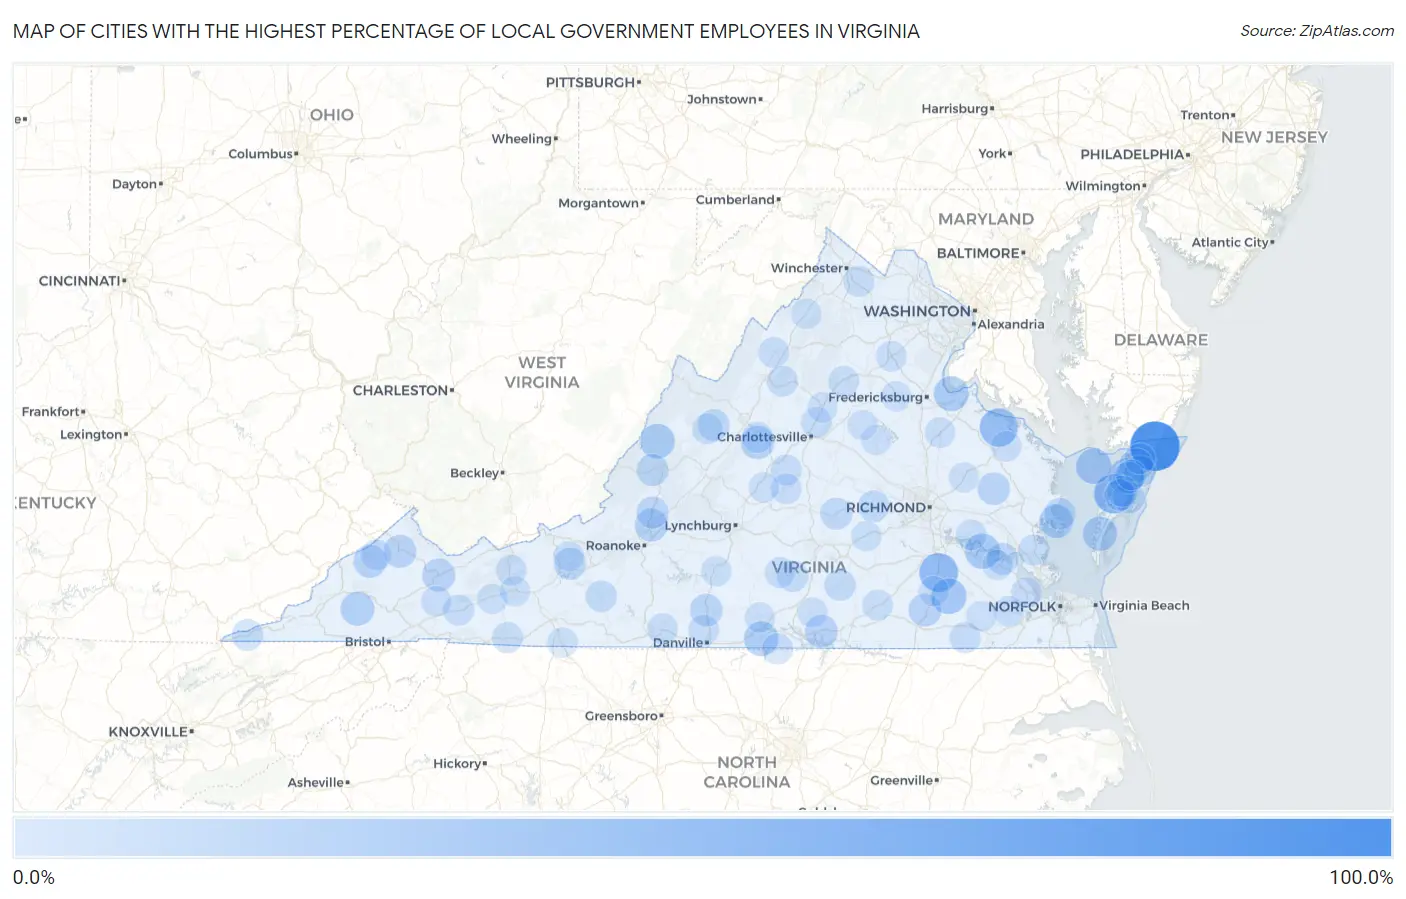
Map of Cities with the Highest Percentage of Local Government Employees in Virginia
0.0%
100.0%
Cities with the Highest Percentage of Local Government Employees in Virginia
| City | % Local Government Employees | vs State | vs National | |
| 1. | Horntown | 100.0% | 7.7%(+92.3)#1 | 7.2%(+92.8)#1 |
| 2. | Pungoteague | 53.8% | 7.7%(+46.2)#2 | 7.2%(+46.6)#225 |
| 3. | Brucetown | 52.0% | 7.7%(+44.3)#3 | 7.2%(+44.8)#248 |
| 4. | Templeton | 50.8% | 7.7%(+43.1)#4 | 7.2%(+43.6)#265 |
| 5. | Montross | 48.1% | 7.7%(+40.5)#5 | 7.2%(+40.9)#324 |
| 6. | Ripplemead | 47.8% | 7.7%(+40.1)#6 | 7.2%(+40.6)#331 |
| 7. | Locust Mount | 43.2% | 7.7%(+35.6)#7 | 7.2%(+36.0)#410 |
| 8. | Bayside | 38.4% | 7.7%(+30.7)#8 | 7.2%(+31.2)#517 |
| 9. | Sussex | 37.0% | 7.7%(+29.4)#9 | 7.2%(+29.8)#564 |
| 10. | Pounding Mill | 36.8% | 7.7%(+29.1)#10 | 7.2%(+29.6)#574 |
| 11. | Weems | 36.7% | 7.7%(+29.0)#11 | 7.2%(+29.5)#579 |
| 12. | Tangier | 36.0% | 7.7%(+28.3)#12 | 7.2%(+28.8)#605 |
| 13. | Claremont | 35.2% | 7.7%(+27.5)#13 | 7.2%(+27.9)#641 |
| 14. | Fairview Beach | 33.8% | 7.7%(+26.1)#14 | 7.2%(+26.6)#696 |
| 15. | Hot Springs | 32.9% | 7.7%(+25.3)#15 | 7.2%(+25.7)#753 |
| 16. | Cluster Springs | 31.7% | 7.7%(+24.0)#16 | 7.2%(+24.5)#799 |
| 17. | Eastville | 31.5% | 7.7%(+23.8)#17 | 7.2%(+24.3)#808 |
| 18. | Innovation | 31.2% | 7.7%(+23.5)#18 | 7.2%(+24.0)#830 |
| 19. | East Stone Gap | 30.9% | 7.7%(+23.2)#19 | 7.2%(+23.6)#847 |
| 20. | Dungannon | 29.1% | 7.7%(+21.4)#20 | 7.2%(+21.8)#954 |
| 21. | Mathews | 28.7% | 7.7%(+21.0)#21 | 7.2%(+21.4)#972 |
| 22. | Bloxom | 27.6% | 7.7%(+19.9)#22 | 7.2%(+20.4)#1,052 |
| 23. | North Garden | 27.1% | 7.7%(+19.4)#23 | 7.2%(+19.9)#1,098 |
| 24. | Sherando | 27.0% | 7.7%(+19.3)#24 | 7.2%(+19.8)#1,108 |
| 25. | Troutville | 25.8% | 7.7%(+18.1)#25 | 7.2%(+18.6)#1,209 |
| 26. | Jarratt | 25.6% | 7.7%(+17.9)#26 | 7.2%(+18.4)#1,231 |
| 27. | Clinchco | 25.5% | 7.7%(+17.9)#27 | 7.2%(+18.3)#1,236 |
| 28. | Claypool Hill | 25.1% | 7.7%(+17.4)#28 | 7.2%(+17.9)#1,267 |
| 29. | Boydton | 24.8% | 7.7%(+17.1)#29 | 7.2%(+17.6)#1,325 |
| 30. | Vansant | 24.8% | 7.7%(+17.1)#30 | 7.2%(+17.5)#1,333 |
| 31. | Port Republic | 24.4% | 7.7%(+16.7)#31 | 7.2%(+17.2)#1,372 |
| 32. | King And Queen Court House | 23.5% | 7.7%(+15.9)#32 | 7.2%(+16.3)#1,454 |
| 33. | Chatham | 23.3% | 7.7%(+15.6)#33 | 7.2%(+16.0)#1,487 |
| 34. | Meadowview | 21.8% | 7.7%(+14.1)#34 | 7.2%(+14.6)#1,716 |
| 35. | Fincastle | 21.5% | 7.7%(+13.8)#35 | 7.2%(+14.3)#1,767 |
| 36. | New River | 21.4% | 7.7%(+13.7)#36 | 7.2%(+14.2)#1,785 |
| 37. | Low Moor | 21.4% | 7.7%(+13.7)#37 | 7.2%(+14.2)#1,786 |
| 38. | Scotland | 20.8% | 7.7%(+13.2)#38 | 7.2%(+13.6)#1,884 |
| 39. | Cumberland | 20.7% | 7.7%(+13.1)#39 | 7.2%(+13.5)#1,907 |
| 40. | Wachapreague | 20.5% | 7.7%(+12.8)#40 | 7.2%(+13.2)#1,965 |
| 41. | Augusta Springs | 20.3% | 7.7%(+12.6)#41 | 7.2%(+13.0)#2,005 |
| 42. | Gwynn | 20.1% | 7.7%(+12.5)#42 | 7.2%(+12.9)#2,018 |
| 43. | Gargatha | 20.1% | 7.7%(+12.4)#43 | 7.2%(+12.8)#2,027 |
| 44. | Powhatan | 19.4% | 7.7%(+11.7)#44 | 7.2%(+12.1)#2,178 |
| 45. | Ewing | 19.1% | 7.7%(+11.5)#45 | 7.2%(+11.9)#2,236 |
| 46. | Victoria | 18.8% | 7.7%(+11.2)#46 | 7.2%(+11.6)#2,339 |
| 47. | Floyd | 18.6% | 7.7%(+10.9)#47 | 7.2%(+11.4)#2,405 |
| 48. | Greenbush | 18.4% | 7.7%(+10.7)#48 | 7.2%(+11.1)#2,469 |
| 49. | Keller | 18.3% | 7.7%(+10.6)#49 | 7.2%(+11.1)#2,486 |
| 50. | Keezletown | 17.6% | 7.7%(+9.94)#50 | 7.2%(+10.4)#2,683 |
| 51. | Lyndhurst | 17.4% | 7.7%(+9.74)#51 | 7.2%(+10.2)#2,758 |
| 52. | Charlotte Court House | 17.4% | 7.7%(+9.68)#52 | 7.2%(+10.1)#2,776 |
| 53. | Newsoms | 16.9% | 7.7%(+9.19)#53 | 7.2%(+9.63)#2,934 |
| 54. | Independence | 16.9% | 7.7%(+9.18)#54 | 7.2%(+9.62)#2,936 |
| 55. | Haysi | 16.7% | 7.7%(+8.99)#55 | 7.2%(+9.44)#3,000 |
| 56. | Virgilina | 16.7% | 7.7%(+8.99)#56 | 7.2%(+9.44)#3,018 |
| 57. | Yorktown | 16.6% | 7.7%(+8.88)#57 | 7.2%(+9.33)#3,088 |
| 58. | Boyce | 16.5% | 7.7%(+8.81)#58 | 7.2%(+9.26)#3,116 |
| 59. | Melfa | 16.5% | 7.7%(+8.80)#59 | 7.2%(+9.25)#3,117 |
| 60. | Mcmullin | 16.2% | 7.7%(+8.54)#60 | 7.2%(+8.99)#3,233 |
| 61. | Mount Hermon | 16.1% | 7.7%(+8.38)#61 | 7.2%(+8.82)#3,312 |
| 62. | Schuyler | 16.0% | 7.7%(+8.37)#62 | 7.2%(+8.82)#3,314 |
| 63. | Hollymead | 16.0% | 7.7%(+8.37)#63 | 7.2%(+8.82)#3,317 |
| 64. | Brightwood | 16.0% | 7.7%(+8.30)#64 | 7.2%(+8.75)#3,344 |
| 65. | Broadway | 15.9% | 7.7%(+8.25)#65 | 7.2%(+8.70)#3,362 |
| 66. | Massanutten | 15.9% | 7.7%(+8.23)#66 | 7.2%(+8.67)#3,379 |
| 67. | Charles City | 15.8% | 7.7%(+8.11)#67 | 7.2%(+8.56)#3,457 |
| 68. | Laurel Park | 15.7% | 7.7%(+8.00)#68 | 7.2%(+8.45)#3,509 |
| 69. | Hallwood | 15.6% | 7.7%(+7.95)#69 | 7.2%(+8.40)#3,543 |
| 70. | Craigsville | 15.5% | 7.7%(+7.78)#70 | 7.2%(+8.22)#3,622 |
| 71. | Phenix | 15.4% | 7.7%(+7.76)#71 | 7.2%(+8.21)#3,627 |
| 72. | Alberta | 15.4% | 7.7%(+7.76)#72 | 7.2%(+8.21)#3,628 |
| 73. | Bealeton | 15.4% | 7.7%(+7.74)#73 | 7.2%(+8.19)#3,638 |
| 74. | Yogaville | 15.4% | 7.7%(+7.71)#74 | 7.2%(+8.16)#3,659 |
| 75. | Mount Clifton | 15.1% | 7.7%(+7.42)#75 | 7.2%(+7.87)#3,829 |
| 76. | Warsaw | 15.1% | 7.7%(+7.38)#76 | 7.2%(+7.83)#3,852 |
| 77. | Bowling Green | 14.9% | 7.7%(+7.24)#77 | 7.2%(+7.68)#3,944 |
| 78. | Benns Church | 14.7% | 7.7%(+7.03)#78 | 7.2%(+7.48)#4,049 |
| 79. | Bland | 14.7% | 7.7%(+7.00)#79 | 7.2%(+7.45)#4,075 |
| 80. | Saltville | 14.5% | 7.7%(+6.81)#80 | 7.2%(+7.26)#4,210 |
| 81. | Windsor | 14.3% | 7.7%(+6.61)#81 | 7.2%(+7.06)#4,319 |
| 82. | Amelia Court House | 14.2% | 7.7%(+6.52)#82 | 7.2%(+6.97)#4,423 |
| 83. | Hurt | 14.2% | 7.7%(+6.50)#83 | 7.2%(+6.95)#4,440 |
| 84. | Chase Crossing | 14.1% | 7.7%(+6.44)#84 | 7.2%(+6.89)#4,504 |
| 85. | Sedley | 14.0% | 7.7%(+6.33)#85 | 7.2%(+6.78)#4,581 |
| 86. | Halifax | 14.0% | 7.7%(+6.30)#86 | 7.2%(+6.74)#4,596 |
| 87. | Mineral | 13.9% | 7.7%(+6.25)#87 | 7.2%(+6.70)#4,635 |
| 88. | Ruckersville | 13.9% | 7.7%(+6.24)#88 | 7.2%(+6.69)#4,641 |
| 89. | Stony Creek | 13.9% | 7.7%(+6.24)#89 | 7.2%(+6.69)#4,644 |
| 90. | Cana | 13.9% | 7.7%(+6.24)#90 | 7.2%(+6.68)#4,648 |
| 91. | Lake Wilderness | 13.8% | 7.7%(+6.09)#91 | 7.2%(+6.54)#4,749 |
| 92. | Surry | 13.8% | 7.7%(+6.09)#92 | 7.2%(+6.53)#4,753 |
| 93. | Woodstock | 13.8% | 7.7%(+6.08)#93 | 7.2%(+6.52)#4,758 |
| 94. | Blue Ridge Shores | 13.7% | 7.7%(+6.01)#94 | 7.2%(+6.46)#4,805 |
| 95. | Belspring | 13.5% | 7.7%(+5.87)#95 | 7.2%(+6.31)#4,910 |
| 96. | Chase City | 13.5% | 7.7%(+5.85)#96 | 7.2%(+6.30)#4,918 |
| 97. | Rural Retreat | 13.5% | 7.7%(+5.83)#97 | 7.2%(+6.28)#4,938 |
| 98. | Wytheville | 13.5% | 7.7%(+5.82)#98 | 7.2%(+6.27)#4,947 |
| 99. | Arrington | 13.5% | 7.7%(+5.79)#99 | 7.2%(+6.24)#4,971 |
| 100. | Central Garage | 13.3% | 7.7%(+5.64)#100 | 7.2%(+6.08)#5,104 |
Common Questions
What are the Top 10 Cities with the Highest Percentage of Local Government Employees in Virginia?
Top 10 Cities with the Highest Percentage of Local Government Employees in Virginia are:
#1
100.0%
#2
53.8%
#3
50.8%
#4
48.1%
#5
38.4%
#6
37.0%
#7
36.0%
#8
35.2%
#9
33.8%
#10
32.9%
What city has the Highest Percentage of Local Government Employees in Virginia?
Horntown has the Highest Percentage of Local Government Employees in Virginia with 100.0%.
What is the Percentage of Local Government Employees in the State of Virginia?
Percentage of Local Government Employees in Virginia is 7.7%.
What is the Percentage of Local Government Employees in the United States?
Percentage of Local Government Employees in the United States is 7.2%.