Cities with the Highest Percentage of Local Government Employees in Illinois
RELATED REPORTS & OPTIONS
Local Government Employees
Illinois
Compare Cities
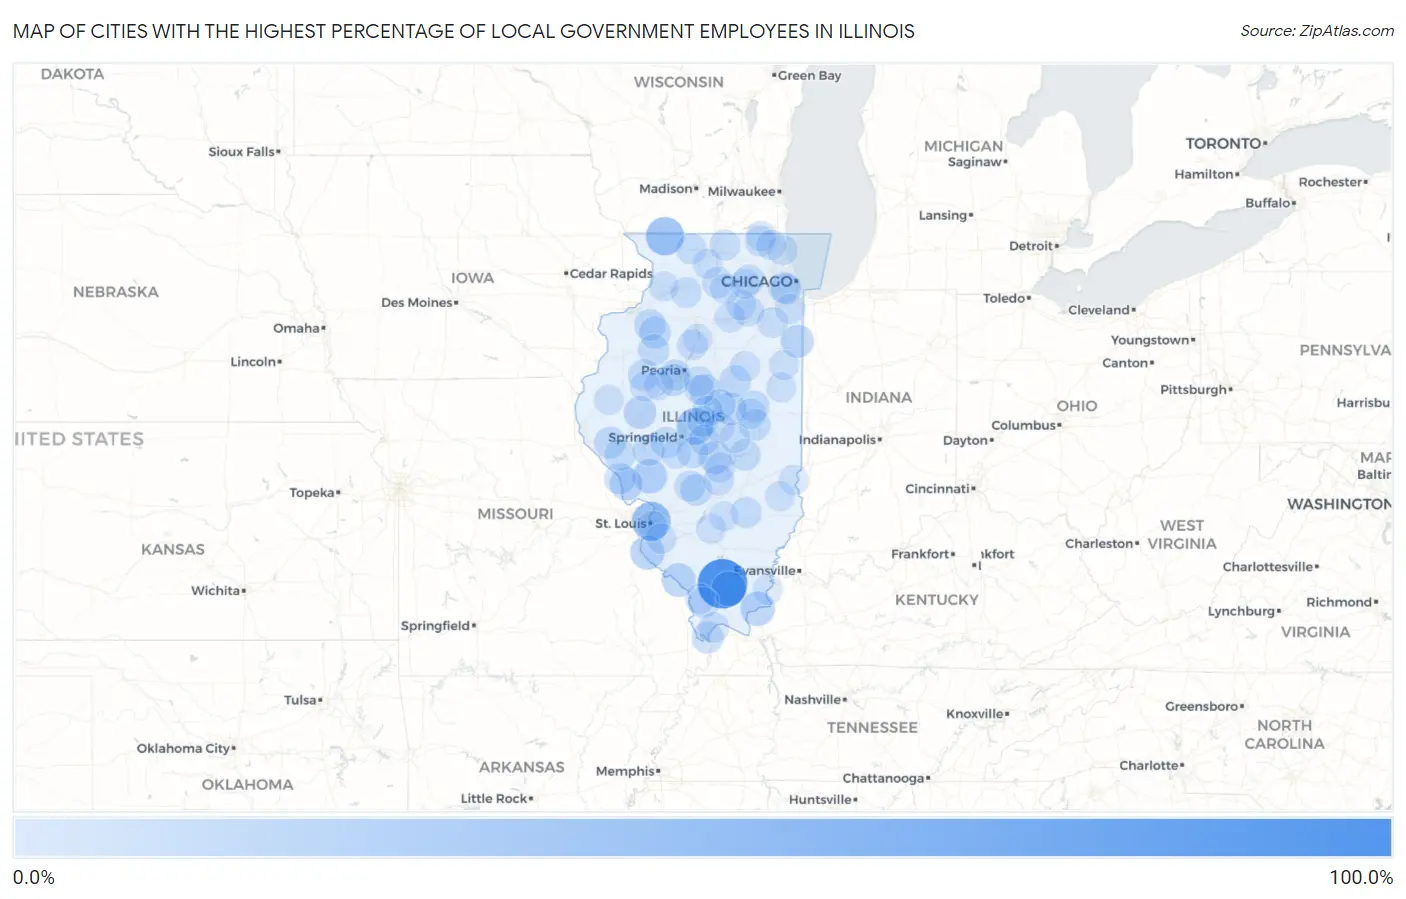
Map of Cities with the Highest Percentage of Local Government Employees in Illinois
0.0%
100.0%
Cities with the Highest Percentage of Local Government Employees in Illinois
| City | % Local Government Employees | vs State | vs National | |
| 1. | Whiteash | 100.0% | 7.4%(+92.6)#1 | 7.2%(+92.8)#9 |
| 2. | Brooklyn | 51.5% | 7.4%(+44.1)#2 | 7.2%(+44.3)#257 |
| 3. | Nora | 49.1% | 7.4%(+41.8)#3 | 7.2%(+41.9)#311 |
| 4. | Cornland | 42.5% | 7.4%(+35.1)#4 | 7.2%(+35.3)#424 |
| 5. | Literberry | 36.5% | 7.4%(+29.1)#5 | 7.2%(+29.3)#588 |
| 6. | Taylor Ridge | 36.2% | 7.4%(+28.8)#6 | 7.2%(+28.9)#599 |
| 7. | Paloma | 35.3% | 7.4%(+27.9)#7 | 7.2%(+28.1)#633 |
| 8. | Crab Orchard | 34.6% | 7.4%(+27.2)#8 | 7.2%(+27.4)#667 |
| 9. | Rockbridge | 32.7% | 7.4%(+25.3)#9 | 7.2%(+25.4)#763 |
| 10. | Elizabethtown | 32.6% | 7.4%(+25.2)#10 | 7.2%(+25.4)#767 |
| 11. | Maeystown | 32.1% | 7.4%(+24.8)#11 | 7.2%(+24.9)#781 |
| 12. | Ophiem | 31.5% | 7.4%(+24.1)#12 | 7.2%(+24.2)#811 |
| 13. | Rockwood | 30.0% | 7.4%(+22.6)#13 | 7.2%(+22.8)#907 |
| 14. | Cameron | 28.4% | 7.4%(+21.0)#14 | 7.2%(+21.1)#1,003 |
| 15. | Hardin | 27.0% | 7.4%(+19.6)#15 | 7.2%(+19.8)#1,105 |
| 16. | Hopkins Park | 26.8% | 7.4%(+19.5)#16 | 7.2%(+19.6)#1,118 |
| 17. | Browning | 26.3% | 7.4%(+18.9)#17 | 7.2%(+19.1)#1,171 |
| 18. | Assumption | 26.1% | 7.4%(+18.7)#18 | 7.2%(+18.9)#1,196 |
| 19. | De Witt | 25.3% | 7.4%(+17.9)#19 | 7.2%(+18.1)#1,258 |
| 20. | Kingston Mines | 23.2% | 7.4%(+15.8)#20 | 7.2%(+16.0)#1,498 |
| 21. | Cooksville | 22.4% | 7.4%(+15.0)#21 | 7.2%(+15.1)#1,624 |
| 22. | Cairo | 22.1% | 7.4%(+14.8)#22 | 7.2%(+14.9)#1,669 |
| 23. | Woodson | 22.1% | 7.4%(+14.7)#23 | 7.2%(+14.9)#1,672 |
| 24. | Bishop Hill | 21.8% | 7.4%(+14.4)#24 | 7.2%(+14.6)#1,715 |
| 25. | Stanford | 21.7% | 7.4%(+14.3)#25 | 7.2%(+14.5)#1,730 |
| 26. | Coffeen | 21.7% | 7.4%(+14.3)#26 | 7.2%(+14.4)#1,733 |
| 27. | Cambridge | 21.7% | 7.4%(+14.3)#27 | 7.2%(+14.4)#1,735 |
| 28. | Baylis | 21.5% | 7.4%(+14.2)#28 | 7.2%(+14.3)#1,764 |
| 29. | Ellisville | 21.1% | 7.4%(+13.7)#29 | 7.2%(+13.8)#1,846 |
| 30. | Mccook | 20.9% | 7.4%(+13.5)#30 | 7.2%(+13.7)#1,867 |
| 31. | Lake Of The Woods | 20.8% | 7.4%(+13.4)#31 | 7.2%(+13.6)#1,894 |
| 32. | Hamburg | 20.7% | 7.4%(+13.3)#32 | 7.2%(+13.5)#1,917 |
| 33. | Wapella | 20.6% | 7.4%(+13.2)#33 | 7.2%(+13.4)#1,930 |
| 34. | Sadorus | 20.6% | 7.4%(+13.2)#34 | 7.2%(+13.4)#1,934 |
| 35. | Oak Run | 20.6% | 7.4%(+13.2)#35 | 7.2%(+13.4)#1,943 |
| 36. | Allenville | 20.5% | 7.4%(+13.1)#36 | 7.2%(+13.2)#1,967 |
| 37. | Argyle | 20.4% | 7.4%(+13.1)#37 | 7.2%(+13.2)#1,971 |
| 38. | New Berlin | 20.3% | 7.4%(+13.0)#38 | 7.2%(+13.1)#1,986 |
| 39. | Tovey | 20.1% | 7.4%(+12.7)#39 | 7.2%(+12.8)#2,026 |
| 40. | Baileyville | 20.0% | 7.4%(+12.6)#40 | 7.2%(+12.8)#2,047 |
| 41. | Time | 20.0% | 7.4%(+12.6)#41 | 7.2%(+12.8)#2,067 |
| 42. | Steward | 19.3% | 7.4%(+11.9)#42 | 7.2%(+12.1)#2,193 |
| 43. | Louisville | 18.9% | 7.4%(+11.6)#43 | 7.2%(+11.7)#2,301 |
| 44. | Elburn | 18.9% | 7.4%(+11.5)#44 | 7.2%(+11.7)#2,320 |
| 45. | Taylor Springs | 18.9% | 7.4%(+11.5)#45 | 7.2%(+11.6)#2,325 |
| 46. | Lake Camelot | 18.8% | 7.4%(+11.4)#46 | 7.2%(+11.5)#2,350 |
| 47. | Mount Pulaski | 18.8% | 7.4%(+11.4)#47 | 7.2%(+11.5)#2,357 |
| 48. | Beason | 18.8% | 7.4%(+11.4)#48 | 7.2%(+11.5)#2,367 |
| 49. | Ridott | 18.6% | 7.4%(+11.3)#49 | 7.2%(+11.4)#2,390 |
| 50. | Cobden | 18.5% | 7.4%(+11.2)#50 | 7.2%(+11.3)#2,419 |
| 51. | Laplace | 18.5% | 7.4%(+11.1)#51 | 7.2%(+11.3)#2,423 |
| 52. | Timberlane | 18.4% | 7.4%(+11.1)#52 | 7.2%(+11.2)#2,443 |
| 53. | Herrick | 18.2% | 7.4%(+10.9)#53 | 7.2%(+11.0)#2,501 |
| 54. | Bedford Park | 18.2% | 7.4%(+10.8)#54 | 7.2%(+11.0)#2,515 |
| 55. | Prairietown | 18.1% | 7.4%(+10.8)#55 | 7.2%(+10.9)#2,541 |
| 56. | Sparland | 17.8% | 7.4%(+10.5)#56 | 7.2%(+10.6)#2,617 |
| 57. | Symerton | 17.6% | 7.4%(+10.3)#57 | 7.2%(+10.4)#2,674 |
| 58. | Olmsted | 17.6% | 7.4%(+10.2)#58 | 7.2%(+10.4)#2,693 |
| 59. | Mount Auburn | 17.6% | 7.4%(+10.2)#59 | 7.2%(+10.3)#2,695 |
| 60. | Johnsburg | 17.5% | 7.4%(+10.1)#60 | 7.2%(+10.3)#2,725 |
| 61. | Lisbon | 17.3% | 7.4%(+9.95)#61 | 7.2%(+10.1)#2,790 |
| 62. | Harmon | 17.2% | 7.4%(+9.87)#62 | 7.2%(+10.0)#2,817 |
| 63. | Smithfield | 17.2% | 7.4%(+9.82)#63 | 7.2%(+9.96)#2,830 |
| 64. | Smithton | 16.9% | 7.4%(+9.53)#64 | 7.2%(+9.68)#2,917 |
| 65. | Sauget | 16.9% | 7.4%(+9.53)#65 | 7.2%(+9.67)#2,921 |
| 66. | Seymour | 16.8% | 7.4%(+9.40)#66 | 7.2%(+9.54)#2,968 |
| 67. | Dayton | 16.7% | 7.4%(+9.37)#67 | 7.2%(+9.51)#2,975 |
| 68. | Fairbury | 16.7% | 7.4%(+9.35)#68 | 7.2%(+9.49)#2,983 |
| 69. | Lawrence | 16.7% | 7.4%(+9.30)#69 | 7.2%(+9.44)#3,012 |
| 70. | Plum Valley | 16.6% | 7.4%(+9.20)#70 | 7.2%(+9.34)#3,083 |
| 71. | Millington | 16.6% | 7.4%(+9.19)#71 | 7.2%(+9.33)#3,087 |
| 72. | Smithville | 16.5% | 7.4%(+9.16)#72 | 7.2%(+9.30)#3,103 |
| 73. | Knollwood | 16.3% | 7.4%(+8.95)#73 | 7.2%(+9.09)#3,189 |
| 74. | Shabbona | 16.3% | 7.4%(+8.94)#74 | 7.2%(+9.09)#3,191 |
| 75. | Tower Hill | 16.3% | 7.4%(+8.88)#75 | 7.2%(+9.02)#3,219 |
| 76. | Spring Grove | 16.2% | 7.4%(+8.79)#76 | 7.2%(+8.93)#3,262 |
| 77. | Hainesville | 16.1% | 7.4%(+8.69)#77 | 7.2%(+8.83)#3,305 |
| 78. | Heritage Lake | 16.1% | 7.4%(+8.69)#78 | 7.2%(+8.83)#3,307 |
| 79. | Rest Haven | 16.0% | 7.4%(+8.66)#79 | 7.2%(+8.80)#3,326 |
| 80. | Westlake | 16.0% | 7.4%(+8.58)#80 | 7.2%(+8.73)#3,348 |
| 81. | Alto Pass | 15.9% | 7.4%(+8.54)#81 | 7.2%(+8.68)#3,367 |
| 82. | Minier | 15.9% | 7.4%(+8.54)#82 | 7.2%(+8.68)#3,376 |
| 83. | Morrison | 15.8% | 7.4%(+8.45)#83 | 7.2%(+8.59)#3,425 |
| 84. | West Union | 15.7% | 7.4%(+8.32)#84 | 7.2%(+8.46)#3,500 |
| 85. | Matteson | 15.7% | 7.4%(+8.30)#85 | 7.2%(+8.44)#3,513 |
| 86. | Central City | 15.7% | 7.4%(+8.30)#86 | 7.2%(+8.44)#3,514 |
| 87. | Oblong | 15.6% | 7.4%(+8.27)#87 | 7.2%(+8.41)#3,535 |
| 88. | Dunfermline | 15.6% | 7.4%(+8.20)#88 | 7.2%(+8.34)#3,569 |
| 89. | Kaneville | 15.5% | 7.4%(+8.09)#89 | 7.2%(+8.24)#3,616 |
| 90. | Old Shawneetown | 15.4% | 7.4%(+8.01)#90 | 7.2%(+8.16)#3,660 |
| 91. | Forsyth | 15.4% | 7.4%(+8.00)#91 | 7.2%(+8.15)#3,672 |
| 92. | Henry | 15.3% | 7.4%(+7.91)#92 | 7.2%(+8.05)#3,719 |
| 93. | Stillman Valley | 15.3% | 7.4%(+7.90)#93 | 7.2%(+8.05)#3,721 |
| 94. | Alma | 15.3% | 7.4%(+7.88)#94 | 7.2%(+8.03)#3,734 |
| 95. | Rankin | 15.2% | 7.4%(+7.80)#95 | 7.2%(+7.94)#3,786 |
| 96. | Plymouth | 15.2% | 7.4%(+7.78)#96 | 7.2%(+7.92)#3,792 |
| 97. | La Clede | 15.2% | 7.4%(+7.78)#97 | 7.2%(+7.92)#3,795 |
| 98. | Auburn | 15.1% | 7.4%(+7.77)#98 | 7.2%(+7.91)#3,800 |
| 99. | Crescent City | 15.1% | 7.4%(+7.77)#99 | 7.2%(+7.91)#3,802 |
| 100. | Edgington | 15.1% | 7.4%(+7.72)#100 | 7.2%(+7.87)#3,828 |
Common Questions
What are the Top 10 Cities with the Highest Percentage of Local Government Employees in Illinois?
Top 10 Cities with the Highest Percentage of Local Government Employees in Illinois are:
#1
100.0%
#2
51.5%
#3
49.1%
#4
42.5%
#5
34.6%
#6
32.7%
#7
32.6%
#8
32.1%
#9
30.0%
#10
27.0%
What city has the Highest Percentage of Local Government Employees in Illinois?
Whiteash has the Highest Percentage of Local Government Employees in Illinois with 100.0%.
What is the Percentage of Local Government Employees in the State of Illinois?
Percentage of Local Government Employees in Illinois is 7.4%.
What is the Percentage of Local Government Employees in the United States?
Percentage of Local Government Employees in the United States is 7.2%.