Cities with the Highest Percentage of Korean Population in Pennsylvania
RELATED REPORTS & OPTIONS
Korean
Pennsylvania
Compare Cities
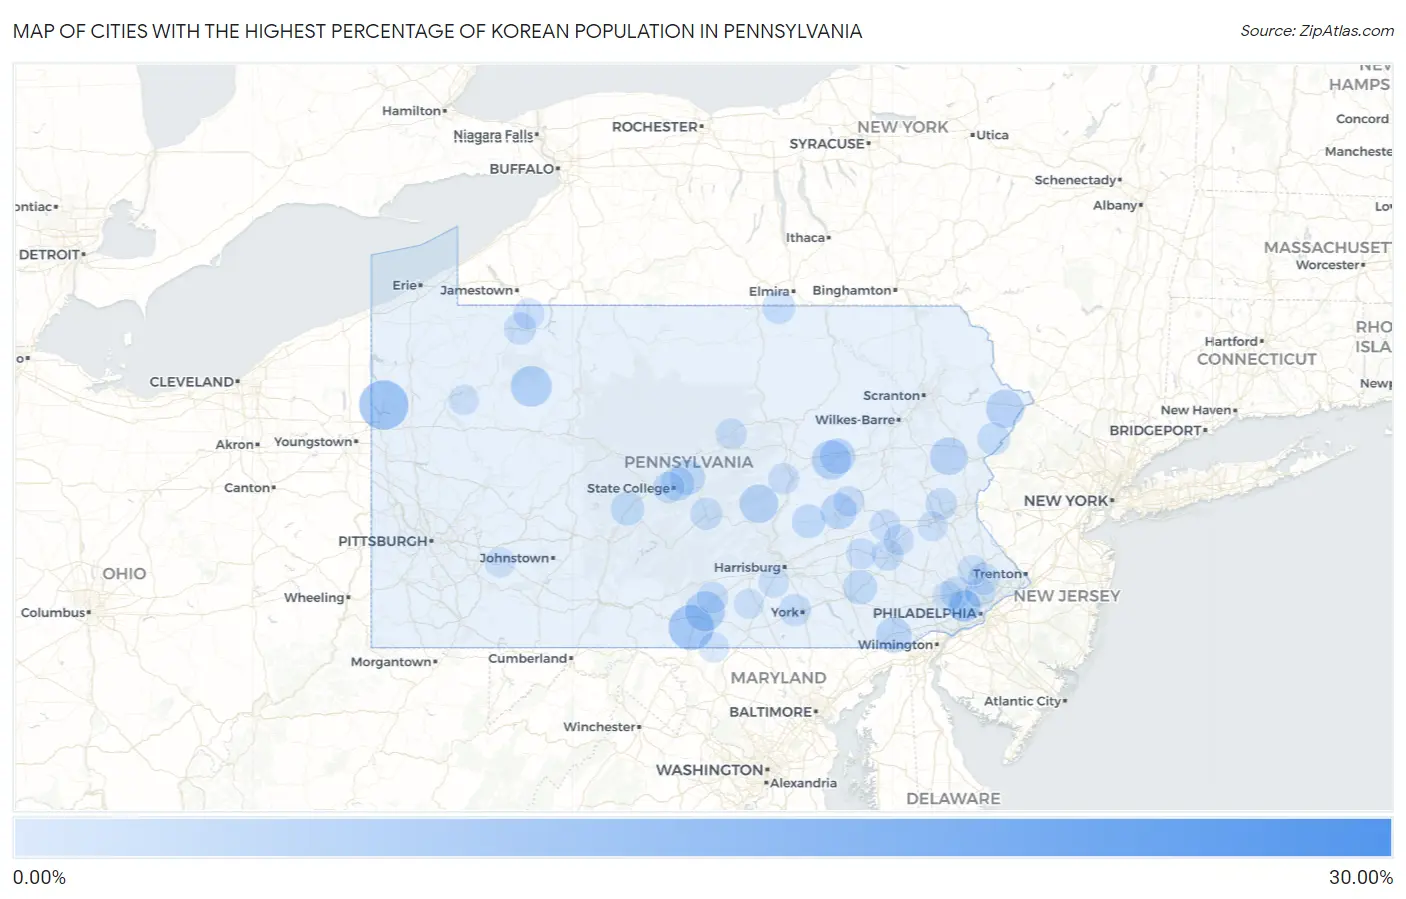
Map of Cities with the Highest Percentage of Korean Population in Pennsylvania
0.00%
30.00%
Cities with the Highest Percentage of Korean Population in Pennsylvania
| City | Korean | vs State | vs National | |
| 1. | Aaronsburg Cdp Washington County | 25.77% | 0.40%(+25.4)#1 | 1.31%(+24.5)#91 |
| 2. | Saltsburg Borough | 23.01% | 0.40%(+22.6)#2 | 1.31%(+21.7)#105 |
| 3. | Reynolds Heights | 9.46% | 0.40%(+9.06)#3 | 1.31%(+8.15)#286 |
| 4. | Lykens Borough | 8.40% | 0.40%(+8.00)#4 | 1.31%(+7.09)#334 |
| 5. | Hyde Park Borough | 8.18% | 0.40%(+7.78)#5 | 1.31%(+6.87)#347 |
| 6. | Marion | 7.64% | 0.40%(+7.24)#6 | 1.31%(+6.33)#391 |
| 7. | Port Clinton Borough | 7.63% | 0.40%(+7.23)#7 | 1.31%(+6.32)#392 |
| 8. | Glen Rock Borough | 6.85% | 0.40%(+6.45)#8 | 1.31%(+5.54)#443 |
| 9. | Oxford Borough | 6.76% | 0.40%(+6.36)#9 | 1.31%(+5.45)#450 |
| 10. | Marienville | 5.73% | 0.40%(+5.34)#10 | 1.31%(+4.42)#574 |
| 11. | Scotland | 5.34% | 0.40%(+4.94)#11 | 1.31%(+4.03)#638 |
| 12. | Salona | 5.05% | 0.40%(+4.65)#12 | 1.31%(+3.74)#683 |
| 13. | Rupert | 5.00% | 0.40%(+4.60)#13 | 1.31%(+3.69)#699 |
| 14. | Richfield | 4.77% | 0.40%(+4.38)#14 | 1.31%(+3.46)#743 |
| 15. | Gold Key Lake | 4.49% | 0.40%(+4.09)#15 | 1.31%(+3.18)#795 |
| 16. | Sierra View | 4.41% | 0.40%(+4.01)#16 | 1.31%(+3.10)#812 |
| 17. | Swarthmore Borough | 4.18% | 0.40%(+3.78)#17 | 1.31%(+2.87)#876 |
| 18. | Stoystown Borough | 4.15% | 0.40%(+3.75)#18 | 1.31%(+2.84)#883 |
| 19. | Donaldson | 3.69% | 0.40%(+3.29)#19 | 1.31%(+2.38)#1,028 |
| 20. | Lincoln University | 3.58% | 0.40%(+3.18)#20 | 1.31%(+2.27)#1,070 |
| 21. | New Bethlehem Borough | 3.55% | 0.40%(+3.15)#21 | 1.31%(+2.24)#1,084 |
| 22. | Espy | 3.51% | 0.40%(+3.11)#22 | 1.31%(+2.20)#1,106 |
| 23. | Pleasant Gap | 3.30% | 0.40%(+2.90)#23 | 1.31%(+1.99)#1,196 |
| 24. | Polk Borough | 3.27% | 0.40%(+2.87)#24 | 1.31%(+1.96)#1,208 |
| 25. | Coraopolis Borough | 3.07% | 0.40%(+2.67)#25 | 1.31%(+1.76)#1,299 |
| 26. | Boswell Borough | 3.05% | 0.40%(+2.65)#26 | 1.31%(+1.74)#1,306 |
| 27. | Prospect Park Borough | 2.95% | 0.40%(+2.55)#27 | 1.31%(+1.64)#1,358 |
| 28. | Southmont Borough | 2.91% | 0.40%(+2.52)#28 | 1.31%(+1.60)#1,383 |
| 29. | Brownstown | 2.88% | 0.40%(+2.48)#29 | 1.31%(+1.57)#1,414 |
| 30. | South Williamsport Borough | 2.85% | 0.40%(+2.45)#30 | 1.31%(+1.54)#1,426 |
| 31. | Houserville | 2.81% | 0.40%(+2.42)#31 | 1.31%(+1.50)#1,448 |
| 32. | Wiconsico | 2.68% | 0.40%(+2.28)#32 | 1.31%(+1.37)#1,535 |
| 33. | Grazierville | 2.59% | 0.40%(+2.19)#33 | 1.31%(+1.28)#1,593 |
| 34. | Ambler Borough | 2.57% | 0.40%(+2.17)#34 | 1.31%(+1.26)#1,610 |
| 35. | Manns Choice Borough | 2.51% | 0.40%(+2.11)#35 | 1.31%(+1.20)#1,639 |
| 36. | Jessup Borough | 2.46% | 0.40%(+2.06)#36 | 1.31%(+1.15)#1,673 |
| 37. | Millerton | 2.33% | 0.40%(+1.93)#37 | 1.31%(+1.02)#1,770 |
| 38. | Saw Creek | 2.31% | 0.40%(+1.91)#38 | 1.31%(+0.999)#1,785 |
| 39. | Haverford College | 2.19% | 0.40%(+1.79)#39 | 1.31%(+0.877)#1,904 |
| 40. | Knox Borough | 2.16% | 0.40%(+1.76)#40 | 1.31%(+0.854)#1,927 |
| 41. | Alburtis Borough | 2.10% | 0.40%(+1.70)#41 | 1.31%(+0.792)#2,001 |
| 42. | Shiloh | 2.10% | 0.40%(+1.70)#42 | 1.31%(+0.789)#2,006 |
| 43. | Starbrick | 2.07% | 0.40%(+1.67)#43 | 1.31%(+0.758)#2,034 |
| 44. | Lehighton Borough | 2.06% | 0.40%(+1.67)#44 | 1.31%(+0.755)#2,037 |
| 45. | Highland Park | 2.05% | 0.40%(+1.65)#45 | 1.31%(+0.743)#2,044 |
| 46. | Pitcairn Borough | 2.04% | 0.40%(+1.64)#46 | 1.31%(+0.733)#2,058 |
| 47. | King Of Prussia | 2.02% | 0.40%(+1.62)#47 | 1.31%(+0.709)#2,082 |
| 48. | Bridgeport Borough | 1.92% | 0.40%(+1.52)#48 | 1.31%(+0.610)#2,184 |
| 49. | Dayton Borough | 1.88% | 0.40%(+1.48)#49 | 1.31%(+0.574)#2,231 |
| 50. | Ardmore | 1.88% | 0.40%(+1.48)#50 | 1.31%(+0.573)#2,233 |
| 51. | Horsham | 1.88% | 0.40%(+1.48)#51 | 1.31%(+0.571)#2,234 |
| 52. | Lititz Borough | 1.84% | 0.40%(+1.44)#52 | 1.31%(+0.531)#2,299 |
| 53. | Colony Park | 1.82% | 0.40%(+1.42)#53 | 1.31%(+0.510)#2,326 |
| 54. | Shippensburg University | 1.82% | 0.40%(+1.42)#54 | 1.31%(+0.509)#2,328 |
| 55. | Wellsboro Borough | 1.79% | 0.40%(+1.39)#55 | 1.31%(+0.482)#2,361 |
| 56. | Cementon | 1.76% | 0.40%(+1.36)#56 | 1.31%(+0.448)#2,419 |
| 57. | Park Forest Village | 1.75% | 0.40%(+1.35)#57 | 1.31%(+0.442)#2,430 |
| 58. | Newport Borough | 1.70% | 0.40%(+1.31)#58 | 1.31%(+0.395)#2,500 |
| 59. | Wayne | 1.66% | 0.40%(+1.27)#59 | 1.31%(+0.355)#2,572 |
| 60. | Stroudsburg Borough | 1.64% | 0.40%(+1.25)#60 | 1.31%(+0.335)#2,601 |
| 61. | Russell | 1.64% | 0.40%(+1.24)#61 | 1.31%(+0.329)#2,610 |
| 62. | Blossburg Borough | 1.63% | 0.40%(+1.24)#62 | 1.31%(+0.325)#2,617 |
| 63. | Aldan Borough | 1.63% | 0.40%(+1.23)#63 | 1.31%(+0.323)#2,627 |
| 64. | Turtle Creek Borough | 1.61% | 0.40%(+1.21)#64 | 1.31%(+0.302)#2,663 |
| 65. | Mcelhattan | 1.56% | 0.40%(+1.17)#65 | 1.31%(+0.254)#2,742 |
| 66. | Kratzerville | 1.56% | 0.40%(+1.16)#66 | 1.31%(+0.253)#2,749 |
| 67. | West Hamburg | 1.52% | 0.40%(+1.12)#67 | 1.31%(+0.206)#2,840 |
| 68. | Roaring Spring Borough | 1.51% | 0.40%(+1.11)#68 | 1.31%(+0.203)#2,846 |
| 69. | Mcdonald Borough | 1.50% | 0.40%(+1.10)#69 | 1.31%(+0.192)#2,862 |
| 70. | Newmanstown | 1.50% | 0.40%(+1.10)#70 | 1.31%(+0.192)#2,863 |
| 71. | East Brady Borough | 1.49% | 0.40%(+1.09)#71 | 1.31%(+0.183)#2,877 |
| 72. | Trafford Borough | 1.48% | 0.40%(+1.08)#72 | 1.31%(+0.173)#2,902 |
| 73. | Buck Run | 1.46% | 0.40%(+1.06)#73 | 1.31%(+0.146)#2,955 |
| 74. | Rockledge Borough | 1.45% | 0.40%(+1.05)#74 | 1.31%(+0.138)#2,968 |
| 75. | Blandon | 1.43% | 0.40%(+1.03)#75 | 1.31%(+0.120)#3,011 |
| 76. | Fallston Borough | 1.42% | 0.40%(+1.02)#76 | 1.31%(+0.112)#3,027 |
| 77. | Red Lion Borough | 1.42% | 0.40%(+1.02)#77 | 1.31%(+0.106)#3,043 |
| 78. | Nuangola Borough | 1.40% | 0.40%(+1.01)#78 | 1.31%(+0.095)#3,059 |
| 79. | Riverside Borough | 1.38% | 0.40%(+0.983)#79 | 1.31%(+0.072)#3,108 |
| 80. | Mount Pocono Borough | 1.32% | 0.40%(+0.925)#80 | 1.31%(+0.013)#3,237 |
| 81. | Seneca | 1.32% | 0.40%(+0.918)#81 | 1.31%(+0.007)#3,251 |
| 82. | Parkesburg Borough | 1.31% | 0.40%(+0.912)#82 | 1.31%(+0.001)#3,271 |
| 83. | Chesterbrook | 1.31% | 0.40%(+0.909)#83 | 1.31%(-0.002)#3,278 |
| 84. | Messiah College | 1.29% | 0.40%(+0.892)#84 | 1.31%(-0.019)#3,319 |
| 85. | Pen Mar | 1.27% | 0.40%(+0.876)#85 | 1.31%(-0.036)#3,358 |
| 86. | Clarks Summit Borough | 1.24% | 0.40%(+0.839)#86 | 1.31%(-0.072)#3,425 |
| 87. | Smithton Borough | 1.23% | 0.40%(+0.836)#87 | 1.31%(-0.075)#3,431 |
| 88. | Idaville | 1.23% | 0.40%(+0.836)#88 | 1.31%(-0.075)#3,432 |
| 89. | Lawson Heights | 1.21% | 0.40%(+0.812)#89 | 1.31%(-0.099)#3,479 |
| 90. | Mill Hall Borough | 1.20% | 0.40%(+0.802)#90 | 1.31%(-0.109)#3,504 |
| 91. | Arcadia University | 1.19% | 0.40%(+0.792)#91 | 1.31%(-0.119)#3,525 |
| 92. | Sellersville Borough | 1.19% | 0.40%(+0.791)#92 | 1.31%(-0.120)#3,527 |
| 93. | Baden Borough | 1.18% | 0.40%(+0.783)#93 | 1.31%(-0.128)#3,551 |
| 94. | Montgomeryville | 1.16% | 0.40%(+0.762)#94 | 1.31%(-0.149)#3,604 |
| 95. | Mckees Rocks Borough | 1.15% | 0.40%(+0.755)#95 | 1.31%(-0.156)#3,624 |
| 96. | Christiana Borough | 1.15% | 0.40%(+0.752)#96 | 1.31%(-0.159)#3,634 |
| 97. | Geistown Borough | 1.15% | 0.40%(+0.751)#97 | 1.31%(-0.160)#3,637 |
| 98. | Ancient Oaks | 1.14% | 0.40%(+0.742)#98 | 1.31%(-0.169)#3,652 |
| 99. | Hollidaysburg Borough | 1.14% | 0.40%(+0.738)#99 | 1.31%(-0.173)#3,658 |
| 100. | Grove City Borough | 1.11% | 0.40%(+0.714)#100 | 1.31%(-0.197)#3,717 |
Common Questions
What are the Top 10 Cities with the Highest Percentage of Korean Population in Pennsylvania?
Top 10 Cities with the Highest Percentage of Korean Population in Pennsylvania are:
#1
9.46%
#2
7.64%
#3
5.73%
#4
5.34%
#5
5.00%
#6
4.77%
#7
4.49%
#8
4.41%
#9
3.69%
#10
3.58%
What city has the Highest Percentage of Korean Population in Pennsylvania?
Reynolds Heights has the Highest Percentage of Korean Population in Pennsylvania with 9.46%.
What is the Percentage of Korean Population in the State of Pennsylvania?
Percentage of Korean Population in Pennsylvania is 0.40%.
What is the Percentage of Korean Population in the United States?
Percentage of Korean Population in the United States is 1.31%.