Cities with the Highest Percentage of Korean Population in Connecticut
RELATED REPORTS & OPTIONS
Korean
Connecticut
Compare Cities
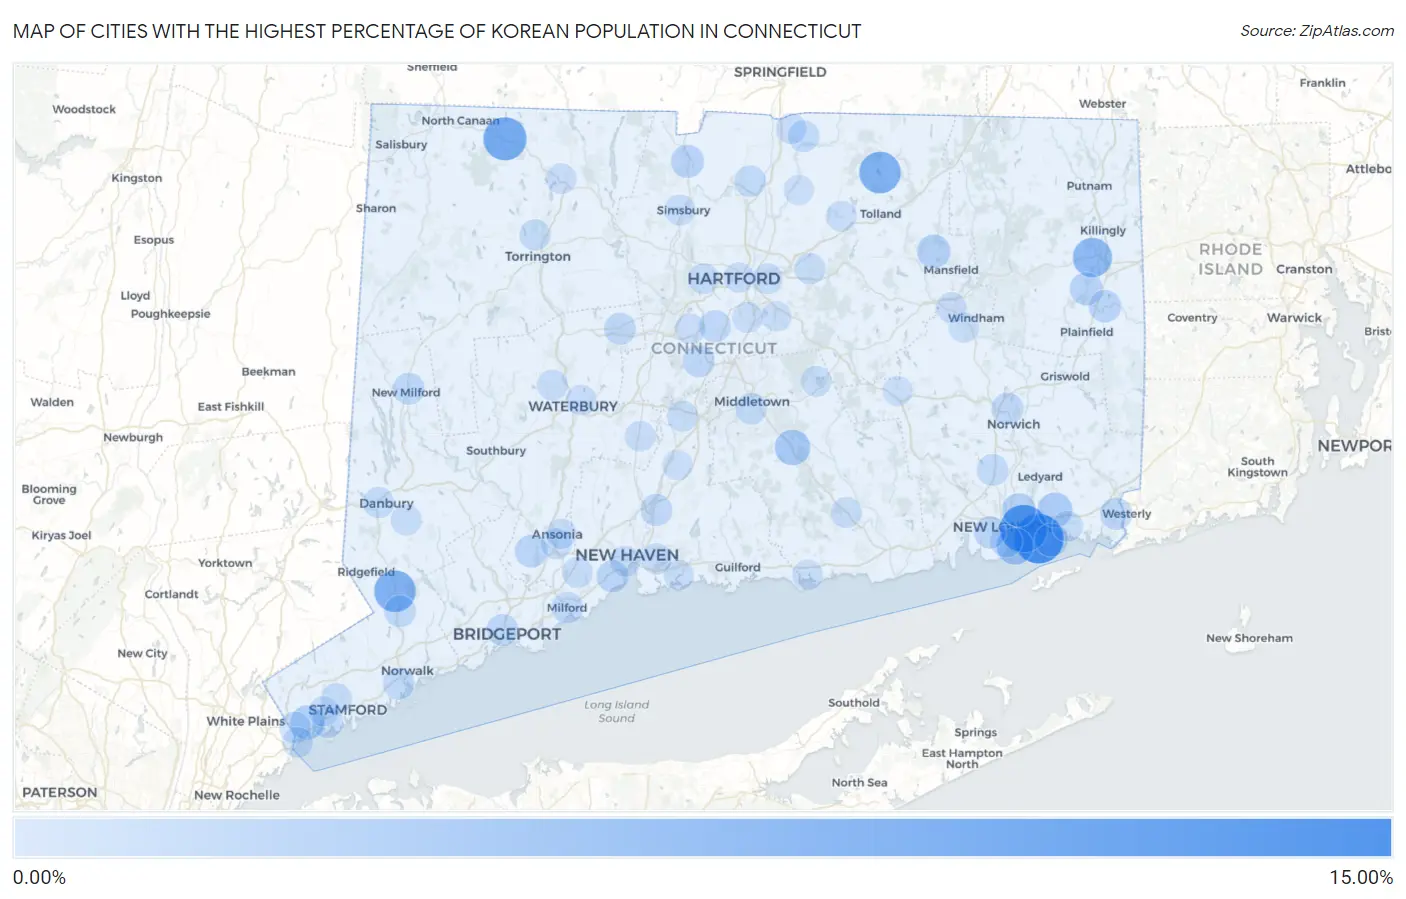
Map of Cities with the Highest Percentage of Korean Population in Connecticut
0.00%
15.00%
Cities with the Highest Percentage of Korean Population in Connecticut
| City | Korean | vs State | vs National | |
| 1. | Poquonock Bridge | 11.08% | 0.59%(+10.5)#1 | 1.31%(+9.77)#244 |
| 2. | Long Hill | 9.96% | 0.59%(+9.37)#2 | 1.31%(+8.65)#277 |
| 3. | Norfolk | 7.36% | 0.59%(+6.78)#3 | 1.31%(+6.05)#403 |
| 4. | Georgetown | 6.46% | 0.59%(+5.87)#4 | 1.31%(+5.15)#478 |
| 5. | Crystal Lake | 6.39% | 0.59%(+5.81)#5 | 1.31%(+5.08)#487 |
| 6. | Bigelow Corners | 5.66% | 0.59%(+5.08)#6 | 1.31%(+4.35)#583 |
| 7. | Noroton | 5.53% | 0.59%(+4.94)#7 | 1.31%(+4.22)#607 |
| 8. | East Brooklyn | 5.12% | 0.59%(+4.53)#8 | 1.31%(+3.81)#670 |
| 9. | Groton | 3.62% | 0.59%(+3.03)#9 | 1.31%(+2.31)#1,053 |
| 10. | Higganum | 2.95% | 0.59%(+2.37)#10 | 1.31%(+1.64)#1,356 |
| 11. | Old Mystic | 2.66% | 0.59%(+2.07)#11 | 1.31%(+1.35)#1,541 |
| 12. | Northford | 2.63% | 0.59%(+2.05)#12 | 1.31%(+1.32)#1,567 |
| 13. | Greenwich | 2.29% | 0.59%(+1.70)#13 | 1.31%(+0.982)#1,804 |
| 14. | Litchfield Borough | 2.29% | 0.59%(+1.70)#14 | 1.31%(+0.978)#1,810 |
| 15. | Candlewood Shores | 2.15% | 0.59%(+1.56)#15 | 1.31%(+0.837)#1,941 |
| 16. | Storrs | 1.84% | 0.59%(+1.25)#16 | 1.31%(+0.530)#2,300 |
| 17. | Conning Towers Nautilus Park | 1.82% | 0.59%(+1.24)#17 | 1.31%(+0.515)#2,323 |
| 18. | Westport | 1.65% | 0.59%(+1.06)#18 | 1.31%(+0.339)#2,589 |
| 19. | Noank | 1.58% | 0.59%(+0.994)#19 | 1.31%(+0.271)#2,706 |
| 20. | Inglenook | 1.57% | 0.59%(+0.984)#20 | 1.31%(+0.261)#2,725 |
| 21. | Salmon Brook | 1.51% | 0.59%(+0.924)#21 | 1.31%(+0.201)#2,851 |
| 22. | Wauregan | 1.43% | 0.59%(+0.846)#22 | 1.31%(+0.123)#3,004 |
| 23. | East | 1.43% | 0.59%(+0.845)#23 | 1.31%(+0.122)#3,006 |
| 24. | Shelton | 1.36% | 0.59%(+0.777)#24 | 1.31%(+0.054)#3,146 |
| 25. | Indian Field | 1.33% | 0.59%(+0.743)#25 | 1.31%(+0.020)#3,224 |
| 26. | Moosup | 1.23% | 0.59%(+0.641)#26 | 1.31%(-0.082)#3,438 |
| 27. | New London | 1.19% | 0.59%(+0.605)#27 | 1.31%(-0.118)#3,522 |
| 28. | Sacred Heart University | 1.18% | 0.59%(+0.595)#28 | 1.31%(-0.128)#3,552 |
| 29. | Pawcatuck | 1.08% | 0.59%(+0.490)#29 | 1.31%(-0.233)#3,826 |
| 30. | Waterford | 1.04% | 0.59%(+0.451)#30 | 1.31%(-0.272)#3,941 |
| 31. | West Haven | 1.04% | 0.59%(+0.449)#31 | 1.31%(-0.274)#3,949 |
| 32. | Norwich | 1.02% | 0.59%(+0.432)#32 | 1.31%(-0.291)#3,996 |
| 33. | Bristol | 1.00% | 0.59%(+0.414)#33 | 1.31%(-0.309)#4,062 |
| 34. | New Milford | 1.00% | 0.59%(+0.414)#34 | 1.31%(-0.309)#4,063 |
| 35. | North Haven | 0.96% | 0.59%(+0.377)#35 | 1.31%(-0.346)#4,180 |
| 36. | Kensington | 0.96% | 0.59%(+0.373)#36 | 1.31%(-0.350)#4,193 |
| 37. | Newington | 0.94% | 0.59%(+0.355)#37 | 1.31%(-0.368)#4,249 |
| 38. | Cannondale | 0.94% | 0.59%(+0.353)#38 | 1.31%(-0.370)#4,254 |
| 39. | Bridgeport | 0.92% | 0.59%(+0.333)#39 | 1.31%(-0.390)#4,335 |
| 40. | Lordship | 0.81% | 0.59%(+0.218)#40 | 1.31%(-0.505)#4,795 |
| 41. | Coleytown | 0.80% | 0.59%(+0.210)#41 | 1.31%(-0.514)#4,832 |
| 42. | Norwalk | 0.79% | 0.59%(+0.199)#42 | 1.31%(-0.524)#4,873 |
| 43. | Oxoboxo River | 0.78% | 0.59%(+0.195)#43 | 1.31%(-0.528)#4,886 |
| 44. | Pemberwick | 0.78% | 0.59%(+0.191)#44 | 1.31%(-0.532)#4,898 |
| 45. | Windsor Locks | 0.76% | 0.59%(+0.177)#45 | 1.31%(-0.546)#4,958 |
| 46. | Milford City Balance | 0.73% | 0.59%(+0.139)#46 | 1.31%(-0.584)#5,127 |
| 47. | Hazardville | 0.70% | 0.59%(+0.115)#47 | 1.31%(-0.608)#5,254 |
| 48. | Quinnipiac University | 0.69% | 0.59%(+0.103)#48 | 1.31%(-0.620)#5,317 |
| 49. | Middletown | 0.68% | 0.59%(+0.094)#49 | 1.31%(-0.629)#5,367 |
| 50. | Tashua | 0.68% | 0.59%(+0.089)#50 | 1.31%(-0.634)#5,394 |
| 51. | Stratford Downtown | 0.67% | 0.59%(+0.080)#51 | 1.31%(-0.643)#5,448 |
| 52. | Staples | 0.65% | 0.59%(+0.066)#52 | 1.31%(-0.657)#5,503 |
| 53. | Stamford | 0.59% | 0.59%(+0.002)#53 | 1.31%(-0.721)#5,852 |
| 54. | Torrington | 0.56% | 0.59%(-0.026)#54 | 1.31%(-0.750)#6,019 |
| 55. | Trumbull Center | 0.55% | 0.59%(-0.035)#55 | 1.31%(-0.758)#6,082 |
| 56. | Riverside | 0.53% | 0.59%(-0.059)#56 | 1.31%(-0.782)#6,239 |
| 57. | Danbury | 0.51% | 0.59%(-0.081)#57 | 1.31%(-0.805)#6,401 |
| 58. | East Haven | 0.48% | 0.59%(-0.106)#58 | 1.31%(-0.829)#6,558 |
| 59. | Meriden | 0.48% | 0.59%(-0.110)#59 | 1.31%(-0.833)#6,589 |
| 60. | Manchester | 0.47% | 0.59%(-0.120)#60 | 1.31%(-0.843)#6,661 |
| 61. | Bethel | 0.46% | 0.59%(-0.128)#61 | 1.31%(-0.851)#6,718 |
| 62. | Derby | 0.44% | 0.59%(-0.150)#62 | 1.31%(-0.874)#6,839 |
| 63. | Byram | 0.42% | 0.59%(-0.171)#63 | 1.31%(-0.894)#6,976 |
| 64. | West Hartford | 0.39% | 0.59%(-0.192)#64 | 1.31%(-0.915)#7,114 |
| 65. | Deep River Center | 0.37% | 0.59%(-0.217)#65 | 1.31%(-0.940)#7,288 |
| 66. | Ridgebury | 0.37% | 0.59%(-0.221)#66 | 1.31%(-0.944)#7,318 |
| 67. | Mystic | 0.36% | 0.59%(-0.225)#67 | 1.31%(-0.948)#7,355 |
| 68. | Orange | 0.36% | 0.59%(-0.229)#68 | 1.31%(-0.952)#7,382 |
| 69. | Oakville | 0.35% | 0.59%(-0.235)#69 | 1.31%(-0.958)#7,439 |
| 70. | Dayville | 0.34% | 0.59%(-0.242)#70 | 1.31%(-0.965)#7,483 |
| 71. | Lake Pocotopaug | 0.34% | 0.59%(-0.251)#71 | 1.31%(-0.974)#7,558 |
| 72. | East Hartford | 0.33% | 0.59%(-0.255)#72 | 1.31%(-0.978)#7,588 |
| 73. | Simsbury Center | 0.33% | 0.59%(-0.260)#73 | 1.31%(-0.983)#7,625 |
| 74. | New Haven | 0.31% | 0.59%(-0.273)#74 | 1.31%(-0.996)#7,745 |
| 75. | Naugatuck Borough | 0.29% | 0.59%(-0.296)#75 | 1.31%(-1.02)#7,919 |
| 76. | Clinton | 0.29% | 0.59%(-0.298)#76 | 1.31%(-1.02)#7,932 |
| 77. | Rockville | 0.29% | 0.59%(-0.299)#77 | 1.31%(-1.02)#7,946 |
| 78. | Danielson Borough | 0.26% | 0.59%(-0.323)#78 | 1.31%(-1.05)#8,143 |
| 79. | Greens Farms | 0.26% | 0.59%(-0.325)#79 | 1.31%(-1.05)#8,161 |
| 80. | Waterbury | 0.24% | 0.59%(-0.344)#80 | 1.31%(-1.07)#8,322 |
| 81. | Winsted | 0.23% | 0.59%(-0.354)#81 | 1.31%(-1.08)#8,416 |
| 82. | Sherwood Manor | 0.23% | 0.59%(-0.360)#82 | 1.31%(-1.08)#8,463 |
| 83. | Cheshire Village | 0.22% | 0.59%(-0.366)#83 | 1.31%(-1.09)#8,516 |
| 84. | Wethersfield | 0.22% | 0.59%(-0.370)#84 | 1.31%(-1.09)#8,555 |
| 85. | New Britain | 0.18% | 0.59%(-0.406)#85 | 1.31%(-1.13)#8,857 |
| 86. | Hartford | 0.17% | 0.59%(-0.418)#86 | 1.31%(-1.14)#8,936 |
| 87. | Branford Center | 0.16% | 0.59%(-0.426)#87 | 1.31%(-1.15)#8,998 |
| 88. | Ansonia | 0.15% | 0.59%(-0.434)#88 | 1.31%(-1.16)#9,071 |
| 89. | Willimantic | 0.13% | 0.59%(-0.457)#89 | 1.31%(-1.18)#9,295 |
| 90. | Cos Cob | 0.11% | 0.59%(-0.476)#90 | 1.31%(-1.20)#9,465 |
| 91. | Wallingford Center | 0.096% | 0.59%(-0.491)#91 | 1.31%(-1.21)#9,573 |
| 92. | South Windham | 0.071% | 0.59%(-0.516)#92 | 1.31%(-1.24)#9,745 |
| 93. | Glastonbury Center | 0.063% | 0.59%(-0.524)#93 | 1.31%(-1.25)#9,785 |
| 94. | Saugatuck | 0.033% | 0.59%(-0.554)#94 | 1.31%(-1.28)#9,936 |
| 95. | Broad Brook | 0.025% | 0.59%(-0.562)#95 | 1.31%(-1.29)#9,969 |
| 96. | Colchester | 0.021% | 0.59%(-0.566)#96 | 1.31%(-1.29)#9,989 |
1
2Common Questions
What are the Top 10 Cities with the Highest Percentage of Korean Population in Connecticut?
Top 10 Cities with the Highest Percentage of Korean Population in Connecticut are:
#1
11.08%
#2
9.96%
#3
7.36%
#4
6.46%
#5
6.39%
#6
5.12%
#7
3.62%
#8
2.95%
#9
2.66%
#10
2.29%
What city has the Highest Percentage of Korean Population in Connecticut?
Poquonock Bridge has the Highest Percentage of Korean Population in Connecticut with 11.08%.
What is the Percentage of Korean Population in the State of Connecticut?
Percentage of Korean Population in Connecticut is 0.59%.
What is the Percentage of Korean Population in the United States?
Percentage of Korean Population in the United States is 1.31%.