Cities with the Highest Percentage of Korean Population in Georgia
RELATED REPORTS & OPTIONS
Korean
Georgia
Compare Cities
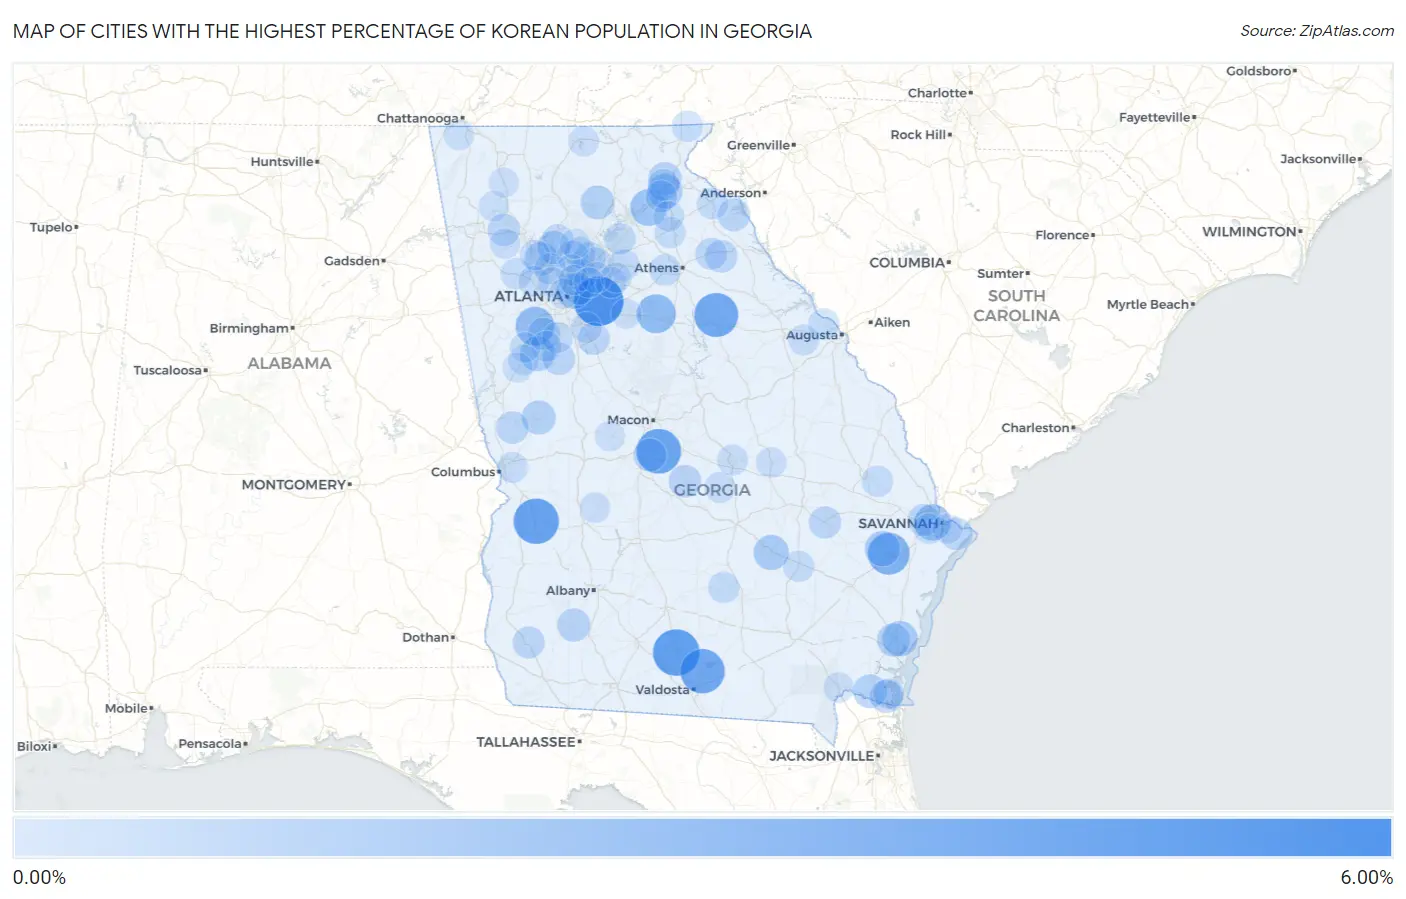
Map of Cities with the Highest Percentage of Korean Population in Georgia
0.00%
6.00%
Cities with the Highest Percentage of Korean Population in Georgia
| City | Korean | vs State | vs National | |
| 1. | Lithonia | 5.93% | 0.48%(+5.45)#1 | 1.31%(+4.62)#544 |
| 2. | Adel | 5.08% | 0.48%(+4.60)#2 | 1.31%(+3.77)#678 |
| 3. | Richland | 4.73% | 0.48%(+4.25)#3 | 1.31%(+3.42)#749 |
| 4. | Robins Afb | 4.56% | 0.48%(+4.08)#4 | 1.31%(+3.25)#787 |
| 5. | Moody Afb | 4.45% | 0.48%(+3.97)#5 | 1.31%(+3.14)#805 |
| 6. | Union Point | 4.33% | 0.48%(+3.85)#6 | 1.31%(+3.02)#828 |
| 7. | Flemington | 3.74% | 0.48%(+3.26)#7 | 1.31%(+2.43)#1,011 |
| 8. | Rutledge | 2.99% | 0.48%(+2.51)#8 | 1.31%(+1.68)#1,331 |
| 9. | Palmetto | 2.88% | 0.48%(+2.40)#9 | 1.31%(+1.57)#1,408 |
| 10. | Lula | 2.40% | 0.48%(+1.91)#10 | 1.31%(+1.09)#1,714 |
| 11. | Garden City | 2.24% | 0.48%(+1.76)#11 | 1.31%(+0.931)#1,850 |
| 12. | West Brow | 2.23% | 0.48%(+1.75)#12 | 1.31%(+0.918)#1,864 |
| 13. | Bemiss | 2.22% | 0.48%(+1.74)#13 | 1.31%(+0.911)#1,876 |
| 14. | Cusseta Chattahoochee County Unified Government | 1.98% | 0.48%(+1.50)#14 | 1.31%(+0.668)#2,118 |
| 15. | Country Club Estates | 1.95% | 0.48%(+1.47)#15 | 1.31%(+0.644)#2,146 |
| 16. | Fort Stewart | 1.94% | 0.48%(+1.46)#16 | 1.31%(+0.631)#2,159 |
| 17. | Hazlehurst | 1.91% | 0.48%(+1.43)#17 | 1.31%(+0.604)#2,193 |
| 18. | Druid Hills | 1.84% | 0.48%(+1.36)#18 | 1.31%(+0.532)#2,295 |
| 19. | Sharpsburg | 1.84% | 0.48%(+1.36)#19 | 1.31%(+0.532)#2,297 |
| 20. | Cornelia | 1.81% | 0.48%(+1.33)#20 | 1.31%(+0.497)#2,346 |
| 21. | Manchester | 1.61% | 0.48%(+1.12)#21 | 1.31%(+0.296)#2,674 |
| 22. | Kingsland | 1.54% | 0.48%(+1.05)#22 | 1.31%(+0.225)#2,799 |
| 23. | Dawsonville | 1.52% | 0.48%(+1.04)#23 | 1.31%(+0.214)#2,823 |
| 24. | Dock Junction | 1.47% | 0.48%(+0.986)#24 | 1.31%(+0.158)#2,939 |
| 25. | Kennesaw | 1.44% | 0.48%(+0.963)#25 | 1.31%(+0.135)#2,973 |
| 26. | Clarkesville | 1.43% | 0.48%(+0.951)#26 | 1.31%(+0.122)#3,005 |
| 27. | Newton | 1.39% | 0.48%(+0.907)#27 | 1.31%(+0.079)#3,088 |
| 28. | St Marys | 1.39% | 0.48%(+0.907)#28 | 1.31%(+0.079)#3,091 |
| 29. | Woodstock | 1.36% | 0.48%(+0.875)#29 | 1.31%(+0.046)#3,168 |
| 30. | Warner Robins | 1.35% | 0.48%(+0.873)#30 | 1.31%(+0.045)#3,171 |
| 31. | Cochran | 1.27% | 0.48%(+0.792)#31 | 1.31%(-0.036)#3,360 |
| 32. | Brooks | 1.25% | 0.48%(+0.770)#32 | 1.31%(-0.058)#3,397 |
| 33. | Carlton | 1.24% | 0.48%(+0.759)#33 | 1.31%(-0.069)#3,419 |
| 34. | Hartwell | 1.23% | 0.48%(+0.746)#34 | 1.31%(-0.083)#3,442 |
| 35. | Wilmington Island | 1.19% | 0.48%(+0.706)#35 | 1.31%(-0.122)#3,529 |
| 36. | Hamilton | 1.18% | 0.48%(+0.700)#36 | 1.31%(-0.128)#3,553 |
| 37. | Kingston | 1.16% | 0.48%(+0.681)#37 | 1.31%(-0.147)#3,596 |
| 38. | Reidsville | 1.14% | 0.48%(+0.661)#38 | 1.31%(-0.167)#3,649 |
| 39. | Tyrone | 1.14% | 0.48%(+0.660)#39 | 1.31%(-0.169)#3,650 |
| 40. | Mcdonough | 1.14% | 0.48%(+0.655)#40 | 1.31%(-0.174)#3,663 |
| 41. | Pooler | 1.09% | 0.48%(+0.604)#41 | 1.31%(-0.225)#3,799 |
| 42. | Colquitt | 1.08% | 0.48%(+0.598)#42 | 1.31%(-0.231)#3,818 |
| 43. | North Decatur | 1.08% | 0.48%(+0.595)#43 | 1.31%(-0.233)#3,827 |
| 44. | Demorest | 1.05% | 0.48%(+0.565)#44 | 1.31%(-0.263)#3,916 |
| 45. | Baldwin | 1.00% | 0.48%(+0.514)#45 | 1.31%(-0.314)#4,081 |
| 46. | Comer | 0.99% | 0.48%(+0.513)#46 | 1.31%(-0.315)#4,084 |
| 47. | Dacula | 0.96% | 0.48%(+0.474)#47 | 1.31%(-0.354)#4,207 |
| 48. | Johns Creek | 0.95% | 0.48%(+0.473)#48 | 1.31%(-0.355)#4,211 |
| 49. | Doraville | 0.95% | 0.48%(+0.472)#49 | 1.31%(-0.356)#4,216 |
| 50. | Bogart | 0.94% | 0.48%(+0.459)#50 | 1.31%(-0.370)#4,252 |
| 51. | Flowery Branch | 0.93% | 0.48%(+0.446)#51 | 1.31%(-0.382)#4,312 |
| 52. | Holly Springs | 0.92% | 0.48%(+0.442)#52 | 1.31%(-0.386)#4,328 |
| 53. | Ambrose | 0.90% | 0.48%(+0.423)#53 | 1.31%(-0.405)#4,397 |
| 54. | Marietta | 0.89% | 0.48%(+0.406)#54 | 1.31%(-0.422)#4,454 |
| 55. | Roswell | 0.88% | 0.48%(+0.400)#55 | 1.31%(-0.428)#4,471 |
| 56. | Commerce | 0.88% | 0.48%(+0.398)#56 | 1.31%(-0.431)#4,486 |
| 57. | Lavonia | 0.88% | 0.48%(+0.397)#57 | 1.31%(-0.431)#4,488 |
| 58. | Alpharetta | 0.88% | 0.48%(+0.394)#58 | 1.31%(-0.434)#4,497 |
| 59. | Dallas | 0.87% | 0.48%(+0.389)#59 | 1.31%(-0.439)#4,515 |
| 60. | Brooklet | 0.85% | 0.48%(+0.369)#60 | 1.31%(-0.459)#4,594 |
| 61. | Baxley | 0.84% | 0.48%(+0.363)#61 | 1.31%(-0.465)#4,612 |
| 62. | Sky Valley | 0.83% | 0.48%(+0.353)#62 | 1.31%(-0.475)#4,661 |
| 63. | Fayetteville | 0.82% | 0.48%(+0.339)#63 | 1.31%(-0.489)#4,727 |
| 64. | Evans | 0.81% | 0.48%(+0.330)#64 | 1.31%(-0.498)#4,768 |
| 65. | Powder Springs | 0.80% | 0.48%(+0.316)#65 | 1.31%(-0.513)#4,827 |
| 66. | Cadwell | 0.79% | 0.48%(+0.308)#66 | 1.31%(-0.520)#4,859 |
| 67. | Dublin | 0.79% | 0.48%(+0.307)#67 | 1.31%(-0.522)#4,866 |
| 68. | Stockbridge | 0.78% | 0.48%(+0.298)#68 | 1.31%(-0.530)#4,896 |
| 69. | Snellville | 0.77% | 0.48%(+0.284)#69 | 1.31%(-0.544)#4,950 |
| 70. | Harlem | 0.76% | 0.48%(+0.279)#70 | 1.31%(-0.550)#4,972 |
| 71. | Sandy Springs | 0.76% | 0.48%(+0.278)#71 | 1.31%(-0.551)#4,978 |
| 72. | Lilburn | 0.75% | 0.48%(+0.265)#72 | 1.31%(-0.564)#5,037 |
| 73. | Columbus | 0.74% | 0.48%(+0.262)#73 | 1.31%(-0.566)#5,047 |
| 74. | Kings Bay Base | 0.73% | 0.48%(+0.253)#74 | 1.31%(-0.575)#5,093 |
| 75. | Homer | 0.72% | 0.48%(+0.242)#75 | 1.31%(-0.587)#5,148 |
| 76. | Peachtree City | 0.72% | 0.48%(+0.240)#76 | 1.31%(-0.589)#5,165 |
| 77. | Folkston | 0.70% | 0.48%(+0.223)#77 | 1.31%(-0.606)#5,245 |
| 78. | Savannah | 0.70% | 0.48%(+0.218)#78 | 1.31%(-0.611)#5,267 |
| 79. | Morganton | 0.69% | 0.48%(+0.213)#79 | 1.31%(-0.616)#5,295 |
| 80. | Acworth | 0.68% | 0.48%(+0.199)#80 | 1.31%(-0.629)#5,368 |
| 81. | Andersonville | 0.68% | 0.48%(+0.194)#81 | 1.31%(-0.634)#5,395 |
| 82. | Duluth | 0.67% | 0.48%(+0.186)#82 | 1.31%(-0.642)#5,445 |
| 83. | Moreland | 0.66% | 0.48%(+0.176)#83 | 1.31%(-0.652)#5,485 |
| 84. | Newnan | 0.66% | 0.48%(+0.174)#84 | 1.31%(-0.654)#5,494 |
| 85. | Adrian | 0.65% | 0.48%(+0.170)#85 | 1.31%(-0.658)#5,509 |
| 86. | Chattanooga Valley | 0.65% | 0.48%(+0.167)#86 | 1.31%(-0.662)#5,528 |
| 87. | Plainville | 0.64% | 0.48%(+0.155)#87 | 1.31%(-0.673)#5,575 |
| 88. | Grayson | 0.63% | 0.48%(+0.153)#88 | 1.31%(-0.676)#5,588 |
| 89. | Euharlee | 0.63% | 0.48%(+0.153)#89 | 1.31%(-0.676)#5,591 |
| 90. | Milton | 0.63% | 0.48%(+0.145)#90 | 1.31%(-0.684)#5,628 |
| 91. | Smyrna | 0.62% | 0.48%(+0.138)#91 | 1.31%(-0.691)#5,657 |
| 92. | Roberta | 0.62% | 0.48%(+0.134)#92 | 1.31%(-0.694)#5,679 |
| 93. | Atlanta | 0.61% | 0.48%(+0.126)#93 | 1.31%(-0.702)#5,731 |
| 94. | Brookhaven | 0.61% | 0.48%(+0.125)#94 | 1.31%(-0.703)#5,735 |
| 95. | Athens-Clarke County Unified Government (Balance) | 0.60% | 0.48%(+0.118)#95 | 1.31%(-0.710)#5,776 |
| 96. | Grantville | 0.60% | 0.48%(+0.117)#96 | 1.31%(-0.712)#5,792 |
| 97. | Oxford | 0.59% | 0.48%(+0.109)#97 | 1.31%(-0.720)#5,841 |
| 98. | Tucker | 0.59% | 0.48%(+0.108)#98 | 1.31%(-0.721)#5,849 |
| 99. | Thunderbolt | 0.59% | 0.48%(+0.106)#99 | 1.31%(-0.722)#5,856 |
| 100. | Resaca | 0.59% | 0.48%(+0.105)#100 | 1.31%(-0.723)#5,862 |
Common Questions
What are the Top 10 Cities with the Highest Percentage of Korean Population in Georgia?
Top 10 Cities with the Highest Percentage of Korean Population in Georgia are:
#1
5.93%
#2
5.08%
#3
4.73%
#4
4.56%
#5
4.45%
#6
4.33%
#7
3.74%
#8
2.99%
#9
2.88%
#10
2.40%
What city has the Highest Percentage of Korean Population in Georgia?
Lithonia has the Highest Percentage of Korean Population in Georgia with 5.93%.
What is the Percentage of Korean Population in the State of Georgia?
Percentage of Korean Population in Georgia is 0.48%.
What is the Percentage of Korean Population in the United States?
Percentage of Korean Population in the United States is 1.31%.