Lake Mathews, CA Map & Demographics
Lake Mathews Map
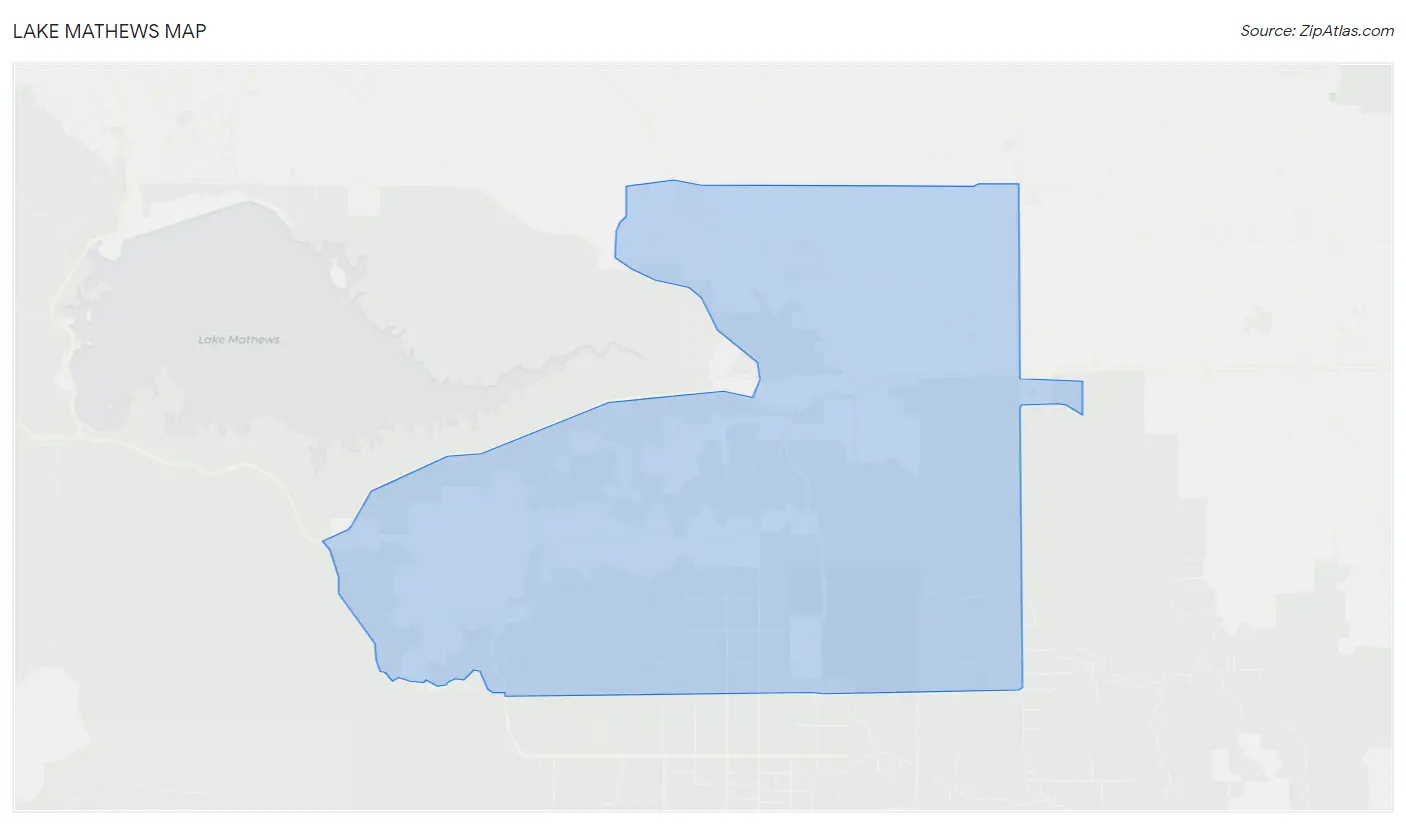
Lake Mathews Overview
$34,447
PER CAPITA INCOME
$100,067
AVG FAMILY INCOME
$102,537
AVG HOUSEHOLD INCOME
28.1%
WAGE / INCOME GAP [ % ]
71.9¢/ $1
WAGE / INCOME GAP [ $ ]
0.42
INEQUALITY / GINI INDEX
6,494
TOTAL POPULATION
3,353
MALE POPULATION
3,141
FEMALE POPULATION
106.75
MALES / 100 FEMALES
93.68
FEMALES / 100 MALES
37.6
MEDIAN AGE
3.9
AVG FAMILY SIZE
3.8
AVG HOUSEHOLD SIZE
2,480
LABOR FORCE [ PEOPLE ]
49.9%
PERCENT IN LABOR FORCE
11.7%
UNEMPLOYMENT RATE
Lake Mathews Area Codes
Income in Lake Mathews
Income Overview in Lake Mathews
Per Capita Income in Lake Mathews is $34,447, while median incomes of families and households are $100,067 and $102,537 respectively.
| Characteristic | Number | Measure |
| Per Capita Income | 6,494 | $34,447 |
| Median Family Income | 1,498 | $100,067 |
| Mean Family Income | 1,498 | $122,975 |
| Median Household Income | 1,715 | $102,537 |
| Mean Household Income | 1,715 | $125,323 |
| Income Deficit | 1,498 | $0 |
| Wage / Income Gap (%) | 6,494 | 28.12% |
| Wage / Income Gap ($) | 6,494 | 71.88¢ per $1 |
| Gini / Inequality Index | 6,494 | 0.42 |
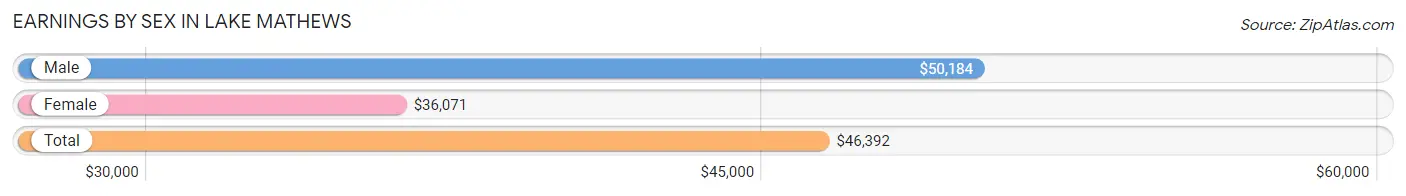
Earnings by Sex in Lake Mathews
Average Earnings in Lake Mathews are $46,392, $50,184 for men and $36,071 for women, a difference of 28.1%.
| Sex | Number | Average Earnings |
| Male | 1,392 (57.1%) | $50,184 |
| Female | 1,044 (42.9%) | $36,071 |
| Total | 2,436 (100.0%) | $46,392 |
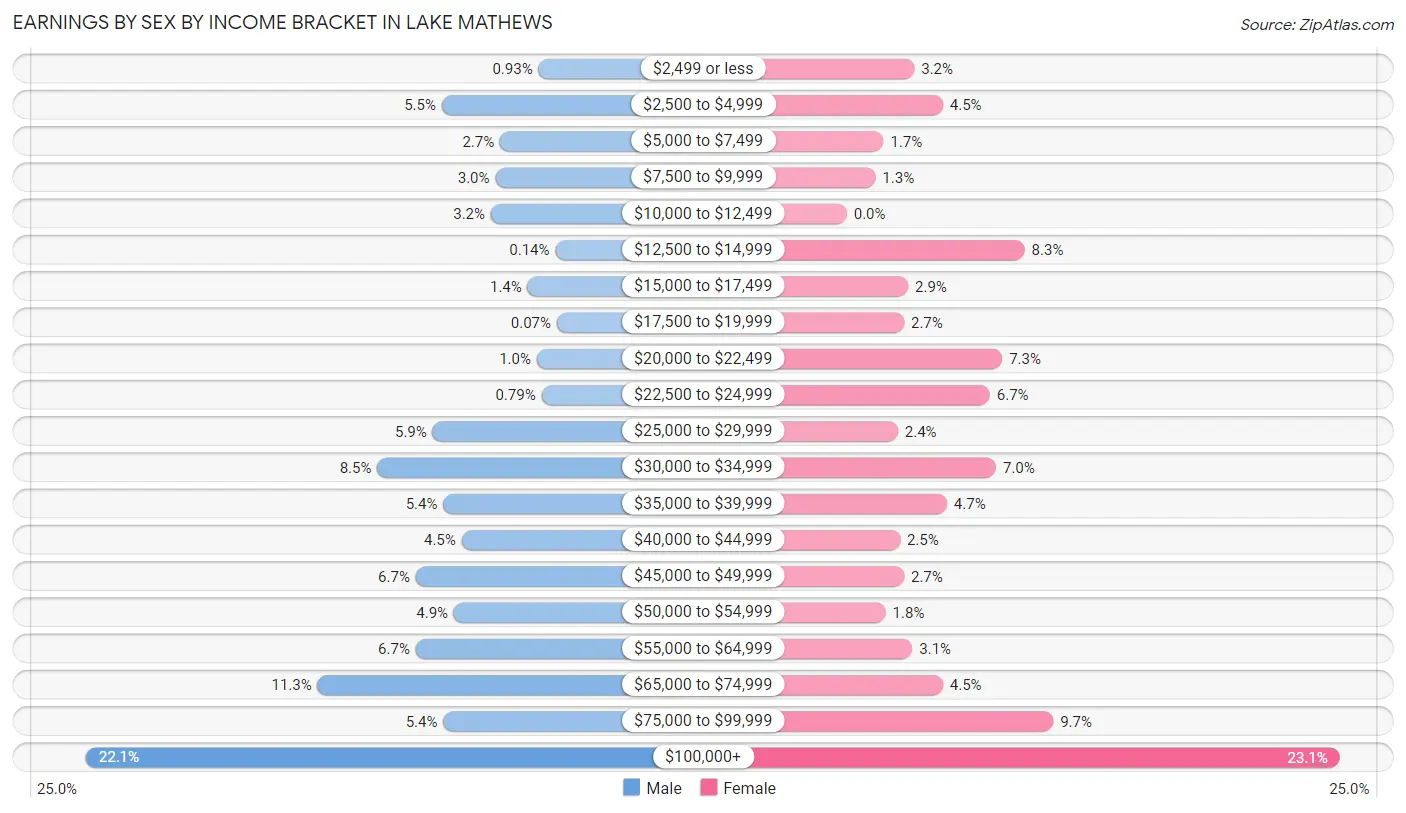
Earnings by Sex by Income Bracket in Lake Mathews
The most common earnings brackets in Lake Mathews are $100,000+ for men (308 | 22.1%) and $100,000+ for women (241 | 23.1%).
| Income | Male | Female |
| $2,499 or less | 13 (0.9%) | 33 (3.2%) |
| $2,500 to $4,999 | 76 (5.5%) | 47 (4.5%) |
| $5,000 to $7,499 | 38 (2.7%) | 18 (1.7%) |
| $7,500 to $9,999 | 41 (2.9%) | 14 (1.3%) |
| $10,000 to $12,499 | 44 (3.2%) | 0 (0.0%) |
| $12,500 to $14,999 | 2 (0.1%) | 87 (8.3%) |
| $15,000 to $17,499 | 20 (1.4%) | 30 (2.9%) |
| $17,500 to $19,999 | 1 (0.1%) | 28 (2.7%) |
| $20,000 to $22,499 | 14 (1.0%) | 76 (7.3%) |
| $22,500 to $24,999 | 11 (0.8%) | 70 (6.7%) |
| $25,000 to $29,999 | 82 (5.9%) | 25 (2.4%) |
| $30,000 to $34,999 | 118 (8.5%) | 73 (7.0%) |
| $35,000 to $39,999 | 75 (5.4%) | 49 (4.7%) |
| $40,000 to $44,999 | 63 (4.5%) | 26 (2.5%) |
| $45,000 to $49,999 | 93 (6.7%) | 28 (2.7%) |
| $50,000 to $54,999 | 68 (4.9%) | 19 (1.8%) |
| $55,000 to $64,999 | 93 (6.7%) | 32 (3.1%) |
| $65,000 to $74,999 | 157 (11.3%) | 47 (4.5%) |
| $75,000 to $99,999 | 75 (5.4%) | 101 (9.7%) |
| $100,000+ | 308 (22.1%) | 241 (23.1%) |
| Total | 1,392 (100.0%) | 1,044 (100.0%) |
Earnings by Sex by Educational Attainment in Lake Mathews
Average earnings in Lake Mathews are $51,985 for men and $53,000 for women, a difference of 1.9%. Men with an educational attainment of graduate degree enjoy the highest average annual earnings of $243,472, while those with less than high school education earn the least with $32,340. Women with an educational attainment of graduate degree earn the most with the average annual earnings of $104,741, while those with college or associate's degree education have the smallest earnings of $35,521.

| Educational Attainment | Male Income | Female Income |
| Less than High School | $32,340 | $0 |
| High School Diploma | $51,685 | $47,727 |
| College or Associate's Degree | $57,500 | $35,521 |
| Bachelor's Degree | $74,471 | $82,656 |
| Graduate Degree | $243,472 | $104,741 |
| Total | $51,985 | $53,000 |
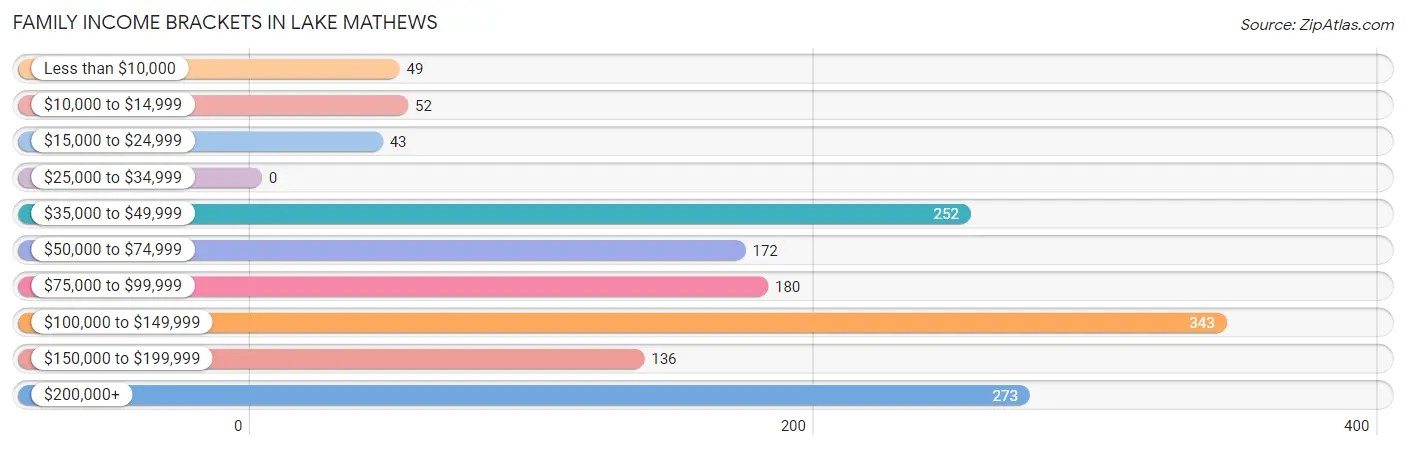
Family Income in Lake Mathews
Family Income Brackets in Lake Mathews
According to the Lake Mathews family income data, there are 343 families falling into the $100,000 to $149,999 income range, which is the most common income bracket and makes up 22.9% of all families.
| Income Bracket | # Families | % Families |
| Less than $10,000 | 49 | 3.3% |
| $10,000 to $14,999 | 52 | 3.5% |
| $15,000 to $24,999 | 43 | 2.9% |
| $25,000 to $34,999 | 0 | 0.0% |
| $35,000 to $49,999 | 252 | 16.8% |
| $50,000 to $74,999 | 172 | 11.5% |
| $75,000 to $99,999 | 180 | 12.0% |
| $100,000 to $149,999 | 343 | 22.9% |
| $150,000 to $199,999 | 136 | 9.1% |
| $200,000+ | 273 | 18.2% |
Family Income by Famaliy Size in Lake Mathews
7+ person families (50 | 3.3%) account for the highest median family income in Lake Mathews with $180,167 per family, while 2-person families (469 | 31.3%) have the highest median income of $50,561 per family member.
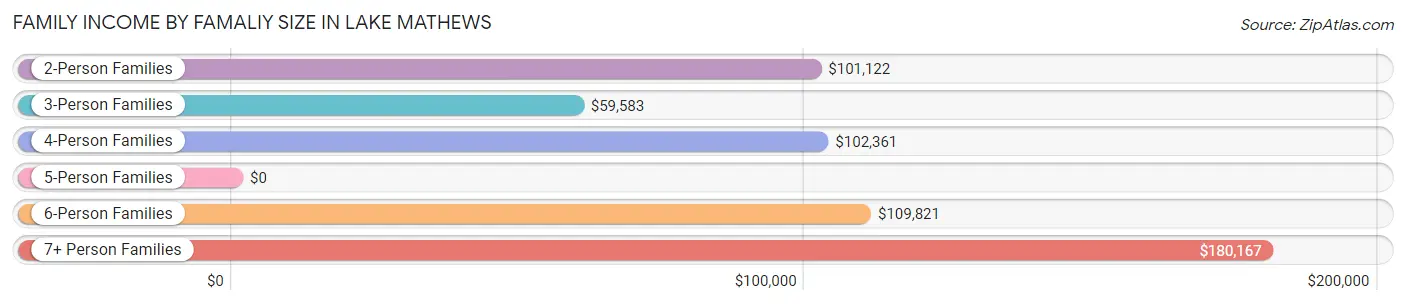
| Income Bracket | # Families | Median Income |
| 2-Person Families | 469 (31.3%) | $101,122 |
| 3-Person Families | 347 (23.2%) | $59,583 |
| 4-Person Families | 252 (16.8%) | $102,361 |
| 5-Person Families | 296 (19.8%) | $0 |
| 6-Person Families | 84 (5.6%) | $109,821 |
| 7+ Person Families | 50 (3.3%) | $180,167 |
| Total | 1,498 (100.0%) | $100,067 |
Family Income by Number of Earners in Lake Mathews
The median family income in Lake Mathews is $100,067, with families comprising 3+ earners (124) having the highest median family income of $157,300, while families with no earners (260) have the lowest median family income of $55,536, accounting for 8.3% and 17.4% of families, respectively.
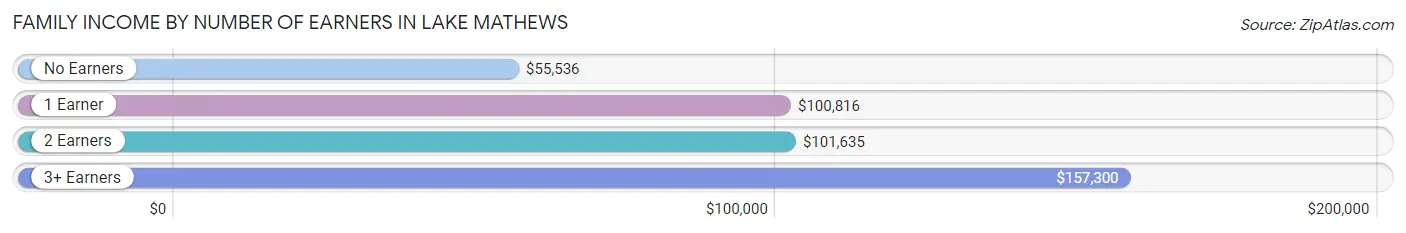
| Number of Earners | # Families | Median Income |
| No Earners | 260 (17.4%) | $55,536 |
| 1 Earner | 684 (45.7%) | $100,816 |
| 2 Earners | 430 (28.7%) | $101,635 |
| 3+ Earners | 124 (8.3%) | $157,300 |
| Total | 1,498 (100.0%) | $100,067 |
Household Income in Lake Mathews
Household Income Brackets in Lake Mathews
With 497 households falling in the category, the $100,000 to $149,999 income range is the most frequent in Lake Mathews, accounting for 29.0% of all households. In contrast, only 39 households (2.3%) fall into the $10,000 to $14,999 income bracket, making it the least populous group.
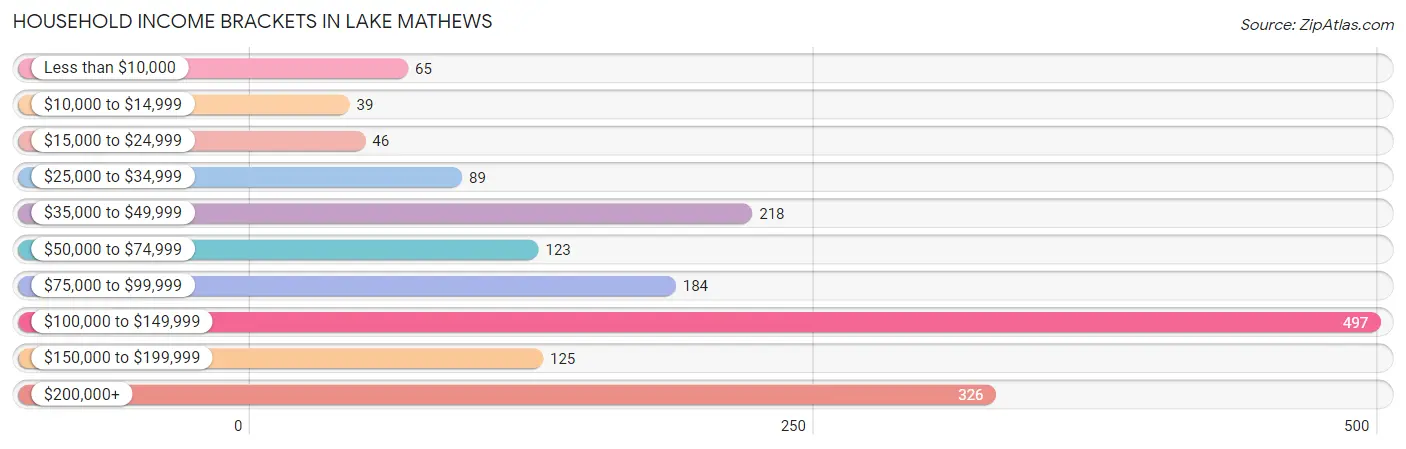
| Income Bracket | # Households | % Households |
| Less than $10,000 | 65 | 3.8% |
| $10,000 to $14,999 | 39 | 2.3% |
| $15,000 to $24,999 | 46 | 2.7% |
| $25,000 to $34,999 | 89 | 5.2% |
| $35,000 to $49,999 | 218 | 12.7% |
| $50,000 to $74,999 | 123 | 7.2% |
| $75,000 to $99,999 | 184 | 10.7% |
| $100,000 to $149,999 | 497 | 29.0% |
| $150,000 to $199,999 | 125 | 7.3% |
| $200,000+ | 326 | 19.0% |
Household Income by Householder Age in Lake Mathews
The median household income in Lake Mathews is $102,537, with the highest median household income of $145,565 found in the 45 to 64 years age bracket for the primary householder. A total of 664 households (38.7%) fall into this category. Meanwhile, the 15 to 24 years age bracket for the primary householder has the lowest median household income of $0, with 54 households (3.2%) in this group.
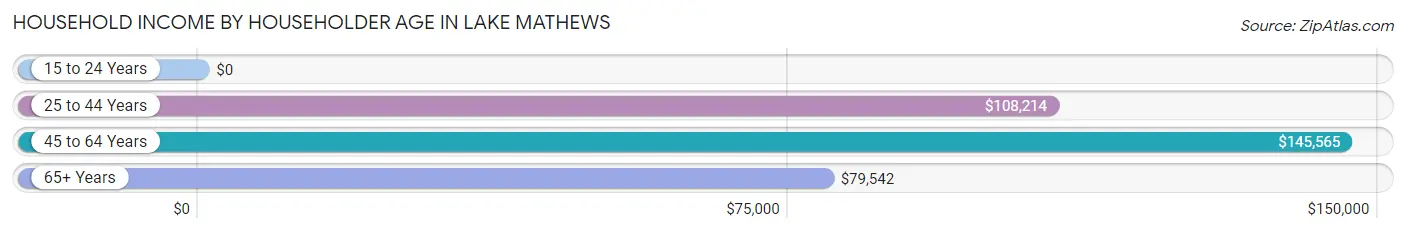
| Income Bracket | # Households | Median Income |
| 15 to 24 Years | 54 (3.2%) | $0 |
| 25 to 44 Years | 528 (30.8%) | $108,214 |
| 45 to 64 Years | 664 (38.7%) | $145,565 |
| 65+ Years | 469 (27.4%) | $79,542 |
| Total | 1,715 (100.0%) | $102,537 |
Poverty in Lake Mathews
Income Below Poverty by Sex and Age in Lake Mathews
With 9.0% poverty level for males and 11.3% for females among the residents of Lake Mathews, 18 to 24 year old males and 12 to 14 year old females are the most vulnerable to poverty, with 46 males (34.6%) and 66 females (51.2%) in their respective age groups living below the poverty level.
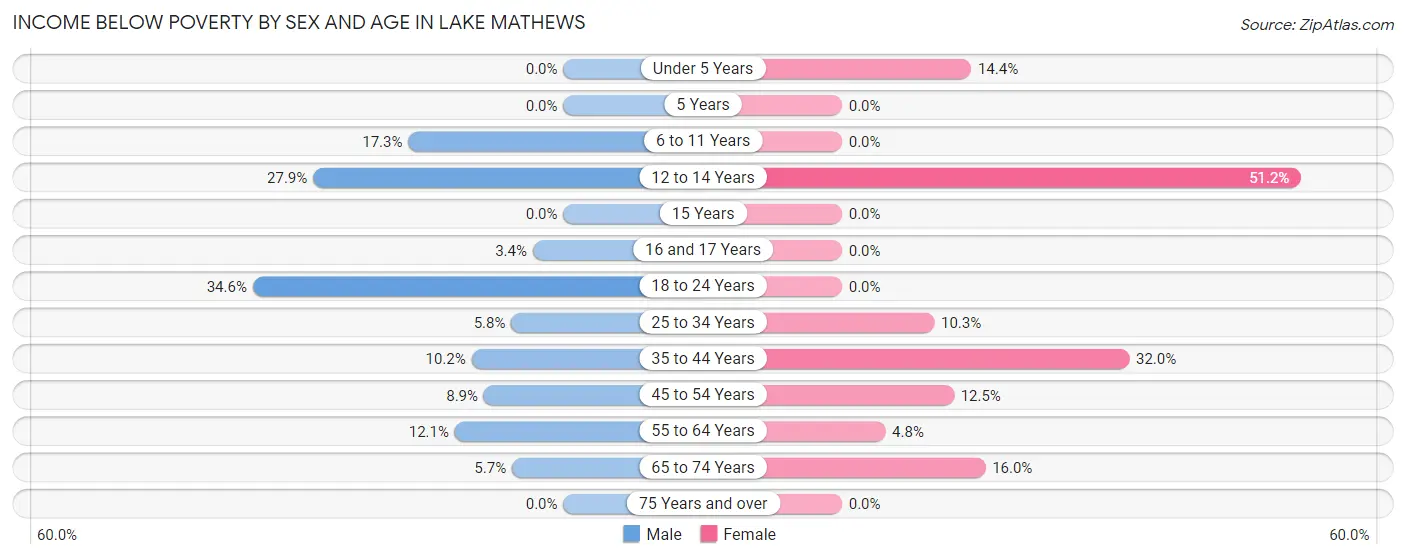
| Age Bracket | Male | Female |
| Under 5 Years | 0 (0.0%) | 38 (14.4%) |
| 5 Years | 0 (0.0%) | 0 (0.0%) |
| 6 to 11 Years | 38 (17.3%) | 0 (0.0%) |
| 12 to 14 Years | 34 (27.9%) | 66 (51.2%) |
| 15 Years | 0 (0.0%) | 0 (0.0%) |
| 16 and 17 Years | 13 (3.4%) | 0 (0.0%) |
| 18 to 24 Years | 46 (34.6%) | 0 (0.0%) |
| 25 to 34 Years | 17 (5.8%) | 27 (10.3%) |
| 35 to 44 Years | 51 (10.2%) | 111 (32.0%) |
| 45 to 54 Years | 43 (8.8%) | 41 (12.5%) |
| 55 to 64 Years | 44 (12.1%) | 26 (4.8%) |
| 65 to 74 Years | 17 (5.7%) | 42 (16.0%) |
| 75 Years and over | 0 (0.0%) | 0 (0.0%) |
| Total | 303 (9.0%) | 351 (11.3%) |
Income Above Poverty by Sex and Age in Lake Mathews
According to the poverty statistics in Lake Mathews, males aged under 5 years and females aged 5 years are the age groups that are most secure financially, with 100.0% of males and 100.0% of females in these age groups living above the poverty line.
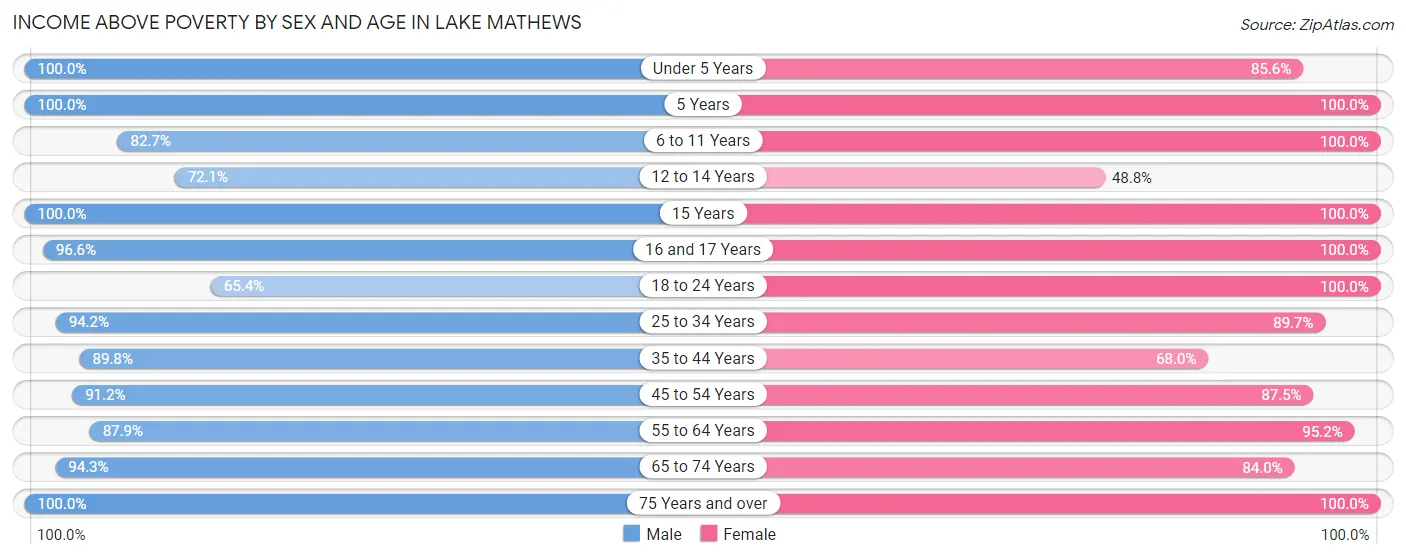
| Age Bracket | Male | Female |
| Under 5 Years | 95 (100.0%) | 226 (85.6%) |
| 5 Years | 91 (100.0%) | 56 (100.0%) |
| 6 to 11 Years | 182 (82.7%) | 406 (100.0%) |
| 12 to 14 Years | 88 (72.1%) | 63 (48.8%) |
| 15 Years | 94 (100.0%) | 25 (100.0%) |
| 16 and 17 Years | 369 (96.6%) | 38 (100.0%) |
| 18 to 24 Years | 87 (65.4%) | 292 (100.0%) |
| 25 to 34 Years | 276 (94.2%) | 236 (89.7%) |
| 35 to 44 Years | 448 (89.8%) | 236 (68.0%) |
| 45 to 54 Years | 443 (91.1%) | 288 (87.5%) |
| 55 to 64 Years | 320 (87.9%) | 512 (95.2%) |
| 65 to 74 Years | 280 (94.3%) | 221 (84.0%) |
| 75 Years and over | 277 (100.0%) | 169 (100.0%) |
| Total | 3,050 (91.0%) | 2,768 (88.7%) |
Income Below Poverty Among Married-Couple Families in Lake Mathews
The poverty statistics for married-couple families in Lake Mathews show that 9.8% or 109 of the total 1,113 families live below the poverty line. Families with 3 or 4 children have the highest poverty rate of 20.2%, comprising of 24 families. On the other hand, families with no children have the lowest poverty rate of 5.2%, which includes 31 families.
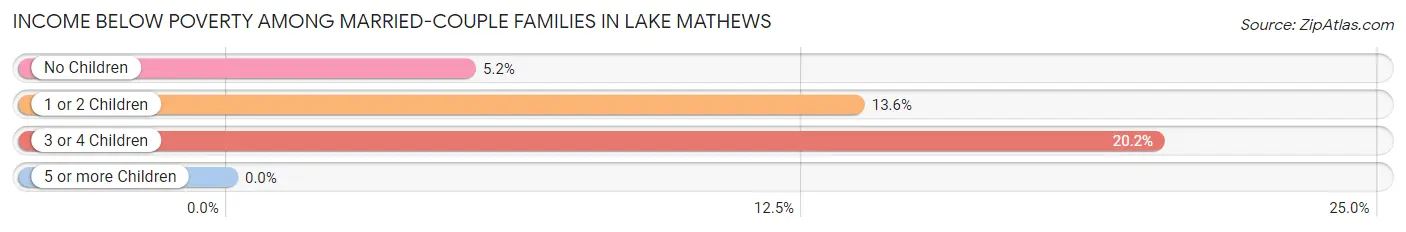
| Children | Above Poverty | Below Poverty |
| No Children | 567 (94.8%) | 31 (5.2%) |
| 1 or 2 Children | 342 (86.4%) | 54 (13.6%) |
| 3 or 4 Children | 95 (79.8%) | 24 (20.2%) |
| 5 or more Children | 0 (0.0%) | 0 (0.0%) |
| Total | 1,004 (90.2%) | 109 (9.8%) |
Income Below Poverty Among Single-Parent Households in Lake Mathews
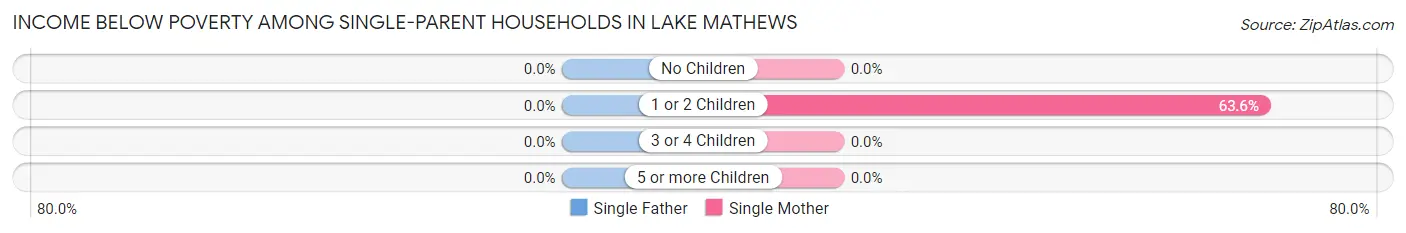
| Children | Single Father | Single Mother |
| No Children | 0 (0.0%) | 0 (0.0%) |
| 1 or 2 Children | 0 (0.0%) | 28 (63.6%) |
| 3 or 4 Children | 0 (0.0%) | 0 (0.0%) |
| 5 or more Children | 0 (0.0%) | 0 (0.0%) |
| Total | 0 (0.0%) | 28 (25.7%) |
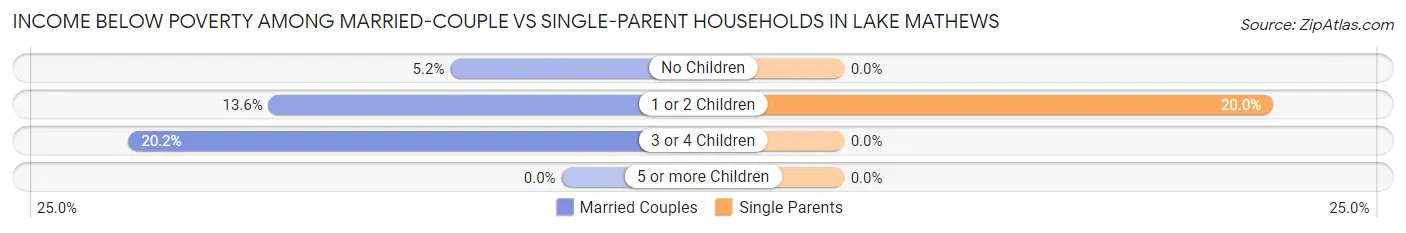
Income Below Poverty Among Married-Couple vs Single-Parent Households in Lake Mathews
The poverty data for Lake Mathews shows that 109 of the married-couple family households (9.8%) and 28 of the single-parent households (7.3%) are living below the poverty level. Within the married-couple family households, those with 3 or 4 children have the highest poverty rate, with 24 households (20.2%) falling below the poverty line. Among the single-parent households, those with 1 or 2 children have the highest poverty rate, with 28 household (20.0%) living below poverty.
| Children | Married-Couple Families | Single-Parent Households |
| No Children | 31 (5.2%) | 0 (0.0%) |
| 1 or 2 Children | 54 (13.6%) | 28 (20.0%) |
| 3 or 4 Children | 24 (20.2%) | 0 (0.0%) |
| 5 or more Children | 0 (0.0%) | 0 (0.0%) |
| Total | 109 (9.8%) | 28 (7.3%) |
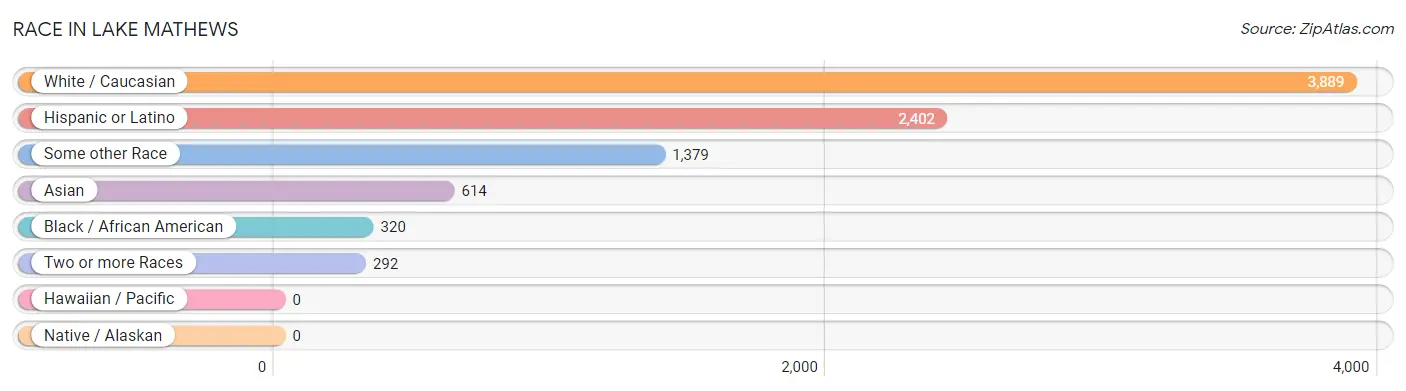
Race in Lake Mathews
The most populous races in Lake Mathews are White / Caucasian (3,889 | 59.9%), Hispanic or Latino (2,402 | 37.0%), and Some other Race (1,379 | 21.2%).
| Race | # Population | % Population |
| Asian | 614 | 9.5% |
| Black / African American | 320 | 4.9% |
| Hawaiian / Pacific | 0 | 0.0% |
| Hispanic or Latino | 2,402 | 37.0% |
| Native / Alaskan | 0 | 0.0% |
| White / Caucasian | 3,889 | 59.9% |
| Two or more Races | 292 | 4.5% |
| Some other Race | 1,379 | 21.2% |
| Total | 6,494 | 100.0% |
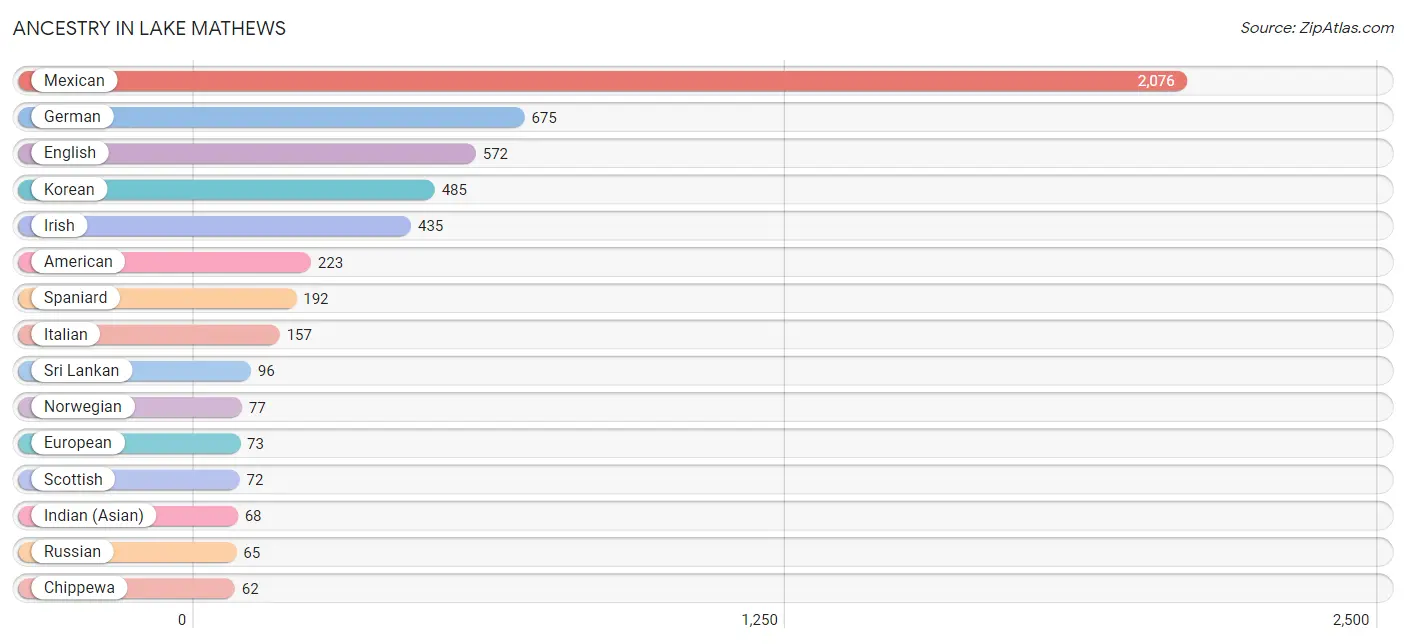
Ancestry in Lake Mathews
The most populous ancestries reported in Lake Mathews are Mexican (2,076 | 32.0%), German (675 | 10.4%), English (572 | 8.8%), Korean (485 | 7.5%), and Irish (435 | 6.7%), together accounting for 65.3% of all Lake Mathews residents.
| Ancestry | # Population | % Population |
| African | 14 | 0.2% |
| American | 223 | 3.4% |
| Armenian | 21 | 0.3% |
| Austrian | 41 | 0.6% |
| Bhutanese | 11 | 0.2% |
| Cherokee | 45 | 0.7% |
| Chippewa | 62 | 0.9% |
| Czech | 10 | 0.2% |
| Danish | 7 | 0.1% |
| Dutch | 32 | 0.5% |
| English | 572 | 8.8% |
| European | 73 | 1.1% |
| French | 13 | 0.2% |
| French Canadian | 8 | 0.1% |
| German | 675 | 10.4% |
| Greek | 10 | 0.2% |
| Hungarian | 36 | 0.5% |
| Indian (Asian) | 68 | 1.1% |
| Indonesian | 9 | 0.1% |
| Irish | 435 | 6.7% |
| Italian | 157 | 2.4% |
| Korean | 485 | 7.5% |
| Lithuanian | 8 | 0.1% |
| Mexican | 2,076 | 32.0% |
| Nigerian | 43 | 0.7% |
| Norwegian | 77 | 1.2% |
| Polish | 7 | 0.1% |
| Puerto Rican | 59 | 0.9% |
| Russian | 65 | 1.0% |
| Scandinavian | 60 | 0.9% |
| Scotch-Irish | 33 | 0.5% |
| Scottish | 72 | 1.1% |
| Spaniard | 192 | 3.0% |
| Spanish | 53 | 0.8% |
| Sri Lankan | 96 | 1.5% |
| Subsaharan African | 57 | 0.9% |
| Swedish | 9 | 0.1% |
| Turkish | 13 | 0.2% |
| Welsh | 15 | 0.2% | View All 39 Rows |
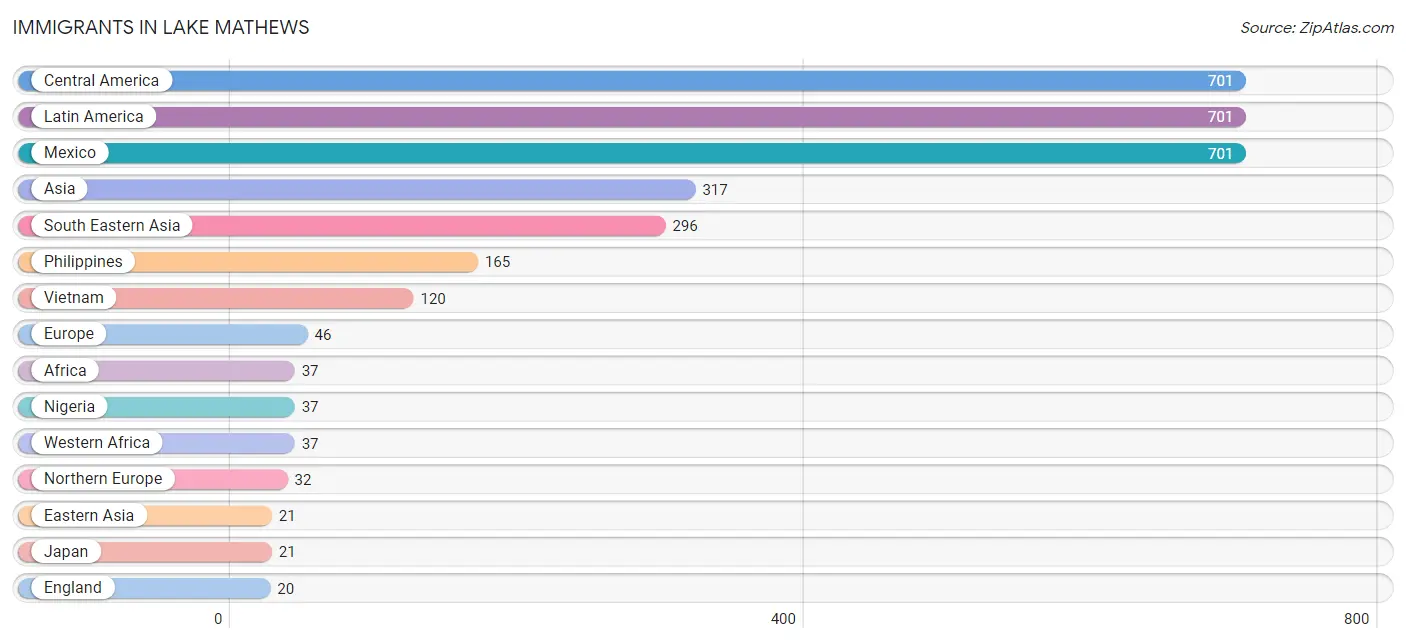
Immigrants in Lake Mathews
The most numerous immigrant groups reported in Lake Mathews came from Central America (701 | 10.8%), Latin America (701 | 10.8%), Mexico (701 | 10.8%), Asia (317 | 4.9%), and South Eastern Asia (296 | 4.6%), together accounting for 41.8% of all Lake Mathews residents.
| Immigration Origin | # Population | % Population |
| Africa | 37 | 0.6% |
| Asia | 317 | 4.9% |
| Canada | 14 | 0.2% |
| Central America | 701 | 10.8% |
| Eastern Asia | 21 | 0.3% |
| England | 20 | 0.3% |
| Europe | 46 | 0.7% |
| Italy | 14 | 0.2% |
| Japan | 21 | 0.3% |
| Latin America | 701 | 10.8% |
| Mexico | 701 | 10.8% |
| Nigeria | 37 | 0.6% |
| Northern Europe | 32 | 0.5% |
| Philippines | 165 | 2.5% |
| South Eastern Asia | 296 | 4.6% |
| Southern Europe | 14 | 0.2% |
| Thailand | 11 | 0.2% |
| Vietnam | 120 | 1.8% |
| Western Africa | 37 | 0.6% | View All 19 Rows |
Sex and Age in Lake Mathews
Sex and Age in Lake Mathews
The most populous age groups in Lake Mathews are 15 to 19 Years (519 | 15.5%) for men and 10 to 14 Years (369 | 11.7%) for women.
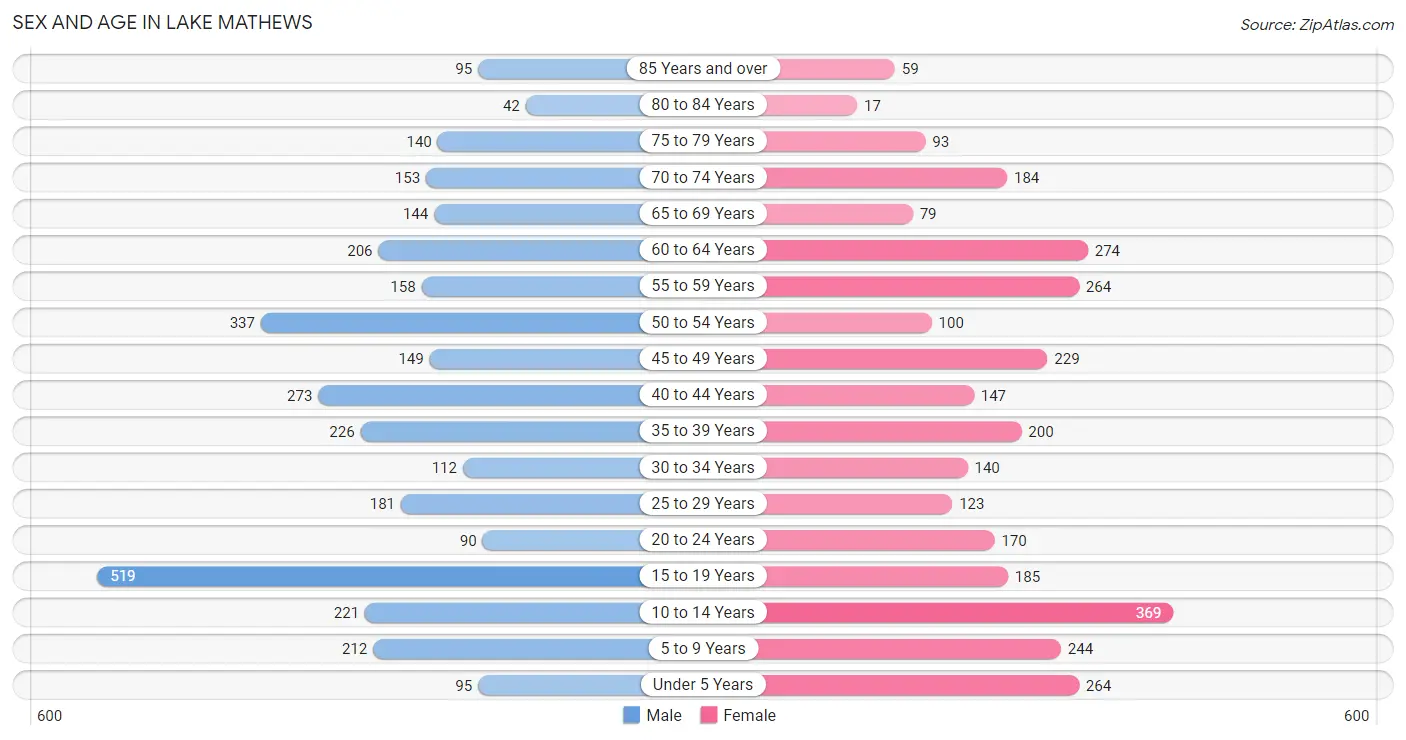
| Age Bracket | Male | Female |
| Under 5 Years | 95 (2.8%) | 264 (8.4%) |
| 5 to 9 Years | 212 (6.3%) | 244 (7.8%) |
| 10 to 14 Years | 221 (6.6%) | 369 (11.7%) |
| 15 to 19 Years | 519 (15.5%) | 185 (5.9%) |
| 20 to 24 Years | 90 (2.7%) | 170 (5.4%) |
| 25 to 29 Years | 181 (5.4%) | 123 (3.9%) |
| 30 to 34 Years | 112 (3.3%) | 140 (4.5%) |
| 35 to 39 Years | 226 (6.7%) | 200 (6.4%) |
| 40 to 44 Years | 273 (8.1%) | 147 (4.7%) |
| 45 to 49 Years | 149 (4.4%) | 229 (7.3%) |
| 50 to 54 Years | 337 (10.1%) | 100 (3.2%) |
| 55 to 59 Years | 158 (4.7%) | 264 (8.4%) |
| 60 to 64 Years | 206 (6.1%) | 274 (8.7%) |
| 65 to 69 Years | 144 (4.3%) | 79 (2.5%) |
| 70 to 74 Years | 153 (4.6%) | 184 (5.9%) |
| 75 to 79 Years | 140 (4.2%) | 93 (3.0%) |
| 80 to 84 Years | 42 (1.3%) | 17 (0.5%) |
| 85 Years and over | 95 (2.8%) | 59 (1.9%) |
| Total | 3,353 (100.0%) | 3,141 (100.0%) |
Families and Households in Lake Mathews
Median Family Size in Lake Mathews
The median family size in Lake Mathews is 3.87 persons per family, with single female/mother families (109 | 7.3%) accounting for the largest median family size of 4.45 persons per family. On the other hand, single male/father families (276 | 18.4%) represent the smallest median family size with 3.65 persons per family.
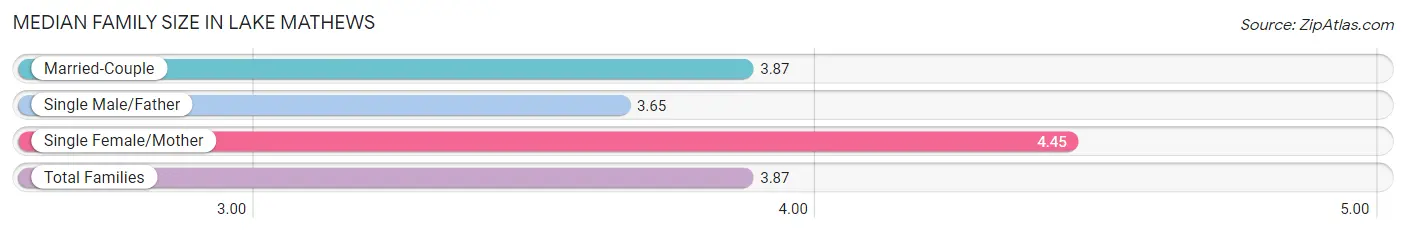
| Family Type | # Families | Family Size |
| Married-Couple | 1,113 (74.3%) | 3.87 |
| Single Male/Father | 276 (18.4%) | 3.65 |
| Single Female/Mother | 109 (7.3%) | 4.45 |
| Total Families | 1,498 (100.0%) | 3.87 |
Median Household Size in Lake Mathews
The median household size in Lake Mathews is 3.77 persons per household, with single female/mother households (109 | 6.4%) accounting for the largest median household size of 5.24 persons per household. non-family households (217 | 12.7%) represent the smallest median household size with 1.06 persons per household.
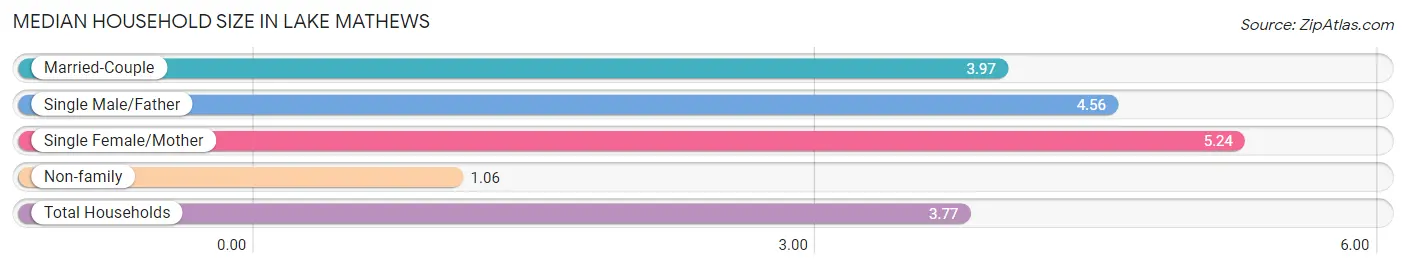
| Household Type | # Households | Household Size |
| Married-Couple | 1,113 (64.9%) | 3.97 |
| Single Male/Father | 276 (16.1%) | 4.56 |
| Single Female/Mother | 109 (6.4%) | 5.24 |
| Non-family | 217 (12.7%) | 1.06 |
| Total Households | 1,715 (100.0%) | 3.77 |
Household Size by Marriage Status in Lake Mathews
Out of a total of 1,715 households in Lake Mathews, 1,498 (87.4%) are family households, while 217 (12.7%) are nonfamily households. The most numerous type of family households are 2-person households, comprising 440, and the most common type of nonfamily households are 1-person households, comprising 203.
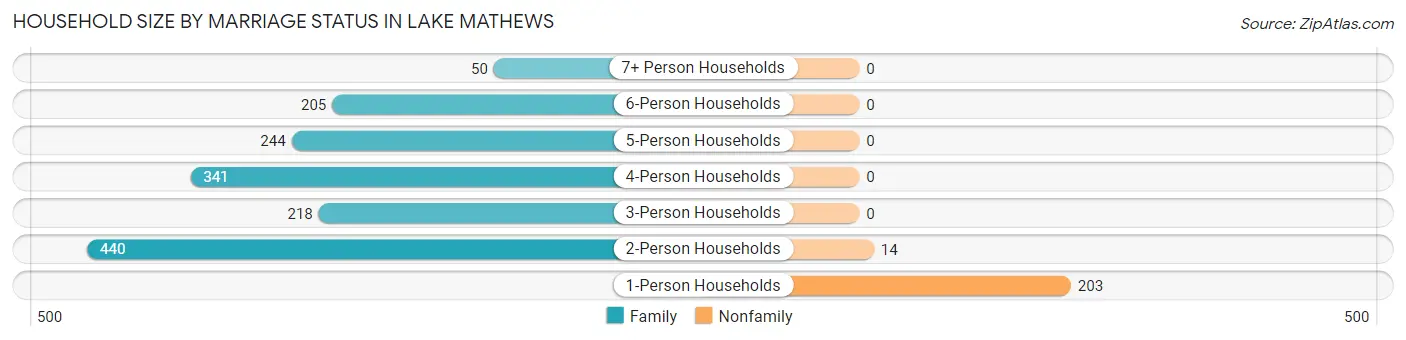
| Household Size | Family Households | Nonfamily Households |
| 1-Person Households | - | 203 (11.8%) |
| 2-Person Households | 440 (25.7%) | 14 (0.8%) |
| 3-Person Households | 218 (12.7%) | 0 (0.0%) |
| 4-Person Households | 341 (19.9%) | 0 (0.0%) |
| 5-Person Households | 244 (14.2%) | 0 (0.0%) |
| 6-Person Households | 205 (11.9%) | 0 (0.0%) |
| 7+ Person Households | 50 (2.9%) | 0 (0.0%) |
| Total | 1,498 (87.4%) | 217 (12.7%) |
Female Fertility in Lake Mathews
Fertility by Age in Lake Mathews
Average fertility rate in Lake Mathews is 35.0 births per 1,000 women. Women in the age bracket of 20 to 34 years have the highest fertility rate with 97.0 births per 1,000 women. Women in the age bracket of 20 to 34 years acount for 100.0% of all women with births.
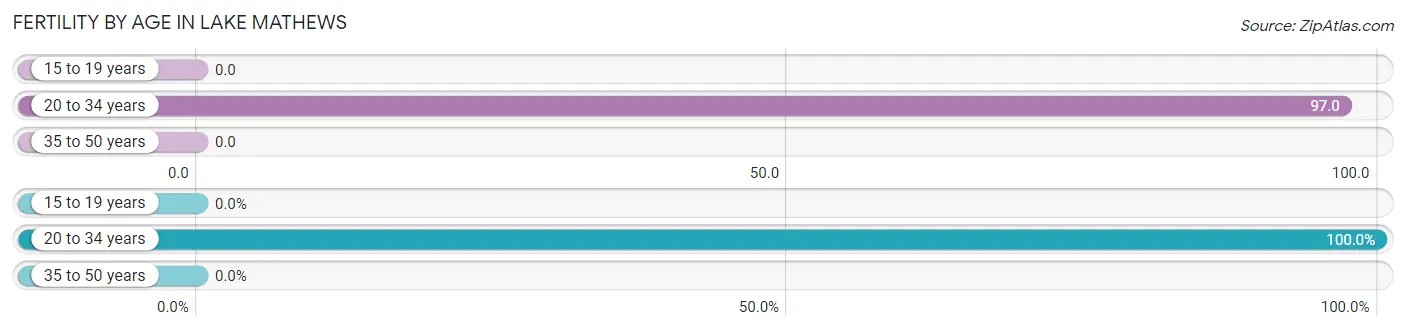
| Age Bracket | Women with Births | Births / 1,000 Women |
| 15 to 19 years | 0 (0.0%) | 0.0 |
| 20 to 34 years | 42 (100.0%) | 97.0 |
| 35 to 50 years | 0 (0.0%) | 0.0 |
| Total | 42 (100.0%) | 35.0 |
Fertility by Age by Marriage Status in Lake Mathews
50.0% of women with births (42) in Lake Mathews are married. The highest percentage of unmarried women with births falls into 20 to 34 years age bracket with 50.0% of them unmarried at the time of birth, while the lowest percentage of unmarried women with births belong to 20 to 34 years age bracket with 50.0% of them unmarried.
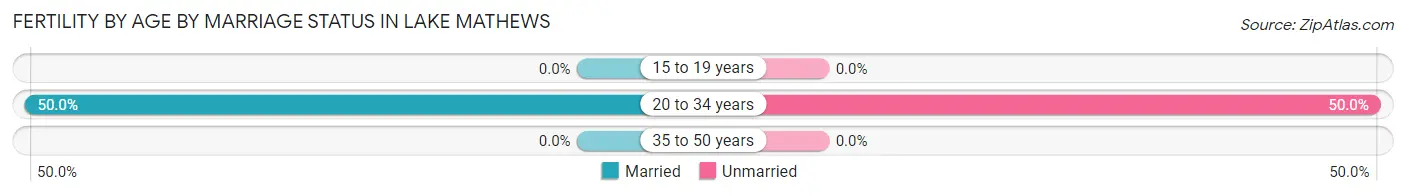
| Age Bracket | Married | Unmarried |
| 15 to 19 years | 0 (0.0%) | 0 (0.0%) |
| 20 to 34 years | 21 (50.0%) | 21 (50.0%) |
| 35 to 50 years | 0 (0.0%) | 0 (0.0%) |
| Total | 21 (50.0%) | 21 (50.0%) |
Fertility by Education in Lake Mathews
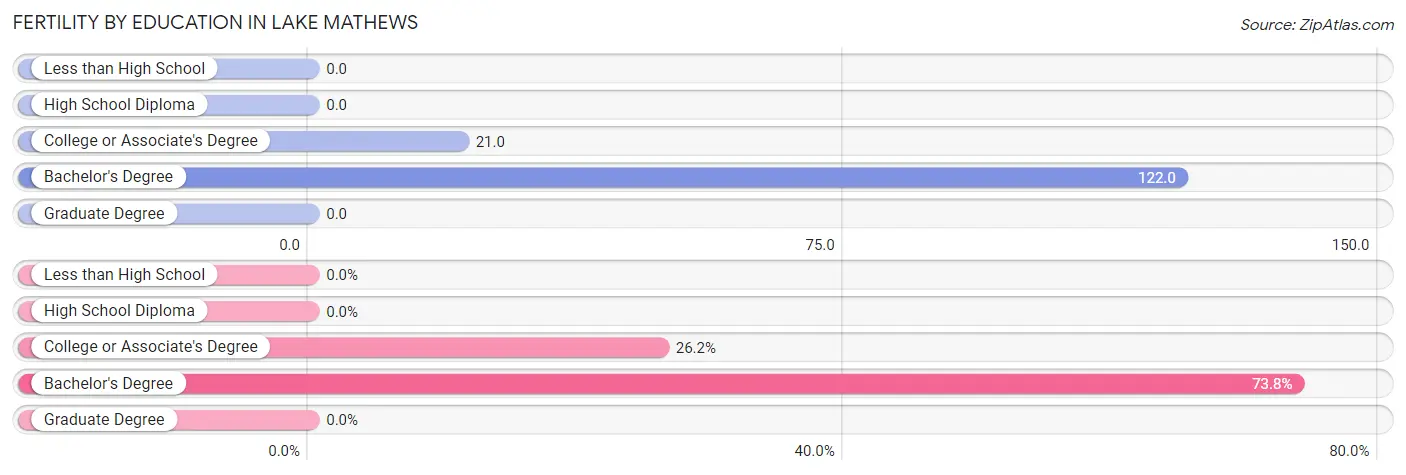
| Educational Attainment | Women with Births | Births / 1,000 Women |
| Less than High School | 0 (0.0%) | 0.0 |
| High School Diploma | 0 (0.0%) | 0.0 |
| College or Associate's Degree | 11 (26.2%) | 21.0 |
| Bachelor's Degree | 31 (73.8%) | 122.0 |
| Graduate Degree | 0 (0.0%) | 0.0 |
| Total | 42 (100.0%) | 35.0 |
Fertility by Education by Marriage Status in Lake Mathews
50.0% of women with births in Lake Mathews are unmarried. Women with the educational attainment of college or associate's degree are most likely to be married with 100.0% of them married at childbirth, while women with the educational attainment of bachelor's degree are least likely to be married with 67.7% of them unmarried at childbirth.
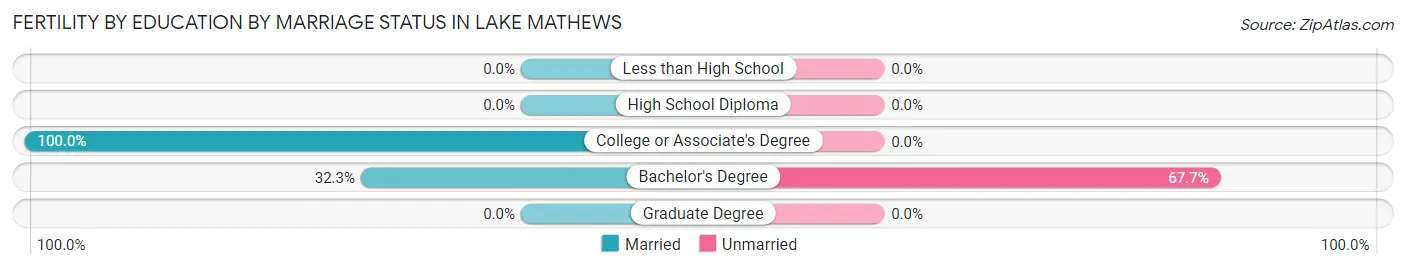
| Educational Attainment | Married | Unmarried |
| Less than High School | 0 (0.0%) | 0 (0.0%) |
| High School Diploma | 0 (0.0%) | 0 (0.0%) |
| College or Associate's Degree | 11 (100.0%) | 0 (0.0%) |
| Bachelor's Degree | 10 (32.3%) | 21 (67.7%) |
| Graduate Degree | 0 (0.0%) | 0 (0.0%) |
| Total | 21 (50.0%) | 21 (50.0%) |
Employment Characteristics in Lake Mathews
Employment by Class of Employer in Lake Mathews
Among the 2,059 employed individuals in Lake Mathews, private company employees (1,557 | 75.6%), local government employees (148 | 7.2%), and self-employed (not incorporated) (136 | 6.6%) make up the most common classes of employment.
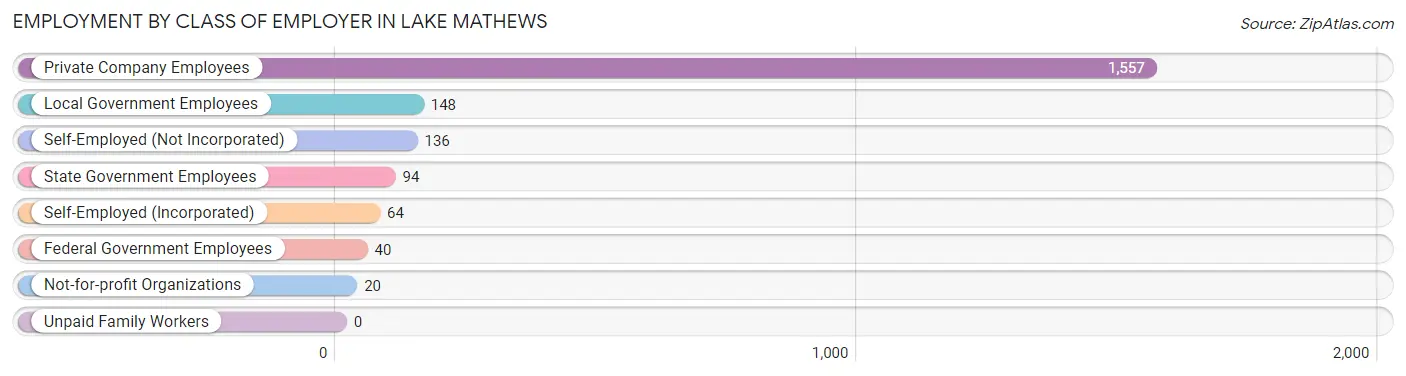
| Employer Class | # Employees | % Employees |
| Private Company Employees | 1,557 | 75.6% |
| Self-Employed (Incorporated) | 64 | 3.1% |
| Self-Employed (Not Incorporated) | 136 | 6.6% |
| Not-for-profit Organizations | 20 | 1.0% |
| Local Government Employees | 148 | 7.2% |
| State Government Employees | 94 | 4.6% |
| Federal Government Employees | 40 | 1.9% |
| Unpaid Family Workers | 0 | 0.0% |
| Total | 2,059 | 100.0% |
Employment Status by Age in Lake Mathews
According to the labor force statistics for Lake Mathews, out of the total population over 16 years of age (4,970), 49.9% or 2,480 individuals are in the labor force, with 11.7% or 290 of them unemployed. The age group with the highest labor force participation rate is 45 to 54 years, with 74.7% or 609 individuals in the labor force. Within the labor force, the 16 to 19 years age range has the highest percentage of unemployed individuals, with 46.6% or 82 of them being unemployed.
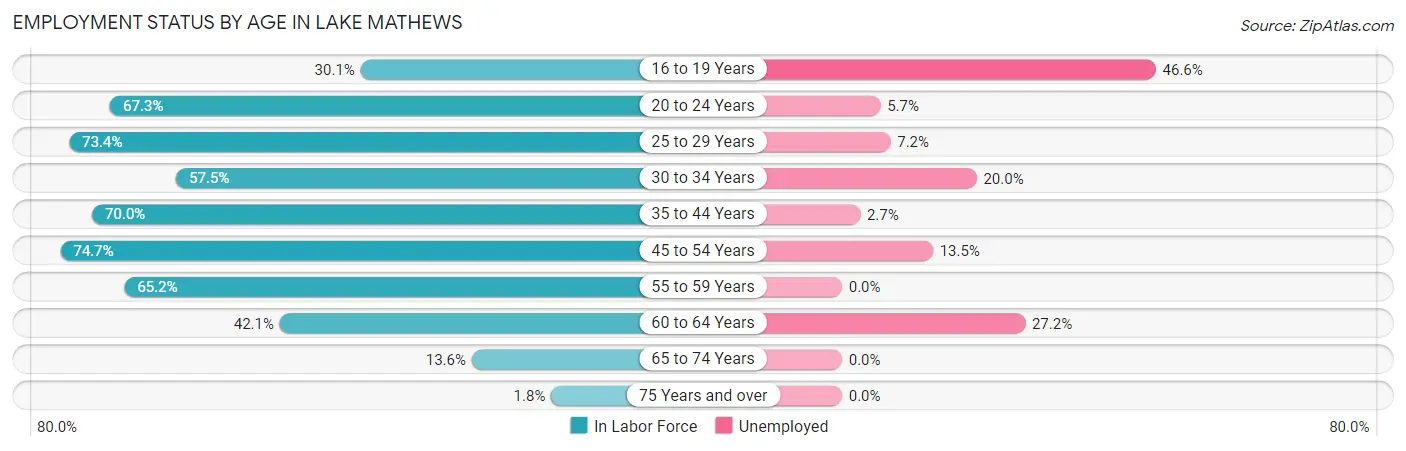
| Age Bracket | In Labor Force | Unemployed |
| 16 to 19 Years | 176 (30.1%) | 82 (46.6%) |
| 20 to 24 Years | 175 (67.3%) | 10 (5.7%) |
| 25 to 29 Years | 223 (73.4%) | 16 (7.2%) |
| 30 to 34 Years | 145 (57.5%) | 29 (20.0%) |
| 35 to 44 Years | 592 (70.0%) | 16 (2.7%) |
| 45 to 54 Years | 609 (74.7%) | 82 (13.5%) |
| 55 to 59 Years | 275 (65.2%) | 0 (0.0%) |
| 60 to 64 Years | 202 (42.1%) | 55 (27.2%) |
| 65 to 74 Years | 76 (13.6%) | 0 (0.0%) |
| 75 Years and over | 8 (1.8%) | 0 (0.0%) |
| Total | 2,480 (49.9%) | 290 (11.7%) |
Employment Status by Educational Attainment in Lake Mathews
According to labor force statistics for Lake Mathews, 65.6% of individuals (2,046) out of the total population between 25 and 64 years of age (3,119) are in the labor force, with 9.7% or 198 of them being unemployed. The group with the highest labor force participation rate are those with the educational attainment of high school diploma, with 68.0% or 551 individuals in the labor force. Within the labor force, individuals with college / associate degree education have the highest percentage of unemployment, with 15.8% or 122 of them being unemployed.
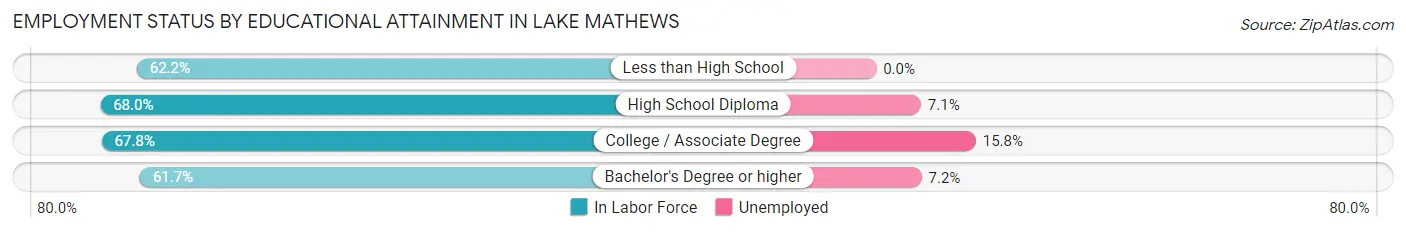
| Educational Attainment | In Labor Force | Unemployed |
| Less than High School | 212 (62.2%) | 0 (0.0%) |
| High School Diploma | 551 (68.0%) | 58 (7.1%) |
| College / Associate Degree | 770 (67.8%) | 179 (15.8%) |
| Bachelor's Degree or higher | 513 (61.7%) | 60 (7.2%) |
| Total | 2,046 (65.6%) | 303 (9.7%) |
Employment Occupations by Sex in Lake Mathews
Management, Business, Science and Arts Occupations
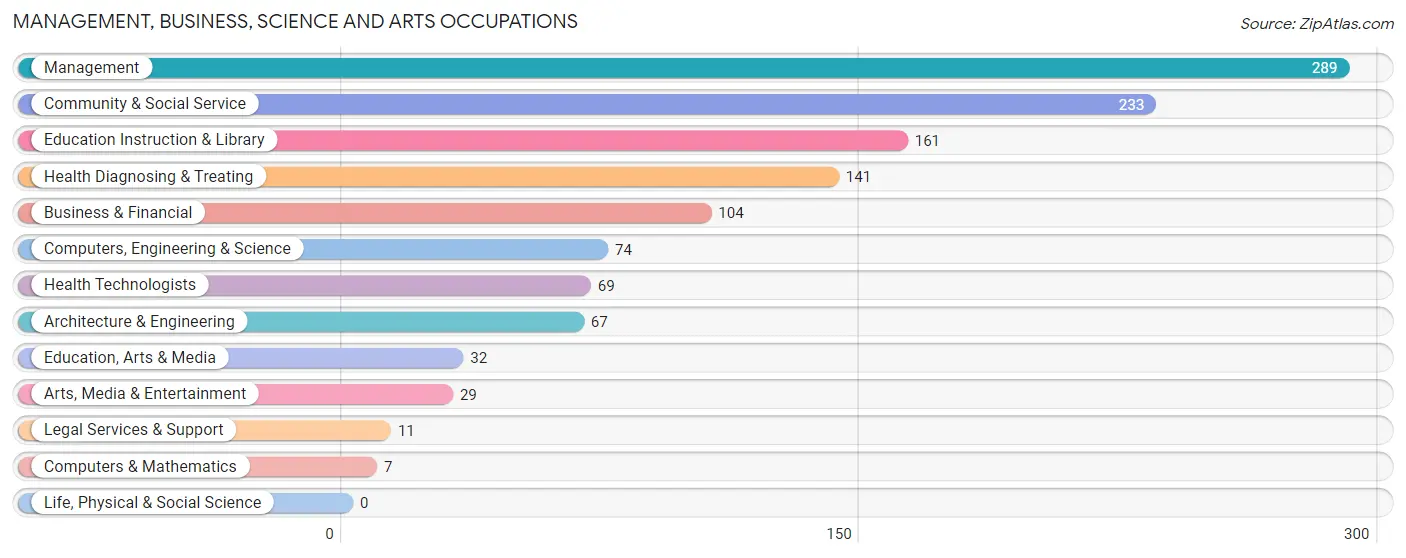
The most common Management, Business, Science and Arts occupations in Lake Mathews are Management (289 | 13.2%), Community & Social Service (233 | 10.6%), Education Instruction & Library (161 | 7.3%), Health Diagnosing & Treating (141 | 6.4%), and Business & Financial (104 | 4.8%).
Management, Business, Science and Arts Occupations by Sex
Within the Management, Business, Science and Arts occupations in Lake Mathews, the most male-oriented occupations are Computers, Engineering & Science (100.0%), Computers & Mathematics (100.0%), and Architecture & Engineering (100.0%), while the most female-oriented occupations are Legal Services & Support (100.0%), Education Instruction & Library (100.0%), and Health Diagnosing & Treating (93.6%).
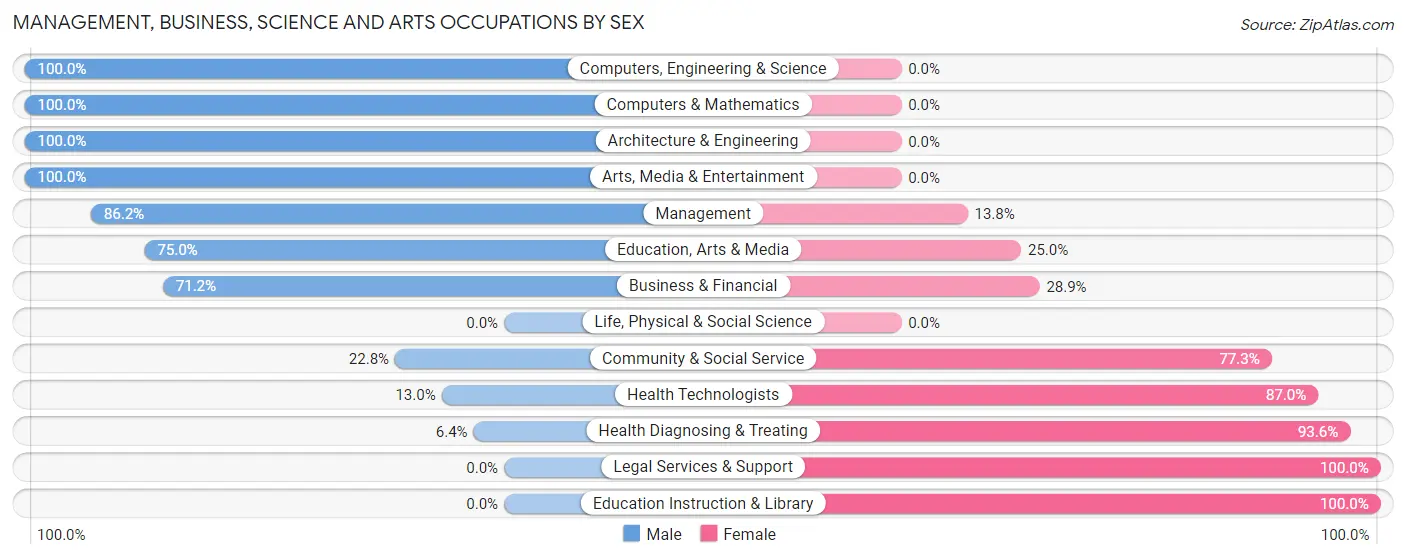
| Occupation | Male | Female |
| Management | 249 (86.2%) | 40 (13.8%) |
| Business & Financial | 74 (71.2%) | 30 (28.8%) |
| Computers, Engineering & Science | 74 (100.0%) | 0 (0.0%) |
| Computers & Mathematics | 7 (100.0%) | 0 (0.0%) |
| Architecture & Engineering | 67 (100.0%) | 0 (0.0%) |
| Life, Physical & Social Science | 0 (0.0%) | 0 (0.0%) |
| Community & Social Service | 53 (22.8%) | 180 (77.2%) |
| Education, Arts & Media | 24 (75.0%) | 8 (25.0%) |
| Legal Services & Support | 0 (0.0%) | 11 (100.0%) |
| Education Instruction & Library | 0 (0.0%) | 161 (100.0%) |
| Arts, Media & Entertainment | 29 (100.0%) | 0 (0.0%) |
| Health Diagnosing & Treating | 9 (6.4%) | 132 (93.6%) |
| Health Technologists | 9 (13.0%) | 60 (87.0%) |
| Total (Category) | 459 (54.6%) | 382 (45.4%) |
| Total (Overall) | 1,246 (56.9%) | 945 (43.1%) |
Services Occupations
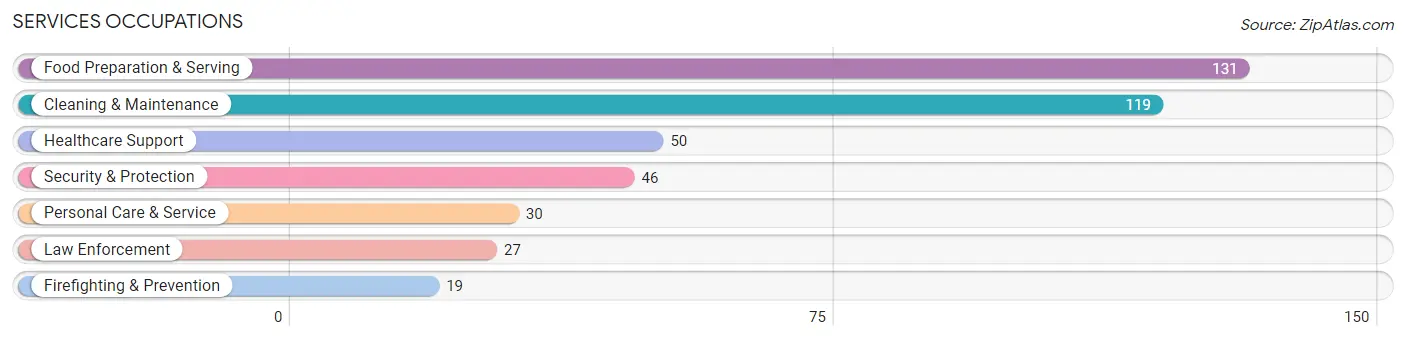
The most common Services occupations in Lake Mathews are Food Preparation & Serving (131 | 6.0%), Cleaning & Maintenance (119 | 5.4%), Healthcare Support (50 | 2.3%), Security & Protection (46 | 2.1%), and Personal Care & Service (30 | 1.4%).
Services Occupations by Sex
Within the Services occupations in Lake Mathews, the most male-oriented occupations are Security & Protection (100.0%), Firefighting & Prevention (100.0%), and Law Enforcement (100.0%), while the most female-oriented occupations are Personal Care & Service (100.0%), Healthcare Support (84.0%), and Food Preparation & Serving (65.6%).
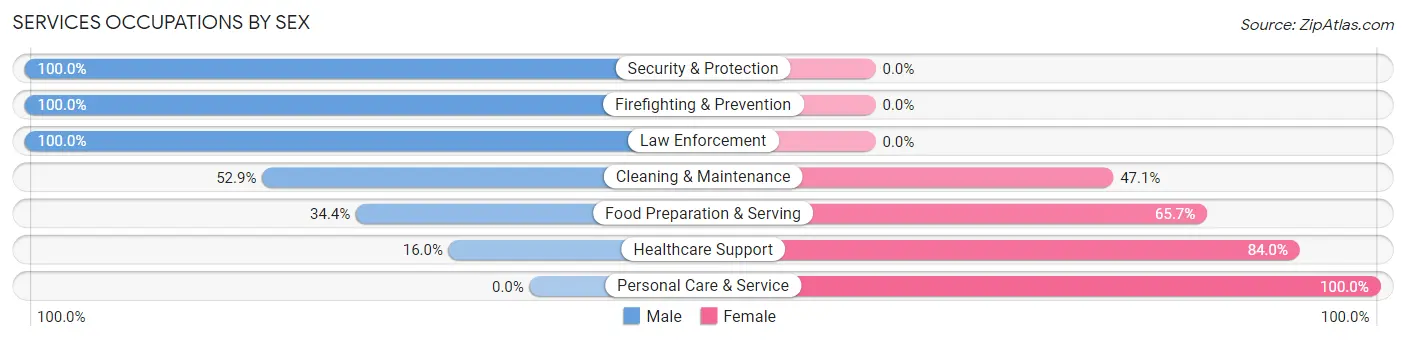
| Occupation | Male | Female |
| Healthcare Support | 8 (16.0%) | 42 (84.0%) |
| Security & Protection | 46 (100.0%) | 0 (0.0%) |
| Firefighting & Prevention | 19 (100.0%) | 0 (0.0%) |
| Law Enforcement | 27 (100.0%) | 0 (0.0%) |
| Food Preparation & Serving | 45 (34.4%) | 86 (65.6%) |
| Cleaning & Maintenance | 63 (52.9%) | 56 (47.1%) |
| Personal Care & Service | 0 (0.0%) | 30 (100.0%) |
| Total (Category) | 162 (43.1%) | 214 (56.9%) |
| Total (Overall) | 1,246 (56.9%) | 945 (43.1%) |
Sales and Office Occupations
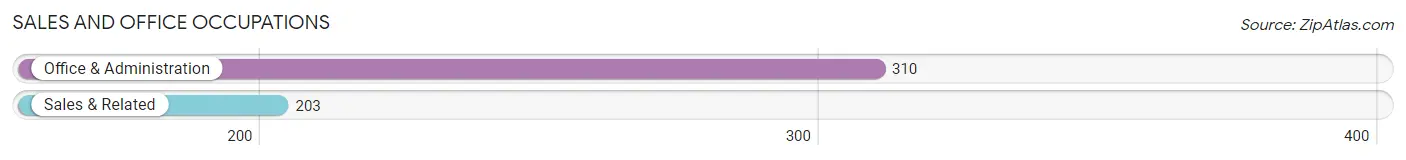
The most common Sales and Office occupations in Lake Mathews are Office & Administration (310 | 14.1%), and Sales & Related (203 | 9.3%).
Sales and Office Occupations by Sex
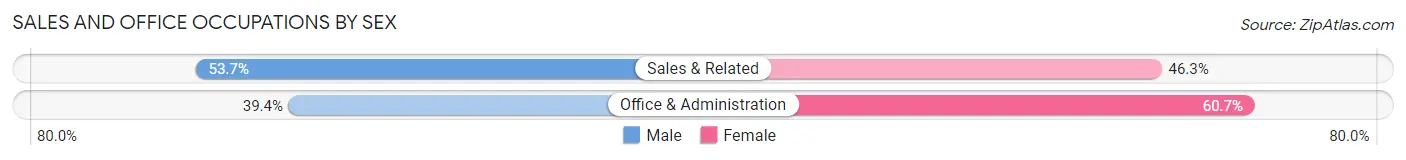
| Occupation | Male | Female |
| Sales & Related | 109 (53.7%) | 94 (46.3%) |
| Office & Administration | 122 (39.4%) | 188 (60.7%) |
| Total (Category) | 231 (45.0%) | 282 (55.0%) |
| Total (Overall) | 1,246 (56.9%) | 945 (43.1%) |
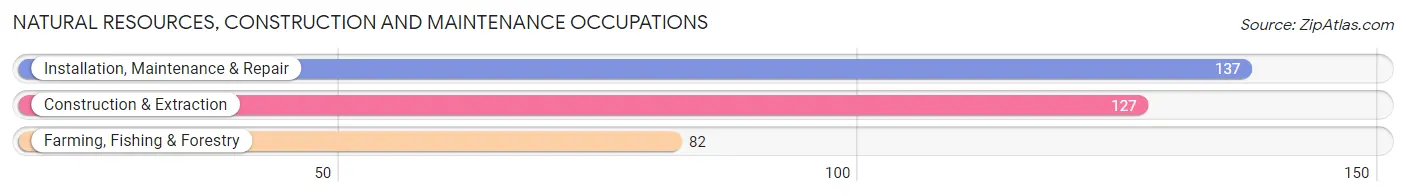
Natural Resources, Construction and Maintenance Occupations
The most common Natural Resources, Construction and Maintenance occupations in Lake Mathews are Installation, Maintenance & Repair (137 | 6.2%), Construction & Extraction (127 | 5.8%), and Farming, Fishing & Forestry (82 | 3.7%).
Natural Resources, Construction and Maintenance Occupations by Sex
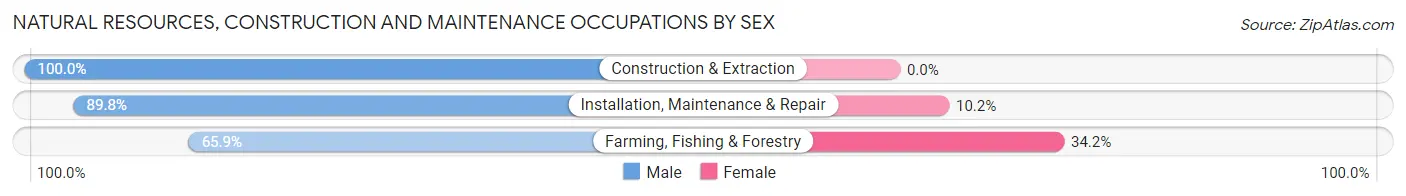
| Occupation | Male | Female |
| Farming, Fishing & Forestry | 54 (65.8%) | 28 (34.2%) |
| Construction & Extraction | 127 (100.0%) | 0 (0.0%) |
| Installation, Maintenance & Repair | 123 (89.8%) | 14 (10.2%) |
| Total (Category) | 304 (87.9%) | 42 (12.1%) |
| Total (Overall) | 1,246 (56.9%) | 945 (43.1%) |
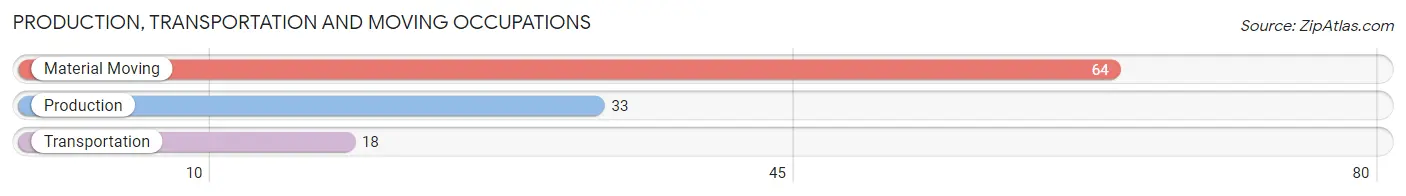
Production, Transportation and Moving Occupations
The most common Production, Transportation and Moving occupations in Lake Mathews are Material Moving (64 | 2.9%), Production (33 | 1.5%), and Transportation (18 | 0.8%).
Production, Transportation and Moving Occupations by Sex
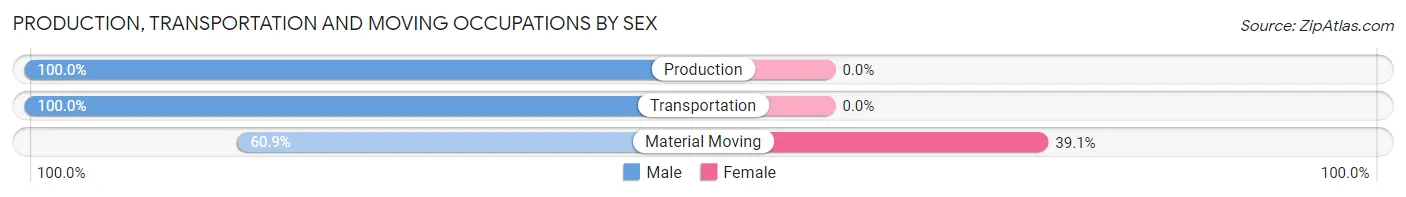
| Occupation | Male | Female |
| Production | 33 (100.0%) | 0 (0.0%) |
| Transportation | 18 (100.0%) | 0 (0.0%) |
| Material Moving | 39 (60.9%) | 25 (39.1%) |
| Total (Category) | 90 (78.3%) | 25 (21.7%) |
| Total (Overall) | 1,246 (56.9%) | 945 (43.1%) |
Employment Industries by Sex in Lake Mathews
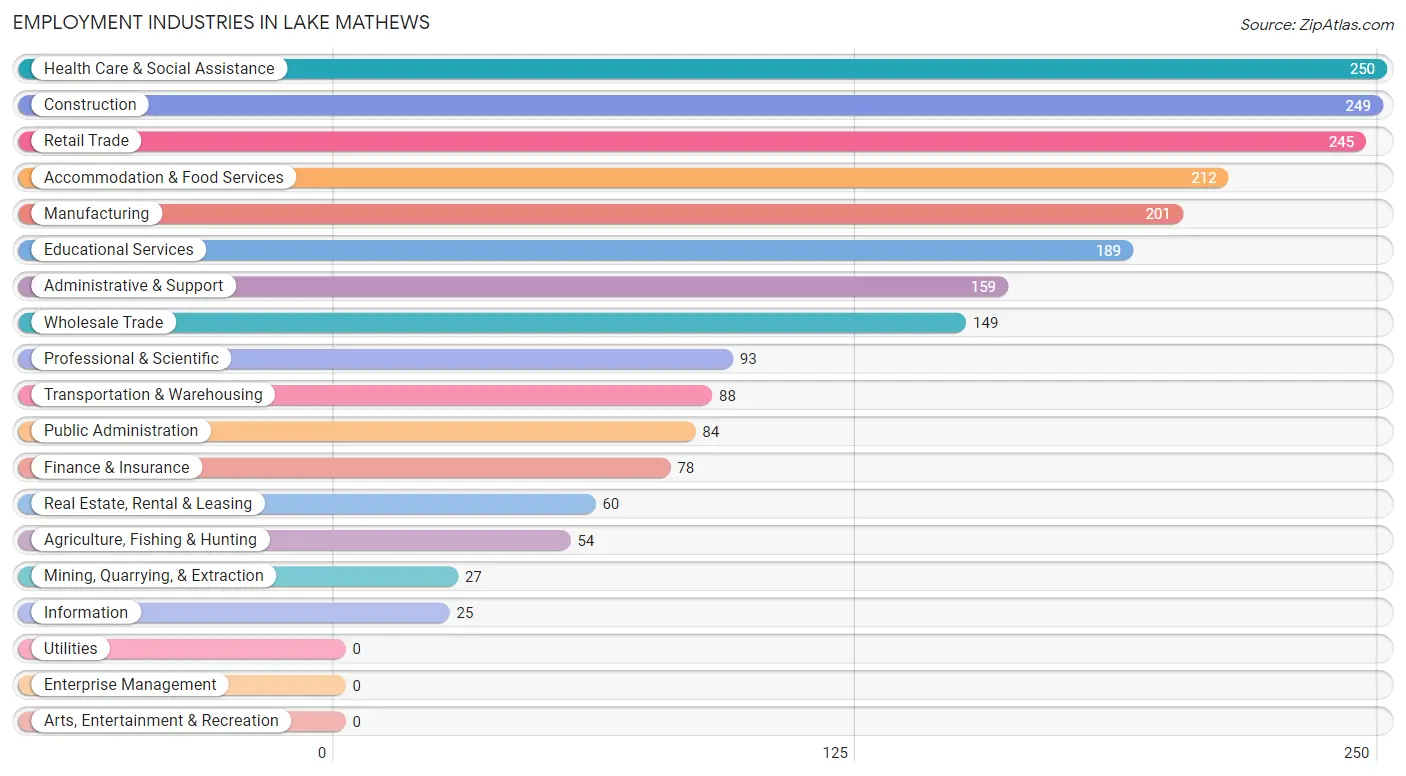
Employment Industries in Lake Mathews
The major employment industries in Lake Mathews include Health Care & Social Assistance (250 | 11.4%), Construction (249 | 11.4%), Retail Trade (245 | 11.2%), Accommodation & Food Services (212 | 9.7%), and Manufacturing (201 | 9.2%).
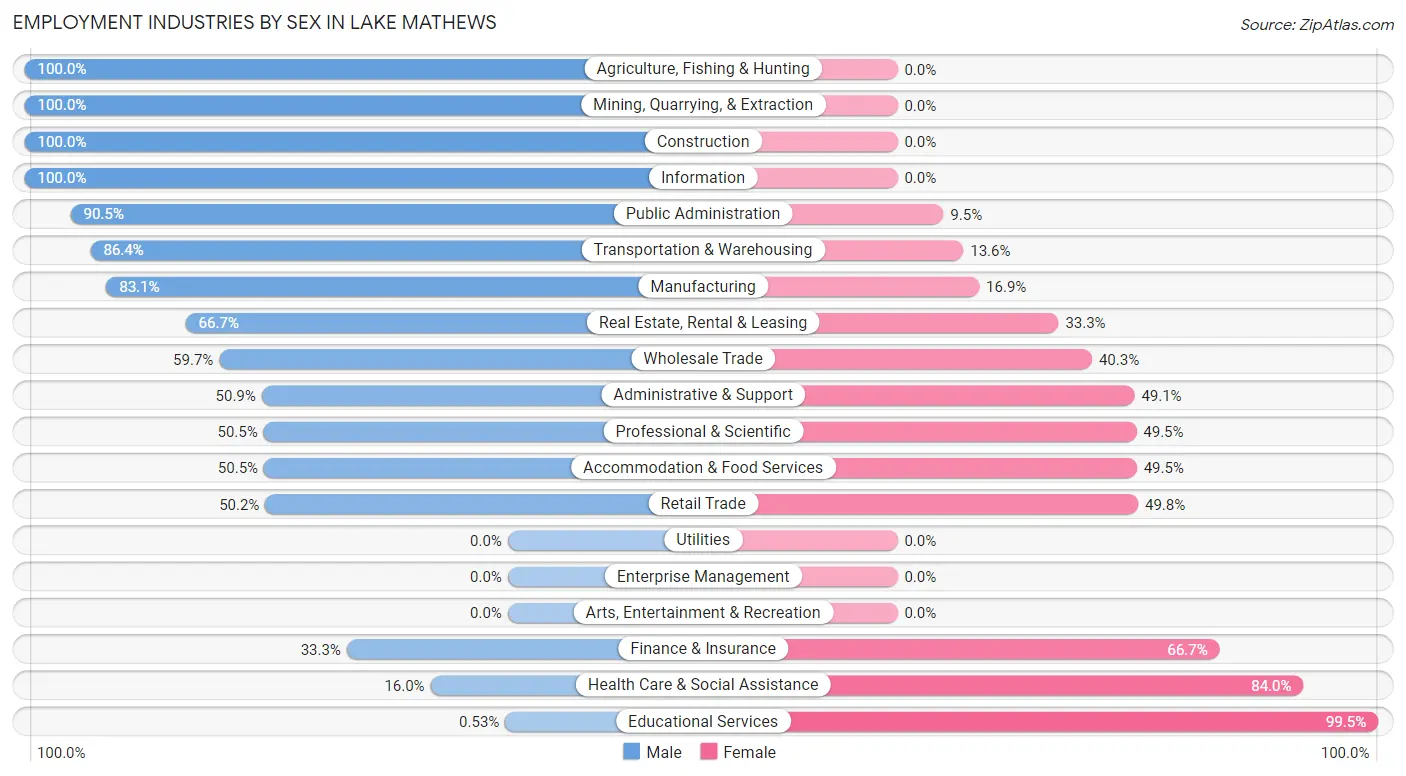
Employment Industries by Sex in Lake Mathews
The Lake Mathews industries that see more men than women are Agriculture, Fishing & Hunting (100.0%), Mining, Quarrying, & Extraction (100.0%), and Construction (100.0%), whereas the industries that tend to have a higher number of women are Educational Services (99.5%), Health Care & Social Assistance (84.0%), and Finance & Insurance (66.7%).
| Industry | Male | Female |
| Agriculture, Fishing & Hunting | 54 (100.0%) | 0 (0.0%) |
| Mining, Quarrying, & Extraction | 27 (100.0%) | 0 (0.0%) |
| Construction | 249 (100.0%) | 0 (0.0%) |
| Manufacturing | 167 (83.1%) | 34 (16.9%) |
| Wholesale Trade | 89 (59.7%) | 60 (40.3%) |
| Retail Trade | 123 (50.2%) | 122 (49.8%) |
| Transportation & Warehousing | 76 (86.4%) | 12 (13.6%) |
| Utilities | 0 (0.0%) | 0 (0.0%) |
| Information | 25 (100.0%) | 0 (0.0%) |
| Finance & Insurance | 26 (33.3%) | 52 (66.7%) |
| Real Estate, Rental & Leasing | 40 (66.7%) | 20 (33.3%) |
| Professional & Scientific | 47 (50.5%) | 46 (49.5%) |
| Enterprise Management | 0 (0.0%) | 0 (0.0%) |
| Administrative & Support | 81 (50.9%) | 78 (49.1%) |
| Educational Services | 1 (0.5%) | 188 (99.5%) |
| Health Care & Social Assistance | 40 (16.0%) | 210 (84.0%) |
| Arts, Entertainment & Recreation | 0 (0.0%) | 0 (0.0%) |
| Accommodation & Food Services | 107 (50.5%) | 105 (49.5%) |
| Public Administration | 76 (90.5%) | 8 (9.5%) |
| Total | 1,246 (56.9%) | 945 (43.1%) |
Education in Lake Mathews
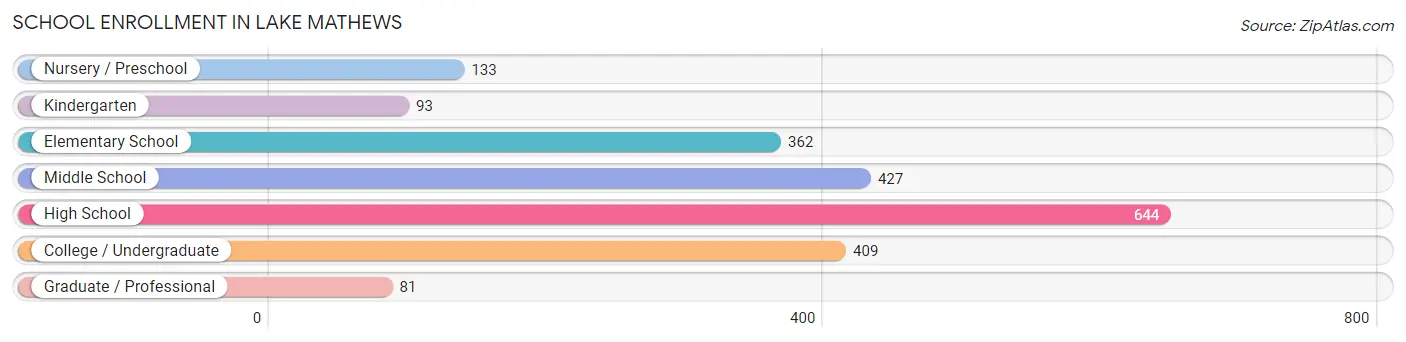
School Enrollment in Lake Mathews
The most common levels of schooling among the 2,149 students in Lake Mathews are high school (644 | 30.0%), middle school (427 | 19.9%), and college / undergraduate (409 | 19.0%).
| School Level | # Students | % Students |
| Nursery / Preschool | 133 | 6.2% |
| Kindergarten | 93 | 4.3% |
| Elementary School | 362 | 16.9% |
| Middle School | 427 | 19.9% |
| High School | 644 | 30.0% |
| College / Undergraduate | 409 | 19.0% |
| Graduate / Professional | 81 | 3.8% |
| Total | 2,149 | 100.0% |
School Enrollment by Age by Funding Source in Lake Mathews
Out of a total of 2,149 students who are enrolled in schools in Lake Mathews, 395 (18.4%) attend a private institution, while the remaining 1,754 (81.6%) are enrolled in public schools. The age group of 3 to 4 year olds has the highest likelihood of being enrolled in private schools, with 55 (76.4% in the age bracket) enrolled. Conversely, the age group of 18 to 19 year olds has the lowest likelihood of being enrolled in a private school, with 143 (100.0% in the age bracket) attending a public institution.
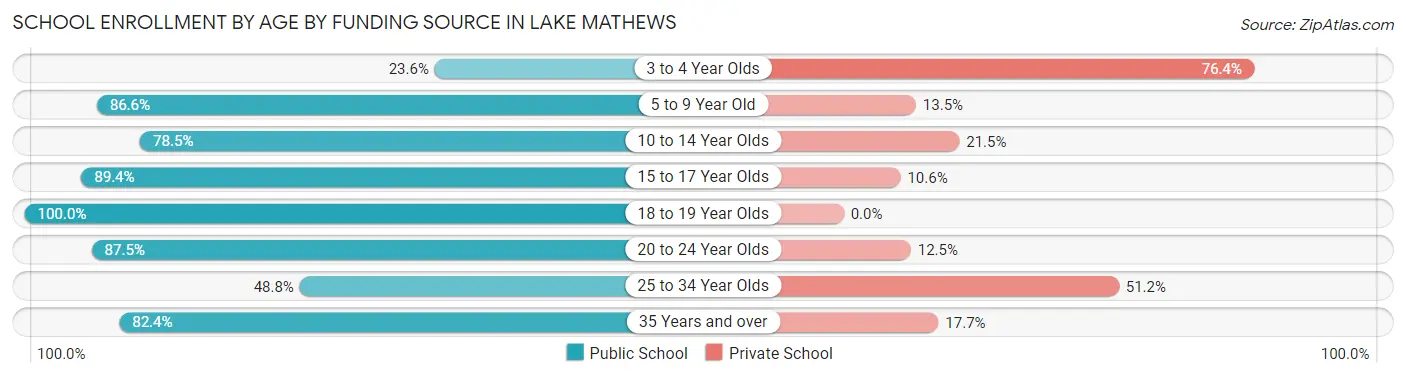
| Age Bracket | Public School | Private School |
| 3 to 4 Year Olds | 17 (23.6%) | 55 (76.4%) |
| 5 to 9 Year Old | 386 (86.6%) | 60 (13.5%) |
| 10 to 14 Year Olds | 463 (78.5%) | 127 (21.5%) |
| 15 to 17 Year Olds | 482 (89.4%) | 57 (10.6%) |
| 18 to 19 Year Olds | 143 (100.0%) | 0 (0.0%) |
| 20 to 24 Year Olds | 119 (87.5%) | 17 (12.5%) |
| 25 to 34 Year Olds | 59 (48.8%) | 62 (51.2%) |
| 35 Years and over | 84 (82.4%) | 18 (17.6%) |
| Total | 1,754 (81.6%) | 395 (18.4%) |
Educational Attainment by Field of Study in Lake Mathews
Business (211 | 17.9%), science & technology (168 | 14.3%), psychology (152 | 12.9%), arts & humanities (106 | 9.0%), and social sciences (94 | 8.0%) are the most common fields of study among 1,176 individuals in Lake Mathews who have obtained a bachelor's degree or higher.
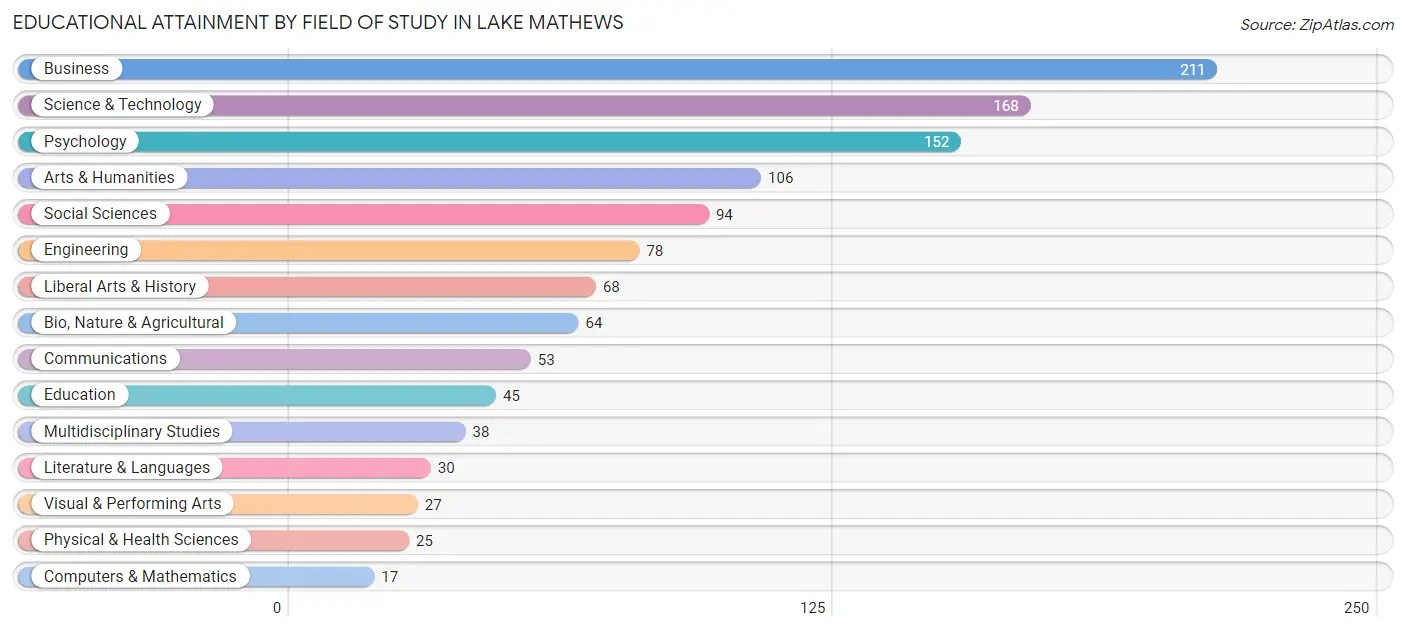
| Field of Study | # Graduates | % Graduates |
| Computers & Mathematics | 17 | 1.5% |
| Bio, Nature & Agricultural | 64 | 5.4% |
| Physical & Health Sciences | 25 | 2.1% |
| Psychology | 152 | 12.9% |
| Social Sciences | 94 | 8.0% |
| Engineering | 78 | 6.6% |
| Multidisciplinary Studies | 38 | 3.2% |
| Science & Technology | 168 | 14.3% |
| Business | 211 | 17.9% |
| Education | 45 | 3.8% |
| Literature & Languages | 30 | 2.5% |
| Liberal Arts & History | 68 | 5.8% |
| Visual & Performing Arts | 27 | 2.3% |
| Communications | 53 | 4.5% |
| Arts & Humanities | 106 | 9.0% |
| Total | 1,176 | 100.0% |
Transportation & Commute in Lake Mathews
Vehicle Availability by Sex in Lake Mathews
The most prevalent vehicle ownership categories in Lake Mathews are males with 3 vehicles (343, accounting for 30.2%) and females with 3 vehicles (212, making up 37.6%).
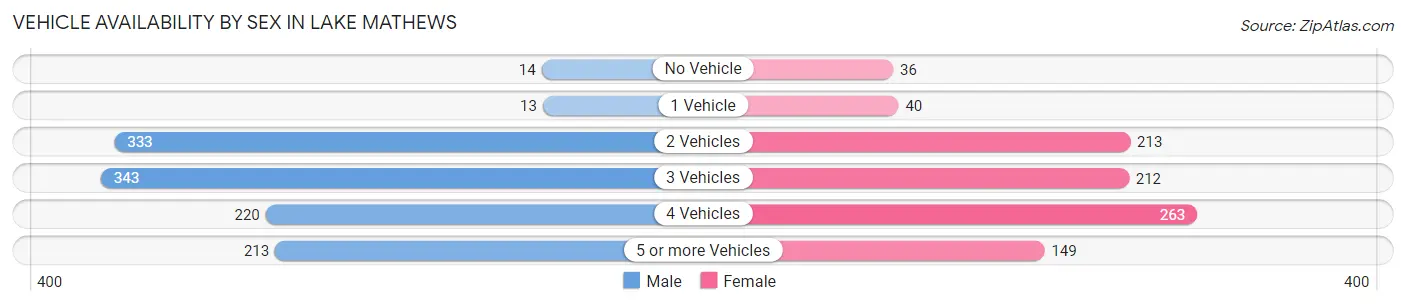
| Vehicles Available | Male | Female |
| No Vehicle | 14 (1.2%) | 36 (3.9%) |
| 1 Vehicle | 13 (1.1%) | 40 (4.4%) |
| 2 Vehicles | 333 (29.3%) | 213 (23.3%) |
| 3 Vehicles | 343 (30.2%) | 212 (23.2%) |
| 4 Vehicles | 220 (19.4%) | 263 (28.8%) |
| 5 or more Vehicles | 213 (18.8%) | 149 (16.3%) |
| Total | 1,136 (100.0%) | 913 (100.0%) |
Commute Time in Lake Mathews
The most frequently occuring commute durations in Lake Mathews are 30 to 34 minutes (538 commuters, 27.8%), 45 to 59 minutes (338 commuters, 17.4%), and 20 to 24 minutes (232 commuters, 12.0%).
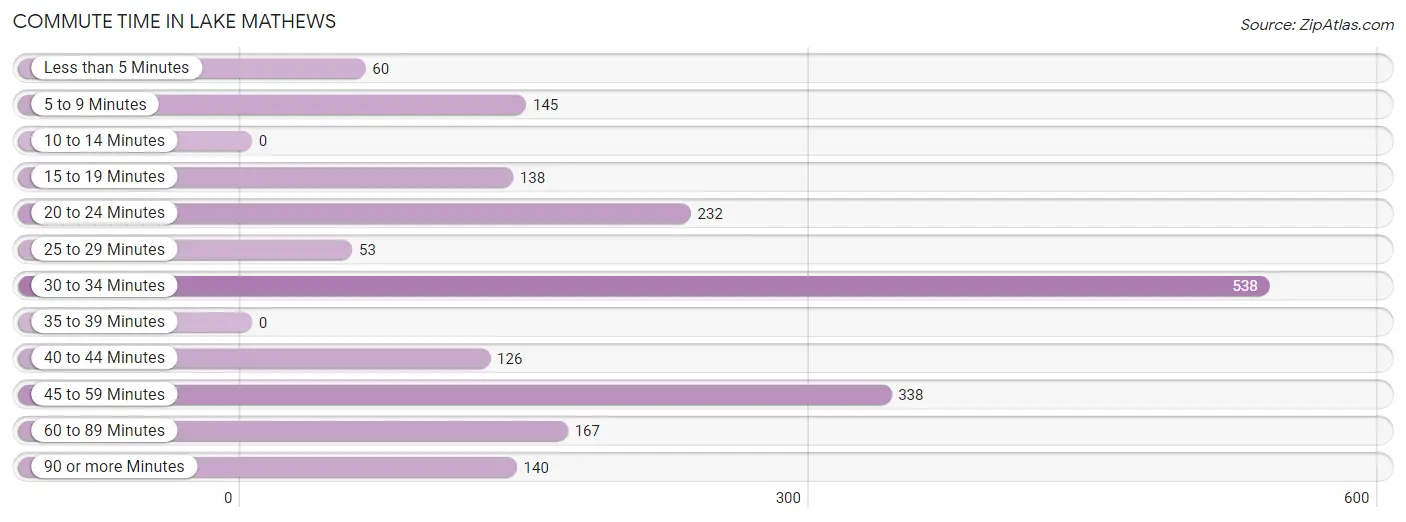
| Commute Time | # Commuters | % Commuters |
| Less than 5 Minutes | 60 | 3.1% |
| 5 to 9 Minutes | 145 | 7.5% |
| 10 to 14 Minutes | 0 | 0.0% |
| 15 to 19 Minutes | 138 | 7.1% |
| 20 to 24 Minutes | 232 | 12.0% |
| 25 to 29 Minutes | 53 | 2.7% |
| 30 to 34 Minutes | 538 | 27.8% |
| 35 to 39 Minutes | 0 | 0.0% |
| 40 to 44 Minutes | 126 | 6.5% |
| 45 to 59 Minutes | 338 | 17.4% |
| 60 to 89 Minutes | 167 | 8.6% |
| 90 or more Minutes | 140 | 7.2% |
Commute Time by Sex in Lake Mathews
The most common commute times in Lake Mathews are 45 to 59 minutes (257 commuters, 23.2%) for males and 30 to 34 minutes (395 commuters, 47.6%) for females.
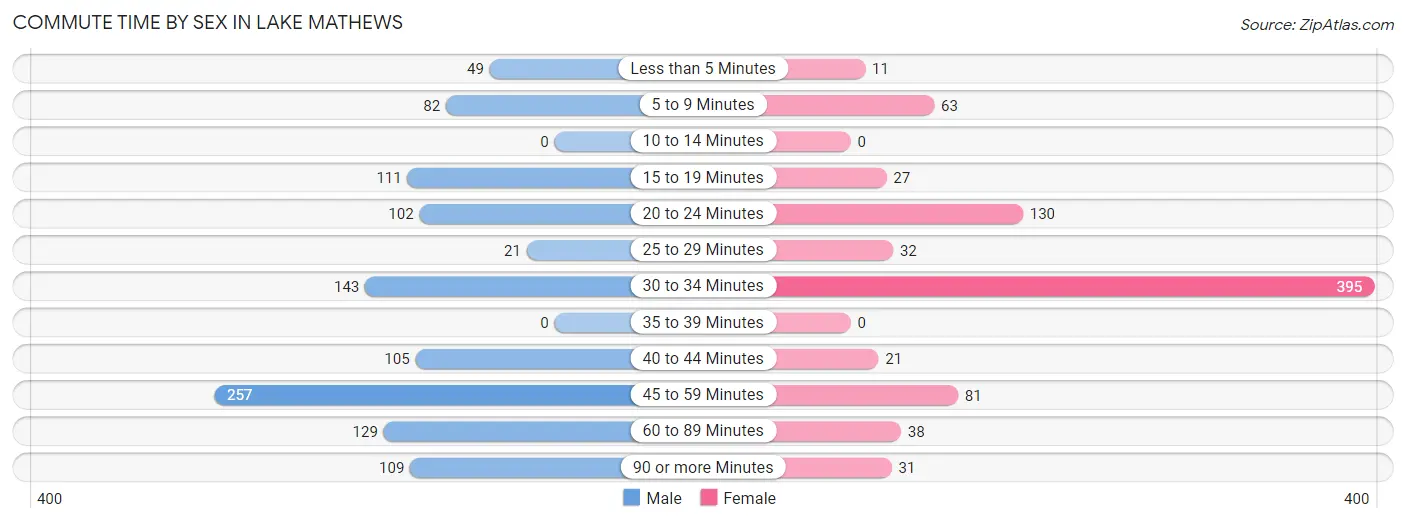
| Commute Time | Male | Female |
| Less than 5 Minutes | 49 (4.4%) | 11 (1.3%) |
| 5 to 9 Minutes | 82 (7.4%) | 63 (7.6%) |
| 10 to 14 Minutes | 0 (0.0%) | 0 (0.0%) |
| 15 to 19 Minutes | 111 (10.0%) | 27 (3.3%) |
| 20 to 24 Minutes | 102 (9.2%) | 130 (15.7%) |
| 25 to 29 Minutes | 21 (1.9%) | 32 (3.9%) |
| 30 to 34 Minutes | 143 (12.9%) | 395 (47.6%) |
| 35 to 39 Minutes | 0 (0.0%) | 0 (0.0%) |
| 40 to 44 Minutes | 105 (9.5%) | 21 (2.5%) |
| 45 to 59 Minutes | 257 (23.2%) | 81 (9.8%) |
| 60 to 89 Minutes | 129 (11.6%) | 38 (4.6%) |
| 90 or more Minutes | 109 (9.8%) | 31 (3.7%) |
Time of Departure to Work by Sex in Lake Mathews
The most frequent times of departure to work in Lake Mathews are 12:00 AM to 4:59 AM (213, 19.2%) for males and 8:00 AM to 8:29 AM (191, 23.0%) for females.
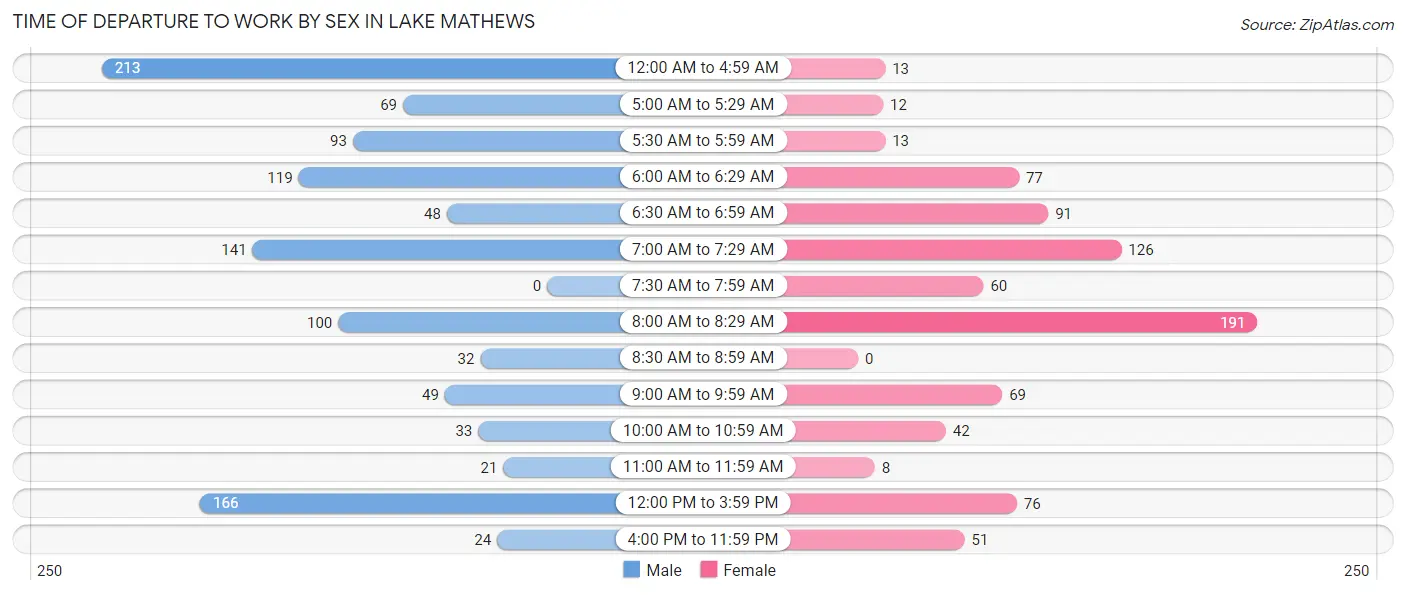
| Time of Departure | Male | Female |
| 12:00 AM to 4:59 AM | 213 (19.2%) | 13 (1.6%) |
| 5:00 AM to 5:29 AM | 69 (6.2%) | 12 (1.5%) |
| 5:30 AM to 5:59 AM | 93 (8.4%) | 13 (1.6%) |
| 6:00 AM to 6:29 AM | 119 (10.7%) | 77 (9.3%) |
| 6:30 AM to 6:59 AM | 48 (4.3%) | 91 (11.0%) |
| 7:00 AM to 7:29 AM | 141 (12.7%) | 126 (15.2%) |
| 7:30 AM to 7:59 AM | 0 (0.0%) | 60 (7.2%) |
| 8:00 AM to 8:29 AM | 100 (9.0%) | 191 (23.0%) |
| 8:30 AM to 8:59 AM | 32 (2.9%) | 0 (0.0%) |
| 9:00 AM to 9:59 AM | 49 (4.4%) | 69 (8.3%) |
| 10:00 AM to 10:59 AM | 33 (3.0%) | 42 (5.1%) |
| 11:00 AM to 11:59 AM | 21 (1.9%) | 8 (1.0%) |
| 12:00 PM to 3:59 PM | 166 (15.0%) | 76 (9.2%) |
| 4:00 PM to 11:59 PM | 24 (2.2%) | 51 (6.1%) |
| Total | 1,108 (100.0%) | 829 (100.0%) |
Housing Occupancy in Lake Mathews
Occupancy by Ownership in Lake Mathews
Of the total 1,715 dwellings in Lake Mathews, owner-occupied units account for 1,476 (86.1%), while renter-occupied units make up 239 (13.9%).
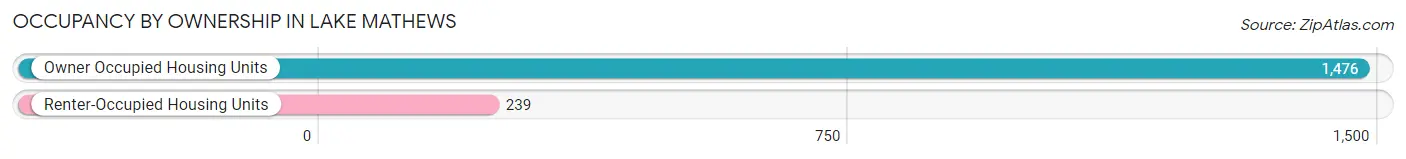
| Occupancy | # Housing Units | % Housing Units |
| Owner Occupied Housing Units | 1,476 | 86.1% |
| Renter-Occupied Housing Units | 239 | 13.9% |
| Total Occupied Housing Units | 1,715 | 100.0% |
Occupancy by Household Size in Lake Mathews
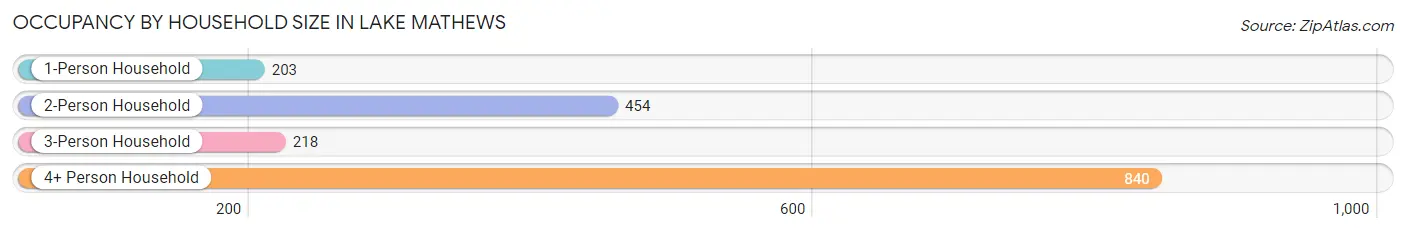
| Household Size | # Housing Units | % Housing Units |
| 1-Person Household | 203 | 11.8% |
| 2-Person Household | 454 | 26.5% |
| 3-Person Household | 218 | 12.7% |
| 4+ Person Household | 840 | 49.0% |
| Total Housing Units | 1,715 | 100.0% |
Occupancy by Ownership by Household Size in Lake Mathews
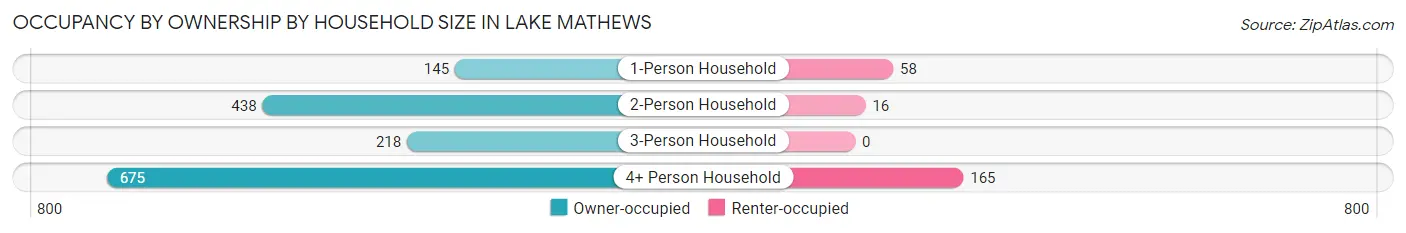
| Household Size | Owner-occupied | Renter-occupied |
| 1-Person Household | 145 (71.4%) | 58 (28.6%) |
| 2-Person Household | 438 (96.5%) | 16 (3.5%) |
| 3-Person Household | 218 (100.0%) | 0 (0.0%) |
| 4+ Person Household | 675 (80.4%) | 165 (19.6%) |
| Total Housing Units | 1,476 (86.1%) | 239 (13.9%) |
Occupancy by Educational Attainment in Lake Mathews
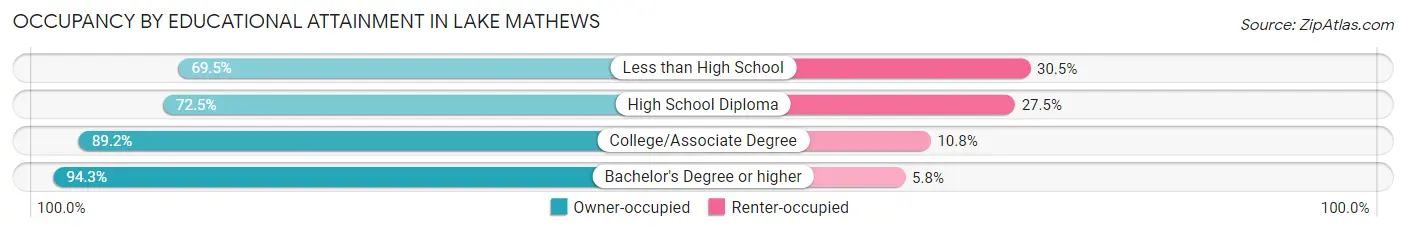
| Household Size | Owner-occupied | Renter-occupied |
| Less than High School | 123 (69.5%) | 54 (30.5%) |
| High School Diploma | 198 (72.5%) | 75 (27.5%) |
| College/Associate Degree | 663 (89.2%) | 80 (10.8%) |
| Bachelor's Degree or higher | 492 (94.3%) | 30 (5.8%) |
Occupancy by Age of Householder in Lake Mathews
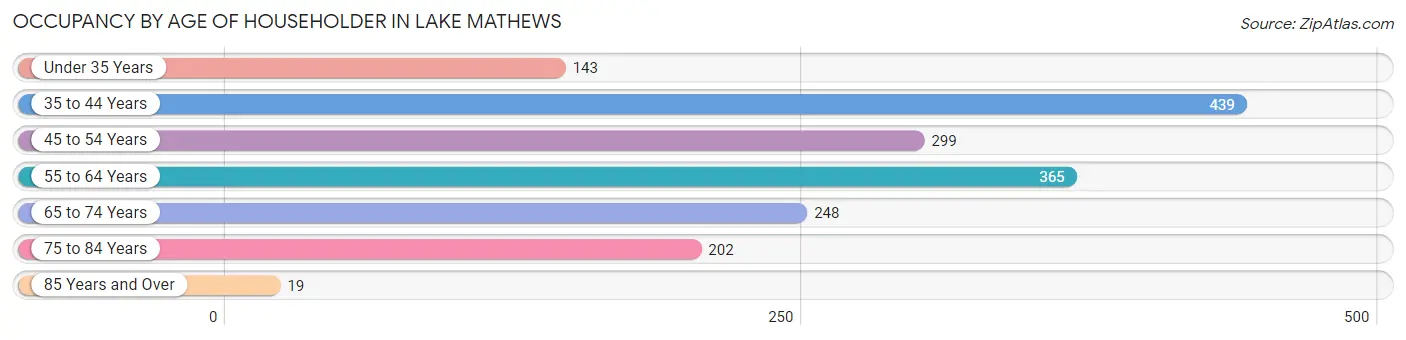
| Age Bracket | # Households | % Households |
| Under 35 Years | 143 | 8.3% |
| 35 to 44 Years | 439 | 25.6% |
| 45 to 54 Years | 299 | 17.4% |
| 55 to 64 Years | 365 | 21.3% |
| 65 to 74 Years | 248 | 14.5% |
| 75 to 84 Years | 202 | 11.8% |
| 85 Years and Over | 19 | 1.1% |
| Total | 1,715 | 100.0% |
Housing Finances in Lake Mathews
Median Income by Occupancy in Lake Mathews
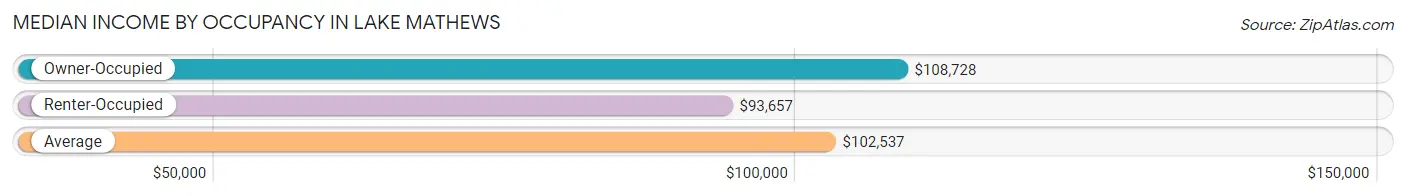
| Occupancy Type | # Households | Median Income |
| Owner-Occupied | 1,476 (86.1%) | $108,728 |
| Renter-Occupied | 239 (13.9%) | $93,657 |
| Average | 1,715 (100.0%) | $102,537 |
Occupancy by Householder Income Bracket in Lake Mathews
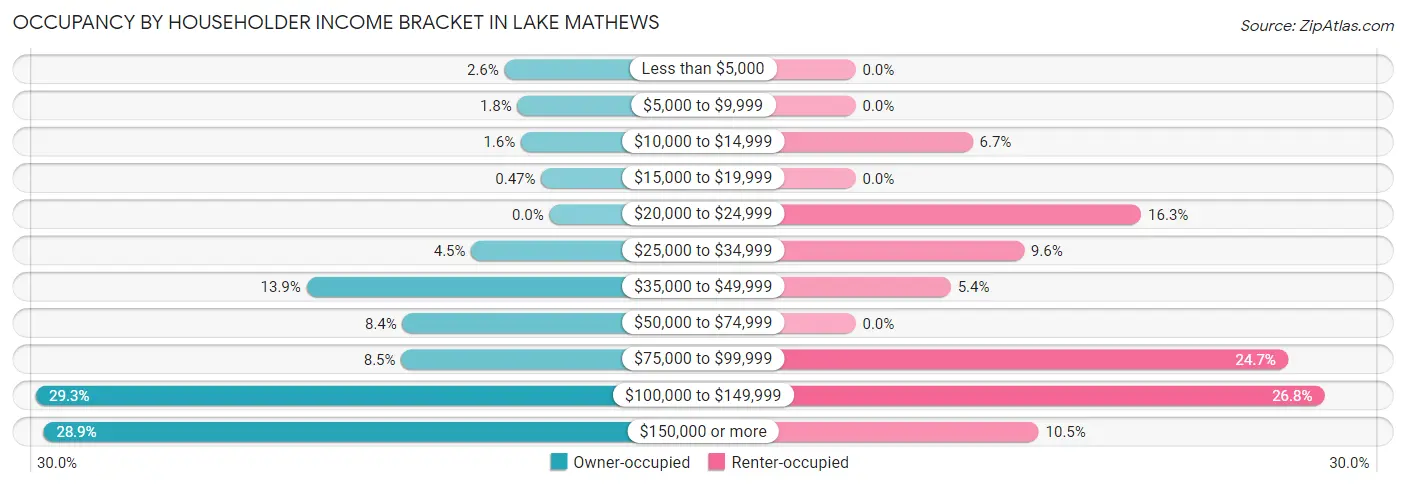
| Income Bracket | Owner-occupied | Renter-occupied |
| Less than $5,000 | 38 (2.6%) | 0 (0.0%) |
| $5,000 to $9,999 | 27 (1.8%) | 0 (0.0%) |
| $10,000 to $14,999 | 24 (1.6%) | 16 (6.7%) |
| $15,000 to $19,999 | 7 (0.5%) | 0 (0.0%) |
| $20,000 to $24,999 | 0 (0.0%) | 39 (16.3%) |
| $25,000 to $34,999 | 66 (4.5%) | 23 (9.6%) |
| $35,000 to $49,999 | 205 (13.9%) | 13 (5.4%) |
| $50,000 to $74,999 | 124 (8.4%) | 0 (0.0%) |
| $75,000 to $99,999 | 125 (8.5%) | 59 (24.7%) |
| $100,000 to $149,999 | 433 (29.3%) | 64 (26.8%) |
| $150,000 or more | 427 (28.9%) | 25 (10.5%) |
| Total | 1,476 (100.0%) | 239 (100.0%) |
Monthly Housing Cost Tiers in Lake Mathews
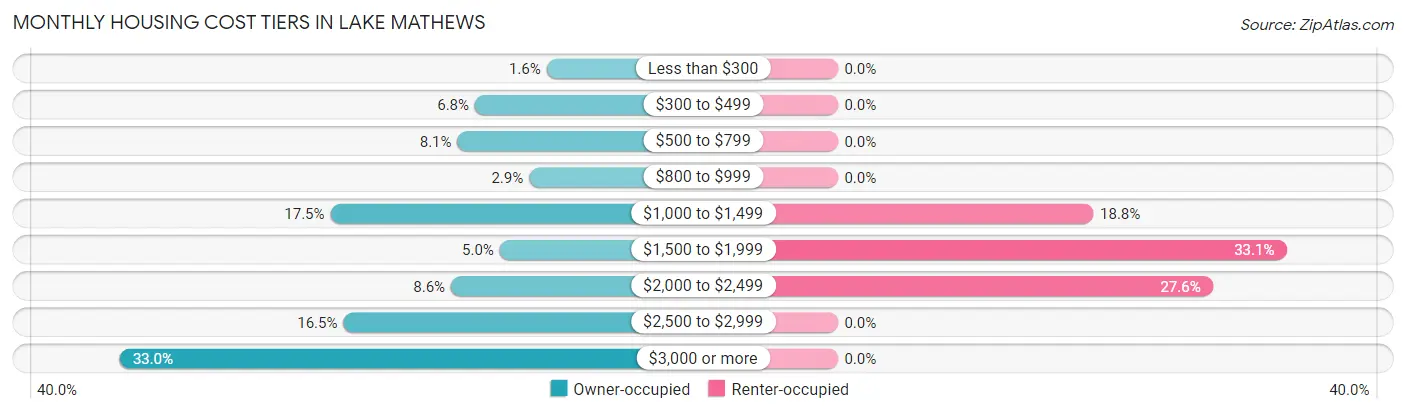
| Monthly Cost | Owner-occupied | Renter-occupied |
| Less than $300 | 23 (1.6%) | 0 (0.0%) |
| $300 to $499 | 101 (6.8%) | 0 (0.0%) |
| $500 to $799 | 120 (8.1%) | 0 (0.0%) |
| $800 to $999 | 42 (2.9%) | 0 (0.0%) |
| $1,000 to $1,499 | 258 (17.5%) | 45 (18.8%) |
| $1,500 to $1,999 | 74 (5.0%) | 79 (33.1%) |
| $2,000 to $2,499 | 127 (8.6%) | 66 (27.6%) |
| $2,500 to $2,999 | 244 (16.5%) | 0 (0.0%) |
| $3,000 or more | 487 (33.0%) | 0 (0.0%) |
| Total | 1,476 (100.0%) | 239 (100.0%) |
Physical Housing Characteristics in Lake Mathews
Housing Structures in Lake Mathews
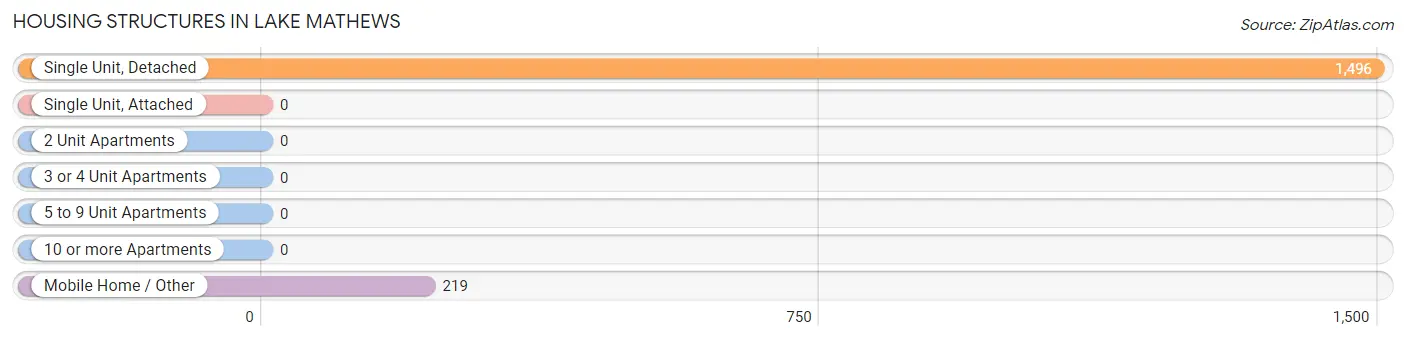
| Structure Type | # Housing Units | % Housing Units |
| Single Unit, Detached | 1,496 | 87.2% |
| Single Unit, Attached | 0 | 0.0% |
| 2 Unit Apartments | 0 | 0.0% |
| 3 or 4 Unit Apartments | 0 | 0.0% |
| 5 to 9 Unit Apartments | 0 | 0.0% |
| 10 or more Apartments | 0 | 0.0% |
| Mobile Home / Other | 219 | 12.8% |
| Total | 1,715 | 100.0% |
Housing Structures by Occupancy in Lake Mathews
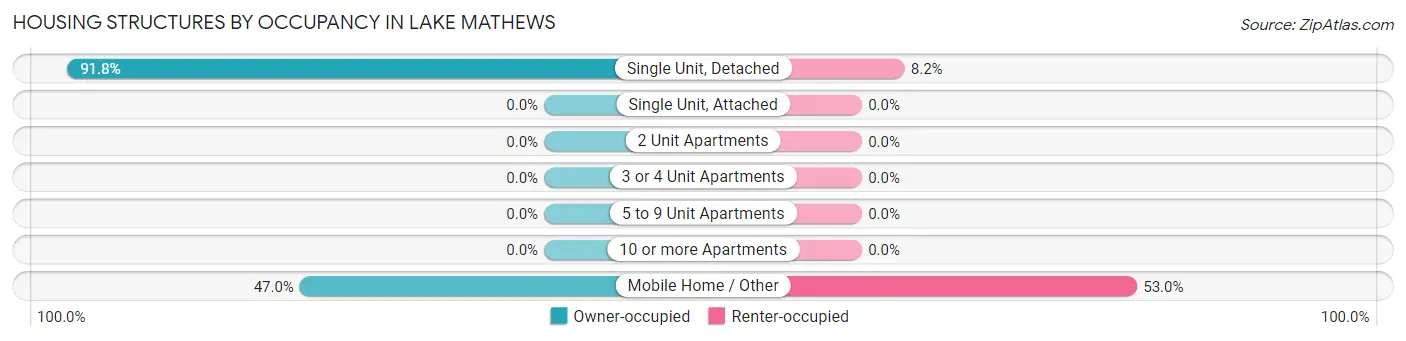
| Structure Type | Owner-occupied | Renter-occupied |
| Single Unit, Detached | 1,373 (91.8%) | 123 (8.2%) |
| Single Unit, Attached | 0 (0.0%) | 0 (0.0%) |
| 2 Unit Apartments | 0 (0.0%) | 0 (0.0%) |
| 3 or 4 Unit Apartments | 0 (0.0%) | 0 (0.0%) |
| 5 to 9 Unit Apartments | 0 (0.0%) | 0 (0.0%) |
| 10 or more Apartments | 0 (0.0%) | 0 (0.0%) |
| Mobile Home / Other | 103 (47.0%) | 116 (53.0%) |
| Total | 1,476 (86.1%) | 239 (13.9%) |
Housing Structures by Number of Rooms in Lake Mathews
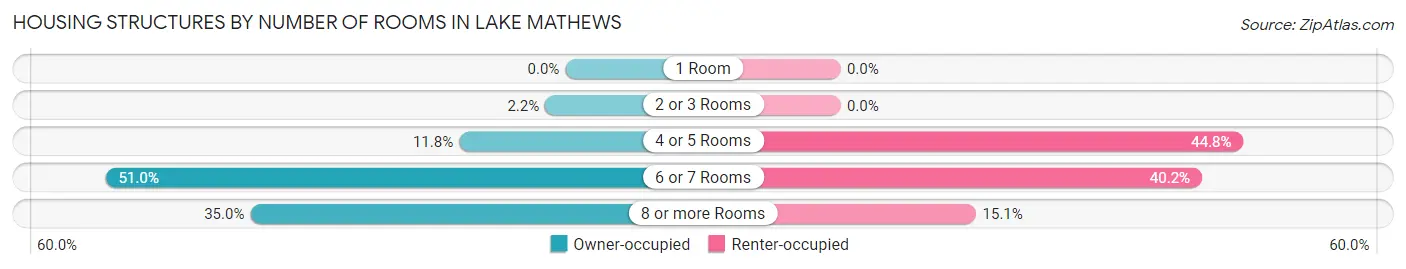
| Number of Rooms | Owner-occupied | Renter-occupied |
| 1 Room | 0 (0.0%) | 0 (0.0%) |
| 2 or 3 Rooms | 33 (2.2%) | 0 (0.0%) |
| 4 or 5 Rooms | 174 (11.8%) | 107 (44.8%) |
| 6 or 7 Rooms | 753 (51.0%) | 96 (40.2%) |
| 8 or more Rooms | 516 (35.0%) | 36 (15.1%) |
| Total | 1,476 (100.0%) | 239 (100.0%) |
Housing Structure by Heating Type in Lake Mathews
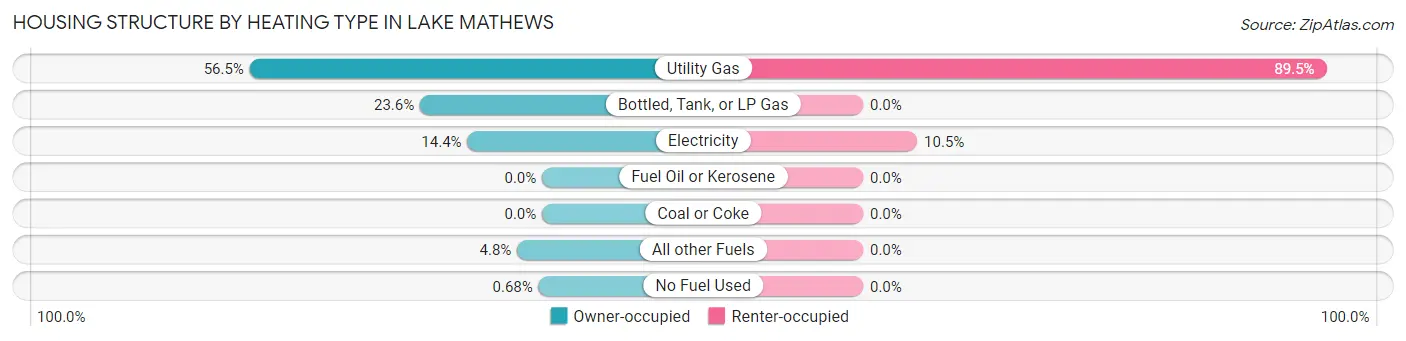
| Heating Type | Owner-occupied | Renter-occupied |
| Utility Gas | 834 (56.5%) | 214 (89.5%) |
| Bottled, Tank, or LP Gas | 348 (23.6%) | 0 (0.0%) |
| Electricity | 213 (14.4%) | 25 (10.5%) |
| Fuel Oil or Kerosene | 0 (0.0%) | 0 (0.0%) |
| Coal or Coke | 0 (0.0%) | 0 (0.0%) |
| All other Fuels | 71 (4.8%) | 0 (0.0%) |
| No Fuel Used | 10 (0.7%) | 0 (0.0%) |
| Total | 1,476 (100.0%) | 239 (100.0%) |
Household Vehicle Usage in Lake Mathews
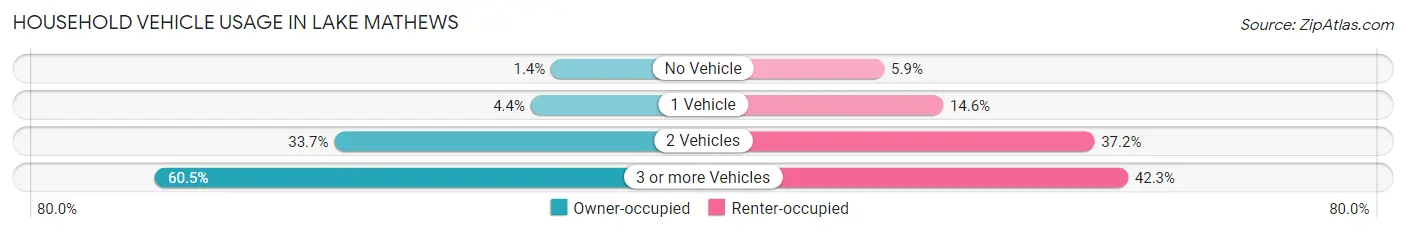
| Vehicles per Household | Owner-occupied | Renter-occupied |
| No Vehicle | 20 (1.4%) | 14 (5.9%) |
| 1 Vehicle | 65 (4.4%) | 35 (14.6%) |
| 2 Vehicles | 498 (33.7%) | 89 (37.2%) |
| 3 or more Vehicles | 893 (60.5%) | 101 (42.3%) |
| Total | 1,476 (100.0%) | 239 (100.0%) |
Real Estate & Mortgages in Lake Mathews
Real Estate and Mortgage Overview in Lake Mathews
| Characteristic | Without Mortgage | With Mortgage |
| Housing Units | 359 | 1,117 |
| Median Property Value | $458,500 | $674,200 |
| Median Household Income | $77,578 | $380 |
| Monthly Housing Costs | $639 | $487 |
| Real Estate Taxes | $2,763 | $23 |
Property Value by Mortgage Status in Lake Mathews
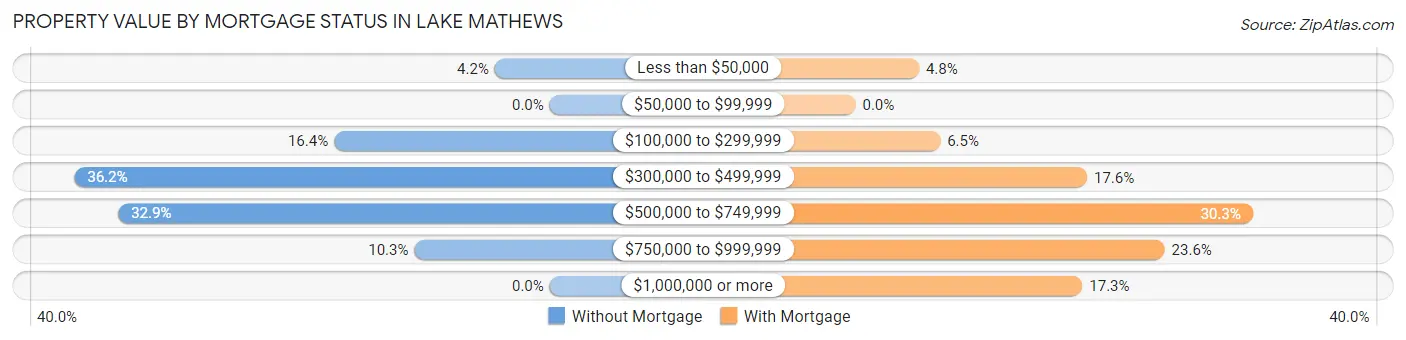
| Property Value | Without Mortgage | With Mortgage |
| Less than $50,000 | 15 (4.2%) | 54 (4.8%) |
| $50,000 to $99,999 | 0 (0.0%) | 0 (0.0%) |
| $100,000 to $299,999 | 59 (16.4%) | 72 (6.5%) |
| $300,000 to $499,999 | 130 (36.2%) | 197 (17.6%) |
| $500,000 to $749,999 | 118 (32.9%) | 338 (30.3%) |
| $750,000 to $999,999 | 37 (10.3%) | 263 (23.5%) |
| $1,000,000 or more | 0 (0.0%) | 193 (17.3%) |
| Total | 359 (100.0%) | 1,117 (100.0%) |
Household Income by Mortgage Status in Lake Mathews
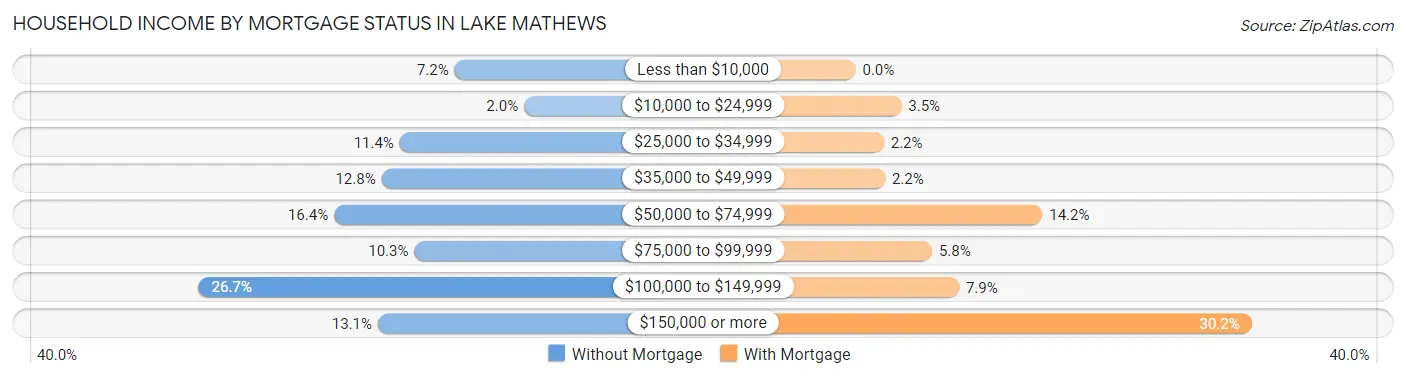
| Household Income | Without Mortgage | With Mortgage |
| Less than $10,000 | 26 (7.2%) | 0 (0.0%) |
| $10,000 to $24,999 | 7 (1.9%) | 39 (3.5%) |
| $25,000 to $34,999 | 41 (11.4%) | 24 (2.1%) |
| $35,000 to $49,999 | 46 (12.8%) | 25 (2.2%) |
| $50,000 to $74,999 | 59 (16.4%) | 159 (14.2%) |
| $75,000 to $99,999 | 37 (10.3%) | 65 (5.8%) |
| $100,000 to $149,999 | 96 (26.7%) | 88 (7.9%) |
| $150,000 or more | 47 (13.1%) | 337 (30.2%) |
| Total | 359 (100.0%) | 1,117 (100.0%) |
Property Value to Household Income Ratio in Lake Mathews
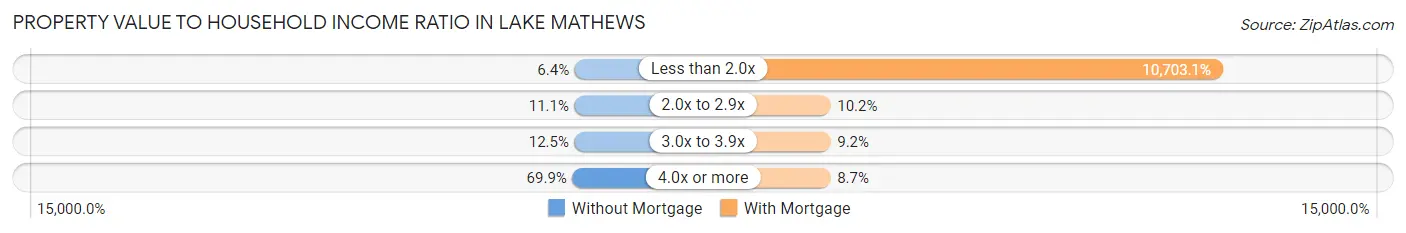
| Value-to-Income Ratio | Without Mortgage | With Mortgage |
| Less than 2.0x | 23 (6.4%) | 119,554 (10,703.1%) |
| 2.0x to 2.9x | 40 (11.1%) | 114 (10.2%) |
| 3.0x to 3.9x | 45 (12.5%) | 103 (9.2%) |
| 4.0x or more | 251 (69.9%) | 97 (8.7%) |
| Total | 359 (100.0%) | 1,117 (100.0%) |
Real Estate Taxes by Mortgage Status in Lake Mathews
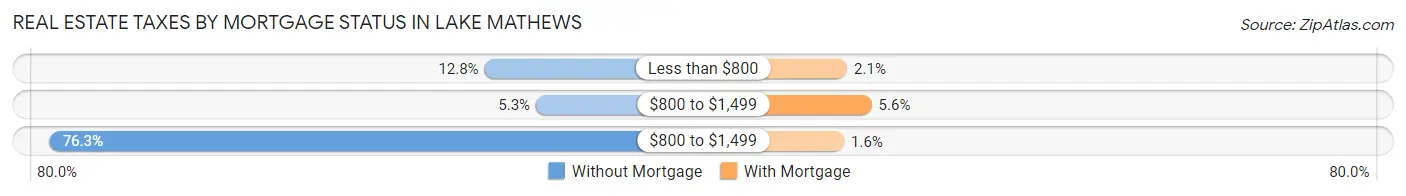
| Property Taxes | Without Mortgage | With Mortgage |
| Less than $800 | 46 (12.8%) | 23 (2.1%) |
| $800 to $1,499 | 19 (5.3%) | 63 (5.6%) |
| $800 to $1,499 | 274 (76.3%) | 18 (1.6%) |
| Total | 359 (100.0%) | 1,117 (100.0%) |
Health & Disability in Lake Mathews
Health Insurance Coverage by Age in Lake Mathews
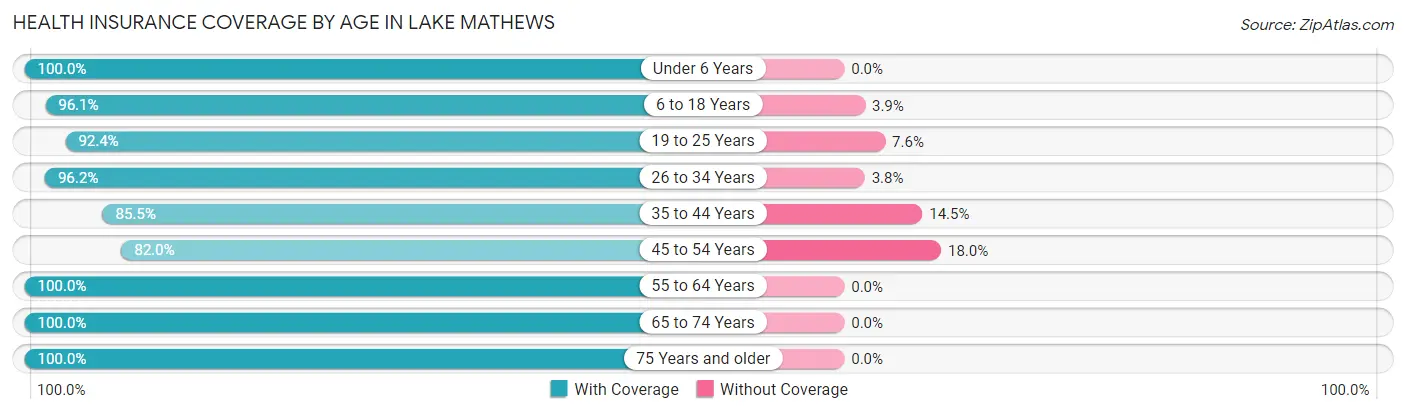
| Age Bracket | With Coverage | Without Coverage |
| Under 6 Years | 506 (100.0%) | 0 (0.0%) |
| 6 to 18 Years | 1,442 (96.1%) | 58 (3.9%) |
| 19 to 25 Years | 412 (92.4%) | 34 (7.6%) |
| 26 to 34 Years | 455 (96.2%) | 18 (3.8%) |
| 35 to 44 Years | 723 (85.5%) | 123 (14.5%) |
| 45 to 54 Years | 668 (82.0%) | 147 (18.0%) |
| 55 to 64 Years | 902 (100.0%) | 0 (0.0%) |
| 65 to 74 Years | 560 (100.0%) | 0 (0.0%) |
| 75 Years and older | 446 (100.0%) | 0 (0.0%) |
| Total | 6,114 (94.2%) | 380 (5.9%) |
Health Insurance Coverage by Citizenship Status in Lake Mathews
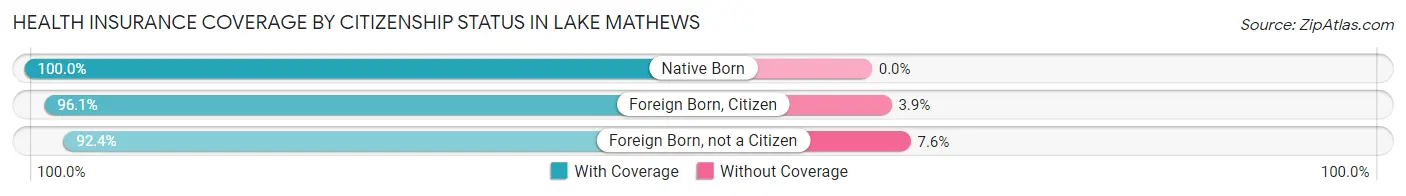
| Citizenship Status | With Coverage | Without Coverage |
| Native Born | 506 (100.0%) | 0 (0.0%) |
| Foreign Born, Citizen | 1,442 (96.1%) | 58 (3.9%) |
| Foreign Born, not a Citizen | 412 (92.4%) | 34 (7.6%) |
Health Insurance Coverage by Household Income in Lake Mathews
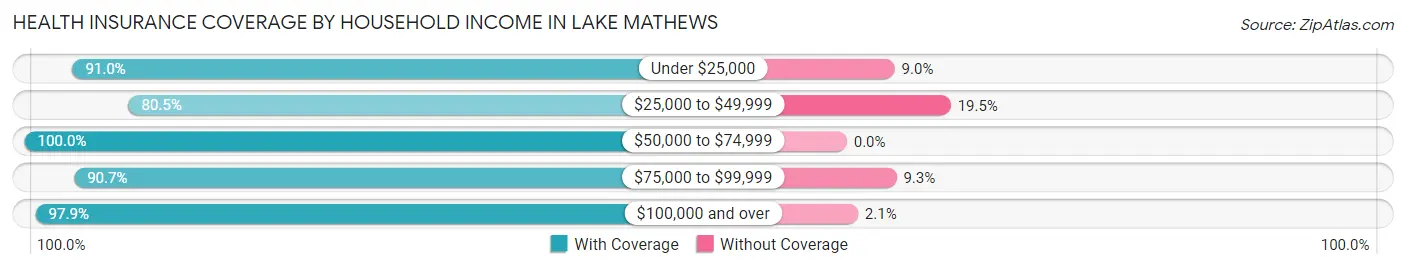
| Household Income | With Coverage | Without Coverage |
| Under $25,000 | 396 (91.0%) | 39 (9.0%) |
| $25,000 to $49,999 | 819 (80.5%) | 198 (19.5%) |
| $50,000 to $74,999 | 465 (100.0%) | 0 (0.0%) |
| $75,000 to $99,999 | 605 (90.7%) | 62 (9.3%) |
| $100,000 and over | 3,809 (97.9%) | 81 (2.1%) |
Public vs Private Health Insurance Coverage by Age in Lake Mathews
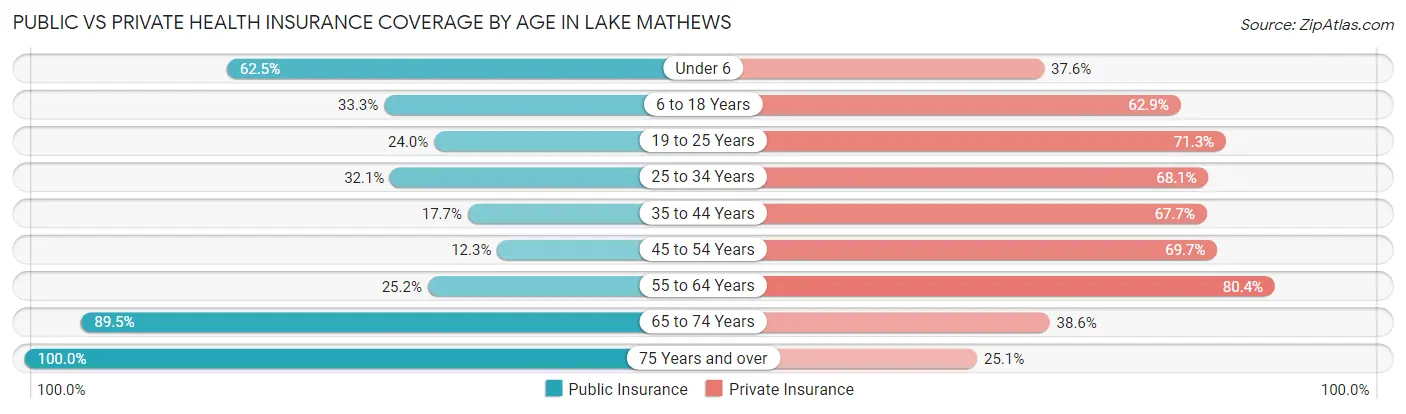
| Age Bracket | Public Insurance | Private Insurance |
| Under 6 | 316 (62.5%) | 190 (37.6%) |
| 6 to 18 Years | 499 (33.3%) | 943 (62.9%) |
| 19 to 25 Years | 107 (24.0%) | 318 (71.3%) |
| 25 to 34 Years | 152 (32.1%) | 322 (68.1%) |
| 35 to 44 Years | 150 (17.7%) | 573 (67.7%) |
| 45 to 54 Years | 100 (12.3%) | 568 (69.7%) |
| 55 to 64 Years | 227 (25.2%) | 725 (80.4%) |
| 65 to 74 Years | 501 (89.5%) | 216 (38.6%) |
| 75 Years and over | 446 (100.0%) | 112 (25.1%) |
| Total | 2,498 (38.5%) | 3,967 (61.1%) |
Disability Status by Sex by Age in Lake Mathews
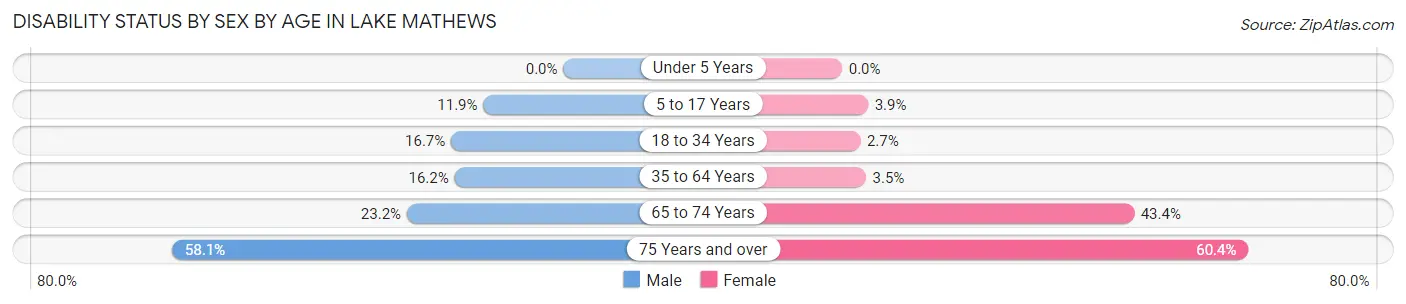
| Age Bracket | Male | Female |
| Under 5 Years | 0 (0.0%) | 0 (0.0%) |
| 5 to 17 Years | 108 (11.9%) | 26 (3.8%) |
| 18 to 34 Years | 71 (16.7%) | 15 (2.7%) |
| 35 to 64 Years | 218 (16.2%) | 43 (3.5%) |
| 65 to 74 Years | 69 (23.2%) | 114 (43.3%) |
| 75 Years and over | 161 (58.1%) | 102 (60.4%) |
Disability Class by Sex by Age in Lake Mathews
Disability Class: Hearing Difficulty
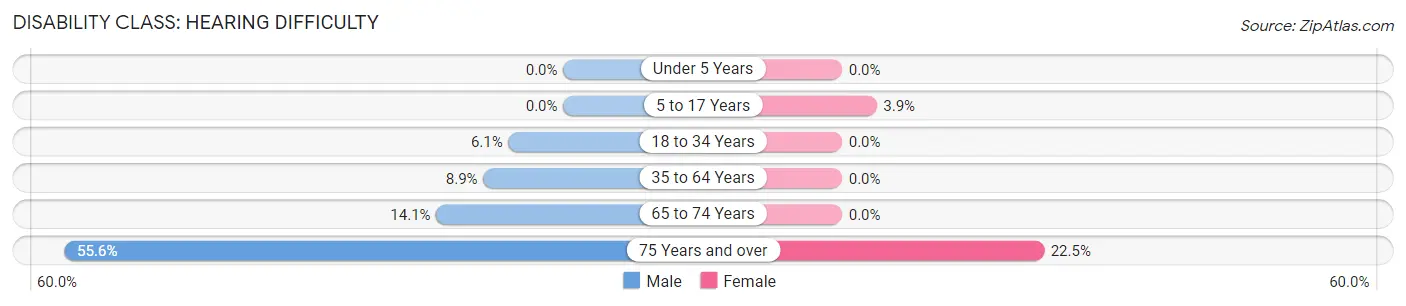
| Age Bracket | Male | Female |
| Under 5 Years | 0 (0.0%) | 0 (0.0%) |
| 5 to 17 Years | 0 (0.0%) | 26 (3.8%) |
| 18 to 34 Years | 26 (6.1%) | 0 (0.0%) |
| 35 to 64 Years | 120 (8.9%) | 0 (0.0%) |
| 65 to 74 Years | 42 (14.1%) | 0 (0.0%) |
| 75 Years and over | 154 (55.6%) | 38 (22.5%) |
Disability Class: Vision Difficulty
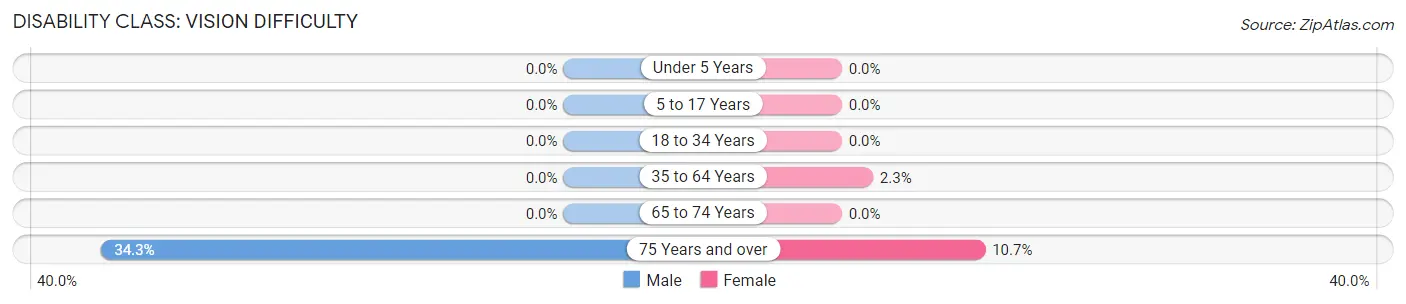
| Age Bracket | Male | Female |
| Under 5 Years | 0 (0.0%) | 0 (0.0%) |
| 5 to 17 Years | 0 (0.0%) | 0 (0.0%) |
| 18 to 34 Years | 0 (0.0%) | 0 (0.0%) |
| 35 to 64 Years | 0 (0.0%) | 28 (2.3%) |
| 65 to 74 Years | 0 (0.0%) | 0 (0.0%) |
| 75 Years and over | 95 (34.3%) | 18 (10.6%) |
Disability Class: Cognitive Difficulty
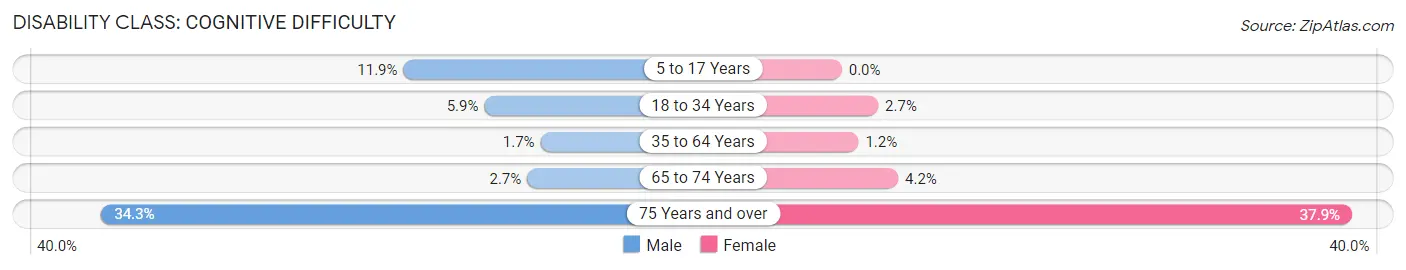
| Age Bracket | Male | Female |
| 5 to 17 Years | 108 (11.9%) | 0 (0.0%) |
| 18 to 34 Years | 25 (5.9%) | 15 (2.7%) |
| 35 to 64 Years | 23 (1.7%) | 15 (1.2%) |
| 65 to 74 Years | 8 (2.7%) | 11 (4.2%) |
| 75 Years and over | 95 (34.3%) | 64 (37.9%) |
Disability Class: Ambulatory Difficulty
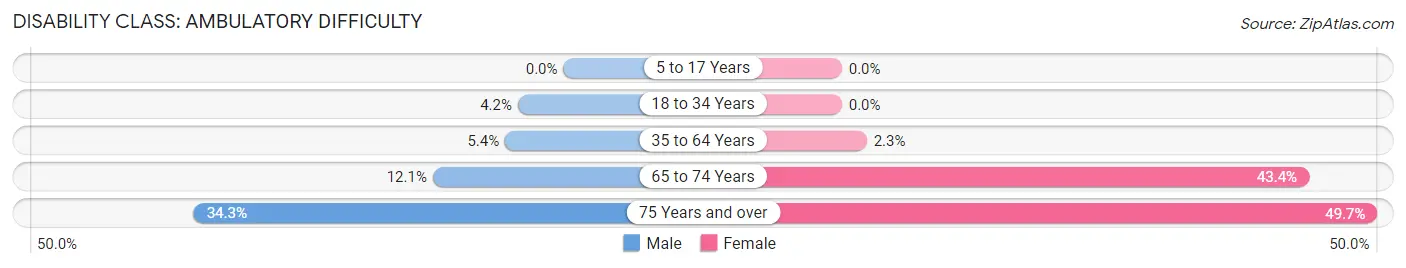
| Age Bracket | Male | Female |
| 5 to 17 Years | 0 (0.0%) | 0 (0.0%) |
| 18 to 34 Years | 18 (4.2%) | 0 (0.0%) |
| 35 to 64 Years | 73 (5.4%) | 28 (2.3%) |
| 65 to 74 Years | 36 (12.1%) | 114 (43.3%) |
| 75 Years and over | 95 (34.3%) | 84 (49.7%) |
Disability Class: Self-Care Difficulty
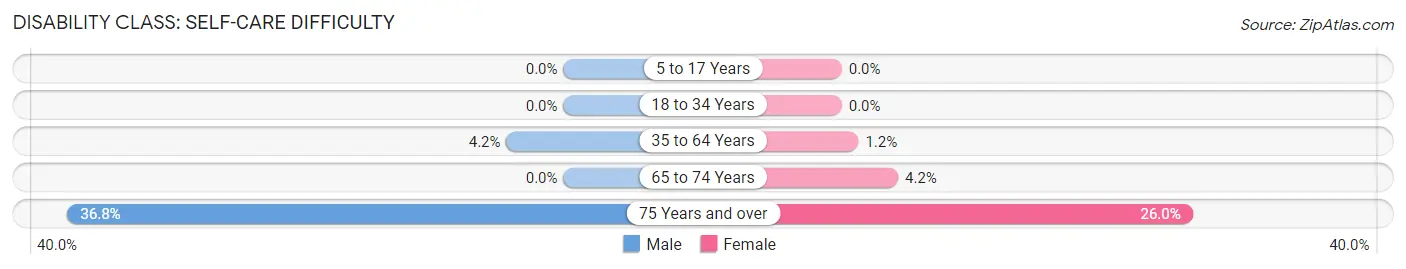
| Age Bracket | Male | Female |
| 5 to 17 Years | 0 (0.0%) | 0 (0.0%) |
| 18 to 34 Years | 0 (0.0%) | 0 (0.0%) |
| 35 to 64 Years | 57 (4.2%) | 15 (1.2%) |
| 65 to 74 Years | 0 (0.0%) | 11 (4.2%) |
| 75 Years and over | 102 (36.8%) | 44 (26.0%) |
Technology Access in Lake Mathews
Computing Device Access in Lake Mathews
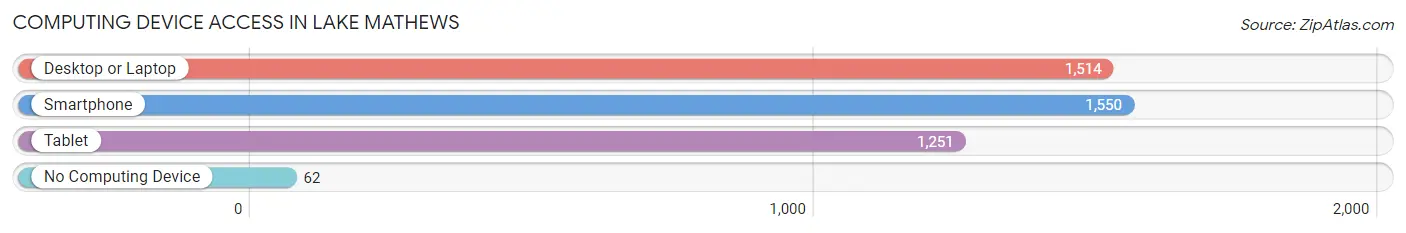
| Device Type | # Households | % Households |
| Desktop or Laptop | 1,514 | 88.3% |
| Smartphone | 1,550 | 90.4% |
| Tablet | 1,251 | 72.9% |
| No Computing Device | 62 | 3.6% |
| Total | 1,715 | 100.0% |
Internet Access in Lake Mathews
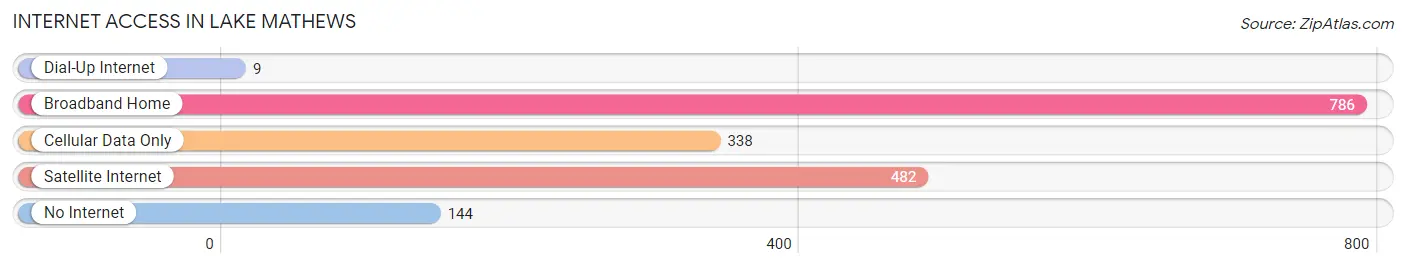
| Internet Type | # Households | % Households |
| Dial-Up Internet | 9 | 0.5% |
| Broadband Home | 786 | 45.8% |
| Cellular Data Only | 338 | 19.7% |
| Satellite Internet | 482 | 28.1% |
| No Internet | 144 | 8.4% |
| Total | 1,715 | 100.0% |
Lake Mathews Summary
Introduction
Lake Mathews is a census-designated place located in Riverside County, California. It is situated in the foothills of the Santa Ana Mountains, approximately 20 miles southeast of Riverside. The area is known for its rural atmosphere and its proximity to the Lake Mathews Reservoir, a popular recreational area. The population of Lake Mathews was 8,719 at the 2010 census.
History
The area now known as Lake Mathews was originally inhabited by the Cahuilla Indians. The first Europeans to settle in the area were Spanish missionaries, who established a mission in the area in the late 1700s. The area was later settled by ranchers, who established large cattle ranches in the area.
In the early 1900s, the area was developed as a recreational area, with the construction of the Lake Mathews Reservoir. The reservoir was built to provide irrigation water for the surrounding area, and it quickly became a popular destination for fishing, boating, and other recreational activities.
Geography
Lake Mathews is located in the foothills of the Santa Ana Mountains, approximately 20 miles southeast of Riverside. The area is characterized by rolling hills and valleys, with elevations ranging from 1,000 to 2,000 feet. The area is home to several creeks and streams, including the Santa Ana River, which flows through the area.
The climate in Lake Mathews is generally mild, with temperatures ranging from the mid-50s in the winter to the mid-90s in the summer. The area receives an average of 15 inches of rain per year.
Economy
The economy of Lake Mathews is largely based on agriculture and tourism. The area is home to several large farms, which produce a variety of crops, including citrus, avocados, and olives. The area is also home to several wineries, which produce a variety of wines.
The area is also a popular destination for tourists, who come to enjoy the area’s natural beauty and recreational activities. The Lake Mathews Reservoir is a popular destination for fishing, boating, and other recreational activities. The area is also home to several campgrounds, which attract visitors from all over the region.
Demographics
As of the 2010 census, the population of Lake Mathews was 8,719. The population is largely white (77.3%), with smaller percentages of Hispanic (14.2%), African American (2.3%), and Asian (2.2%) residents. The median household income in the area is $68,945, and the median home value is $346,000.
Conclusion
Lake Mathews is a census-designated place located in Riverside County, California. It is situated in the foothills of the Santa Ana Mountains, approximately 20 miles southeast of Riverside. The area is known for its rural atmosphere and its proximity to the Lake Mathews Reservoir, a popular recreational area. The population of Lake Mathews was 8,719 at the 2010 census. The economy of Lake Mathews is largely based on agriculture and tourism, and the area is a popular destination for tourists who come to enjoy the area’s natural beauty and recreational activities. The population of Lake Mathews is largely white, with smaller percentages of Hispanic, African American, and Asian residents.
Common Questions
What is Per Capita Income in Lake Mathews?
Per Capita income in Lake Mathews is $34,447.
What is the Median Family Income in Lake Mathews?
Median Family Income in Lake Mathews is $100,067.
What is the Median Household income in Lake Mathews?
Median Household Income in Lake Mathews is $102,537.
What is Income or Wage Gap in Lake Mathews?
Income or Wage Gap in Lake Mathews is 28.1%.
Women in Lake Mathews earn 71.9 cents for every dollar earned by a man.
What is Inequality or Gini Index in Lake Mathews?
Inequality or Gini Index in Lake Mathews is 0.42.
What is the Total Population of Lake Mathews?
Total Population of Lake Mathews is 6,494.
What is the Total Male Population of Lake Mathews?
Total Male Population of Lake Mathews is 3,353.
What is the Total Female Population of Lake Mathews?
Total Female Population of Lake Mathews is 3,141.
What is the Ratio of Males per 100 Females in Lake Mathews?
There are 106.75 Males per 100 Females in Lake Mathews.
What is the Ratio of Females per 100 Males in Lake Mathews?
There are 93.68 Females per 100 Males in Lake Mathews.
What is the Median Population Age in Lake Mathews?
Median Population Age in Lake Mathews is 37.6 Years.
What is the Average Family Size in Lake Mathews
Average Family Size in Lake Mathews is 3.9 People.
What is the Average Household Size in Lake Mathews
Average Household Size in Lake Mathews is 3.8 People.
How Large is the Labor Force in Lake Mathews?
There are 2,480 People in the Labor Forcein in Lake Mathews.
What is the Percentage of People in the Labor Force in Lake Mathews?
49.9% of People are in the Labor Force in Lake Mathews.
What is the Unemployment Rate in Lake Mathews?
Unemployment Rate in Lake Mathews is 11.7%.