Cities with the Highest Percentage of Korean Population in Massachusetts
RELATED REPORTS & OPTIONS
Korean
Massachusetts
Compare Cities
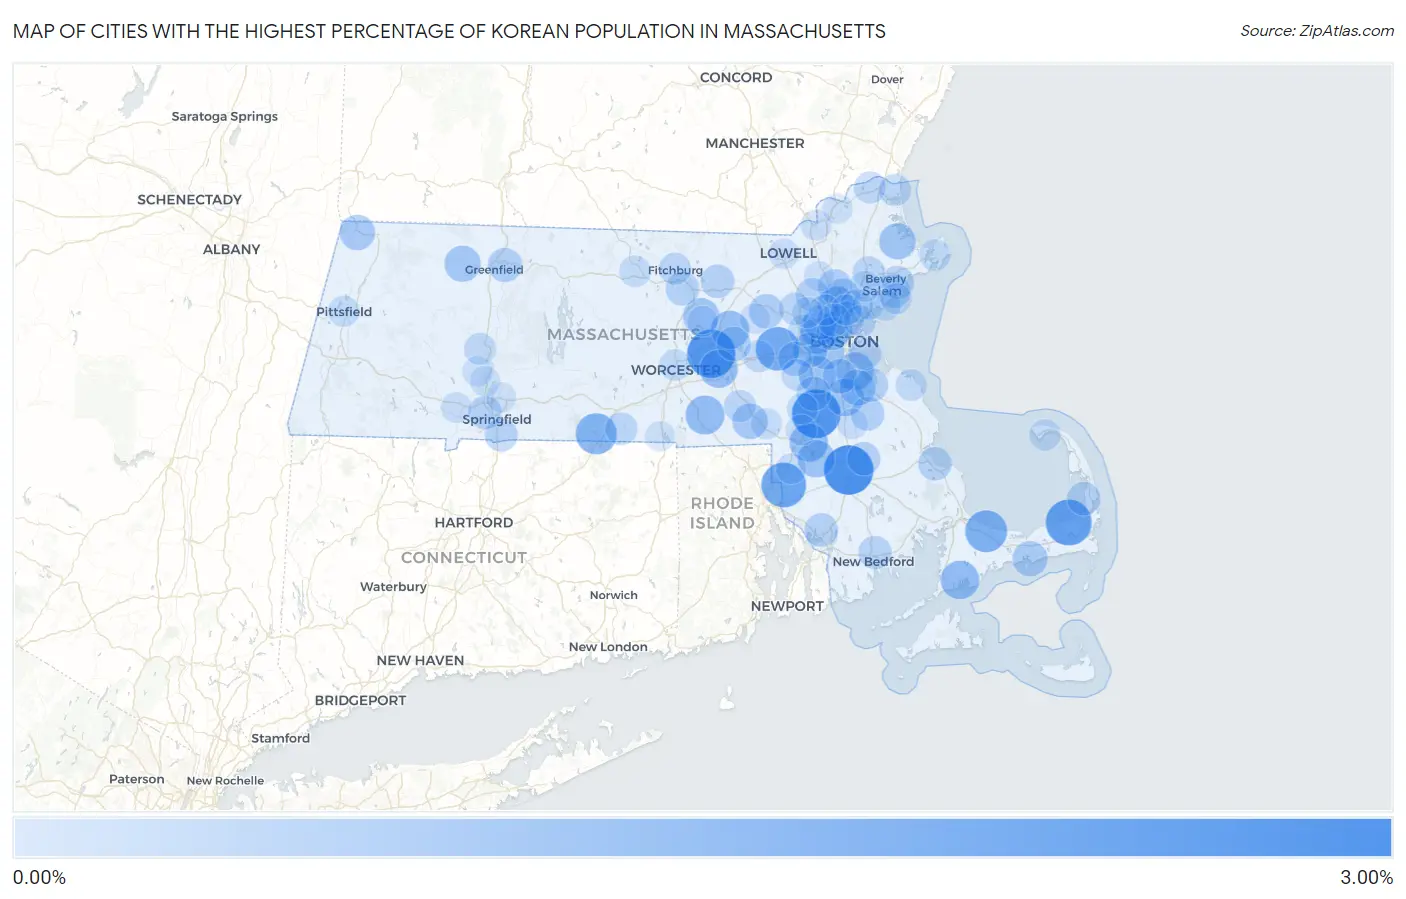
Map of Cities with the Highest Percentage of Korean Population in Massachusetts
0.00%
3.00%
Cities with the Highest Percentage of Korean Population in Massachusetts
| City | Korean | vs State | vs National | |
| 1. | Raynham Center | 2.60% | 0.38%(+2.22)#1 | 1.31%(+1.29)#1,589 |
| 2. | Sharon | 2.47% | 0.38%(+2.10)#2 | 1.31%(+1.16)#1,665 |
| 3. | Northborough | 2.44% | 0.38%(+2.06)#3 | 1.31%(+1.13)#1,686 |
| 4. | Brewster | 2.13% | 0.38%(+1.75)#4 | 1.31%(+0.818)#1,959 |
| 5. | North Seekonk | 1.98% | 0.38%(+1.60)#5 | 1.31%(+0.671)#2,114 |
| 6. | Cochituate | 1.83% | 0.38%(+1.45)#6 | 1.31%(+0.521)#2,314 |
| 7. | East Sandwich | 1.61% | 0.38%(+1.23)#7 | 1.31%(+0.301)#2,664 |
| 8. | Holland | 1.52% | 0.38%(+1.14)#8 | 1.31%(+0.205)#2,841 |
| 9. | Whitinsville | 1.22% | 0.38%(+0.846)#9 | 1.31%(-0.086)#3,452 |
| 10. | East Falmouth | 1.19% | 0.38%(+0.812)#10 | 1.31%(-0.121)#3,528 |
| 11. | Hudson | 1.16% | 0.38%(+0.784)#11 | 1.31%(-0.148)#3,603 |
| 12. | Mansfield Center | 1.16% | 0.38%(+0.780)#12 | 1.31%(-0.153)#3,610 |
| 13. | Westborough | 1.14% | 0.38%(+0.764)#13 | 1.31%(-0.169)#3,651 |
| 14. | Quincy | 1.07% | 0.38%(+0.695)#14 | 1.31%(-0.237)#3,836 |
| 15. | Randolph Town | 1.06% | 0.38%(+0.681)#15 | 1.31%(-0.252)#3,888 |
| 16. | Norton Center | 1.05% | 0.38%(+0.669)#16 | 1.31%(-0.263)#3,917 |
| 17. | Dedham | 1.04% | 0.38%(+0.664)#17 | 1.31%(-0.268)#3,927 |
| 18. | Stoneham | 1.00% | 0.38%(+0.623)#18 | 1.31%(-0.310)#4,066 |
| 19. | South Lancaster | 0.91% | 0.38%(+0.536)#19 | 1.31%(-0.396)#4,364 |
| 20. | Brookline | 0.90% | 0.38%(+0.527)#20 | 1.31%(-0.406)#4,403 |
| 21. | Ipswich | 0.90% | 0.38%(+0.526)#21 | 1.31%(-0.407)#4,408 |
| 22. | Shelburne Falls | 0.88% | 0.38%(+0.506)#22 | 1.31%(-0.427)#4,467 |
| 23. | Braintree Town | 0.87% | 0.38%(+0.490)#23 | 1.31%(-0.443)#4,530 |
| 24. | Watertown Town | 0.84% | 0.38%(+0.461)#24 | 1.31%(-0.471)#4,643 |
| 25. | Belmont | 0.82% | 0.38%(+0.441)#25 | 1.31%(-0.491)#4,733 |
| 26. | Bellingham | 0.80% | 0.38%(+0.421)#26 | 1.31%(-0.512)#4,825 |
| 27. | Williamstown | 0.78% | 0.38%(+0.401)#27 | 1.31%(-0.532)#4,899 |
| 28. | Somerville | 0.77% | 0.38%(+0.397)#28 | 1.31%(-0.536)#4,911 |
| 29. | West Yarmouth | 0.77% | 0.38%(+0.393)#29 | 1.31%(-0.539)#4,926 |
| 30. | Wakefield | 0.75% | 0.38%(+0.369)#30 | 1.31%(-0.563)#5,035 |
| 31. | Newton | 0.74% | 0.38%(+0.362)#31 | 1.31%(-0.571)#5,067 |
| 32. | Malden | 0.73% | 0.38%(+0.353)#32 | 1.31%(-0.580)#5,106 |
| 33. | Milton | 0.69% | 0.38%(+0.312)#33 | 1.31%(-0.621)#5,322 |
| 34. | West Concord | 0.67% | 0.38%(+0.289)#34 | 1.31%(-0.643)#5,450 |
| 35. | Norwood | 0.64% | 0.38%(+0.264)#35 | 1.31%(-0.669)#5,556 |
| 36. | Marlborough | 0.63% | 0.38%(+0.256)#36 | 1.31%(-0.677)#5,595 |
| 37. | Turners Falls | 0.63% | 0.38%(+0.248)#37 | 1.31%(-0.685)#5,630 |
| 38. | Reading | 0.62% | 0.38%(+0.240)#38 | 1.31%(-0.692)#5,664 |
| 39. | Wellesley | 0.62% | 0.38%(+0.239)#39 | 1.31%(-0.694)#5,673 |
| 40. | Abington | 0.60% | 0.38%(+0.223)#40 | 1.31%(-0.710)#5,777 |
| 41. | Weymouth Town | 0.59% | 0.38%(+0.213)#41 | 1.31%(-0.720)#5,844 |
| 42. | Arlington | 0.58% | 0.38%(+0.202)#42 | 1.31%(-0.731)#5,906 |
| 43. | Leominster | 0.58% | 0.38%(+0.198)#43 | 1.31%(-0.735)#5,931 |
| 44. | Devens | 0.57% | 0.38%(+0.190)#44 | 1.31%(-0.743)#5,984 |
| 45. | Somerset | 0.56% | 0.38%(+0.181)#45 | 1.31%(-0.752)#6,039 |
| 46. | North Eastham | 0.56% | 0.38%(+0.181)#46 | 1.31%(-0.752)#6,041 |
| 47. | Burlington | 0.55% | 0.38%(+0.177)#47 | 1.31%(-0.756)#6,062 |
| 48. | Plymouth | 0.55% | 0.38%(+0.172)#48 | 1.31%(-0.761)#6,098 |
| 49. | Salem | 0.55% | 0.38%(+0.168)#49 | 1.31%(-0.764)#6,127 |
| 50. | Bridgewater Town | 0.53% | 0.38%(+0.155)#50 | 1.31%(-0.777)#6,201 |
| 51. | West Springfield Town | 0.53% | 0.38%(+0.155)#51 | 1.31%(-0.778)#6,204 |
| 52. | Beverly | 0.53% | 0.38%(+0.148)#52 | 1.31%(-0.784)#6,254 |
| 53. | New Bedford | 0.52% | 0.38%(+0.145)#53 | 1.31%(-0.787)#6,274 |
| 54. | Cambridge | 0.52% | 0.38%(+0.144)#54 | 1.31%(-0.789)#6,288 |
| 55. | Saugus | 0.52% | 0.38%(+0.141)#55 | 1.31%(-0.792)#6,314 |
| 56. | Boston | 0.51% | 0.38%(+0.136)#56 | 1.31%(-0.797)#6,346 |
| 57. | Medford | 0.50% | 0.38%(+0.126)#57 | 1.31%(-0.806)#6,415 |
| 58. | Amherst | 0.50% | 0.38%(+0.126)#58 | 1.31%(-0.807)#6,416 |
| 59. | Longmeadow | 0.49% | 0.38%(+0.117)#59 | 1.31%(-0.816)#6,470 |
| 60. | Danvers | 0.44% | 0.38%(+0.063)#60 | 1.31%(-0.869)#6,818 |
| 61. | Southbridge Town | 0.43% | 0.38%(+0.053)#61 | 1.31%(-0.880)#6,876 |
| 62. | Salisbury | 0.40% | 0.38%(+0.021)#62 | 1.31%(-0.911)#7,089 |
| 63. | Hanscom Afb | 0.39% | 0.38%(+0.015)#63 | 1.31%(-0.918)#7,129 |
| 64. | Revere | 0.38% | 0.38%(+0.007)#64 | 1.31%(-0.925)#7,197 |
| 65. | Milford | 0.38% | 0.38%(+0.007)#65 | 1.31%(-0.925)#7,198 |
| 66. | Fitchburg | 0.38% | 0.38%(+0.007)#66 | 1.31%(-0.926)#7,200 |
| 67. | Amesbury Town | 0.37% | 0.38%(-0.007)#67 | 1.31%(-0.940)#7,287 |
| 68. | Dover | 0.36% | 0.38%(-0.019)#68 | 1.31%(-0.952)#7,383 |
| 69. | Northampton | 0.36% | 0.38%(-0.020)#69 | 1.31%(-0.952)#7,390 |
| 70. | Framingham | 0.33% | 0.38%(-0.046)#70 | 1.31%(-0.979)#7,596 |
| 71. | Lynn | 0.32% | 0.38%(-0.053)#71 | 1.31%(-0.986)#7,656 |
| 72. | Gardner | 0.31% | 0.38%(-0.064)#72 | 1.31%(-0.997)#7,751 |
| 73. | Gloucester | 0.30% | 0.38%(-0.076)#73 | 1.31%(-1.01)#7,834 |
| 74. | North Scituate | 0.30% | 0.38%(-0.078)#74 | 1.31%(-1.01)#7,844 |
| 75. | Swampscott | 0.30% | 0.38%(-0.080)#75 | 1.31%(-1.01)#7,854 |
| 76. | Worcester | 0.30% | 0.38%(-0.082)#76 | 1.31%(-1.01)#7,873 |
| 77. | Provincetown | 0.29% | 0.38%(-0.086)#77 | 1.31%(-1.02)#7,913 |
| 78. | Marblehead | 0.29% | 0.38%(-0.092)#78 | 1.31%(-1.02)#7,968 |
| 79. | Walpole | 0.28% | 0.38%(-0.095)#79 | 1.31%(-1.03)#7,991 |
| 80. | Franklin Town | 0.27% | 0.38%(-0.106)#80 | 1.31%(-1.04)#8,088 |
| 81. | Waltham | 0.27% | 0.38%(-0.110)#81 | 1.31%(-1.04)#8,120 |
| 82. | Pittsfield | 0.27% | 0.38%(-0.112)#82 | 1.31%(-1.04)#8,139 |
| 83. | Winchester | 0.26% | 0.38%(-0.114)#83 | 1.31%(-1.05)#8,155 |
| 84. | Melrose | 0.26% | 0.38%(-0.116)#84 | 1.31%(-1.05)#8,166 |
| 85. | Lexington | 0.25% | 0.38%(-0.123)#85 | 1.31%(-1.06)#8,229 |
| 86. | Peabody | 0.25% | 0.38%(-0.128)#86 | 1.31%(-1.06)#8,266 |
| 87. | Methuen Town | 0.23% | 0.38%(-0.148)#87 | 1.31%(-1.08)#8,441 |
| 88. | Foxborough | 0.22% | 0.38%(-0.156)#88 | 1.31%(-1.09)#8,509 |
| 89. | Westfield | 0.22% | 0.38%(-0.159)#89 | 1.31%(-1.09)#8,543 |
| 90. | Attleboro | 0.20% | 0.38%(-0.173)#90 | 1.31%(-1.11)#8,646 |
| 91. | Clinton | 0.20% | 0.38%(-0.174)#91 | 1.31%(-1.11)#8,653 |
| 92. | Brockton | 0.18% | 0.38%(-0.193)#92 | 1.31%(-1.13)#8,819 |
| 93. | Maynard | 0.18% | 0.38%(-0.199)#93 | 1.31%(-1.13)#8,873 |
| 94. | Lowell | 0.17% | 0.38%(-0.208)#94 | 1.31%(-1.14)#8,938 |
| 95. | Easthampton Town | 0.16% | 0.38%(-0.216)#95 | 1.31%(-1.15)#8,999 |
| 96. | Holyoke | 0.16% | 0.38%(-0.218)#96 | 1.31%(-1.15)#9,015 |
| 97. | Haverhill | 0.16% | 0.38%(-0.221)#97 | 1.31%(-1.15)#9,047 |
| 98. | Wilmington | 0.15% | 0.38%(-0.226)#98 | 1.31%(-1.16)#9,092 |
| 99. | Webster | 0.15% | 0.38%(-0.231)#99 | 1.31%(-1.16)#9,134 |
| 100. | Chicopee | 0.14% | 0.38%(-0.235)#100 | 1.31%(-1.17)#9,175 |
Common Questions
What are the Top 10 Cities with the Highest Percentage of Korean Population in Massachusetts?
Top 10 Cities with the Highest Percentage of Korean Population in Massachusetts are:
#1
2.60%
#2
2.47%
#3
2.44%
#4
2.13%
#5
1.98%
#6
1.83%
#7
1.61%
#8
1.52%
#9
1.22%
#10
1.19%
What city has the Highest Percentage of Korean Population in Massachusetts?
Raynham Center has the Highest Percentage of Korean Population in Massachusetts with 2.60%.
What is the Percentage of Korean Population in the State of Massachusetts?
Percentage of Korean Population in Massachusetts is 0.38%.
What is the Percentage of Korean Population in the United States?
Percentage of Korean Population in the United States is 1.31%.