Cities with the Highest Percentage of Korean Population in Idaho
RELATED REPORTS & OPTIONS
Korean
Idaho
Compare Cities
Map of Cities with the Highest Percentage of Korean Population in Idaho
0.00%
10.00%
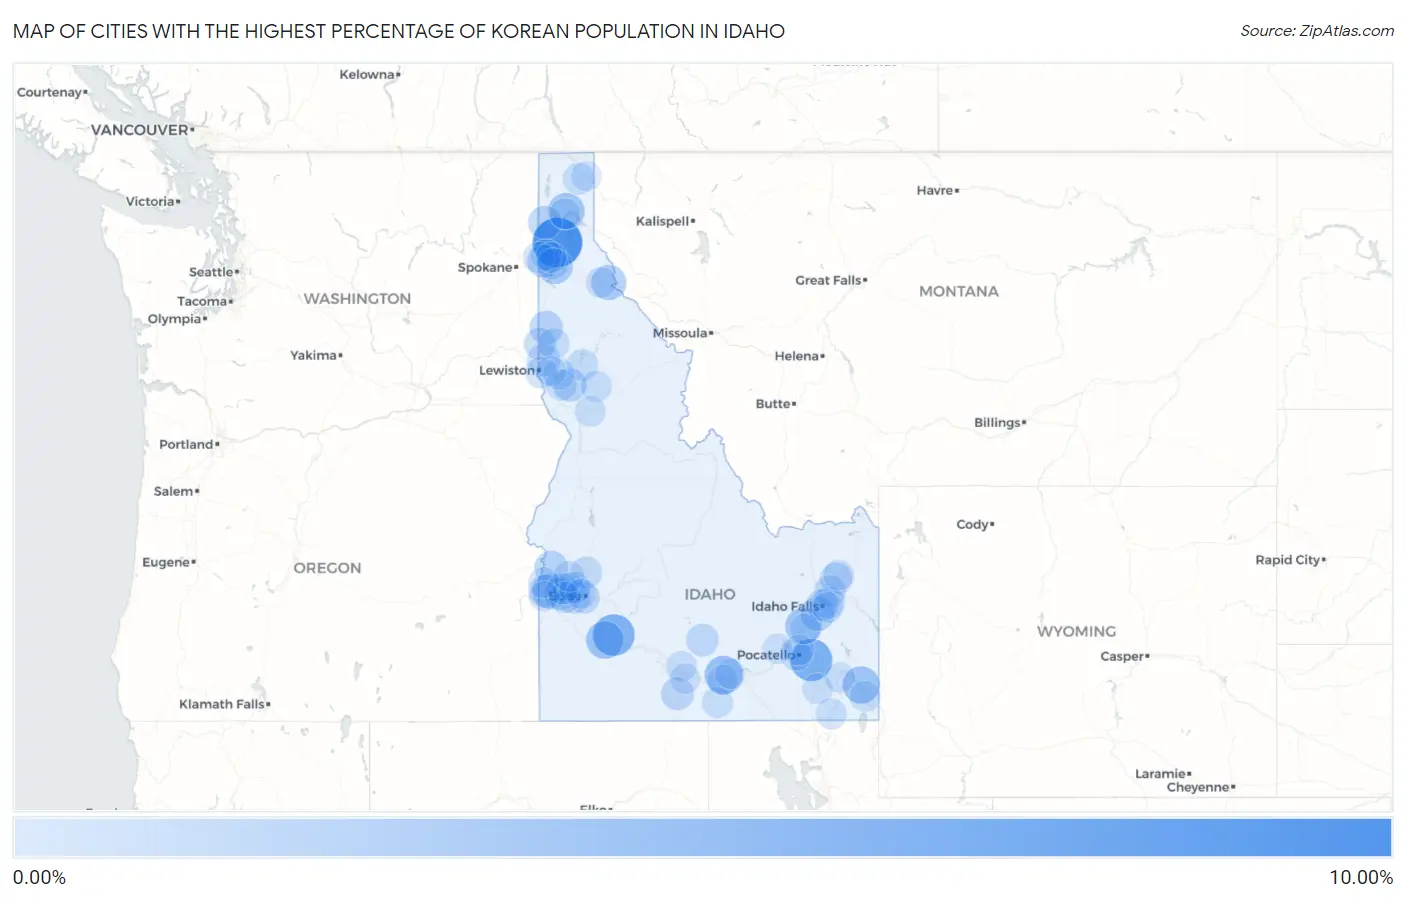
Cities with the Highest Percentage of Korean Population in Idaho
| City | Korean | vs State | vs National | |
| 1. | Athol | 8.23% | 0.57%(+7.66)#1 | 1.31%(+6.92)#342 |
| 2. | Inkom | 5.03% | 0.57%(+4.46)#2 | 1.31%(+3.72)#690 |
| 3. | Mountain Home | 4.82% | 0.57%(+4.24)#3 | 1.31%(+3.51)#735 |
| 4. | Paul | 3.30% | 0.57%(+2.73)#4 | 1.31%(+1.99)#1,197 |
| 5. | Mountain Home Afb | 3.08% | 0.57%(+2.51)#5 | 1.31%(+1.77)#1,292 |
| 6. | Georgetown | 2.91% | 0.57%(+2.33)#6 | 1.31%(+1.60)#1,388 |
| 7. | Groveland | 2.69% | 0.57%(+2.12)#7 | 1.31%(+1.38)#1,534 |
| 8. | Ponderay | 2.65% | 0.57%(+2.08)#8 | 1.31%(+1.34)#1,550 |
| 9. | Fernan Lake Village | 2.22% | 0.57%(+1.65)#9 | 1.31%(+0.912)#1,875 |
| 10. | Greenleaf | 2.11% | 0.57%(+1.54)#10 | 1.31%(+0.801)#1,989 |
| 11. | Mullan | 2.02% | 0.57%(+1.45)#11 | 1.31%(+0.713)#2,077 |
| 12. | Shelley | 1.70% | 0.57%(+1.13)#12 | 1.31%(+0.392)#2,506 |
| 13. | Craigmont | 1.40% | 0.57%(+0.825)#13 | 1.31%(+0.087)#3,075 |
| 14. | Priest River | 1.38% | 0.57%(+0.810)#14 | 1.31%(+0.073)#3,104 |
| 15. | Onaway | 1.35% | 0.57%(+0.773)#15 | 1.31%(+0.035)#3,192 |
| 16. | New Plymouth | 1.34% | 0.57%(+0.765)#16 | 1.31%(+0.027)#3,210 |
| 17. | Post Falls | 1.24% | 0.57%(+0.665)#17 | 1.31%(-0.073)#3,426 |
| 18. | Hammett | 1.19% | 0.57%(+0.613)#18 | 1.31%(-0.124)#3,539 |
| 19. | Hollister | 1.06% | 0.57%(+0.491)#19 | 1.31%(-0.246)#3,865 |
| 20. | Meridian | 1.03% | 0.57%(+0.460)#20 | 1.31%(-0.278)#3,962 |
| 21. | Wilder | 1.02% | 0.57%(+0.444)#21 | 1.31%(-0.293)#4,008 |
| 22. | Genesee | 0.99% | 0.57%(+0.420)#22 | 1.31%(-0.317)#4,092 |
| 23. | Caldwell | 0.98% | 0.57%(+0.411)#23 | 1.31%(-0.326)#4,122 |
| 24. | Richfield | 0.98% | 0.57%(+0.410)#24 | 1.31%(-0.328)#4,124 |
| 25. | Rexburg | 0.89% | 0.57%(+0.317)#25 | 1.31%(-0.421)#4,449 |
| 26. | Boise City | 0.86% | 0.57%(+0.287)#26 | 1.31%(-0.451)#4,566 |
| 27. | Moscow | 0.81% | 0.57%(+0.236)#27 | 1.31%(-0.502)#4,782 |
| 28. | Rigby | 0.77% | 0.57%(+0.193)#28 | 1.31%(-0.545)#4,953 |
| 29. | Iona | 0.76% | 0.57%(+0.192)#29 | 1.31%(-0.545)#4,956 |
| 30. | Horseshoe Bend | 0.76% | 0.57%(+0.183)#30 | 1.31%(-0.554)#4,999 |
| 31. | Idaho Falls | 0.68% | 0.57%(+0.107)#31 | 1.31%(-0.631)#5,379 |
| 32. | Star | 0.65% | 0.57%(+0.079)#32 | 1.31%(-0.658)#5,507 |
| 33. | Eagle | 0.61% | 0.57%(+0.041)#33 | 1.31%(-0.696)#5,695 |
| 34. | Lewiston | 0.60% | 0.57%(+0.032)#34 | 1.31%(-0.706)#5,748 |
| 35. | Bonners Ferry | 0.59% | 0.57%(+0.014)#35 | 1.31%(-0.724)#5,868 |
| 36. | Orofino | 0.58% | 0.57%(+0.012)#36 | 1.31%(-0.726)#5,882 |
| 37. | Nampa | 0.57% | 0.57%(-0.000)#37 | 1.31%(-0.738)#5,949 |
| 38. | Middleton | 0.57% | 0.57%(-0.000)#38 | 1.31%(-0.738)#5,951 |
| 39. | Hauser | 0.53% | 0.57%(-0.038)#39 | 1.31%(-0.775)#6,194 |
| 40. | Coeur D Alene | 0.53% | 0.57%(-0.041)#40 | 1.31%(-0.779)#6,213 |
| 41. | Troy | 0.53% | 0.57%(-0.043)#41 | 1.31%(-0.781)#6,230 |
| 42. | Rathdrum | 0.51% | 0.57%(-0.060)#42 | 1.31%(-0.797)#6,349 |
| 43. | Culdesac | 0.51% | 0.57%(-0.062)#43 | 1.31%(-0.800)#6,368 |
| 44. | Pocatello | 0.48% | 0.57%(-0.097)#44 | 1.31%(-0.835)#6,605 |
| 45. | Kamiah | 0.41% | 0.57%(-0.159)#45 | 1.31%(-0.897)#6,995 |
| 46. | Winchester | 0.38% | 0.57%(-0.192)#46 | 1.31%(-0.930)#7,223 |
| 47. | Oakley | 0.38% | 0.57%(-0.195)#47 | 1.31%(-0.933)#7,240 |
| 48. | Ammon | 0.36% | 0.57%(-0.215)#48 | 1.31%(-0.953)#7,395 |
| 49. | Preston | 0.32% | 0.57%(-0.255)#49 | 1.31%(-0.992)#7,706 |
| 50. | Emmett | 0.31% | 0.57%(-0.260)#50 | 1.31%(-0.998)#7,760 |
| 51. | Montpelier | 0.30% | 0.57%(-0.270)#51 | 1.31%(-1.01)#7,831 |
| 52. | Grangeville | 0.30% | 0.57%(-0.276)#52 | 1.31%(-1.01)#7,859 |
| 53. | Jerome | 0.29% | 0.57%(-0.284)#53 | 1.31%(-1.02)#7,938 |
| 54. | Sandpoint | 0.28% | 0.57%(-0.291)#54 | 1.31%(-1.03)#8,005 |
| 55. | Wallace | 0.28% | 0.57%(-0.295)#55 | 1.31%(-1.03)#8,040 |
| 56. | Parma | 0.26% | 0.57%(-0.314)#56 | 1.31%(-1.05)#8,193 |
| 57. | Hayden | 0.25% | 0.57%(-0.318)#57 | 1.31%(-1.06)#8,223 |
| 58. | Downey | 0.25% | 0.57%(-0.324)#58 | 1.31%(-1.06)#8,280 |
| 59. | Chubbuck | 0.24% | 0.57%(-0.336)#59 | 1.31%(-1.07)#8,371 |
| 60. | Sugar City | 0.19% | 0.57%(-0.378)#60 | 1.31%(-1.12)#8,736 |
| 61. | Grace | 0.14% | 0.57%(-0.431)#61 | 1.31%(-1.17)#9,185 |
| 62. | Twin Falls | 0.14% | 0.57%(-0.437)#62 | 1.31%(-1.17)#9,239 |
| 63. | Blackfoot | 0.13% | 0.57%(-0.443)#63 | 1.31%(-1.18)#9,293 |
| 64. | Aberdeen | 0.11% | 0.57%(-0.457)#64 | 1.31%(-1.20)#9,435 |
| 65. | Burley | 0.11% | 0.57%(-0.459)#65 | 1.31%(-1.20)#9,453 |
| 66. | Rupert | 0.099% | 0.57%(-0.473)#66 | 1.31%(-1.21)#9,552 |
| 67. | Moyie Springs | 0.077% | 0.57%(-0.495)#67 | 1.31%(-1.23)#9,709 |
| 68. | Lapwai | 0.076% | 0.57%(-0.496)#68 | 1.31%(-1.23)#9,715 |
| 69. | Homedale | 0.034% | 0.57%(-0.538)#69 | 1.31%(-1.28)#9,933 |
| 70. | Garden City | 0.033% | 0.57%(-0.540)#70 | 1.31%(-1.28)#9,940 |
1
2Common Questions
What are the Top 10 Cities with the Highest Percentage of Korean Population in Idaho?
Top 10 Cities with the Highest Percentage of Korean Population in Idaho are:
#1
8.23%
#2
5.03%
#3
4.82%
#4
3.30%
#5
3.08%
#6
2.91%
#7
2.69%
#8
2.65%
#9
2.22%
#10
2.11%
What city has the Highest Percentage of Korean Population in Idaho?
Athol has the Highest Percentage of Korean Population in Idaho with 8.23%.
What is the Percentage of Korean Population in the State of Idaho?
Percentage of Korean Population in Idaho is 0.57%.
What is the Percentage of Korean Population in the United States?
Percentage of Korean Population in the United States is 1.31%.