Cities with the Highest Percentage of Korean Population in Kentucky
RELATED REPORTS & OPTIONS
Korean
Kentucky
Compare Cities
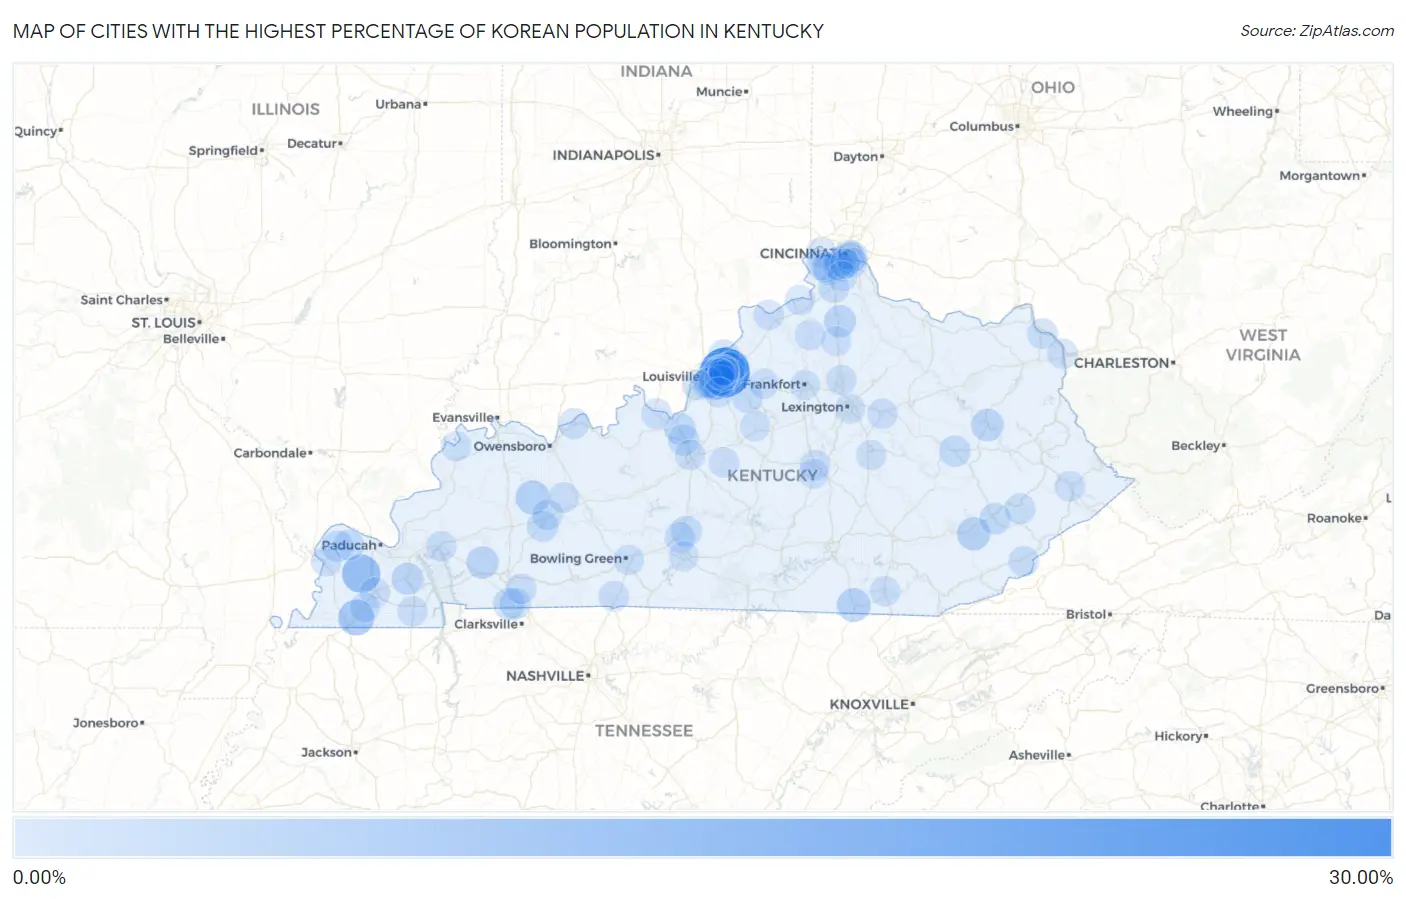
Map of Cities with the Highest Percentage of Korean Population in Kentucky
0.00%
30.00%
Cities with the Highest Percentage of Korean Population in Kentucky
| City | Korean | vs State | vs National | |
| 1. | Meadow Vale | 26.68% | 0.31%(+26.4)#1 | 1.31%(+25.4)#84 |
| 2. | Lowes | 11.04% | 0.31%(+10.7)#2 | 1.31%(+9.73)#245 |
| 3. | Meadowview Estates | 8.05% | 0.31%(+7.74)#3 | 1.31%(+6.74)#363 |
| 4. | Water Valley | 7.95% | 0.31%(+7.64)#4 | 1.31%(+6.64)#368 |
| 5. | Sacramento | 5.33% | 0.31%(+5.01)#5 | 1.31%(+4.02)#640 |
| 6. | Pine Knot | 4.86% | 0.31%(+4.54)#6 | 1.31%(+3.55)#727 |
| 7. | Hyden | 4.39% | 0.31%(+4.07)#7 | 1.31%(+3.08)#818 |
| 8. | Fincastle | 3.57% | 0.31%(+3.26)#8 | 1.31%(+2.26)#1,073 |
| 9. | West Liberty | 3.39% | 0.31%(+3.07)#9 | 1.31%(+2.08)#1,148 |
| 10. | Cerulean | 3.10% | 0.31%(+2.79)#10 | 1.31%(+1.79)#1,276 |
| 11. | Benton | 2.84% | 0.31%(+2.53)#11 | 1.31%(+1.53)#1,428 |
| 12. | Williamstown | 2.84% | 0.31%(+2.53)#12 | 1.31%(+1.53)#1,430 |
| 13. | Coldstream | 2.26% | 0.31%(+1.94)#13 | 1.31%(+0.946)#1,833 |
| 14. | Fort Campbell North | 2.12% | 0.31%(+1.81)#14 | 1.31%(+0.813)#1,967 |
| 15. | Campton | 2.11% | 0.31%(+1.80)#15 | 1.31%(+0.800)#1,991 |
| 16. | Fort Knox | 2.09% | 0.31%(+1.78)#16 | 1.31%(+0.781)#2,016 |
| 17. | La Center | 2.01% | 0.31%(+1.70)#17 | 1.31%(+0.699)#2,088 |
| 18. | Hazard | 1.94% | 0.31%(+1.63)#18 | 1.31%(+0.635)#2,156 |
| 19. | Glenview | 1.92% | 0.31%(+1.60)#19 | 1.31%(+0.606)#2,189 |
| 20. | Radcliff | 1.91% | 0.31%(+1.60)#20 | 1.31%(+0.600)#2,201 |
| 21. | Oak Grove | 1.85% | 0.31%(+1.54)#21 | 1.31%(+0.539)#2,289 |
| 22. | Greenville | 1.84% | 0.31%(+1.52)#22 | 1.31%(+0.527)#2,302 |
| 23. | Barbourmeade | 1.65% | 0.31%(+1.33)#23 | 1.31%(+0.339)#2,590 |
| 24. | Goshen | 1.54% | 0.31%(+1.23)#24 | 1.31%(+0.233)#2,790 |
| 25. | Horse Cave | 1.49% | 0.31%(+1.17)#25 | 1.31%(+0.177)#2,890 |
| 26. | Elk Creek | 1.48% | 0.31%(+1.17)#26 | 1.31%(+0.172)#2,907 |
| 27. | Glenview Manor | 1.46% | 0.31%(+1.14)#27 | 1.31%(+0.146)#2,956 |
| 28. | Southgate | 1.44% | 0.31%(+1.13)#28 | 1.31%(+0.131)#2,984 |
| 29. | Kevil | 1.42% | 0.31%(+1.11)#29 | 1.31%(+0.110)#3,037 |
| 30. | Cave City | 1.40% | 0.31%(+1.09)#30 | 1.31%(+0.094)#3,061 |
| 31. | Walton | 1.35% | 0.31%(+1.03)#31 | 1.31%(+0.037)#3,186 |
| 32. | St Matthews | 1.30% | 0.31%(+0.982)#32 | 1.31%(-0.014)#3,303 |
| 33. | Florence | 1.29% | 0.31%(+0.977)#33 | 1.31%(-0.018)#3,317 |
| 34. | Lewisport | 1.28% | 0.31%(+0.970)#34 | 1.31%(-0.026)#3,337 |
| 35. | Jeffersontown | 1.28% | 0.31%(+0.964)#35 | 1.31%(-0.032)#3,345 |
| 36. | Mockingbird Valley | 1.24% | 0.31%(+0.928)#36 | 1.31%(-0.068)#3,414 |
| 37. | West Buechel | 1.19% | 0.31%(+0.874)#37 | 1.31%(-0.122)#3,530 |
| 38. | Benham | 1.15% | 0.31%(+0.833)#38 | 1.31%(-0.162)#3,641 |
| 39. | Audubon Park | 1.13% | 0.31%(+0.819)#39 | 1.31%(-0.177)#3,668 |
| 40. | Hindman | 1.08% | 0.31%(+0.768)#40 | 1.31%(-0.228)#3,810 |
| 41. | Wurtland | 1.06% | 0.31%(+0.745)#41 | 1.31%(-0.251)#3,881 |
| 42. | Central City | 1.05% | 0.31%(+0.731)#42 | 1.31%(-0.265)#3,920 |
| 43. | Old Brownsboro Place | 1.04% | 0.31%(+0.728)#43 | 1.31%(-0.268)#3,931 |
| 44. | Crossgate | 1.02% | 0.31%(+0.706)#44 | 1.31%(-0.290)#3,993 |
| 45. | Windy Hills | 1.00% | 0.31%(+0.689)#45 | 1.31%(-0.307)#4,050 |
| 46. | Hurstbourne Acres | 1.00% | 0.31%(+0.686)#46 | 1.31%(-0.309)#4,064 |
| 47. | Lincolnshire | 0.95% | 0.31%(+0.638)#47 | 1.31%(-0.358)#4,222 |
| 48. | Franklin | 0.95% | 0.31%(+0.633)#48 | 1.31%(-0.363)#4,237 |
| 49. | Pikeville | 0.94% | 0.31%(+0.625)#49 | 1.31%(-0.371)#4,259 |
| 50. | Eddyville | 0.93% | 0.31%(+0.620)#50 | 1.31%(-0.376)#4,281 |
| 51. | Centertown | 0.92% | 0.31%(+0.603)#51 | 1.31%(-0.393)#4,347 |
| 52. | Elizabethtown | 0.92% | 0.31%(+0.602)#52 | 1.31%(-0.393)#4,351 |
| 53. | Danville | 0.90% | 0.31%(+0.582)#53 | 1.31%(-0.414)#4,430 |
| 54. | Prestonville | 0.87% | 0.31%(+0.555)#54 | 1.31%(-0.440)#4,522 |
| 55. | Winchester | 0.86% | 0.31%(+0.551)#55 | 1.31%(-0.445)#4,540 |
| 56. | Owenton | 0.85% | 0.31%(+0.540)#56 | 1.31%(-0.456)#4,578 |
| 57. | Murray | 0.84% | 0.31%(+0.530)#57 | 1.31%(-0.466)#4,618 |
| 58. | Westwood | 0.81% | 0.31%(+0.492)#58 | 1.31%(-0.504)#4,789 |
| 59. | Pembroke | 0.78% | 0.31%(+0.464)#59 | 1.31%(-0.532)#4,901 |
| 60. | New Haven | 0.76% | 0.31%(+0.446)#60 | 1.31%(-0.550)#4,973 |
| 61. | Catlettsburg | 0.73% | 0.31%(+0.415)#61 | 1.31%(-0.580)#5,113 |
| 62. | Shively | 0.72% | 0.31%(+0.410)#62 | 1.31%(-0.585)#5,142 |
| 63. | St Regis Park | 0.72% | 0.31%(+0.404)#63 | 1.31%(-0.592)#5,178 |
| 64. | Anchorage | 0.70% | 0.31%(+0.389)#64 | 1.31%(-0.607)#5,251 |
| 65. | Fort Thomas | 0.70% | 0.31%(+0.385)#65 | 1.31%(-0.611)#5,268 |
| 66. | Wickliffe | 0.69% | 0.31%(+0.374)#66 | 1.31%(-0.622)#5,329 |
| 67. | Williamsburg | 0.67% | 0.31%(+0.355)#67 | 1.31%(-0.641)#5,434 |
| 68. | Mayfield | 0.67% | 0.31%(+0.355)#68 | 1.31%(-0.641)#5,436 |
| 69. | Edgewood | 0.63% | 0.31%(+0.313)#69 | 1.31%(-0.683)#5,621 |
| 70. | Fort Mitchell | 0.62% | 0.31%(+0.309)#70 | 1.31%(-0.687)#5,642 |
| 71. | Brandenburg | 0.62% | 0.31%(+0.307)#71 | 1.31%(-0.688)#5,648 |
| 72. | Bowling Green | 0.60% | 0.31%(+0.290)#72 | 1.31%(-0.706)#5,750 |
| 73. | Warsaw | 0.60% | 0.31%(+0.282)#73 | 1.31%(-0.714)#5,801 |
| 74. | Shelbyville | 0.56% | 0.31%(+0.243)#74 | 1.31%(-0.753)#6,047 |
| 75. | Uniontown | 0.55% | 0.31%(+0.232)#75 | 1.31%(-0.764)#6,122 |
| 76. | Georgetown | 0.54% | 0.31%(+0.230)#76 | 1.31%(-0.766)#6,137 |
| 77. | Louisville | 0.52% | 0.31%(+0.201)#77 | 1.31%(-0.794)#6,326 |
| 78. | Bloomfield | 0.49% | 0.31%(+0.179)#78 | 1.31%(-0.816)#6,473 |
| 79. | Francisville | 0.49% | 0.31%(+0.174)#79 | 1.31%(-0.822)#6,504 |
| 80. | Crestwood | 0.49% | 0.31%(+0.172)#80 | 1.31%(-0.824)#6,522 |
| 81. | Glasgow | 0.48% | 0.31%(+0.164)#81 | 1.31%(-0.831)#6,582 |
| 82. | Lyndon | 0.46% | 0.31%(+0.150)#82 | 1.31%(-0.846)#6,685 |
| 83. | Erlanger | 0.45% | 0.31%(+0.140)#83 | 1.31%(-0.855)#6,745 |
| 84. | Richmond | 0.44% | 0.31%(+0.130)#84 | 1.31%(-0.866)#6,803 |
| 85. | Burlington | 0.43% | 0.31%(+0.113)#85 | 1.31%(-0.883)#6,898 |
| 86. | Bellemeade | 0.42% | 0.31%(+0.110)#86 | 1.31%(-0.886)#6,918 |
| 87. | Wingo | 0.42% | 0.31%(+0.104)#87 | 1.31%(-0.892)#6,962 |
| 88. | Newport | 0.42% | 0.31%(+0.102)#88 | 1.31%(-0.894)#6,978 |
| 89. | Oakbrook | 0.40% | 0.31%(+0.084)#89 | 1.31%(-0.912)#7,092 |
| 90. | Lexington | 0.37% | 0.31%(+0.058)#90 | 1.31%(-0.937)#7,267 |
| 91. | Manor Creek | 0.36% | 0.31%(+0.050)#91 | 1.31%(-0.946)#7,337 |
| 92. | Corinth | 0.36% | 0.31%(+0.047)#92 | 1.31%(-0.949)#7,361 |
| 93. | Highland Heights | 0.35% | 0.31%(+0.036)#93 | 1.31%(-0.960)#7,445 |
| 94. | Murray Hill | 0.34% | 0.31%(+0.028)#94 | 1.31%(-0.968)#7,516 |
| 95. | Frankfort | 0.33% | 0.31%(+0.016)#95 | 1.31%(-0.980)#7,604 |
| 96. | Independence | 0.33% | 0.31%(+0.013)#96 | 1.31%(-0.983)#7,626 |
| 97. | Covington | 0.32% | 0.31%(+0.011)#97 | 1.31%(-0.985)#7,641 |
| 98. | Junction City | 0.32% | 0.31%(+0.009)#98 | 1.31%(-0.987)#7,663 |
| 99. | Graymoor Devondale | 0.32% | 0.31%(+0.002)#99 | 1.31%(-0.994)#7,719 |
| 100. | Spring Mill | 0.31% | 0.31%(-0.006)#100 | 1.31%(-1.00)#7,789 |
Common Questions
What are the Top 10 Cities with the Highest Percentage of Korean Population in Kentucky?
Top 10 Cities with the Highest Percentage of Korean Population in Kentucky are:
#1
26.68%
#2
11.04%
#3
8.05%
#4
7.95%
#5
5.33%
#6
4.86%
#7
4.39%
#8
3.57%
#9
3.39%
#10
3.10%
What city has the Highest Percentage of Korean Population in Kentucky?
Meadow Vale has the Highest Percentage of Korean Population in Kentucky with 26.68%.
What is the Percentage of Korean Population in the State of Kentucky?
Percentage of Korean Population in Kentucky is 0.31%.
What is the Percentage of Korean Population in the United States?
Percentage of Korean Population in the United States is 1.31%.