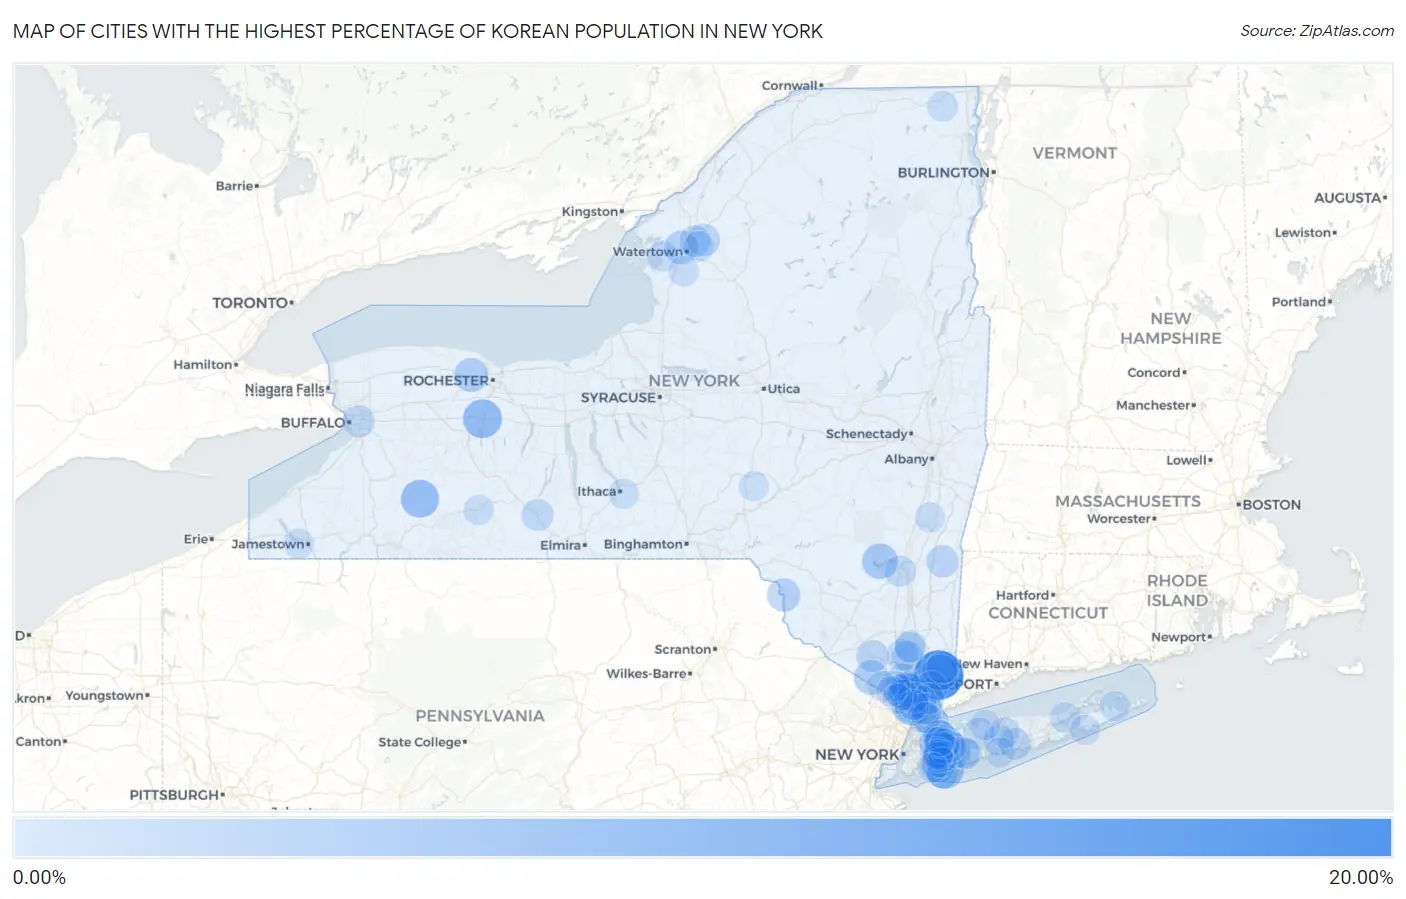
Cities with the Highest Percentage of Korean Population in New York
RELATED REPORTS & OPTIONS
Korean
New York
Compare Cities
Map of Cities with the Highest Percentage of Korean Population in New York
0.00%
20.00%
Cities with the Highest Percentage of Korean Population in New York
| City | Korean | vs State | vs National | |
| 1. | Bedford Hills | 15.76% | 0.80%(+15.0)#1 | 1.31%(+14.4)#165 |
| 2. | Hartwick Seminary | 12.71% | 0.80%(+11.9)#2 | 1.31%(+11.4)#211 |
| 3. | Albertson | 8.46% | 0.80%(+7.66)#3 | 1.31%(+7.15)#331 |
| 4. | East Avon | 7.92% | 0.80%(+7.12)#4 | 1.31%(+6.61)#369 |
| 5. | Sparkill | 7.29% | 0.80%(+6.49)#5 | 1.31%(+5.98)#410 |
| 6. | Rushford | 7.25% | 0.80%(+6.45)#6 | 1.31%(+5.94)#415 |
| 7. | Barnum Island | 7.14% | 0.80%(+6.34)#7 | 1.31%(+5.83)#426 |
| 8. | Valley Cottage | 6.13% | 0.80%(+5.33)#8 | 1.31%(+4.82)#514 |
| 9. | Katonah | 5.86% | 0.80%(+5.07)#9 | 1.31%(+4.55)#553 |
| 10. | Shokan | 5.56% | 0.80%(+4.77)#10 | 1.31%(+4.25)#603 |
| 11. | Bardonia | 5.17% | 0.80%(+4.37)#11 | 1.31%(+3.86)#661 |
| 12. | Hewlett | 5.14% | 0.80%(+4.34)#12 | 1.31%(+3.83)#668 |
| 13. | Congers | 5.11% | 0.80%(+4.31)#13 | 1.31%(+3.80)#672 |
| 14. | Greenwood Lake | 4.82% | 0.80%(+4.03)#14 | 1.31%(+3.51)#734 |
| 15. | Spencerport | 4.47% | 0.80%(+3.67)#15 | 1.31%(+3.16)#801 |
| 16. | Glen Park | 4.08% | 0.80%(+3.29)#16 | 1.31%(+2.77)#898 |
| 17. | Orangeburg | 4.00% | 0.80%(+3.21)#17 | 1.31%(+2.69)#921 |
| 18. | Callicoon | 4.00% | 0.80%(+3.20)#18 | 1.31%(+2.69)#924 |
| 19. | Bellerose | 3.90% | 0.80%(+3.11)#19 | 1.31%(+2.59)#955 |
| 20. | Nassau Lake | 3.81% | 0.80%(+3.01)#20 | 1.31%(+2.50)#989 |
| 21. | Chappaqua | 3.70% | 0.80%(+2.90)#21 | 1.31%(+2.39)#1,025 |
| 22. | Larchmont | 3.57% | 0.80%(+2.77)#22 | 1.31%(+2.26)#1,072 |
| 23. | Hillcrest | 3.55% | 0.80%(+2.75)#23 | 1.31%(+2.24)#1,086 |
| 24. | Franklin Square | 3.53% | 0.80%(+2.74)#24 | 1.31%(+2.22)#1,094 |
| 25. | Tarrytown | 3.53% | 0.80%(+2.73)#25 | 1.31%(+2.22)#1,096 |
| 26. | Baxter Estates | 3.48% | 0.80%(+2.69)#26 | 1.31%(+2.17)#1,109 |
| 27. | Fort Drum | 3.46% | 0.80%(+2.66)#27 | 1.31%(+2.15)#1,120 |
| 28. | Port Washington | 3.40% | 0.80%(+2.60)#28 | 1.31%(+2.09)#1,144 |
| 29. | Chester | 3.37% | 0.80%(+2.57)#29 | 1.31%(+2.06)#1,162 |
| 30. | Thiells | 3.36% | 0.80%(+2.56)#30 | 1.31%(+2.05)#1,165 |
| 31. | Pine Plains | 3.32% | 0.80%(+2.52)#31 | 1.31%(+2.01)#1,178 |
| 32. | Valley Stream | 3.30% | 0.80%(+2.50)#32 | 1.31%(+1.99)#1,199 |
| 33. | Golden S Bridge | 3.15% | 0.80%(+2.35)#33 | 1.31%(+1.84)#1,250 |
| 34. | Long Beach | 3.12% | 0.80%(+2.32)#34 | 1.31%(+1.81)#1,267 |
| 35. | North Patchogue | 3.10% | 0.80%(+2.30)#35 | 1.31%(+1.79)#1,277 |
| 36. | Marist College | 3.02% | 0.80%(+2.22)#36 | 1.31%(+1.71)#1,319 |
| 37. | Manhasset Hills | 3.00% | 0.80%(+2.20)#37 | 1.31%(+1.69)#1,326 |
| 38. | Savona | 2.97% | 0.80%(+2.17)#38 | 1.31%(+1.66)#1,346 |
| 39. | Tuckahoe | 2.96% | 0.80%(+2.16)#39 | 1.31%(+1.65)#1,352 |
| 40. | New City | 2.94% | 0.80%(+2.15)#40 | 1.31%(+1.63)#1,362 |
| 41. | Sloan | 2.92% | 0.80%(+2.13)#41 | 1.31%(+1.61)#1,373 |
| 42. | Calcium | 2.90% | 0.80%(+2.10)#42 | 1.31%(+1.59)#1,390 |
| 43. | Rochester Institute Of Technology | 2.90% | 0.80%(+2.10)#43 | 1.31%(+1.59)#1,391 |
| 44. | Hartsdale | 2.89% | 0.80%(+2.09)#44 | 1.31%(+1.58)#1,397 |
| 45. | West Point | 2.88% | 0.80%(+2.08)#45 | 1.31%(+1.57)#1,409 |
| 46. | Plandome | 2.86% | 0.80%(+2.06)#46 | 1.31%(+1.55)#1,421 |
| 47. | Salisbury | 2.85% | 0.80%(+2.06)#47 | 1.31%(+1.54)#1,423 |
| 48. | Great Neck Plaza | 2.79% | 0.80%(+2.00)#48 | 1.31%(+1.48)#1,462 |
| 49. | Elwood | 2.74% | 0.80%(+1.94)#49 | 1.31%(+1.43)#1,494 |
| 50. | Nelsonville | 2.67% | 0.80%(+1.87)#50 | 1.31%(+1.36)#1,537 |
| 51. | East Meadow | 2.66% | 0.80%(+1.86)#51 | 1.31%(+1.35)#1,544 |
| 52. | Hillside | 2.65% | 0.80%(+1.85)#52 | 1.31%(+1.34)#1,548 |
| 53. | Plainedge | 2.63% | 0.80%(+1.83)#53 | 1.31%(+1.32)#1,568 |
| 54. | Ardsley | 2.59% | 0.80%(+1.80)#54 | 1.31%(+1.28)#1,592 |
| 55. | Highland Falls | 2.58% | 0.80%(+1.78)#55 | 1.31%(+1.27)#1,601 |
| 56. | Mineola | 2.50% | 0.80%(+1.70)#56 | 1.31%(+1.19)#1,644 |
| 57. | Islandia | 2.49% | 0.80%(+1.70)#57 | 1.31%(+1.18)#1,648 |
| 58. | Valhalla | 2.49% | 0.80%(+1.69)#58 | 1.31%(+1.18)#1,652 |
| 59. | Cold Spring | 2.39% | 0.80%(+1.59)#59 | 1.31%(+1.08)#1,723 |
| 60. | South Farmingdale | 2.35% | 0.80%(+1.55)#60 | 1.31%(+1.04)#1,754 |
| 61. | Roessleville | 2.31% | 0.80%(+1.51)#61 | 1.31%(+0.995)#1,787 |
| 62. | Tappan | 2.29% | 0.80%(+1.50)#62 | 1.31%(+0.985)#1,803 |
| 63. | Varna | 2.29% | 0.80%(+1.49)#63 | 1.31%(+0.979)#1,808 |
| 64. | Sackets Harbor | 2.29% | 0.80%(+1.49)#64 | 1.31%(+0.976)#1,813 |
| 65. | Westbury | 2.25% | 0.80%(+1.45)#65 | 1.31%(+0.939)#1,840 |
| 66. | Latham | 2.23% | 0.80%(+1.43)#66 | 1.31%(+0.916)#1,869 |
| 67. | Williston Park | 2.19% | 0.80%(+1.39)#67 | 1.31%(+0.877)#1,903 |
| 68. | Nyack | 2.15% | 0.80%(+1.36)#68 | 1.31%(+0.844)#1,935 |
| 69. | Jamesport | 2.14% | 0.80%(+1.34)#69 | 1.31%(+0.832)#1,943 |
| 70. | Altona | 2.13% | 0.80%(+1.33)#70 | 1.31%(+0.821)#1,953 |
| 71. | Floral Park | 2.10% | 0.80%(+1.30)#71 | 1.31%(+0.785)#2,011 |
| 72. | South Floral Park | 2.07% | 0.80%(+1.28)#72 | 1.31%(+0.765)#2,026 |
| 73. | Rodman | 2.07% | 0.80%(+1.27)#73 | 1.31%(+0.763)#2,029 |
| 74. | Eastchester | 2.05% | 0.80%(+1.25)#74 | 1.31%(+0.740)#2,049 |
| 75. | West Hempstead | 2.04% | 0.80%(+1.24)#75 | 1.31%(+0.725)#2,064 |
| 76. | Lake Grove | 2.02% | 0.80%(+1.23)#76 | 1.31%(+0.714)#2,073 |
| 77. | Fort Salonga | 2.02% | 0.80%(+1.23)#77 | 1.31%(+0.713)#2,076 |
| 78. | Nanuet | 2.02% | 0.80%(+1.22)#78 | 1.31%(+0.706)#2,084 |
| 79. | Unadilla Forks | 2.01% | 0.80%(+1.21)#79 | 1.31%(+0.700)#2,087 |
| 80. | Manhasset | 1.99% | 0.80%(+1.20)#80 | 1.31%(+0.685)#2,103 |
| 81. | Piermont | 1.99% | 0.80%(+1.20)#81 | 1.31%(+0.684)#2,104 |
| 82. | Black River | 1.99% | 0.80%(+1.19)#82 | 1.31%(+0.678)#2,108 |
| 83. | Springs | 1.98% | 0.80%(+1.18)#83 | 1.31%(+0.666)#2,122 |
| 84. | North Valley Stream | 1.96% | 0.80%(+1.16)#84 | 1.31%(+0.652)#2,141 |
| 85. | Lakewood | 1.94% | 0.80%(+1.14)#85 | 1.31%(+0.632)#2,157 |
| 86. | Roslyn Heights | 1.94% | 0.80%(+1.14)#86 | 1.31%(+0.628)#2,162 |
| 87. | Wesley Hills | 1.93% | 0.80%(+1.13)#87 | 1.31%(+0.617)#2,177 |
| 88. | Southampton | 1.92% | 0.80%(+1.12)#88 | 1.31%(+0.609)#2,187 |
| 89. | Almond | 1.91% | 0.80%(+1.12)#89 | 1.31%(+0.604)#2,194 |
| 90. | Sloatsburg | 1.91% | 0.80%(+1.11)#90 | 1.31%(+0.599)#2,205 |
| 91. | Elmont | 1.88% | 0.80%(+1.08)#91 | 1.31%(+0.570)#2,235 |
| 92. | East Ithaca | 1.87% | 0.80%(+1.08)#92 | 1.31%(+0.564)#2,246 |
| 93. | Lynbrook | 1.87% | 0.80%(+1.07)#93 | 1.31%(+0.557)#2,259 |
| 94. | Great River | 1.86% | 0.80%(+1.06)#94 | 1.31%(+0.547)#2,277 |
| 95. | Lorenz Park | 1.85% | 0.80%(+1.05)#95 | 1.31%(+0.537)#2,290 |
| 96. | Munsey Park | 1.79% | 0.80%(+0.993)#96 | 1.31%(+0.481)#2,365 |
| 97. | Chestnut Ridge | 1.79% | 0.80%(+0.991)#97 | 1.31%(+0.479)#2,369 |
| 98. | Gilbertsville | 1.78% | 0.80%(+0.982)#98 | 1.31%(+0.470)#2,380 |
| 99. | Montebello | 1.77% | 0.80%(+0.967)#99 | 1.31%(+0.455)#2,406 |
| 100. | Inwood | 1.73% | 0.80%(+0.932)#100 | 1.31%(+0.420)#2,462 |
Common Questions
What are the Top 10 Cities with the Highest Percentage of Korean Population in New York?
Top 10 Cities with the Highest Percentage of Korean Population in New York are:
#1
15.76%
#2
8.46%
#3
7.92%
#4
7.29%
#5
7.25%
#6
7.14%
#7
6.13%
#8
5.86%
#9
5.56%
#10
5.17%
What city has the Highest Percentage of Korean Population in New York?
Bedford Hills has the Highest Percentage of Korean Population in New York with 15.76%.
What is the Percentage of Korean Population in the State of New York?
Percentage of Korean Population in New York is 0.80%.
What is the Percentage of Korean Population in the United States?
Percentage of Korean Population in the United States is 1.31%.