Cities with the Highest Percentage of Korean Population in Virginia
RELATED REPORTS & OPTIONS
Korean
Virginia
Compare Cities
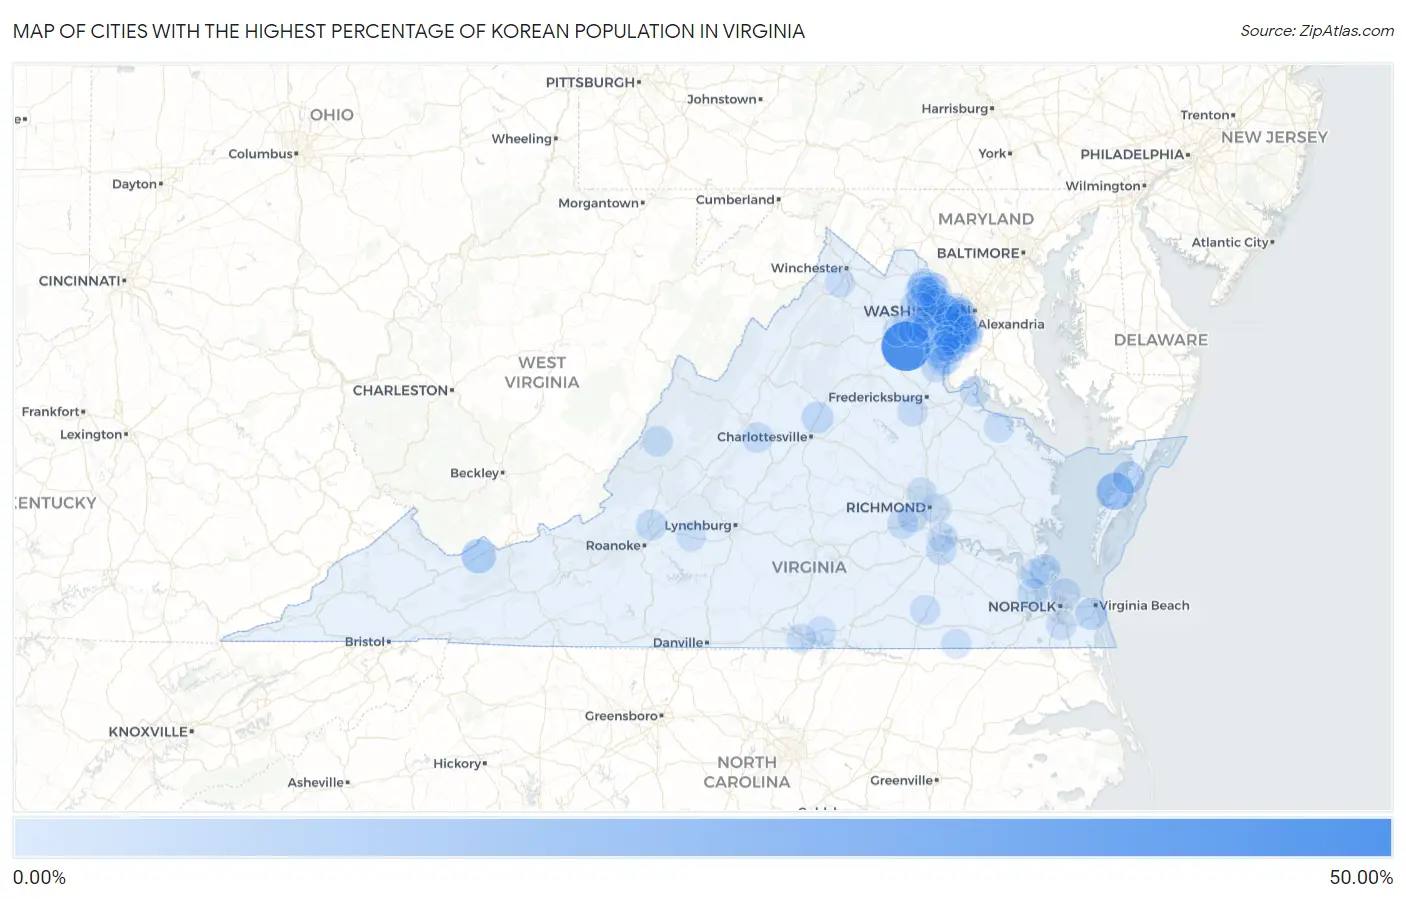
Map of Cities with the Highest Percentage of Korean Population in Virginia
0.00%
50.00%
Cities with the Highest Percentage of Korean Population in Virginia
| City | Korean | vs State | vs National | |
| 1. | Catlett | 48.95% | 1.39%(+47.6)#1 | 1.31%(+47.6)#28 |
| 2. | Bobtown | 18.69% | 1.39%(+17.3)#2 | 1.31%(+17.4)#135 |
| 3. | Springville | 11.70% | 1.39%(+10.3)#3 | 1.31%(+10.4)#225 |
| 4. | Woodburn | 8.02% | 1.39%(+6.63)#4 | 1.31%(+6.71)#366 |
| 5. | Greenbush | 7.38% | 1.39%(+5.99)#5 | 1.31%(+6.07)#401 |
| 6. | South Run | 6.44% | 1.39%(+5.05)#6 | 1.31%(+5.13)#482 |
| 7. | Stone Ridge | 6.39% | 1.39%(+5.00)#7 | 1.31%(+5.08)#488 |
| 8. | Virginia Beach | 5.93% | 1.39%(+4.54)#8 | 1.31%(+4.62)#543 |
| 9. | Laurel Hill | 5.85% | 1.39%(+4.46)#9 | 1.31%(+4.54)#558 |
| 10. | Piney Mountain | 5.59% | 1.39%(+4.20)#10 | 1.31%(+4.28)#599 |
| 11. | Franconia | 5.26% | 1.39%(+3.86)#11 | 1.31%(+3.95)#650 |
| 12. | Pimmit Hills | 5.05% | 1.39%(+3.66)#12 | 1.31%(+3.74)#684 |
| 13. | One Loudoun | 4.93% | 1.39%(+3.54)#13 | 1.31%(+3.62)#709 |
| 14. | Lorton | 4.87% | 1.39%(+3.48)#14 | 1.31%(+3.56)#723 |
| 15. | Bethel Manor | 4.73% | 1.39%(+3.34)#15 | 1.31%(+3.42)#750 |
| 16. | Montclair | 4.71% | 1.39%(+3.32)#16 | 1.31%(+3.40)#755 |
| 17. | Newington Forest | 4.34% | 1.39%(+2.95)#17 | 1.31%(+3.03)#826 |
| 18. | The University Of Virginia's College At Wise | 4.15% | 1.39%(+2.76)#18 | 1.31%(+2.84)#881 |
| 19. | Goose Creek | 4.12% | 1.39%(+2.73)#19 | 1.31%(+2.81)#890 |
| 20. | Union Mill | 4.00% | 1.39%(+2.61)#20 | 1.31%(+2.69)#928 |
| 21. | Sully Square | 3.87% | 1.39%(+2.48)#21 | 1.31%(+2.56)#967 |
| 22. | Troutville | 3.85% | 1.39%(+2.46)#22 | 1.31%(+2.54)#972 |
| 23. | Springfield | 3.82% | 1.39%(+2.43)#23 | 1.31%(+2.51)#983 |
| 24. | Carrollton | 3.63% | 1.39%(+2.24)#24 | 1.31%(+2.32)#1,050 |
| 25. | Lansdowne | 3.52% | 1.39%(+2.13)#25 | 1.31%(+2.21)#1,099 |
| 26. | North Springfield | 3.50% | 1.39%(+2.11)#26 | 1.31%(+2.19)#1,108 |
| 27. | Spotsylvania Courthouse | 3.42% | 1.39%(+2.03)#27 | 1.31%(+2.11)#1,132 |
| 28. | Kingstowne | 3.37% | 1.39%(+1.98)#28 | 1.31%(+2.06)#1,156 |
| 29. | Newington | 3.36% | 1.39%(+1.96)#29 | 1.31%(+2.05)#1,167 |
| 30. | Dahlgren Center | 3.32% | 1.39%(+1.93)#30 | 1.31%(+2.01)#1,179 |
| 31. | Cherry Hill | 3.30% | 1.39%(+1.91)#31 | 1.31%(+1.99)#1,198 |
| 32. | Fair Lakes | 3.29% | 1.39%(+1.89)#32 | 1.31%(+1.98)#1,201 |
| 33. | Hayfield | 3.14% | 1.39%(+1.75)#33 | 1.31%(+1.83)#1,254 |
| 34. | Lyndhurst | 3.14% | 1.39%(+1.75)#34 | 1.31%(+1.83)#1,255 |
| 35. | Dunn Loring | 3.10% | 1.39%(+1.71)#35 | 1.31%(+1.79)#1,281 |
| 36. | Hot Springs | 3.08% | 1.39%(+1.69)#36 | 1.31%(+1.77)#1,293 |
| 37. | Kings Park West | 3.03% | 1.39%(+1.64)#37 | 1.31%(+1.72)#1,315 |
| 38. | Merrifield | 3.02% | 1.39%(+1.63)#38 | 1.31%(+1.71)#1,318 |
| 39. | Broadlands | 3.00% | 1.39%(+1.61)#39 | 1.31%(+1.69)#1,327 |
| 40. | Rio | 2.89% | 1.39%(+1.50)#40 | 1.31%(+1.58)#1,396 |
| 41. | Leesylvania | 2.88% | 1.39%(+1.49)#41 | 1.31%(+1.57)#1,413 |
| 42. | Fort Lee | 2.82% | 1.39%(+1.43)#42 | 1.31%(+1.51)#1,442 |
| 43. | Norfolk | 2.81% | 1.39%(+1.42)#43 | 1.31%(+1.50)#1,452 |
| 44. | Belmont | 2.78% | 1.39%(+1.39)#44 | 1.31%(+1.47)#1,466 |
| 45. | Woodlake | 2.76% | 1.39%(+1.37)#45 | 1.31%(+1.45)#1,482 |
| 46. | Fort Belvoir | 2.75% | 1.39%(+1.36)#46 | 1.31%(+1.44)#1,489 |
| 47. | Fairfax | 2.64% | 1.39%(+1.25)#47 | 1.31%(+1.33)#1,565 |
| 48. | Occoquan | 2.61% | 1.39%(+1.22)#48 | 1.31%(+1.30)#1,578 |
| 49. | Oak Grove | 2.61% | 1.39%(+1.22)#49 | 1.31%(+1.30)#1,582 |
| 50. | Cascades | 2.60% | 1.39%(+1.21)#50 | 1.31%(+1.29)#1,590 |
| 51. | Dale City | 2.55% | 1.39%(+1.16)#51 | 1.31%(+1.24)#1,620 |
| 52. | West Springfield | 2.55% | 1.39%(+1.16)#52 | 1.31%(+1.24)#1,621 |
| 53. | Countryside | 2.46% | 1.39%(+1.07)#53 | 1.31%(+1.15)#1,677 |
| 54. | Mount Vernon | 2.44% | 1.39%(+1.05)#54 | 1.31%(+1.13)#1,693 |
| 55. | Chesapeake | 2.33% | 1.39%(+0.939)#55 | 1.31%(+1.02)#1,773 |
| 56. | Boswell S Corner | 2.30% | 1.39%(+0.914)#56 | 1.31%(+0.995)#1,789 |
| 57. | Greenbriar | 2.29% | 1.39%(+0.900)#57 | 1.31%(+0.981)#1,806 |
| 58. | Braddock | 2.28% | 1.39%(+0.889)#58 | 1.31%(+0.970)#1,819 |
| 59. | Fair Oaks | 2.24% | 1.39%(+0.853)#59 | 1.31%(+0.933)#1,846 |
| 60. | Chantilly | 2.22% | 1.39%(+0.834)#60 | 1.31%(+0.914)#1,872 |
| 61. | Gainesville | 2.19% | 1.39%(+0.801)#61 | 1.31%(+0.882)#1,898 |
| 62. | Reston | 2.17% | 1.39%(+0.780)#62 | 1.31%(+0.860)#1,919 |
| 63. | Floris | 2.16% | 1.39%(+0.767)#63 | 1.31%(+0.847)#1,931 |
| 64. | Jarratt | 2.14% | 1.39%(+0.749)#64 | 1.31%(+0.829)#1,949 |
| 65. | Yorkshire | 2.13% | 1.39%(+0.740)#65 | 1.31%(+0.820)#1,956 |
| 66. | Woodbridge | 2.09% | 1.39%(+0.698)#66 | 1.31%(+0.778)#2,017 |
| 67. | Seven Corners | 2.08% | 1.39%(+0.688)#67 | 1.31%(+0.769)#2,024 |
| 68. | Centreville | 2.07% | 1.39%(+0.683)#68 | 1.31%(+0.764)#2,028 |
| 69. | Rose Hill Cdp Fairfax County | 2.07% | 1.39%(+0.680)#69 | 1.31%(+0.760)#2,030 |
| 70. | Manassas | 2.05% | 1.39%(+0.663)#70 | 1.31%(+0.743)#2,042 |
| 71. | Stephens City | 2.04% | 1.39%(+0.650)#71 | 1.31%(+0.731)#2,060 |
| 72. | Rockwood | 2.03% | 1.39%(+0.640)#72 | 1.31%(+0.721)#2,066 |
| 73. | Montrose | 2.02% | 1.39%(+0.630)#73 | 1.31%(+0.711)#2,078 |
| 74. | Camp Barrett | 1.99% | 1.39%(+0.602)#74 | 1.31%(+0.682)#2,105 |
| 75. | Mason Neck | 1.97% | 1.39%(+0.576)#75 | 1.31%(+0.657)#2,134 |
| 76. | Dulles Town Center | 1.94% | 1.39%(+0.547)#76 | 1.31%(+0.627)#2,163 |
| 77. | Annandale | 1.93% | 1.39%(+0.544)#77 | 1.31%(+0.625)#2,169 |
| 78. | Loudoun Valley Estates | 1.91% | 1.39%(+0.521)#78 | 1.31%(+0.602)#2,198 |
| 79. | Long Branch | 1.87% | 1.39%(+0.482)#79 | 1.31%(+0.563)#2,247 |
| 80. | Oakton | 1.87% | 1.39%(+0.479)#80 | 1.31%(+0.560)#2,252 |
| 81. | Boydton | 1.79% | 1.39%(+0.402)#81 | 1.31%(+0.482)#2,362 |
| 82. | Falls Church | 1.79% | 1.39%(+0.400)#82 | 1.31%(+0.481)#2,366 |
| 83. | Herndon | 1.77% | 1.39%(+0.380)#83 | 1.31%(+0.461)#2,397 |
| 84. | Lake Ridge | 1.74% | 1.39%(+0.351)#84 | 1.31%(+0.432)#2,444 |
| 85. | Bull Run | 1.74% | 1.39%(+0.348)#85 | 1.31%(+0.429)#2,449 |
| 86. | New Baltimore | 1.74% | 1.39%(+0.347)#86 | 1.31%(+0.427)#2,455 |
| 87. | Potomac Mills | 1.72% | 1.39%(+0.330)#87 | 1.31%(+0.410)#2,478 |
| 88. | Newport News | 1.72% | 1.39%(+0.326)#88 | 1.31%(+0.407)#2,483 |
| 89. | South Riding | 1.71% | 1.39%(+0.324)#89 | 1.31%(+0.405)#2,486 |
| 90. | Groveton | 1.71% | 1.39%(+0.320)#90 | 1.31%(+0.400)#2,492 |
| 91. | Crosspointe | 1.70% | 1.39%(+0.306)#91 | 1.31%(+0.387)#2,515 |
| 92. | Enon | 1.64% | 1.39%(+0.249)#92 | 1.31%(+0.329)#2,608 |
| 93. | Boykins | 1.64% | 1.39%(+0.246)#93 | 1.31%(+0.326)#2,614 |
| 94. | Montross | 1.63% | 1.39%(+0.240)#94 | 1.31%(+0.320)#2,631 |
| 95. | Laurel | 1.61% | 1.39%(+0.222)#95 | 1.31%(+0.303)#2,660 |
| 96. | Bedford | 1.59% | 1.39%(+0.197)#96 | 1.31%(+0.278)#2,695 |
| 97. | Ashburn | 1.56% | 1.39%(+0.173)#97 | 1.31%(+0.253)#2,744 |
| 98. | Triangle | 1.56% | 1.39%(+0.171)#98 | 1.31%(+0.252)#2,754 |
| 99. | Linton Hall | 1.55% | 1.39%(+0.155)#99 | 1.31%(+0.236)#2,783 |
| 100. | Clarksville | 1.53% | 1.39%(+0.144)#100 | 1.31%(+0.225)#2,801 |
Common Questions
What are the Top 10 Cities with the Highest Percentage of Korean Population in Virginia?
Top 10 Cities with the Highest Percentage of Korean Population in Virginia are:
#1
48.95%
#2
18.69%
#3
11.70%
#4
8.02%
#5
7.38%
#6
6.44%
#7
6.39%
#8
5.93%
#9
5.85%
#10
5.59%
What city has the Highest Percentage of Korean Population in Virginia?
Catlett has the Highest Percentage of Korean Population in Virginia with 48.95%.
What is the Percentage of Korean Population in the State of Virginia?
Percentage of Korean Population in Virginia is 1.39%.
What is the Percentage of Korean Population in the United States?
Percentage of Korean Population in the United States is 1.31%.