Lemoore, CA Map & Demographics
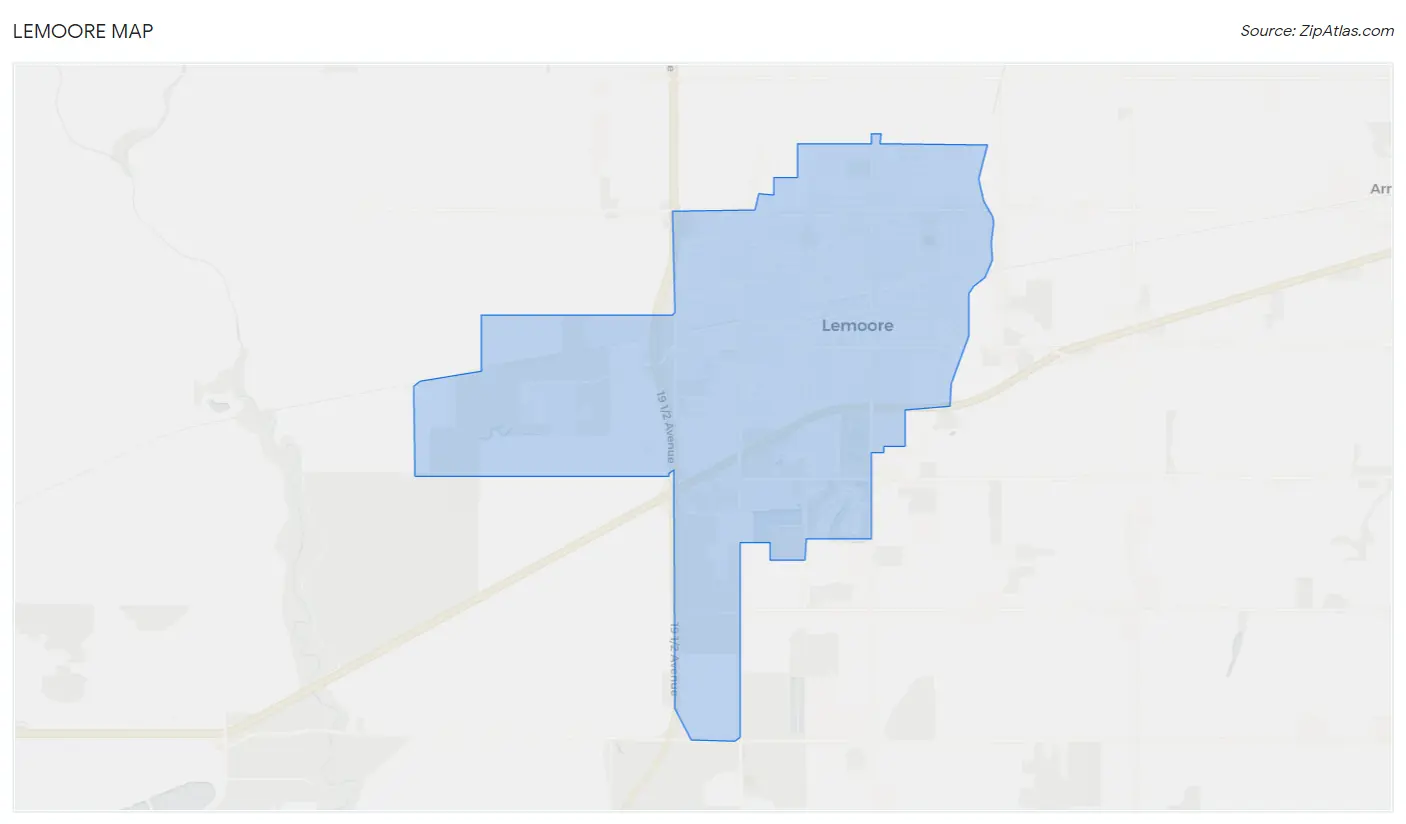
Lemoore Map
Lemoore Overview
$31,373
PER CAPITA INCOME
$77,663
AVG FAMILY INCOME
$78,366
AVG HOUSEHOLD INCOME
43.8%
WAGE / INCOME GAP [ % ]
56.2¢/ $1
WAGE / INCOME GAP [ $ ]
$14,197
FAMILY INCOME DEFICIT
0.39
INEQUALITY / GINI INDEX
26,955
TOTAL POPULATION
14,174
MALE POPULATION
12,781
FEMALE POPULATION
110.90
MALES / 100 FEMALES
90.17
FEMALES / 100 MALES
31.8
MEDIAN AGE
3.5
AVG FAMILY SIZE
3.1
AVG HOUSEHOLD SIZE
13,111
LABOR FORCE [ PEOPLE ]
63.2%
PERCENT IN LABOR FORCE
11.0%
UNEMPLOYMENT RATE
Lemoore Area Codes
Income in Lemoore
Income Overview in Lemoore
Per Capita Income in Lemoore is $31,373, while median incomes of families and households are $77,663 and $78,366 respectively.
| Characteristic | Number | Measure |
| Per Capita Income | 26,955 | $31,373 |
| Median Family Income | 6,432 | $77,663 |
| Mean Family Income | 6,432 | $89,508 |
| Median Household Income | 8,801 | $78,366 |
| Mean Household Income | 8,801 | $89,061 |
| Income Deficit | 6,432 | $14,197 |
| Wage / Income Gap (%) | 26,955 | 43.80% |
| Wage / Income Gap ($) | 26,955 | 56.20¢ per $1 |
| Gini / Inequality Index | 26,955 | 0.39 |
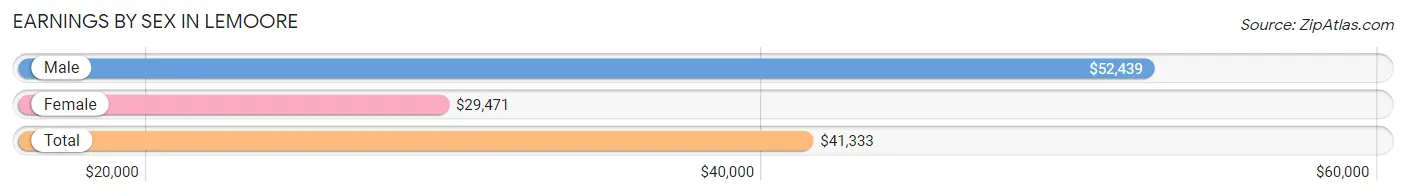
Earnings by Sex in Lemoore
Average Earnings in Lemoore are $41,333, $52,439 for men and $29,471 for women, a difference of 43.8%.
| Sex | Number | Average Earnings |
| Male | 7,555 (58.2%) | $52,439 |
| Female | 5,438 (41.8%) | $29,471 |
| Total | 12,993 (100.0%) | $41,333 |
Earnings by Sex by Income Bracket in Lemoore
The most common earnings brackets in Lemoore are $100,000+ for men (1,395 | 18.5%) and $30,000 to $34,999 for women (526 | 9.7%).
| Income | Male | Female |
| $2,499 or less | 98 (1.3%) | 204 (3.7%) |
| $2,500 to $4,999 | 190 (2.5%) | 255 (4.7%) |
| $5,000 to $7,499 | 75 (1.0%) | 337 (6.2%) |
| $7,500 to $9,999 | 68 (0.9%) | 202 (3.7%) |
| $10,000 to $12,499 | 55 (0.7%) | 191 (3.5%) |
| $12,500 to $14,999 | 281 (3.7%) | 261 (4.8%) |
| $15,000 to $17,499 | 125 (1.7%) | 153 (2.8%) |
| $17,500 to $19,999 | 167 (2.2%) | 201 (3.7%) |
| $20,000 to $22,499 | 533 (7.0%) | 297 (5.5%) |
| $22,500 to $24,999 | 149 (2.0%) | 390 (7.2%) |
| $25,000 to $29,999 | 260 (3.4%) | 264 (4.9%) |
| $30,000 to $34,999 | 287 (3.8%) | 526 (9.7%) |
| $35,000 to $39,999 | 431 (5.7%) | 271 (5.0%) |
| $40,000 to $44,999 | 441 (5.8%) | 258 (4.7%) |
| $45,000 to $49,999 | 357 (4.7%) | 188 (3.5%) |
| $50,000 to $54,999 | 360 (4.8%) | 303 (5.6%) |
| $55,000 to $64,999 | 692 (9.2%) | 300 (5.5%) |
| $65,000 to $74,999 | 613 (8.1%) | 193 (3.5%) |
| $75,000 to $99,999 | 978 (13.0%) | 350 (6.4%) |
| $100,000+ | 1,395 (18.5%) | 294 (5.4%) |
| Total | 7,555 (100.0%) | 5,438 (100.0%) |
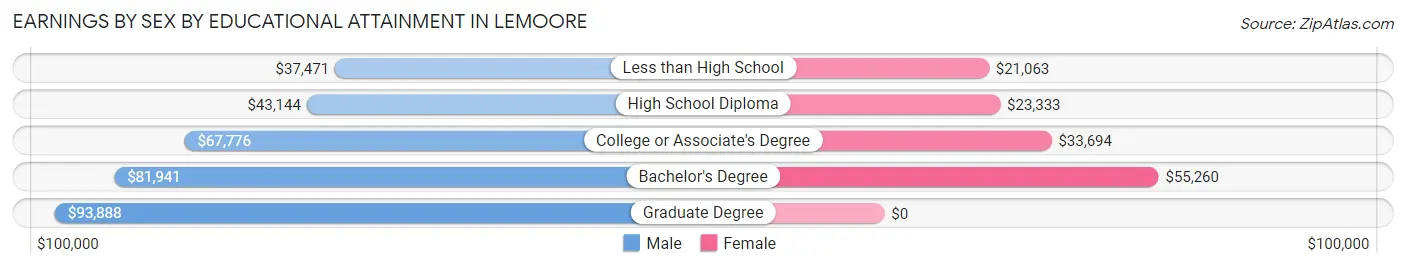
Earnings by Sex by Educational Attainment in Lemoore
Average earnings in Lemoore are $59,136 for men and $32,437 for women, a difference of 45.2%. Men with an educational attainment of graduate degree enjoy the highest average annual earnings of $93,888, while those with less than high school education earn the least with $37,471. Women with an educational attainment of bachelor's degree earn the most with the average annual earnings of $55,260, while those with less than high school education have the smallest earnings of $21,063.
| Educational Attainment | Male Income | Female Income |
| Less than High School | $37,471 | $21,063 |
| High School Diploma | $43,144 | $23,333 |
| College or Associate's Degree | $67,776 | $33,694 |
| Bachelor's Degree | $81,941 | $55,260 |
| Graduate Degree | $93,888 | $0 |
| Total | $59,136 | $32,437 |
Family Income in Lemoore
Family Income Brackets in Lemoore
According to the Lemoore family income data, there are 1,434 families falling into the $100,000 to $149,999 income range, which is the most common income bracket and makes up 22.3% of all families. Conversely, the $10,000 to $14,999 income bracket is the least frequent group with only 77 families (1.2%) belonging to this category.
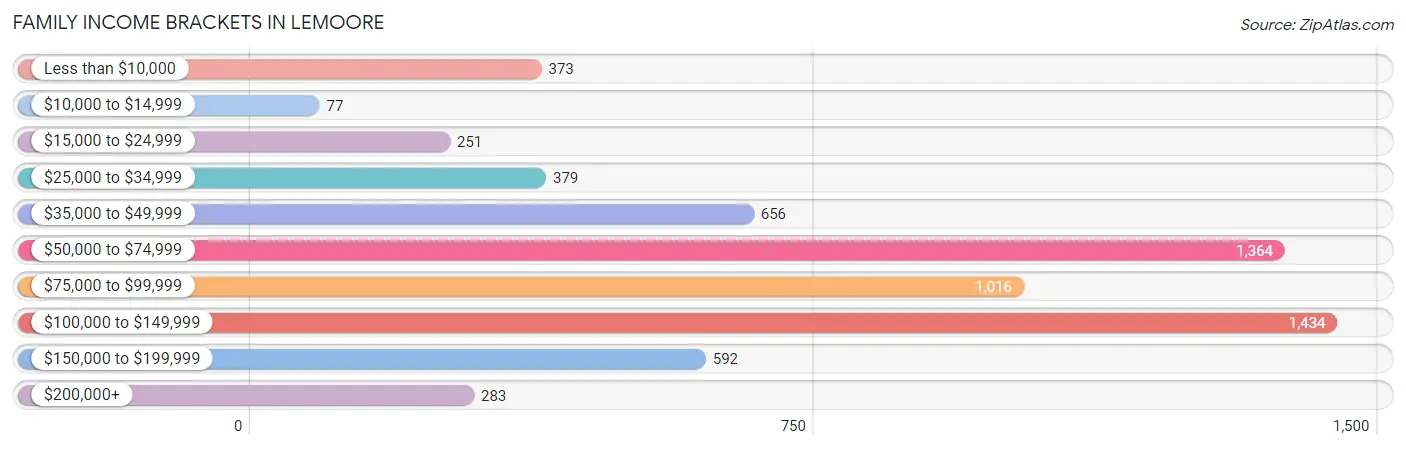
| Income Bracket | # Families | % Families |
| Less than $10,000 | 373 | 5.8% |
| $10,000 to $14,999 | 77 | 1.2% |
| $15,000 to $24,999 | 251 | 3.9% |
| $25,000 to $34,999 | 379 | 5.9% |
| $35,000 to $49,999 | 656 | 10.2% |
| $50,000 to $74,999 | 1,364 | 21.2% |
| $75,000 to $99,999 | 1,016 | 15.8% |
| $100,000 to $149,999 | 1,434 | 22.3% |
| $150,000 to $199,999 | 592 | 9.2% |
| $200,000+ | 283 | 4.4% |
Family Income by Famaliy Size in Lemoore
7+ person families (91 | 1.4%) account for the highest median family income in Lemoore with $155,625 per family, while 2-person families (2,533 | 39.4%) have the highest median income of $38,884 per family member.
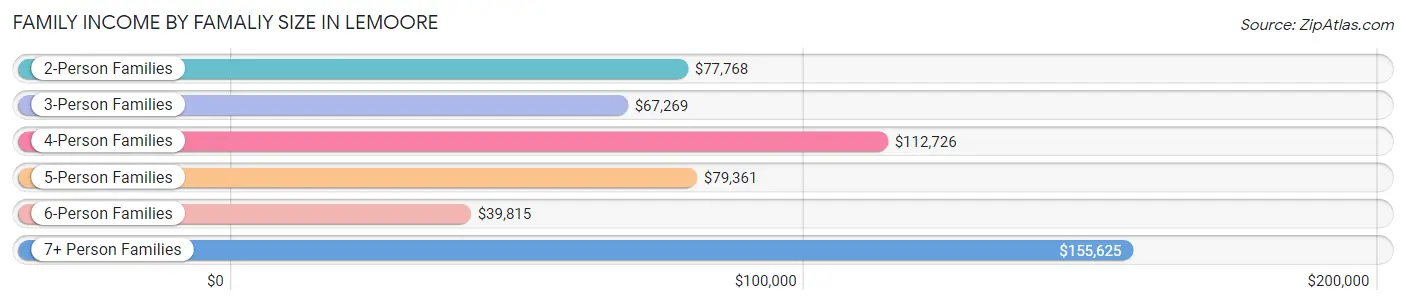
| Income Bracket | # Families | Median Income |
| 2-Person Families | 2,533 (39.4%) | $77,768 |
| 3-Person Families | 1,356 (21.1%) | $67,269 |
| 4-Person Families | 1,329 (20.7%) | $112,726 |
| 5-Person Families | 845 (13.1%) | $79,361 |
| 6-Person Families | 278 (4.3%) | $39,815 |
| 7+ Person Families | 91 (1.4%) | $155,625 |
| Total | 6,432 (100.0%) | $77,663 |
Family Income by Number of Earners in Lemoore
The median family income in Lemoore is $77,663, with families comprising 3+ earners (643) having the highest median family income of $140,947, while families with no earners (971) have the lowest median family income of $52,083, accounting for 10.0% and 15.1% of families, respectively.
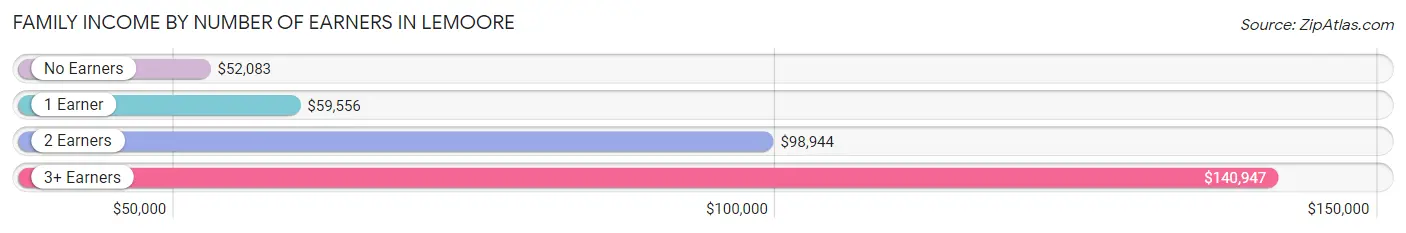
| Number of Earners | # Families | Median Income |
| No Earners | 971 (15.1%) | $52,083 |
| 1 Earner | 2,520 (39.2%) | $59,556 |
| 2 Earners | 2,298 (35.7%) | $98,944 |
| 3+ Earners | 643 (10.0%) | $140,947 |
| Total | 6,432 (100.0%) | $77,663 |
Household Income in Lemoore
Household Income Brackets in Lemoore
With 1,769 households falling in the category, the $100,000 to $149,999 income range is the most frequent in Lemoore, accounting for 20.1% of all households. In contrast, only 97 households (1.1%) fall into the $10,000 to $14,999 income bracket, making it the least populous group.
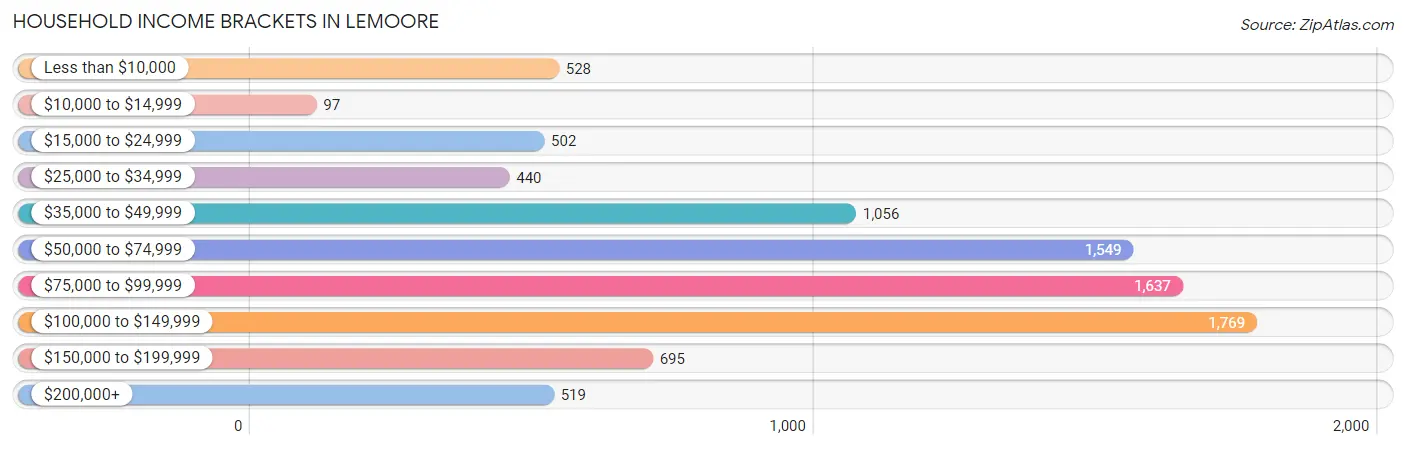
| Income Bracket | # Households | % Households |
| Less than $10,000 | 528 | 6.0% |
| $10,000 to $14,999 | 97 | 1.1% |
| $15,000 to $24,999 | 502 | 5.7% |
| $25,000 to $34,999 | 440 | 5.0% |
| $35,000 to $49,999 | 1,056 | 12.0% |
| $50,000 to $74,999 | 1,549 | 17.6% |
| $75,000 to $99,999 | 1,637 | 18.6% |
| $100,000 to $149,999 | 1,769 | 20.1% |
| $150,000 to $199,999 | 695 | 7.9% |
| $200,000+ | 519 | 5.9% |
Household Income by Householder Age in Lemoore
The median household income in Lemoore is $78,366, with the highest median household income of $112,803 found in the 45 to 64 years age bracket for the primary householder. A total of 2,715 households (30.8%) fall into this category. Meanwhile, the 15 to 24 years age bracket for the primary householder has the lowest median household income of $42,992, with 615 households (7.0%) in this group.
| Income Bracket | # Households | Median Income |
| 15 to 24 Years | 615 (7.0%) | $42,992 |
| 25 to 44 Years | 3,581 (40.7%) | $77,332 |
| 45 to 64 Years | 2,715 (30.8%) | $112,803 |
| 65+ Years | 1,890 (21.5%) | $52,874 |
| Total | 8,801 (100.0%) | $78,366 |
Poverty in Lemoore
Income Below Poverty by Sex and Age in Lemoore
With 13.6% poverty level for males and 16.5% for females among the residents of Lemoore, under 5 year old males and 16 and 17 year old females are the most vulnerable to poverty, with 372 males (31.2%) and 131 females (30.2%) in their respective age groups living below the poverty level.
| Age Bracket | Male | Female |
| Under 5 Years | 372 (31.2%) | 129 (12.3%) |
| 5 Years | 53 (16.4%) | 26 (19.7%) |
| 6 to 11 Years | 160 (15.2%) | 243 (25.4%) |
| 12 to 14 Years | 85 (19.5%) | 140 (21.3%) |
| 15 Years | 38 (21.6%) | 15 (7.5%) |
| 16 and 17 Years | 104 (26.3%) | 131 (30.2%) |
| 18 to 24 Years | 132 (10.9%) | 292 (16.9%) |
| 25 to 34 Years | 241 (8.3%) | 461 (20.3%) |
| 35 to 44 Years | 322 (15.2%) | 240 (17.9%) |
| 45 to 54 Years | 68 (3.4%) | 190 (15.1%) |
| 55 to 64 Years | 169 (16.0%) | 74 (6.1%) |
| 65 to 74 Years | 159 (21.0%) | 109 (10.6%) |
| 75 Years and over | 24 (4.6%) | 53 (10.2%) |
| Total | 1,927 (13.6%) | 2,103 (16.5%) |
Income Above Poverty by Sex and Age in Lemoore
According to the poverty statistics in Lemoore, males aged 45 to 54 years and females aged 55 to 64 years are the age groups that are most secure financially, with 96.6% of males and 93.9% of females in these age groups living above the poverty line.
| Age Bracket | Male | Female |
| Under 5 Years | 820 (68.8%) | 916 (87.7%) |
| 5 Years | 270 (83.6%) | 106 (80.3%) |
| 6 to 11 Years | 894 (84.8%) | 714 (74.6%) |
| 12 to 14 Years | 352 (80.5%) | 517 (78.7%) |
| 15 Years | 138 (78.4%) | 184 (92.5%) |
| 16 and 17 Years | 291 (73.7%) | 302 (69.8%) |
| 18 to 24 Years | 1,077 (89.1%) | 1,440 (83.1%) |
| 25 to 34 Years | 2,661 (91.7%) | 1,811 (79.7%) |
| 35 to 44 Years | 1,802 (84.8%) | 1,098 (82.1%) |
| 45 to 54 Years | 1,921 (96.6%) | 1,070 (84.9%) |
| 55 to 64 Years | 885 (84.0%) | 1,139 (93.9%) |
| 65 to 74 Years | 597 (79.0%) | 914 (89.3%) |
| 75 Years and over | 500 (95.4%) | 467 (89.8%) |
| Total | 12,208 (86.4%) | 10,678 (83.6%) |
Income Below Poverty Among Married-Couple Families in Lemoore
The poverty statistics for married-couple families in Lemoore show that 9.4% or 398 of the total 4,222 families live below the poverty line. Families with 3 or 4 children have the highest poverty rate of 26.7%, comprising of 170 families. On the other hand, families with no children have the lowest poverty rate of 2.8%, which includes 59 families.
| Children | Above Poverty | Below Poverty |
| No Children | 2,026 (97.2%) | 59 (2.8%) |
| 1 or 2 Children | 1,332 (88.7%) | 169 (11.3%) |
| 3 or 4 Children | 466 (73.3%) | 170 (26.7%) |
| 5 or more Children | 0 (0.0%) | 0 (0.0%) |
| Total | 3,824 (90.6%) | 398 (9.4%) |
Income Below Poverty Among Single-Parent Households in Lemoore
According to the poverty data in Lemoore, 9.0% or 77 single-father households and 20.6% or 280 single-mother households are living below the poverty line. Among single-father households, those with 1 or 2 children have the highest poverty rate, with 52 households (26.0%) experiencing poverty. Likewise, among single-mother households, those with 5 or more children have the highest poverty rate, with 22 households (100.0%) falling below the poverty line.
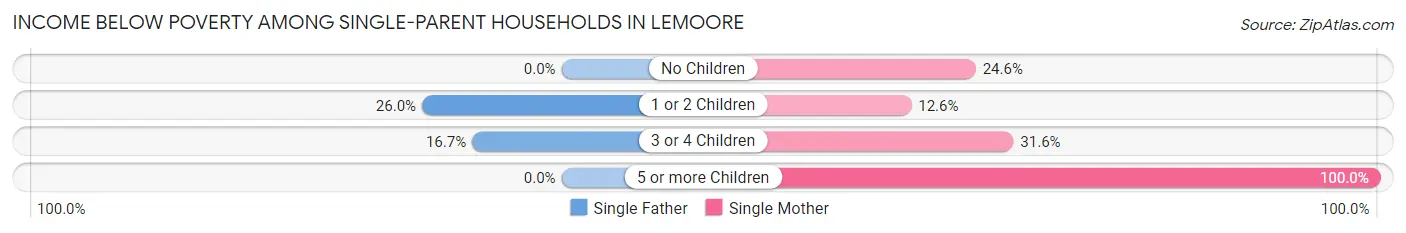
| Children | Single Father | Single Mother |
| No Children | 0 (0.0%) | 138 (24.6%) |
| 1 or 2 Children | 52 (26.0%) | 83 (12.6%) |
| 3 or 4 Children | 25 (16.7%) | 37 (31.6%) |
| 5 or more Children | 0 (0.0%) | 22 (100.0%) |
| Total | 77 (9.0%) | 280 (20.6%) |
Income Below Poverty Among Married-Couple vs Single-Parent Households in Lemoore
The poverty data for Lemoore shows that 398 of the married-couple family households (9.4%) and 357 of the single-parent households (16.2%) are living below the poverty level. Within the married-couple family households, those with 3 or 4 children have the highest poverty rate, with 170 households (26.7%) falling below the poverty line. Among the single-parent households, those with 5 or more children have the highest poverty rate, with 22 household (66.7%) living below poverty.
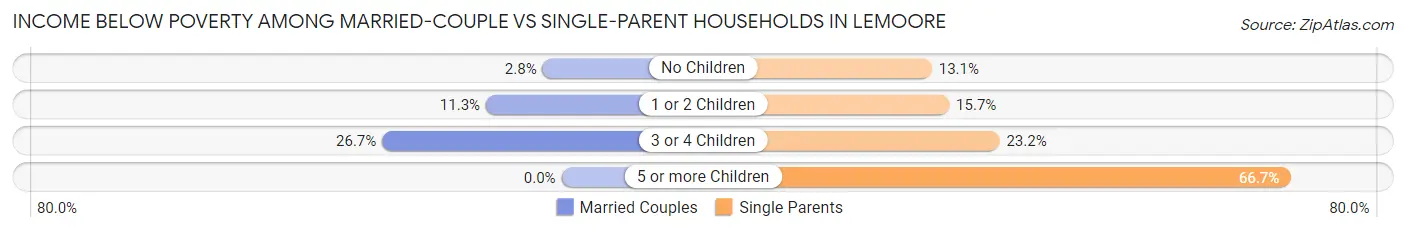
| Children | Married-Couple Families | Single-Parent Households |
| No Children | 59 (2.8%) | 138 (13.1%) |
| 1 or 2 Children | 169 (11.3%) | 135 (15.7%) |
| 3 or 4 Children | 170 (26.7%) | 62 (23.2%) |
| 5 or more Children | 0 (0.0%) | 22 (66.7%) |
| Total | 398 (9.4%) | 357 (16.2%) |
Race in Lemoore
The most populous races in Lemoore are White / Caucasian (14,710 | 54.6%), Hispanic or Latino (12,063 | 44.8%), and Two or more Races (4,401 | 16.3%).
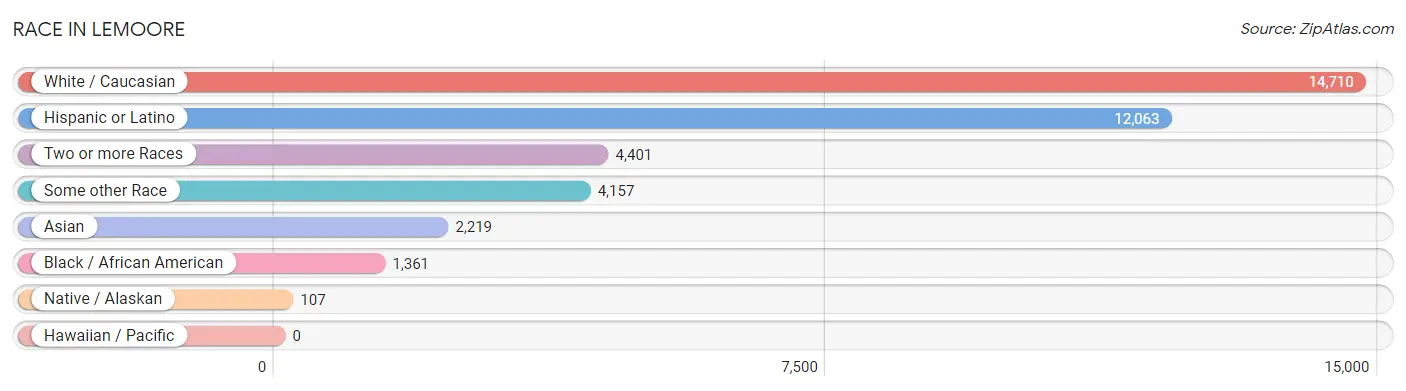
| Race | # Population | % Population |
| Asian | 2,219 | 8.2% |
| Black / African American | 1,361 | 5.1% |
| Hawaiian / Pacific | 0 | 0.0% |
| Hispanic or Latino | 12,063 | 44.8% |
| Native / Alaskan | 107 | 0.4% |
| White / Caucasian | 14,710 | 54.6% |
| Two or more Races | 4,401 | 16.3% |
| Some other Race | 4,157 | 15.4% |
| Total | 26,955 | 100.0% |
Ancestry in Lemoore
The most populous ancestries reported in Lemoore are Mexican (10,741 | 39.9%), Korean (2,114 | 7.8%), English (1,600 | 5.9%), Portuguese (1,177 | 4.4%), and German (1,175 | 4.4%), together accounting for 62.4% of all Lemoore residents.
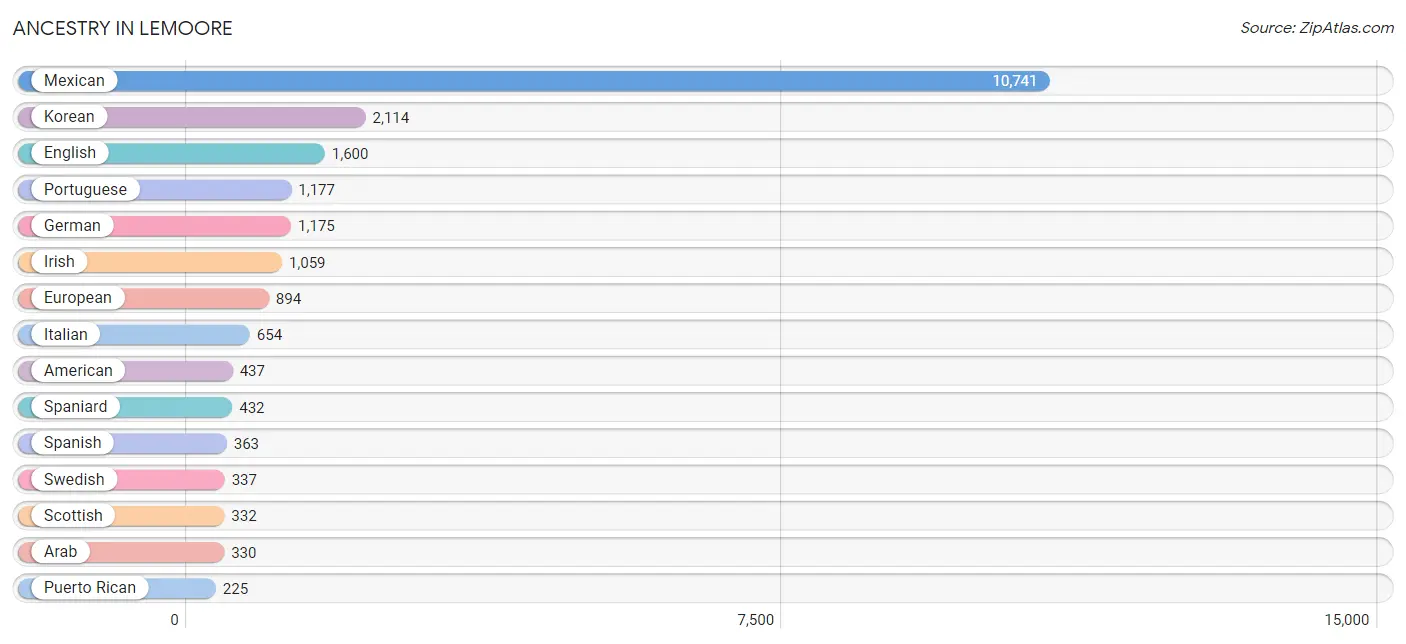
| Ancestry | # Population | % Population |
| African | 66 | 0.2% |
| American | 437 | 1.6% |
| Arab | 330 | 1.2% |
| Argentinean | 5 | 0.0% |
| Armenian | 18 | 0.1% |
| Bangladeshi | 24 | 0.1% |
| Bhutanese | 111 | 0.4% |
| British | 8 | 0.0% |
| Burmese | 163 | 0.6% |
| Canadian | 35 | 0.1% |
| Celtic | 17 | 0.1% |
| Central American | 121 | 0.4% |
| Cherokee | 221 | 0.8% |
| Choctaw | 85 | 0.3% |
| Creek | 63 | 0.2% |
| Croatian | 47 | 0.2% |
| Cuban | 60 | 0.2% |
| Czech | 21 | 0.1% |
| Danish | 48 | 0.2% |
| Dutch | 51 | 0.2% |
| Eastern European | 61 | 0.2% |
| Ecuadorian | 32 | 0.1% |
| English | 1,600 | 5.9% |
| European | 894 | 3.3% |
| Finnish | 14 | 0.1% |
| French | 142 | 0.5% |
| French Canadian | 31 | 0.1% |
| German | 1,175 | 4.4% |
| Greek | 37 | 0.1% |
| Guamanian / Chamorro | 30 | 0.1% |
| Guatemalan | 28 | 0.1% |
| Haitian | 14 | 0.1% |
| Icelander | 9 | 0.0% |
| Indian (Asian) | 107 | 0.4% |
| Irish | 1,059 | 3.9% |
| Italian | 654 | 2.4% |
| Jamaican | 26 | 0.1% |
| Japanese | 7 | 0.0% |
| Korean | 2,114 | 7.8% |
| Lebanese | 9 | 0.0% |
| Lithuanian | 3 | 0.0% |
| Malaysian | 94 | 0.4% |
| Mexican | 10,741 | 39.9% |
| Native Hawaiian | 16 | 0.1% |
| Navajo | 56 | 0.2% |
| Nicaraguan | 11 | 0.0% |
| Northern European | 17 | 0.1% |
| Norwegian | 100 | 0.4% |
| Pakistani | 39 | 0.1% |
| Peruvian | 12 | 0.0% |
| Polish | 57 | 0.2% |
| Portuguese | 1,177 | 4.4% |
| Puerto Rican | 225 | 0.8% |
| Romanian | 120 | 0.4% |
| Russian | 107 | 0.4% |
| Salvadoran | 49 | 0.2% |
| Samoan | 6 | 0.0% |
| Scandinavian | 32 | 0.1% |
| Scotch-Irish | 43 | 0.2% |
| Scottish | 332 | 1.2% |
| South American | 49 | 0.2% |
| Spaniard | 432 | 1.6% |
| Spanish | 363 | 1.3% |
| Sri Lankan | 136 | 0.5% |
| Subsaharan African | 66 | 0.2% |
| Swedish | 337 | 1.3% |
| Swiss | 50 | 0.2% |
| Syrian | 23 | 0.1% |
| Thai | 12 | 0.0% |
| Tohono O'Odham | 72 | 0.3% |
| Welsh | 80 | 0.3% |
| Yaqui | 17 | 0.1% |
| Yugoslavian | 39 | 0.1% | View All 73 Rows |
Immigrants in Lemoore
The most numerous immigrant groups reported in Lemoore came from Latin America (2,014 | 7.5%), Central America (1,992 | 7.4%), Mexico (1,853 | 6.9%), Asia (1,492 | 5.5%), and South Eastern Asia (1,260 | 4.7%), together accounting for 31.9% of all Lemoore residents.
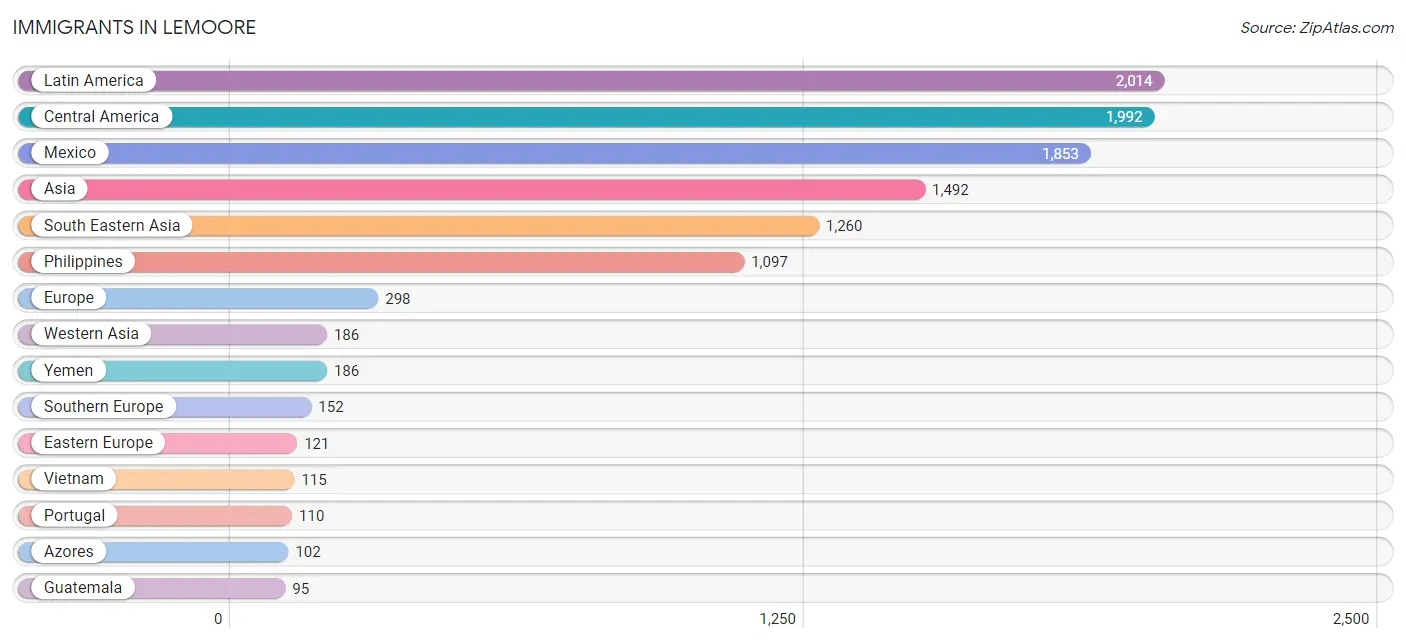
| Immigration Origin | # Population | % Population |
| Africa | 47 | 0.2% |
| Argentina | 5 | 0.0% |
| Asia | 1,492 | 5.5% |
| Azores | 102 | 0.4% |
| Cambodia | 7 | 0.0% |
| Cameroon | 47 | 0.2% |
| Canada | 18 | 0.1% |
| Central America | 1,992 | 7.4% |
| Costa Rica | 33 | 0.1% |
| Eastern Asia | 46 | 0.2% |
| Eastern Europe | 121 | 0.4% |
| Ecuador | 17 | 0.1% |
| England | 25 | 0.1% |
| Europe | 298 | 1.1% |
| Guatemala | 95 | 0.4% |
| Italy | 3 | 0.0% |
| Japan | 13 | 0.1% |
| Korea | 33 | 0.1% |
| Latin America | 2,014 | 7.5% |
| Lithuania | 27 | 0.1% |
| Mexico | 1,853 | 6.9% |
| Middle Africa | 47 | 0.2% |
| Nicaragua | 11 | 0.0% |
| Northern Europe | 25 | 0.1% |
| Philippines | 1,097 | 4.1% |
| Portugal | 110 | 0.4% |
| Romania | 94 | 0.4% |
| South America | 22 | 0.1% |
| South Eastern Asia | 1,260 | 4.7% |
| Southern Europe | 152 | 0.6% |
| Spain | 39 | 0.1% |
| Thailand | 41 | 0.2% |
| Vietnam | 115 | 0.4% |
| Western Asia | 186 | 0.7% |
| Yemen | 186 | 0.7% | View All 35 Rows |
Sex and Age in Lemoore
Sex and Age in Lemoore
The most populous age groups in Lemoore are 25 to 29 Years (1,473 | 10.4%) for men and 20 to 24 Years (1,396 | 10.9%) for women.
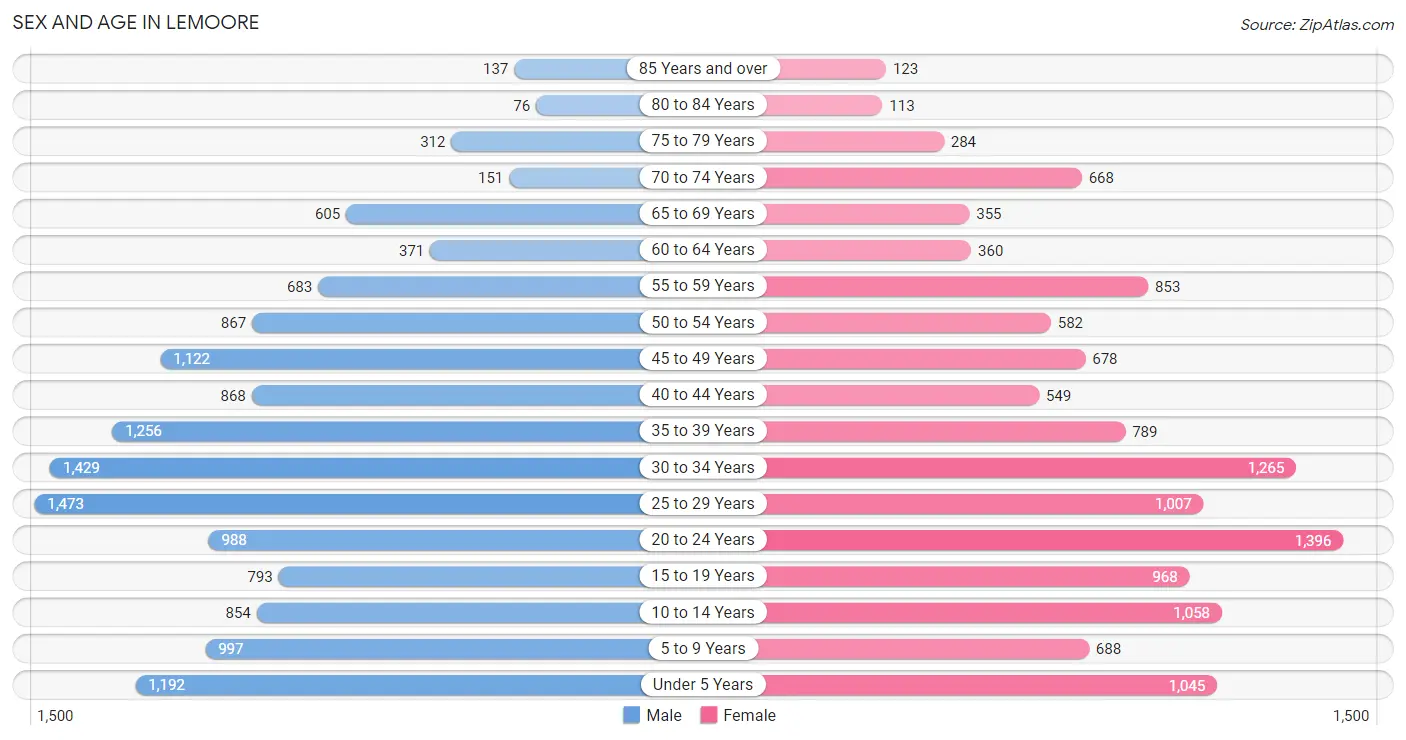
| Age Bracket | Male | Female |
| Under 5 Years | 1,192 (8.4%) | 1,045 (8.2%) |
| 5 to 9 Years | 997 (7.0%) | 688 (5.4%) |
| 10 to 14 Years | 854 (6.0%) | 1,058 (8.3%) |
| 15 to 19 Years | 793 (5.6%) | 968 (7.6%) |
| 20 to 24 Years | 988 (7.0%) | 1,396 (10.9%) |
| 25 to 29 Years | 1,473 (10.4%) | 1,007 (7.9%) |
| 30 to 34 Years | 1,429 (10.1%) | 1,265 (9.9%) |
| 35 to 39 Years | 1,256 (8.9%) | 789 (6.2%) |
| 40 to 44 Years | 868 (6.1%) | 549 (4.3%) |
| 45 to 49 Years | 1,122 (7.9%) | 678 (5.3%) |
| 50 to 54 Years | 867 (6.1%) | 582 (4.5%) |
| 55 to 59 Years | 683 (4.8%) | 853 (6.7%) |
| 60 to 64 Years | 371 (2.6%) | 360 (2.8%) |
| 65 to 69 Years | 605 (4.3%) | 355 (2.8%) |
| 70 to 74 Years | 151 (1.1%) | 668 (5.2%) |
| 75 to 79 Years | 312 (2.2%) | 284 (2.2%) |
| 80 to 84 Years | 76 (0.5%) | 113 (0.9%) |
| 85 Years and over | 137 (1.0%) | 123 (1.0%) |
| Total | 14,174 (100.0%) | 12,781 (100.0%) |
Families and Households in Lemoore
Median Family Size in Lemoore
The median family size in Lemoore is 3.54 persons per family, with married-couple families (4,222 | 65.6%) accounting for the largest median family size of 3.68 persons per family. On the other hand, single male/father families (851 | 13.2%) represent the smallest median family size with 3.20 persons per family.
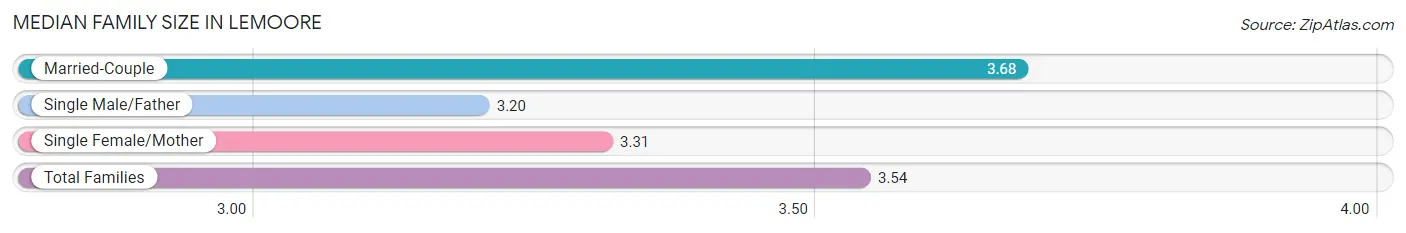
| Family Type | # Families | Family Size |
| Married-Couple | 4,222 (65.6%) | 3.68 |
| Single Male/Father | 851 (13.2%) | 3.20 |
| Single Female/Mother | 1,359 (21.1%) | 3.31 |
| Total Families | 6,432 (100.0%) | 3.54 |
Median Household Size in Lemoore
The median household size in Lemoore is 3.06 persons per household, with single female/mother households (1,359 | 15.4%) accounting for the largest median household size of 3.74 persons per household. non-family households (2,369 | 26.9%) represent the smallest median household size with 1.32 persons per household.
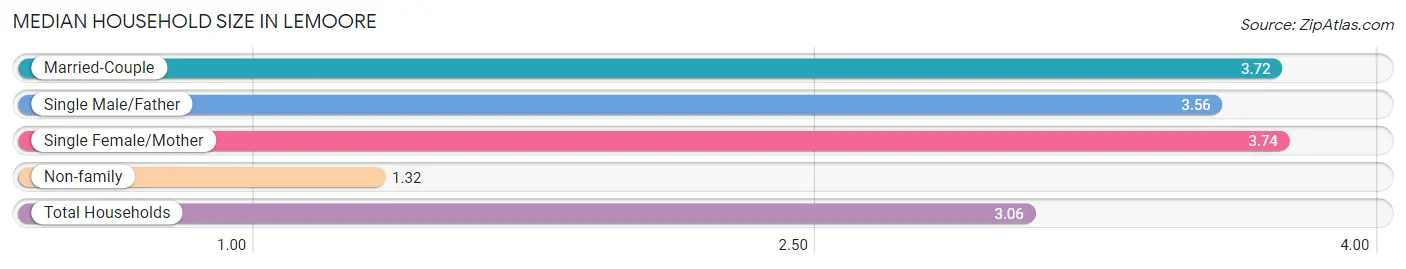
| Household Type | # Households | Household Size |
| Married-Couple | 4,222 (48.0%) | 3.72 |
| Single Male/Father | 851 (9.7%) | 3.56 |
| Single Female/Mother | 1,359 (15.4%) | 3.74 |
| Non-family | 2,369 (26.9%) | 1.32 |
| Total Households | 8,801 (100.0%) | 3.06 |
Household Size by Marriage Status in Lemoore
Out of a total of 8,801 households in Lemoore, 6,432 (73.1%) are family households, while 2,369 (26.9%) are nonfamily households. The most numerous type of family households are 2-person households, comprising 2,227, and the most common type of nonfamily households are 1-person households, comprising 1,766.
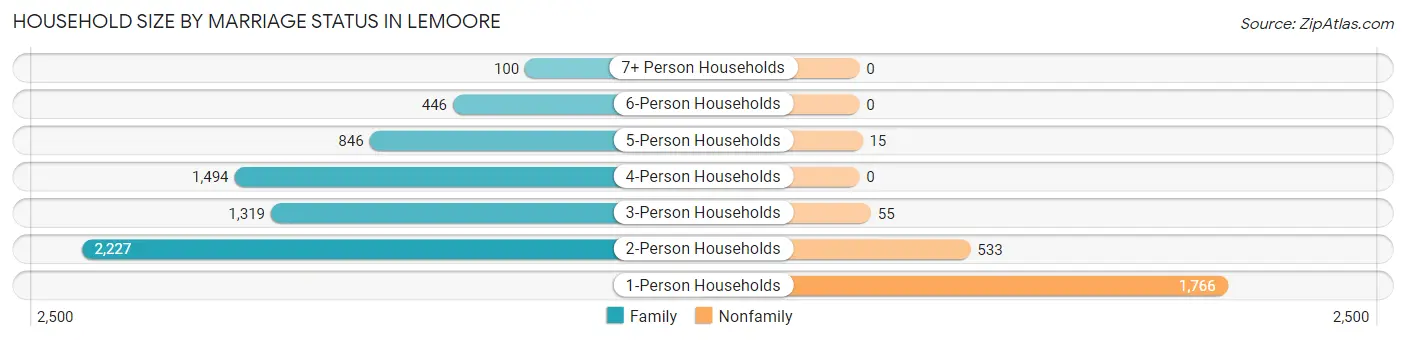
| Household Size | Family Households | Nonfamily Households |
| 1-Person Households | - | 1,766 (20.1%) |
| 2-Person Households | 2,227 (25.3%) | 533 (6.1%) |
| 3-Person Households | 1,319 (15.0%) | 55 (0.6%) |
| 4-Person Households | 1,494 (17.0%) | 0 (0.0%) |
| 5-Person Households | 846 (9.6%) | 15 (0.2%) |
| 6-Person Households | 446 (5.1%) | 0 (0.0%) |
| 7+ Person Households | 100 (1.1%) | 0 (0.0%) |
| Total | 6,432 (73.1%) | 2,369 (26.9%) |
Female Fertility in Lemoore
Fertility by Age in Lemoore
Average fertility rate in Lemoore is 78.0 births per 1,000 women. Women in the age bracket of 20 to 34 years have the highest fertility rate with 108.0 births per 1,000 women. Women in the age bracket of 20 to 34 years acount for 76.0% of all women with births.
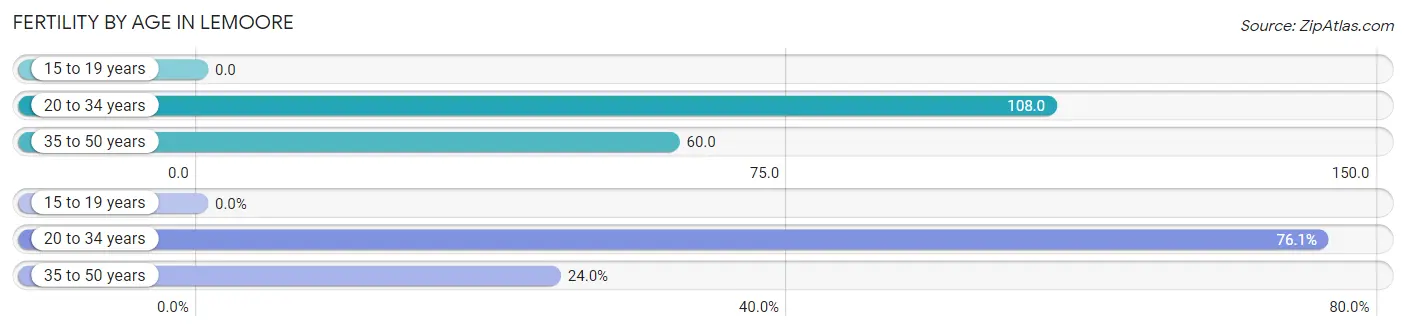
| Age Bracket | Women with Births | Births / 1,000 Women |
| 15 to 19 years | 0 (0.0%) | 0.0 |
| 20 to 34 years | 397 (76.0%) | 108.0 |
| 35 to 50 years | 125 (23.9%) | 60.0 |
| Total | 522 (100.0%) | 78.0 |
Fertility by Age by Marriage Status in Lemoore
55.9% of women with births (522) in Lemoore are married. The highest percentage of unmarried women with births falls into 20 to 34 years age bracket with 57.9% of them unmarried at the time of birth, while the lowest percentage of unmarried women with births belong to 35 to 50 years age bracket with 0.0% of them unmarried.
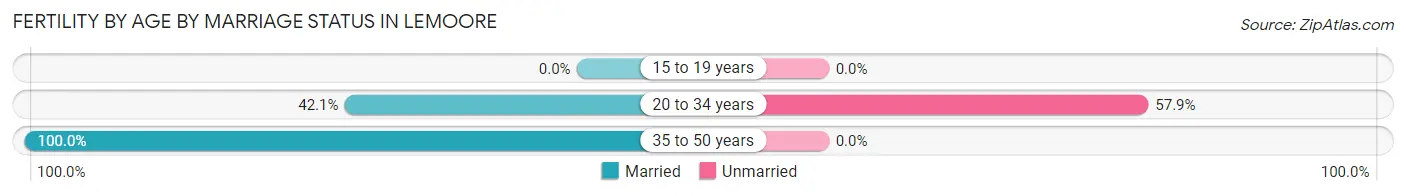
| Age Bracket | Married | Unmarried |
| 15 to 19 years | 0 (0.0%) | 0 (0.0%) |
| 20 to 34 years | 167 (42.1%) | 230 (57.9%) |
| 35 to 50 years | 125 (100.0%) | 0 (0.0%) |
| Total | 292 (55.9%) | 230 (44.1%) |
Fertility by Education in Lemoore
Average fertility rate in Lemoore is 78.0 births per 1,000 women. Women with the education attainment of high school diploma have the highest fertility rate of 113.0 births per 1,000 women, while women with the education attainment of bachelor's degree have the lowest fertility at 25.0 births per 1,000 women. Women with the education attainment of college or associate's degree represent 45.8% of all women with births.
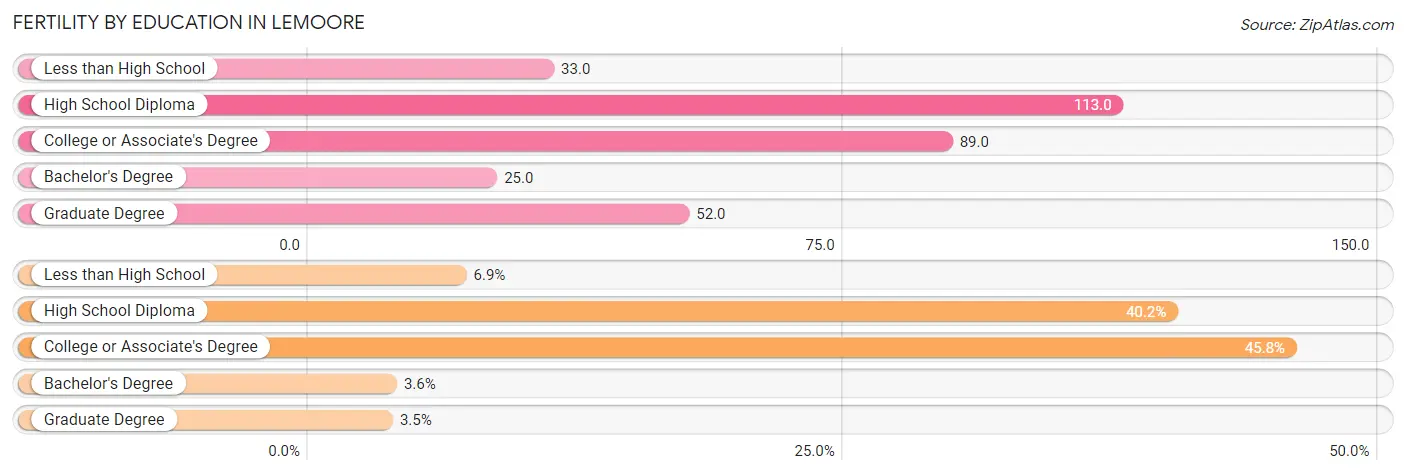
| Educational Attainment | Women with Births | Births / 1,000 Women |
| Less than High School | 36 (6.9%) | 33.0 |
| High School Diploma | 210 (40.2%) | 113.0 |
| College or Associate's Degree | 239 (45.8%) | 89.0 |
| Bachelor's Degree | 19 (3.6%) | 25.0 |
| Graduate Degree | 18 (3.5%) | 52.0 |
| Total | 522 (100.0%) | 78.0 |
Fertility by Education by Marriage Status in Lemoore
44.1% of women with births in Lemoore are unmarried. Women with the educational attainment of less than high school are most likely to be married with 100.0% of them married at childbirth, while women with the educational attainment of bachelor's degree are least likely to be married with 57.9% of them unmarried at childbirth.
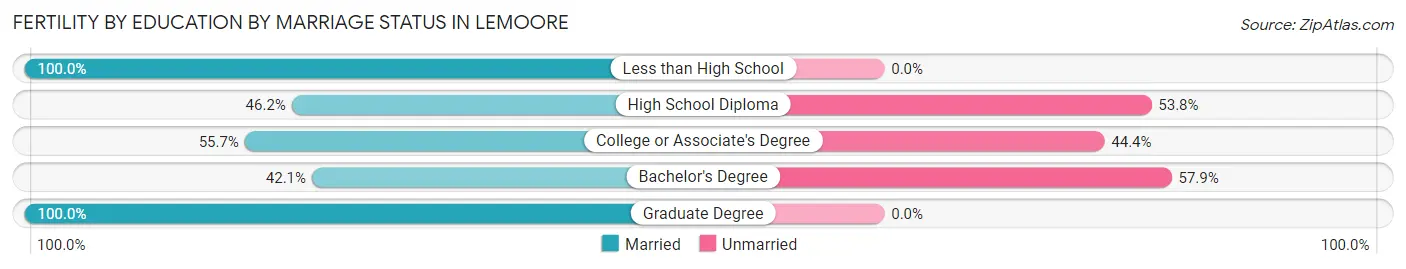
| Educational Attainment | Married | Unmarried |
| Less than High School | 36 (100.0%) | 0 (0.0%) |
| High School Diploma | 97 (46.2%) | 113 (53.8%) |
| College or Associate's Degree | 133 (55.6%) | 106 (44.4%) |
| Bachelor's Degree | 8 (42.1%) | 11 (57.9%) |
| Graduate Degree | 18 (100.0%) | 0 (0.0%) |
| Total | 292 (55.9%) | 230 (44.1%) |
Employment Characteristics in Lemoore
Employment by Class of Employer in Lemoore
Among the 11,557 employed individuals in Lemoore, private company employees (5,811 | 50.3%), federal government employees (2,600 | 22.5%), and local government employees (1,101 | 9.5%) make up the most common classes of employment.
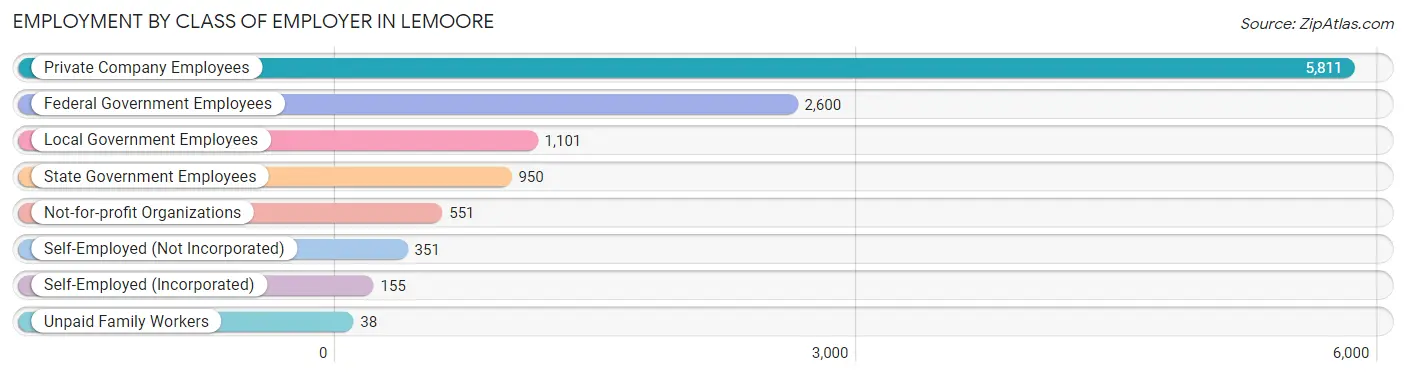
| Employer Class | # Employees | % Employees |
| Private Company Employees | 5,811 | 50.3% |
| Self-Employed (Incorporated) | 155 | 1.3% |
| Self-Employed (Not Incorporated) | 351 | 3.0% |
| Not-for-profit Organizations | 551 | 4.8% |
| Local Government Employees | 1,101 | 9.5% |
| State Government Employees | 950 | 8.2% |
| Federal Government Employees | 2,600 | 22.5% |
| Unpaid Family Workers | 38 | 0.3% |
| Total | 11,557 | 100.0% |
Employment Status by Age in Lemoore
According to the labor force statistics for Lemoore, out of the total population over 16 years of age (20,746), 63.2% or 13,111 individuals are in the labor force, with 11.0% or 1,442 of them unemployed. The age group with the highest labor force participation rate is 25 to 29 years, with 82.5% or 2,046 individuals in the labor force. Within the labor force, the 30 to 34 years age range has the highest percentage of unemployed individuals, with 24.3% or 482 of them being unemployed.
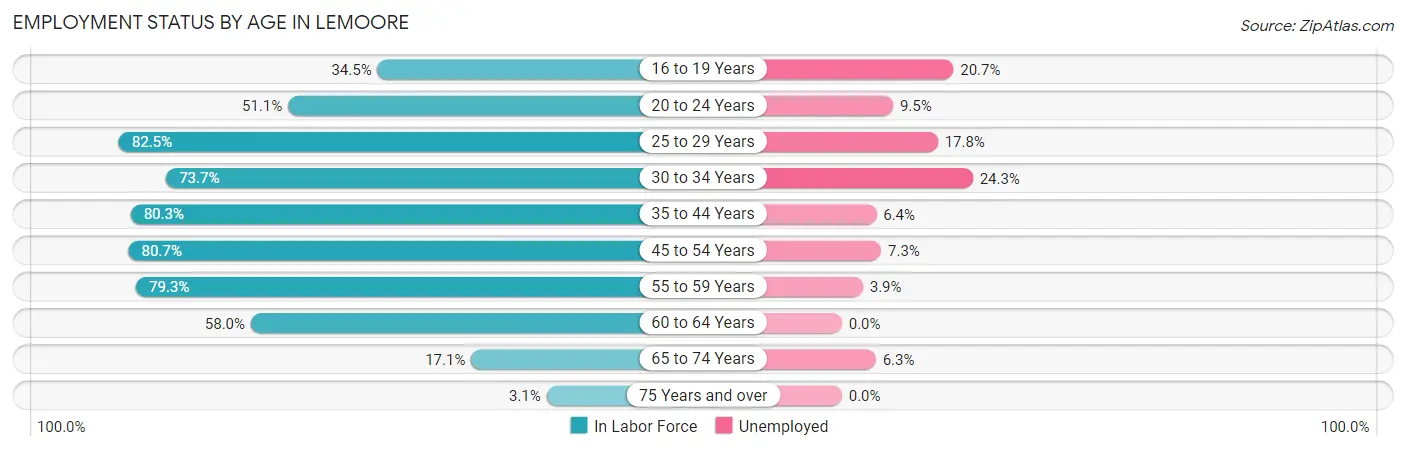
| Age Bracket | In Labor Force | Unemployed |
| 16 to 19 Years | 478 (34.5%) | 99 (20.7%) |
| 20 to 24 Years | 1,218 (51.1%) | 116 (9.5%) |
| 25 to 29 Years | 2,046 (82.5%) | 364 (17.8%) |
| 30 to 34 Years | 1,985 (73.7%) | 482 (24.3%) |
| 35 to 44 Years | 2,780 (80.3%) | 178 (6.4%) |
| 45 to 54 Years | 2,622 (80.7%) | 191 (7.3%) |
| 55 to 59 Years | 1,218 (79.3%) | 48 (3.9%) |
| 60 to 64 Years | 424 (58.0%) | 0 (0.0%) |
| 65 to 74 Years | 304 (17.1%) | 19 (6.3%) |
| 75 Years and over | 32 (3.1%) | 0 (0.0%) |
| Total | 13,111 (63.2%) | 1,442 (11.0%) |
Employment Status by Educational Attainment in Lemoore
According to labor force statistics for Lemoore, 78.3% of individuals (11,081) out of the total population between 25 and 64 years of age (14,152) are in the labor force, with 10.9% or 1,208 of them being unemployed. The group with the highest labor force participation rate are those with the educational attainment of bachelor's degree or higher, with 92.0% or 2,900 individuals in the labor force. Within the labor force, individuals with less than high school education have the highest percentage of unemployment, with 19.6% or 292 of them being unemployed.
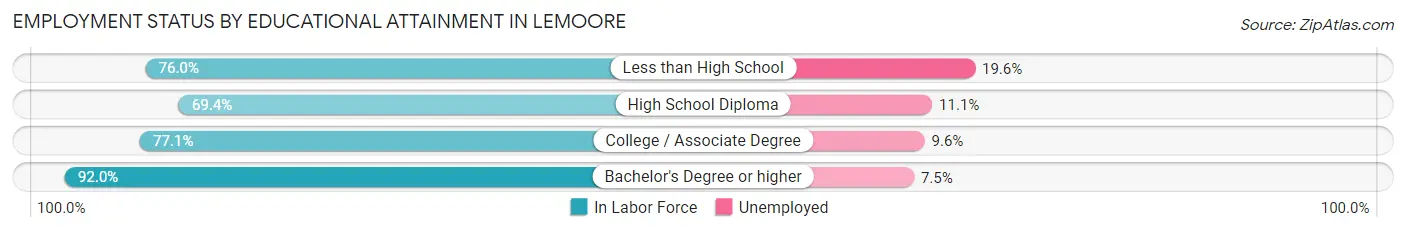
| Educational Attainment | In Labor Force | Unemployed |
| Less than High School | 1,490 (76.0%) | 384 (19.6%) |
| High School Diploma | 2,556 (69.4%) | 409 (11.1%) |
| College / Associate Degree | 4,130 (77.1%) | 514 (9.6%) |
| Bachelor's Degree or higher | 2,900 (92.0%) | 236 (7.5%) |
| Total | 11,081 (78.3%) | 1,543 (10.9%) |
Employment Occupations by Sex in Lemoore
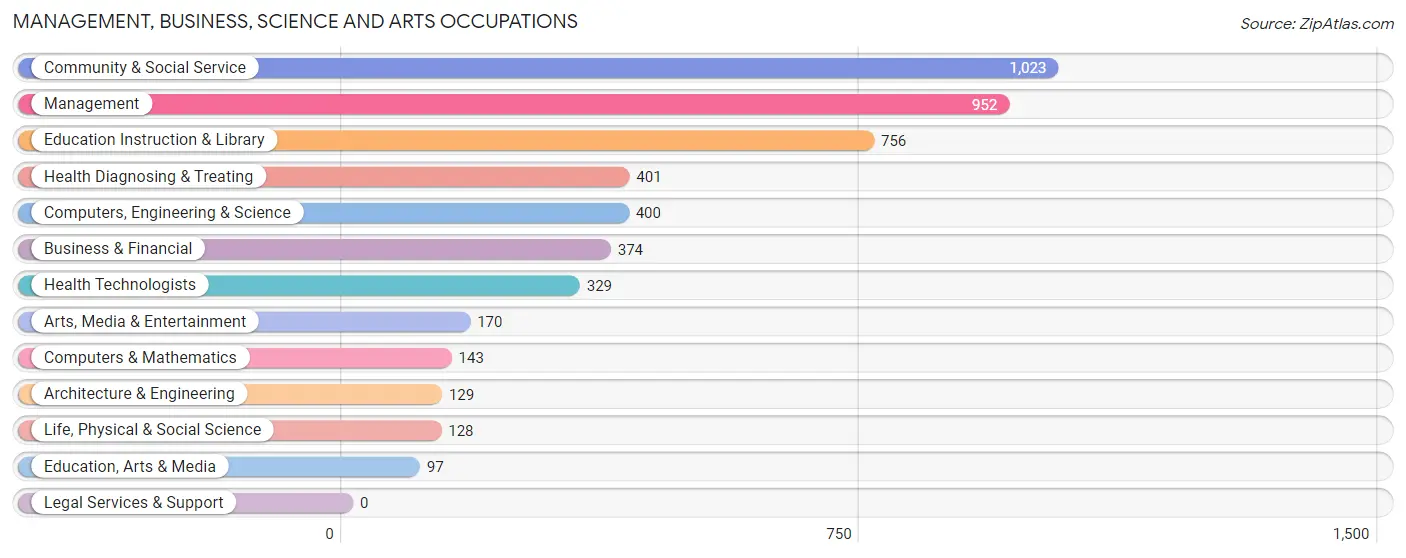
Management, Business, Science and Arts Occupations
The most common Management, Business, Science and Arts occupations in Lemoore are Community & Social Service (1,023 | 9.9%), Management (952 | 9.2%), Education Instruction & Library (756 | 7.3%), Health Diagnosing & Treating (401 | 3.9%), and Computers, Engineering & Science (400 | 3.8%).
Management, Business, Science and Arts Occupations by Sex
Within the Management, Business, Science and Arts occupations in Lemoore, the most male-oriented occupations are Architecture & Engineering (94.6%), Computers & Mathematics (67.1%), and Computers, Engineering & Science (63.2%), while the most female-oriented occupations are Education, Arts & Media (93.8%), Health Diagnosing & Treating (91.0%), and Health Technologists (89.1%).
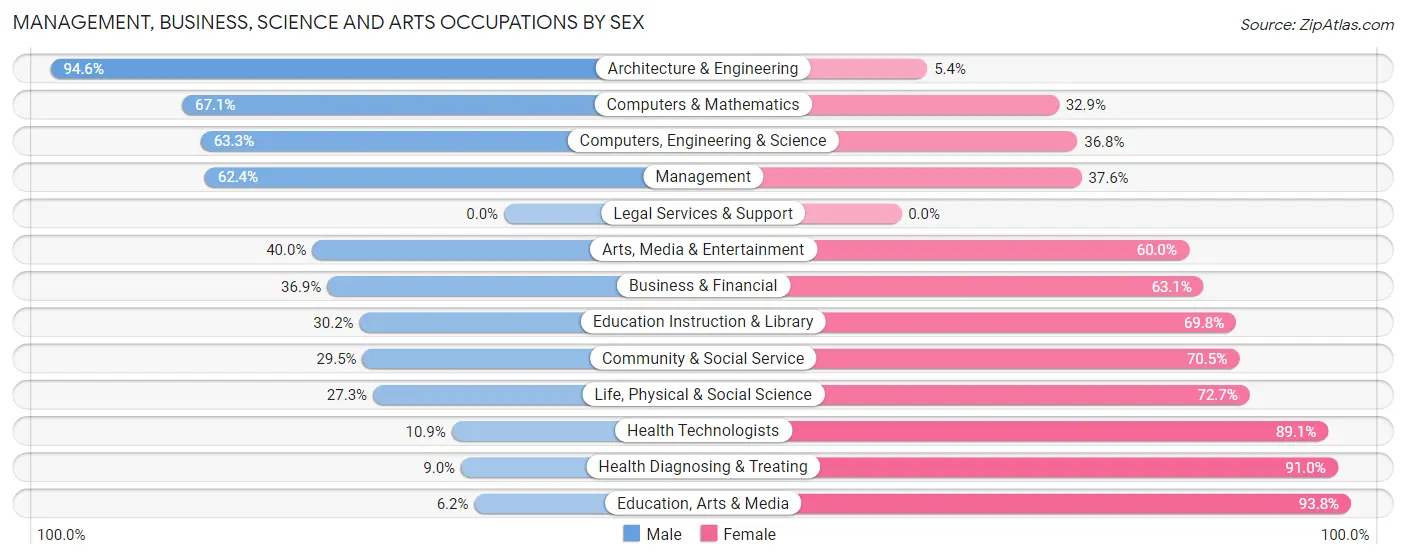
| Occupation | Male | Female |
| Management | 594 (62.4%) | 358 (37.6%) |
| Business & Financial | 138 (36.9%) | 236 (63.1%) |
| Computers, Engineering & Science | 253 (63.2%) | 147 (36.7%) |
| Computers & Mathematics | 96 (67.1%) | 47 (32.9%) |
| Architecture & Engineering | 122 (94.6%) | 7 (5.4%) |
| Life, Physical & Social Science | 35 (27.3%) | 93 (72.7%) |
| Community & Social Service | 302 (29.5%) | 721 (70.5%) |
| Education, Arts & Media | 6 (6.2%) | 91 (93.8%) |
| Legal Services & Support | 0 (0.0%) | 0 (0.0%) |
| Education Instruction & Library | 228 (30.2%) | 528 (69.8%) |
| Arts, Media & Entertainment | 68 (40.0%) | 102 (60.0%) |
| Health Diagnosing & Treating | 36 (9.0%) | 365 (91.0%) |
| Health Technologists | 36 (10.9%) | 293 (89.1%) |
| Total (Category) | 1,323 (42.0%) | 1,827 (58.0%) |
| Total (Overall) | 5,964 (57.4%) | 4,425 (42.6%) |
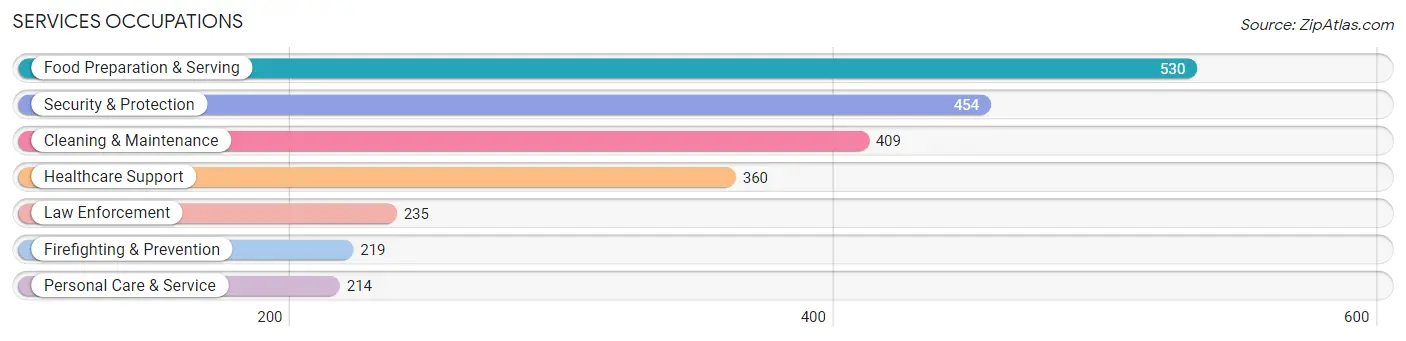
Services Occupations
The most common Services occupations in Lemoore are Food Preparation & Serving (530 | 5.1%), Security & Protection (454 | 4.4%), Cleaning & Maintenance (409 | 3.9%), Healthcare Support (360 | 3.5%), and Law Enforcement (235 | 2.3%).
Services Occupations by Sex
Within the Services occupations in Lemoore, the most male-oriented occupations are Law Enforcement (86.4%), Cleaning & Maintenance (79.0%), and Security & Protection (75.8%), while the most female-oriented occupations are Personal Care & Service (74.3%), Healthcare Support (73.6%), and Food Preparation & Serving (67.2%).
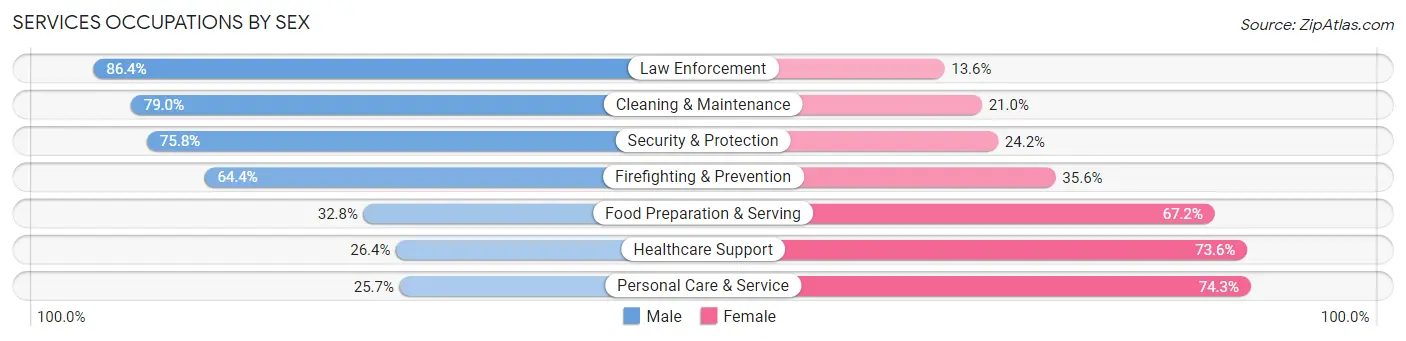
| Occupation | Male | Female |
| Healthcare Support | 95 (26.4%) | 265 (73.6%) |
| Security & Protection | 344 (75.8%) | 110 (24.2%) |
| Firefighting & Prevention | 141 (64.4%) | 78 (35.6%) |
| Law Enforcement | 203 (86.4%) | 32 (13.6%) |
| Food Preparation & Serving | 174 (32.8%) | 356 (67.2%) |
| Cleaning & Maintenance | 323 (79.0%) | 86 (21.0%) |
| Personal Care & Service | 55 (25.7%) | 159 (74.3%) |
| Total (Category) | 991 (50.4%) | 976 (49.6%) |
| Total (Overall) | 5,964 (57.4%) | 4,425 (42.6%) |
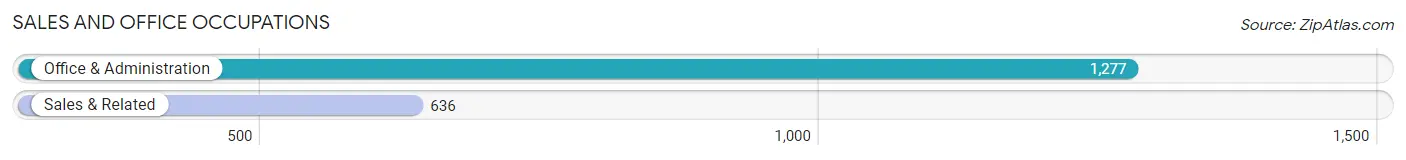
Sales and Office Occupations
The most common Sales and Office occupations in Lemoore are Office & Administration (1,277 | 12.3%), and Sales & Related (636 | 6.1%).
Sales and Office Occupations by Sex
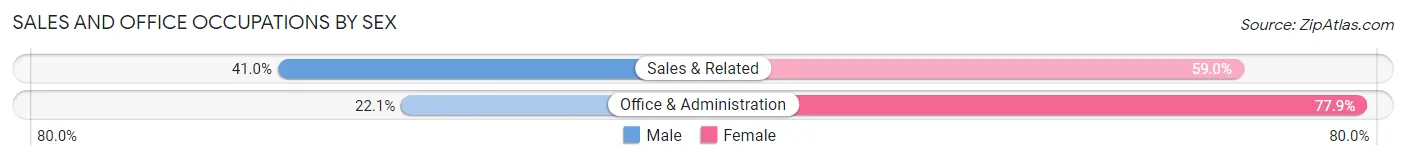
| Occupation | Male | Female |
| Sales & Related | 261 (41.0%) | 375 (59.0%) |
| Office & Administration | 282 (22.1%) | 995 (77.9%) |
| Total (Category) | 543 (28.4%) | 1,370 (71.6%) |
| Total (Overall) | 5,964 (57.4%) | 4,425 (42.6%) |
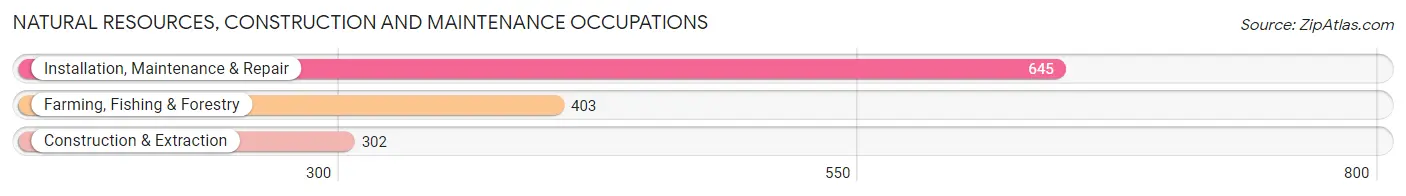
Natural Resources, Construction and Maintenance Occupations
The most common Natural Resources, Construction and Maintenance occupations in Lemoore are Installation, Maintenance & Repair (645 | 6.2%), Farming, Fishing & Forestry (403 | 3.9%), and Construction & Extraction (302 | 2.9%).
Natural Resources, Construction and Maintenance Occupations by Sex
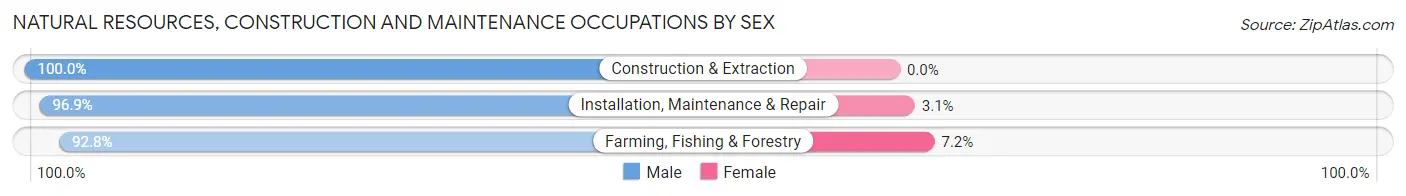
| Occupation | Male | Female |
| Farming, Fishing & Forestry | 374 (92.8%) | 29 (7.2%) |
| Construction & Extraction | 302 (100.0%) | 0 (0.0%) |
| Installation, Maintenance & Repair | 625 (96.9%) | 20 (3.1%) |
| Total (Category) | 1,301 (96.4%) | 49 (3.6%) |
| Total (Overall) | 5,964 (57.4%) | 4,425 (42.6%) |
Production, Transportation and Moving Occupations
The most common Production, Transportation and Moving occupations in Lemoore are Material Moving (905 | 8.7%), Transportation (588 | 5.7%), and Production (516 | 5.0%).
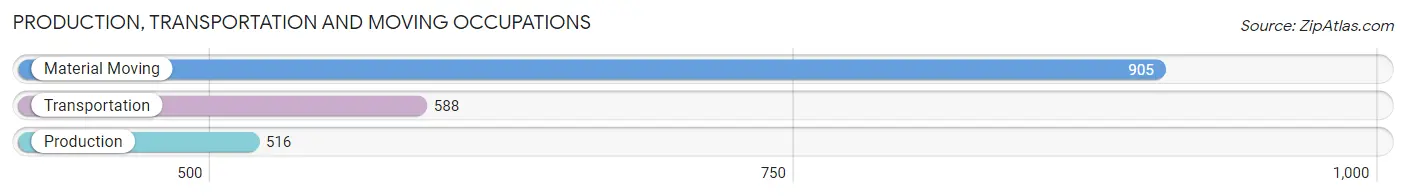
Production, Transportation and Moving Occupations by Sex
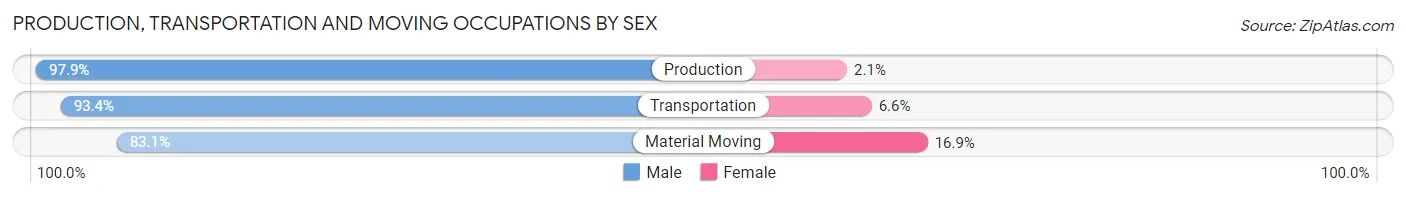
| Occupation | Male | Female |
| Production | 505 (97.9%) | 11 (2.1%) |
| Transportation | 549 (93.4%) | 39 (6.6%) |
| Material Moving | 752 (83.1%) | 153 (16.9%) |
| Total (Category) | 1,806 (89.9%) | 203 (10.1%) |
| Total (Overall) | 5,964 (57.4%) | 4,425 (42.6%) |
Employment Industries by Sex in Lemoore
Employment Industries in Lemoore
The major employment industries in Lemoore include Public Administration (1,547 | 14.9%), Health Care & Social Assistance (1,331 | 12.8%), Educational Services (998 | 9.6%), Manufacturing (887 | 8.5%), and Retail Trade (884 | 8.5%).
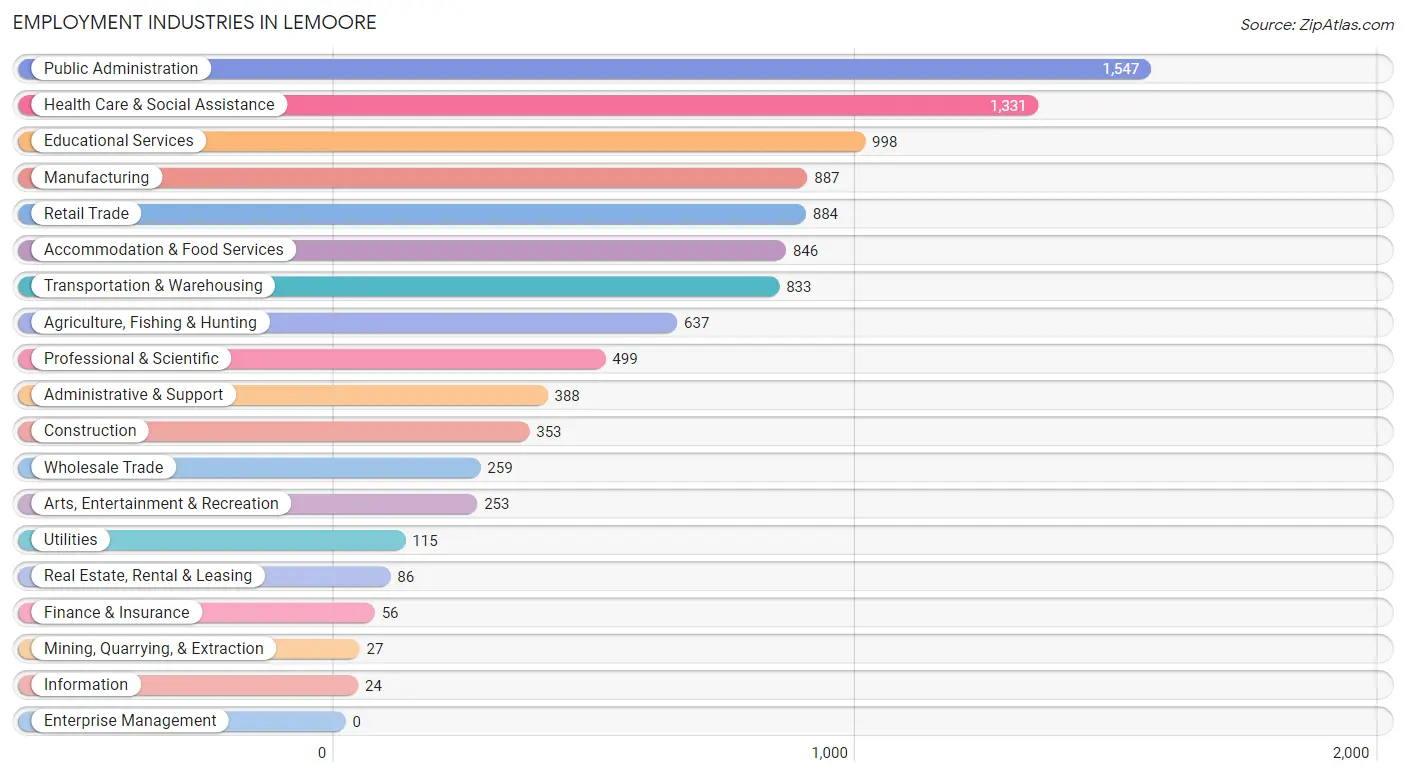
Employment Industries by Sex in Lemoore
The Lemoore industries that see more men than women are Mining, Quarrying, & Extraction (100.0%), Transportation & Warehousing (94.5%), and Construction (94.3%), whereas the industries that tend to have a higher number of women are Finance & Insurance (73.2%), Accommodation & Food Services (71.5%), and Health Care & Social Assistance (71.0%).
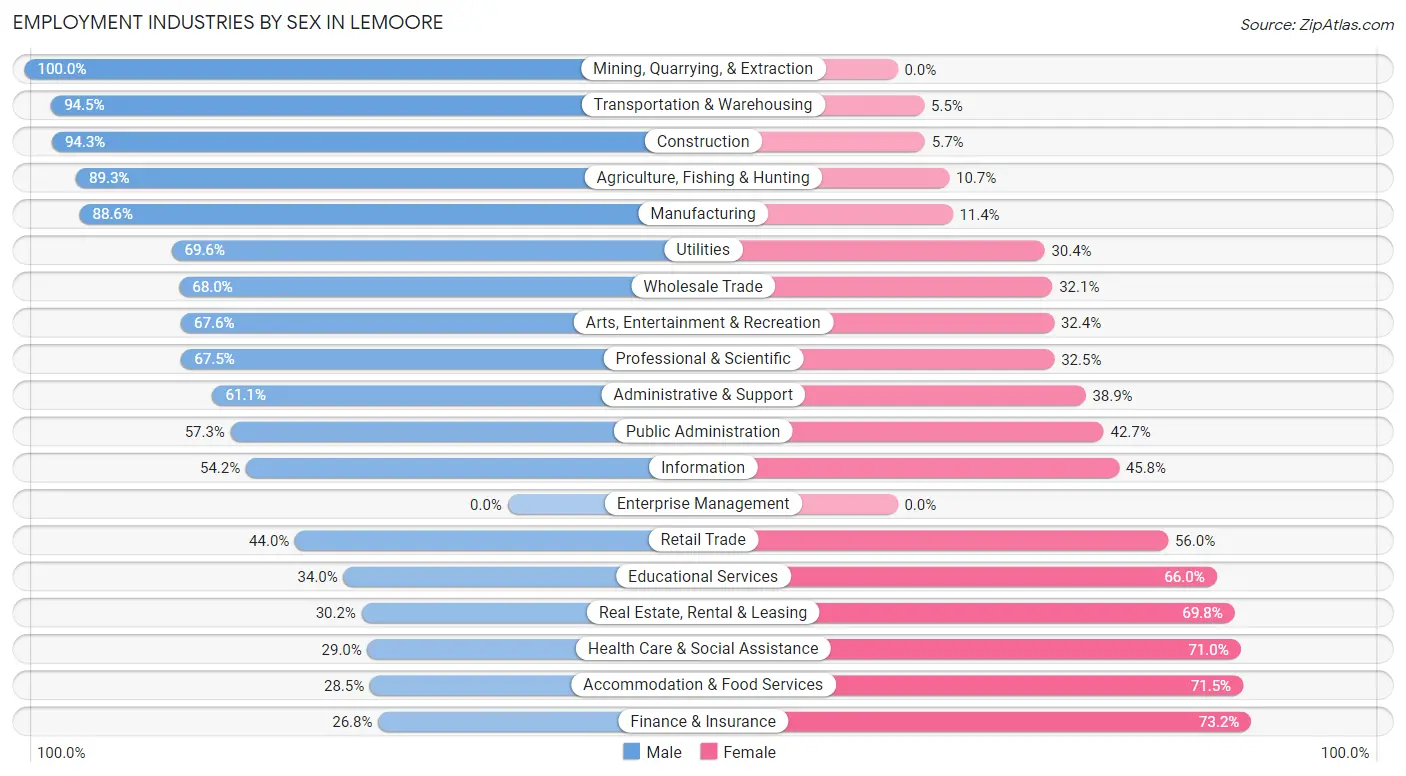
| Industry | Male | Female |
| Agriculture, Fishing & Hunting | 569 (89.3%) | 68 (10.7%) |
| Mining, Quarrying, & Extraction | 27 (100.0%) | 0 (0.0%) |
| Construction | 333 (94.3%) | 20 (5.7%) |
| Manufacturing | 786 (88.6%) | 101 (11.4%) |
| Wholesale Trade | 176 (67.9%) | 83 (32.1%) |
| Retail Trade | 389 (44.0%) | 495 (56.0%) |
| Transportation & Warehousing | 787 (94.5%) | 46 (5.5%) |
| Utilities | 80 (69.6%) | 35 (30.4%) |
| Information | 13 (54.2%) | 11 (45.8%) |
| Finance & Insurance | 15 (26.8%) | 41 (73.2%) |
| Real Estate, Rental & Leasing | 26 (30.2%) | 60 (69.8%) |
| Professional & Scientific | 337 (67.5%) | 162 (32.5%) |
| Enterprise Management | 0 (0.0%) | 0 (0.0%) |
| Administrative & Support | 237 (61.1%) | 151 (38.9%) |
| Educational Services | 339 (34.0%) | 659 (66.0%) |
| Health Care & Social Assistance | 386 (29.0%) | 945 (71.0%) |
| Arts, Entertainment & Recreation | 171 (67.6%) | 82 (32.4%) |
| Accommodation & Food Services | 241 (28.5%) | 605 (71.5%) |
| Public Administration | 887 (57.3%) | 660 (42.7%) |
| Total | 5,964 (57.4%) | 4,425 (42.6%) |
Education in Lemoore
School Enrollment in Lemoore
The most common levels of schooling among the 7,366 students in Lemoore are college / undergraduate (1,865 | 25.3%), middle school (1,554 | 21.1%), and high school (1,471 | 20.0%).
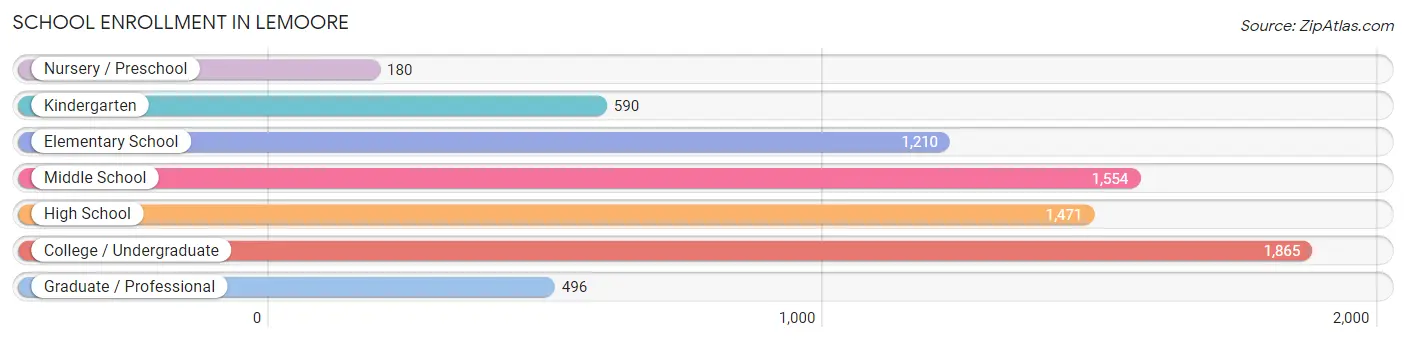
| School Level | # Students | % Students |
| Nursery / Preschool | 180 | 2.4% |
| Kindergarten | 590 | 8.0% |
| Elementary School | 1,210 | 16.4% |
| Middle School | 1,554 | 21.1% |
| High School | 1,471 | 20.0% |
| College / Undergraduate | 1,865 | 25.3% |
| Graduate / Professional | 496 | 6.7% |
| Total | 7,366 | 100.0% |
School Enrollment by Age by Funding Source in Lemoore
Out of a total of 7,366 students who are enrolled in schools in Lemoore, 980 (13.3%) attend a private institution, while the remaining 6,386 (86.7%) are enrolled in public schools. The age group of 25 to 34 year olds has the highest likelihood of being enrolled in private schools, with 375 (40.9% in the age bracket) enrolled. Conversely, the age group of 5 to 9 year old has the lowest likelihood of being enrolled in a private school, with 1,516 (95.6% in the age bracket) attending a public institution.
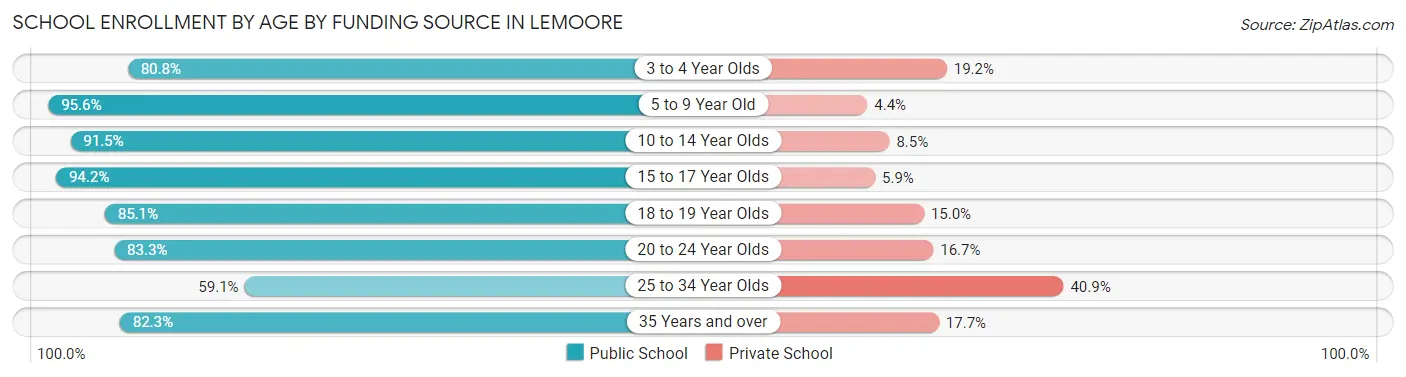
| Age Bracket | Public School | Private School |
| 3 to 4 Year Olds | 164 (80.8%) | 39 (19.2%) |
| 5 to 9 Year Old | 1,516 (95.6%) | 70 (4.4%) |
| 10 to 14 Year Olds | 1,749 (91.5%) | 163 (8.5%) |
| 15 to 17 Year Olds | 1,062 (94.2%) | 66 (5.9%) |
| 18 to 19 Year Olds | 256 (85.1%) | 45 (14.9%) |
| 20 to 24 Year Olds | 724 (83.3%) | 145 (16.7%) |
| 25 to 34 Year Olds | 541 (59.1%) | 375 (40.9%) |
| 35 Years and over | 371 (82.3%) | 80 (17.7%) |
| Total | 6,386 (86.7%) | 980 (13.3%) |
Educational Attainment by Field of Study in Lemoore
Business (824 | 21.9%), education (560 | 14.9%), engineering (477 | 12.7%), bio, nature & agricultural (440 | 11.7%), and science & technology (377 | 10.0%) are the most common fields of study among 3,760 individuals in Lemoore who have obtained a bachelor's degree or higher.
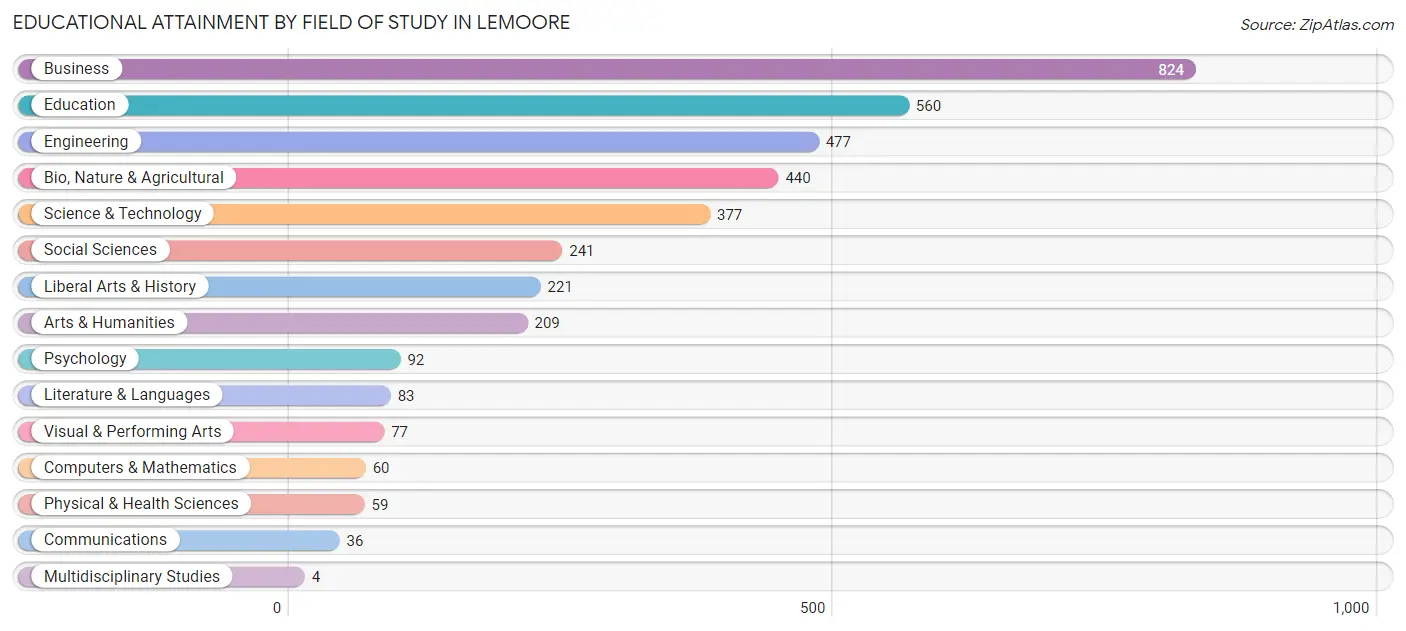
| Field of Study | # Graduates | % Graduates |
| Computers & Mathematics | 60 | 1.6% |
| Bio, Nature & Agricultural | 440 | 11.7% |
| Physical & Health Sciences | 59 | 1.6% |
| Psychology | 92 | 2.5% |
| Social Sciences | 241 | 6.4% |
| Engineering | 477 | 12.7% |
| Multidisciplinary Studies | 4 | 0.1% |
| Science & Technology | 377 | 10.0% |
| Business | 824 | 21.9% |
| Education | 560 | 14.9% |
| Literature & Languages | 83 | 2.2% |
| Liberal Arts & History | 221 | 5.9% |
| Visual & Performing Arts | 77 | 2.1% |
| Communications | 36 | 1.0% |
| Arts & Humanities | 209 | 5.6% |
| Total | 3,760 | 100.0% |
Transportation & Commute in Lemoore
Vehicle Availability by Sex in Lemoore
The most prevalent vehicle ownership categories in Lemoore are males with 2 vehicles (3,647, accounting for 50.8%) and females with 2 vehicles (2,117, making up 83.2%).
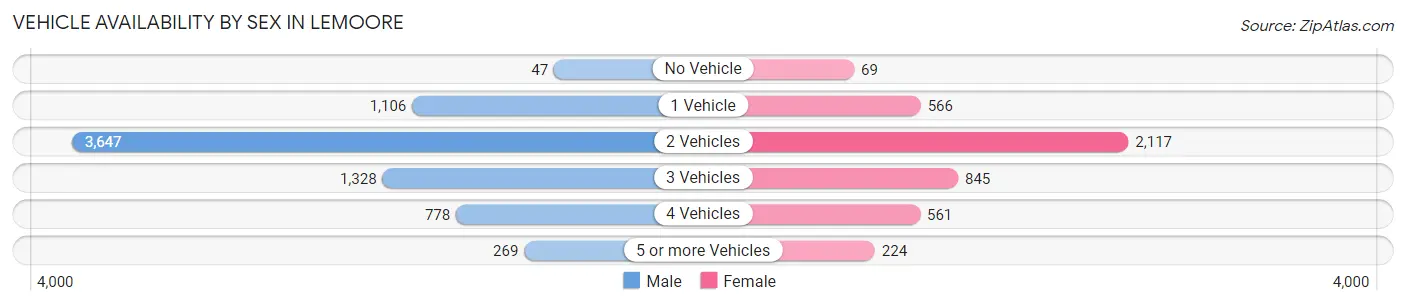
| Vehicles Available | Male | Female |
| No Vehicle | 47 (0.7%) | 69 (1.6%) |
| 1 Vehicle | 1,106 (15.4%) | 566 (12.9%) |
| 2 Vehicles | 3,647 (50.8%) | 2,117 (48.3%) |
| 3 Vehicles | 1,328 (18.5%) | 845 (19.3%) |
| 4 Vehicles | 778 (10.8%) | 561 (12.8%) |
| 5 or more Vehicles | 269 (3.7%) | 224 (5.1%) |
| Total | 7,175 (100.0%) | 4,382 (100.0%) |
Commute Time in Lemoore
The most frequently occuring commute durations in Lemoore are 15 to 19 minutes (2,429 commuters, 21.5%), 5 to 9 minutes (2,057 commuters, 18.2%), and 20 to 24 minutes (1,750 commuters, 15.5%).
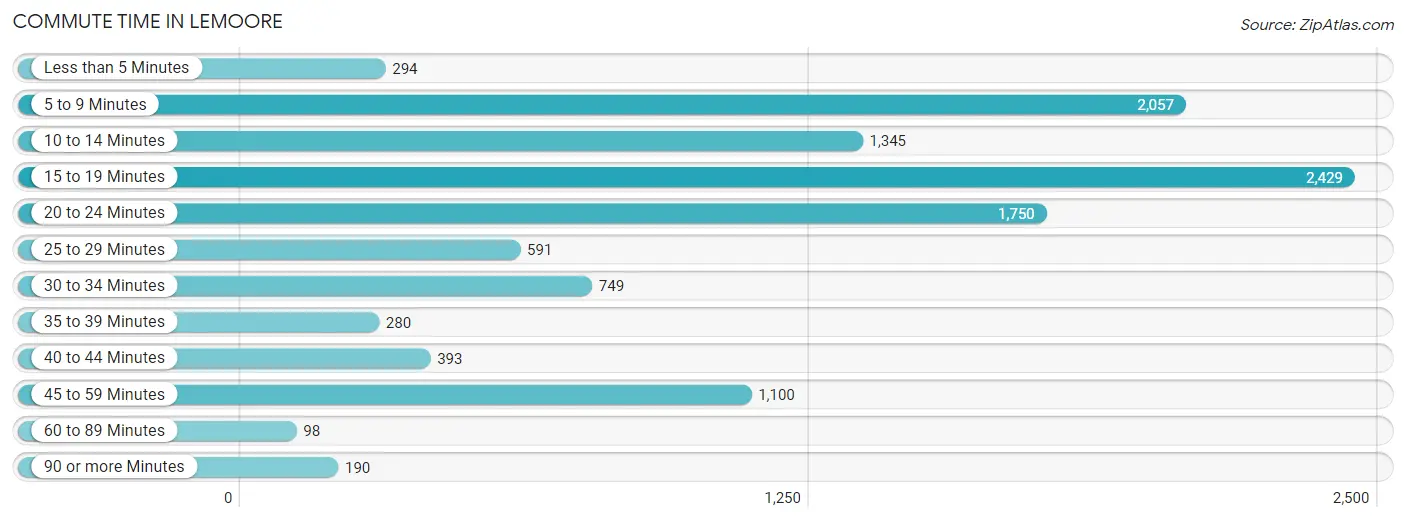
| Commute Time | # Commuters | % Commuters |
| Less than 5 Minutes | 294 | 2.6% |
| 5 to 9 Minutes | 2,057 | 18.2% |
| 10 to 14 Minutes | 1,345 | 11.9% |
| 15 to 19 Minutes | 2,429 | 21.5% |
| 20 to 24 Minutes | 1,750 | 15.5% |
| 25 to 29 Minutes | 591 | 5.2% |
| 30 to 34 Minutes | 749 | 6.6% |
| 35 to 39 Minutes | 280 | 2.5% |
| 40 to 44 Minutes | 393 | 3.5% |
| 45 to 59 Minutes | 1,100 | 9.8% |
| 60 to 89 Minutes | 98 | 0.9% |
| 90 or more Minutes | 190 | 1.7% |
Commute Time by Sex in Lemoore
The most common commute times in Lemoore are 15 to 19 minutes (1,470 commuters, 20.8%) for males and 5 to 9 minutes (971 commuters, 23.2%) for females.
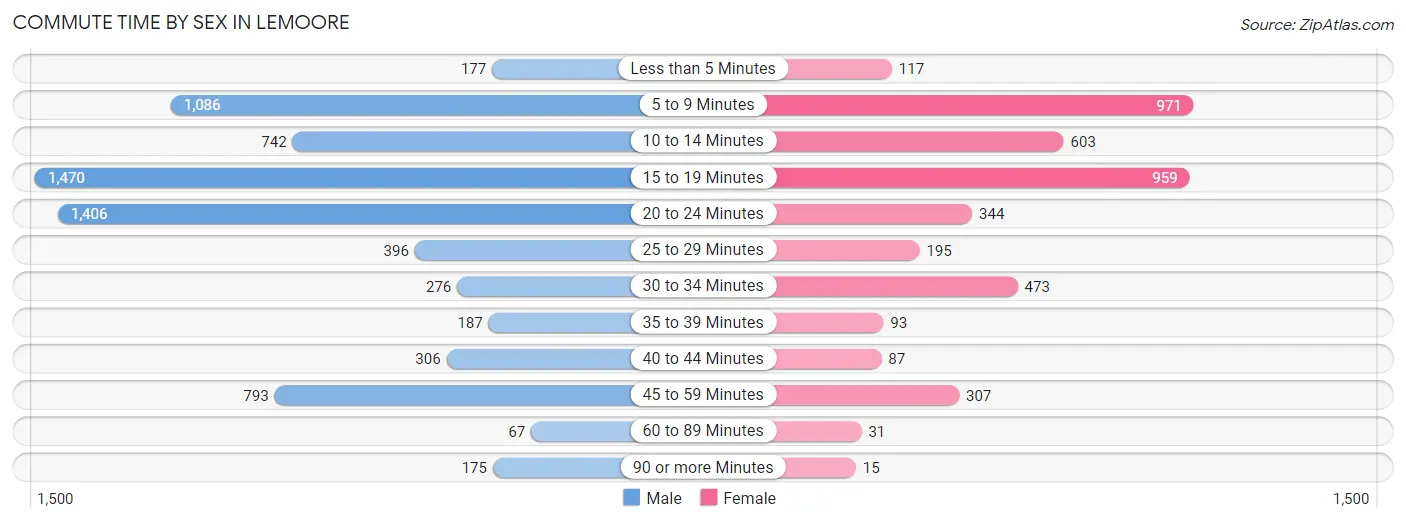
| Commute Time | Male | Female |
| Less than 5 Minutes | 177 (2.5%) | 117 (2.8%) |
| 5 to 9 Minutes | 1,086 (15.3%) | 971 (23.2%) |
| 10 to 14 Minutes | 742 (10.5%) | 603 (14.4%) |
| 15 to 19 Minutes | 1,470 (20.8%) | 959 (22.9%) |
| 20 to 24 Minutes | 1,406 (19.9%) | 344 (8.2%) |
| 25 to 29 Minutes | 396 (5.6%) | 195 (4.6%) |
| 30 to 34 Minutes | 276 (3.9%) | 473 (11.3%) |
| 35 to 39 Minutes | 187 (2.6%) | 93 (2.2%) |
| 40 to 44 Minutes | 306 (4.3%) | 87 (2.1%) |
| 45 to 59 Minutes | 793 (11.2%) | 307 (7.3%) |
| 60 to 89 Minutes | 67 (0.9%) | 31 (0.7%) |
| 90 or more Minutes | 175 (2.5%) | 15 (0.4%) |
Time of Departure to Work by Sex in Lemoore
The most frequent times of departure to work in Lemoore are 4:00 PM to 11:59 PM (1,164, 16.4%) for males and 7:30 AM to 7:59 AM (657, 15.7%) for females.
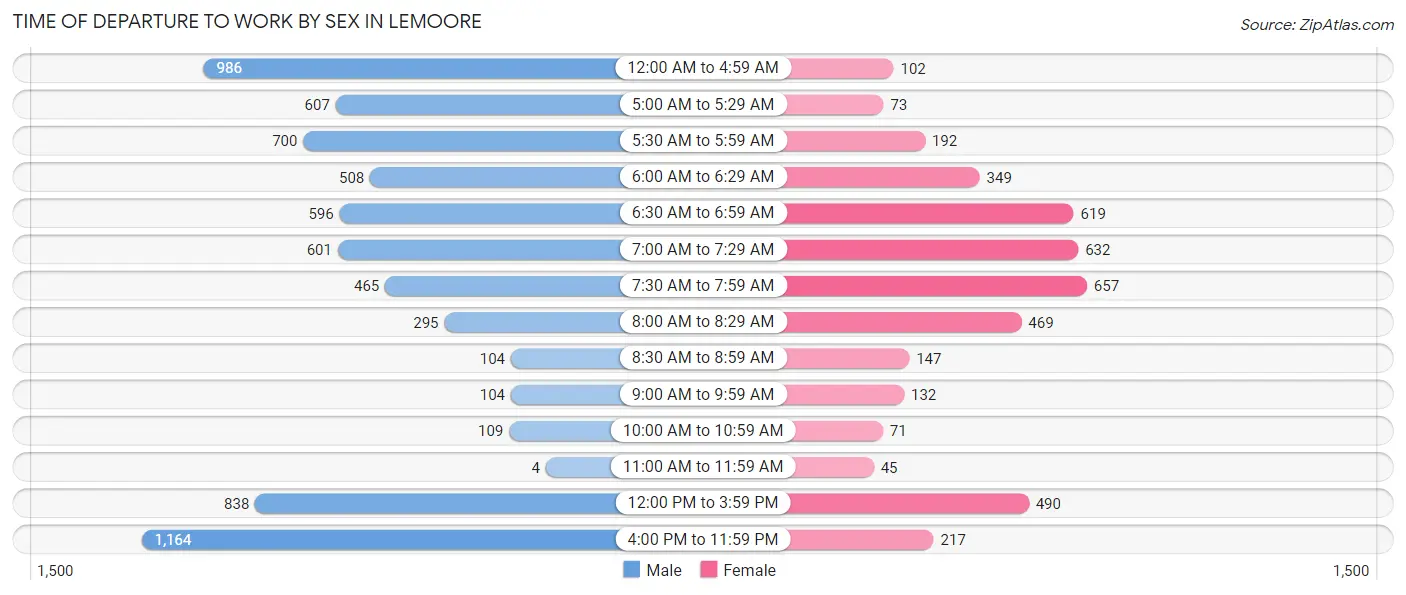
| Time of Departure | Male | Female |
| 12:00 AM to 4:59 AM | 986 (13.9%) | 102 (2.4%) |
| 5:00 AM to 5:29 AM | 607 (8.6%) | 73 (1.7%) |
| 5:30 AM to 5:59 AM | 700 (9.9%) | 192 (4.6%) |
| 6:00 AM to 6:29 AM | 508 (7.2%) | 349 (8.3%) |
| 6:30 AM to 6:59 AM | 596 (8.4%) | 619 (14.8%) |
| 7:00 AM to 7:29 AM | 601 (8.5%) | 632 (15.1%) |
| 7:30 AM to 7:59 AM | 465 (6.6%) | 657 (15.7%) |
| 8:00 AM to 8:29 AM | 295 (4.2%) | 469 (11.2%) |
| 8:30 AM to 8:59 AM | 104 (1.5%) | 147 (3.5%) |
| 9:00 AM to 9:59 AM | 104 (1.5%) | 132 (3.2%) |
| 10:00 AM to 10:59 AM | 109 (1.5%) | 71 (1.7%) |
| 11:00 AM to 11:59 AM | 4 (0.1%) | 45 (1.1%) |
| 12:00 PM to 3:59 PM | 838 (11.8%) | 490 (11.7%) |
| 4:00 PM to 11:59 PM | 1,164 (16.4%) | 217 (5.2%) |
| Total | 7,081 (100.0%) | 4,195 (100.0%) |
Housing Occupancy in Lemoore
Occupancy by Ownership in Lemoore
Of the total 8,801 dwellings in Lemoore, owner-occupied units account for 4,725 (53.7%), while renter-occupied units make up 4,076 (46.3%).
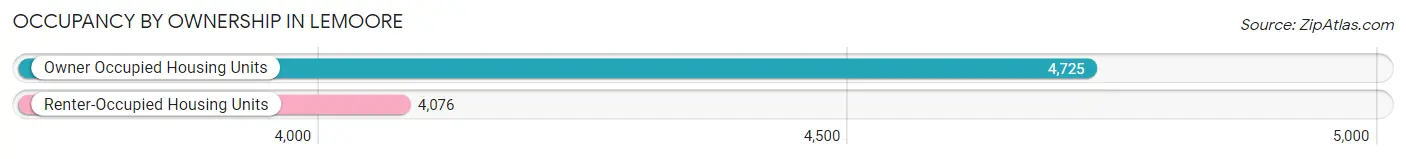
| Occupancy | # Housing Units | % Housing Units |
| Owner Occupied Housing Units | 4,725 | 53.7% |
| Renter-Occupied Housing Units | 4,076 | 46.3% |
| Total Occupied Housing Units | 8,801 | 100.0% |
Occupancy by Household Size in Lemoore
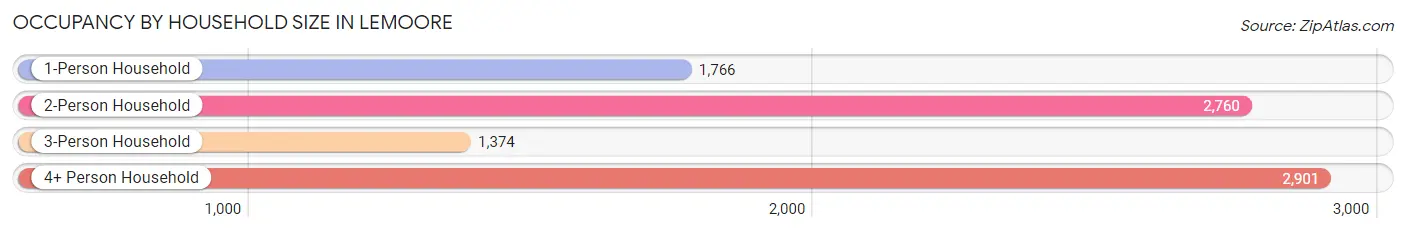
| Household Size | # Housing Units | % Housing Units |
| 1-Person Household | 1,766 | 20.1% |
| 2-Person Household | 2,760 | 31.4% |
| 3-Person Household | 1,374 | 15.6% |
| 4+ Person Household | 2,901 | 33.0% |
| Total Housing Units | 8,801 | 100.0% |
Occupancy by Ownership by Household Size in Lemoore
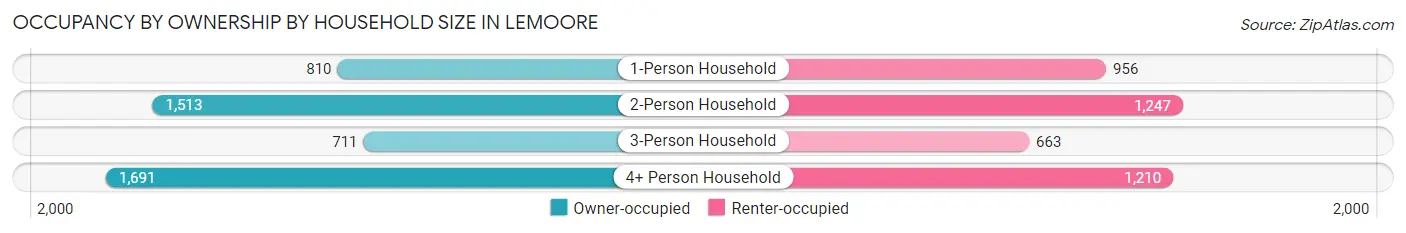
| Household Size | Owner-occupied | Renter-occupied |
| 1-Person Household | 810 (45.9%) | 956 (54.1%) |
| 2-Person Household | 1,513 (54.8%) | 1,247 (45.2%) |
| 3-Person Household | 711 (51.7%) | 663 (48.2%) |
| 4+ Person Household | 1,691 (58.3%) | 1,210 (41.7%) |
| Total Housing Units | 4,725 (53.7%) | 4,076 (46.3%) |
Occupancy by Educational Attainment in Lemoore
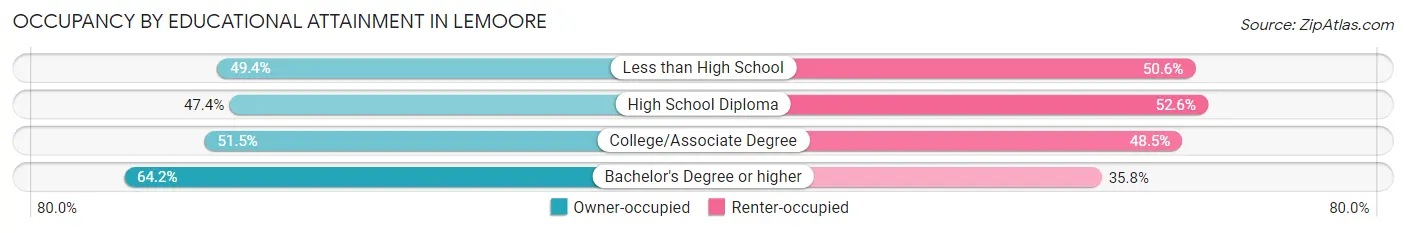
| Household Size | Owner-occupied | Renter-occupied |
| Less than High School | 423 (49.4%) | 433 (50.6%) |
| High School Diploma | 1,024 (47.4%) | 1,136 (52.6%) |
| College/Associate Degree | 1,765 (51.5%) | 1,664 (48.5%) |
| Bachelor's Degree or higher | 1,513 (64.2%) | 843 (35.8%) |
Occupancy by Age of Householder in Lemoore
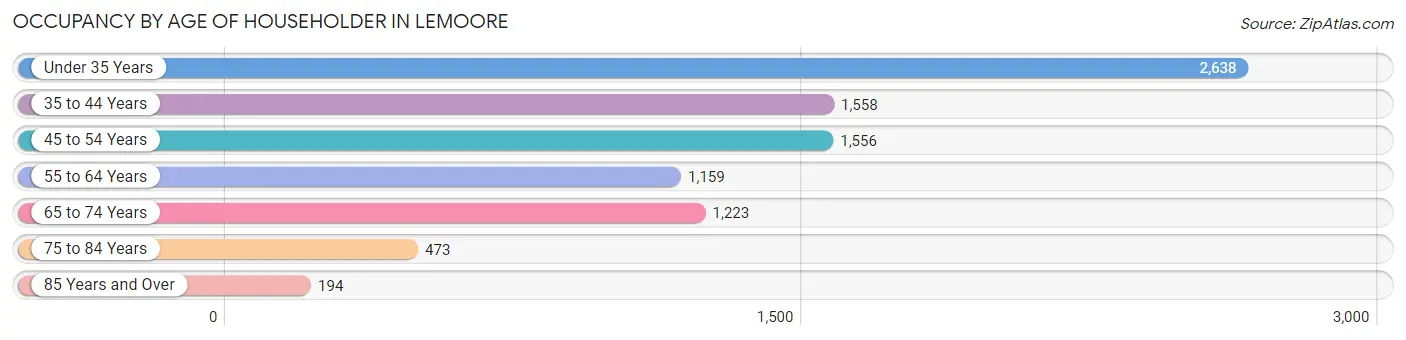
| Age Bracket | # Households | % Households |
| Under 35 Years | 2,638 | 30.0% |
| 35 to 44 Years | 1,558 | 17.7% |
| 45 to 54 Years | 1,556 | 17.7% |
| 55 to 64 Years | 1,159 | 13.2% |
| 65 to 74 Years | 1,223 | 13.9% |
| 75 to 84 Years | 473 | 5.4% |
| 85 Years and Over | 194 | 2.2% |
| Total | 8,801 | 100.0% |
Housing Finances in Lemoore
Median Income by Occupancy in Lemoore
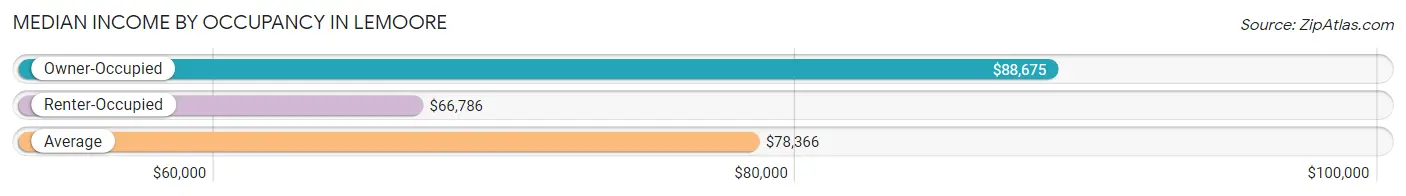
| Occupancy Type | # Households | Median Income |
| Owner-Occupied | 4,725 (53.7%) | $88,675 |
| Renter-Occupied | 4,076 (46.3%) | $66,786 |
| Average | 8,801 (100.0%) | $78,366 |
Occupancy by Householder Income Bracket in Lemoore
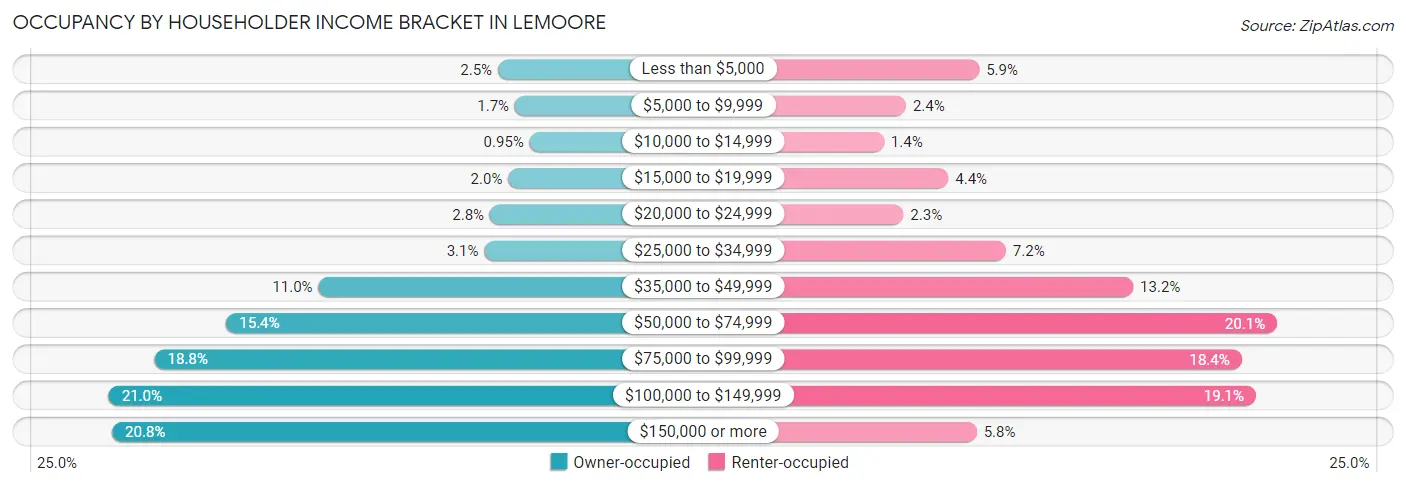
| Income Bracket | Owner-occupied | Renter-occupied |
| Less than $5,000 | 116 (2.5%) | 240 (5.9%) |
| $5,000 to $9,999 | 78 (1.7%) | 98 (2.4%) |
| $10,000 to $14,999 | 45 (0.9%) | 55 (1.3%) |
| $15,000 to $19,999 | 93 (2.0%) | 180 (4.4%) |
| $20,000 to $24,999 | 134 (2.8%) | 93 (2.3%) |
| $25,000 to $34,999 | 147 (3.1%) | 292 (7.2%) |
| $35,000 to $49,999 | 520 (11.0%) | 539 (13.2%) |
| $50,000 to $74,999 | 727 (15.4%) | 818 (20.1%) |
| $75,000 to $99,999 | 889 (18.8%) | 749 (18.4%) |
| $100,000 to $149,999 | 992 (21.0%) | 777 (19.1%) |
| $150,000 or more | 984 (20.8%) | 235 (5.8%) |
| Total | 4,725 (100.0%) | 4,076 (100.0%) |
Monthly Housing Cost Tiers in Lemoore
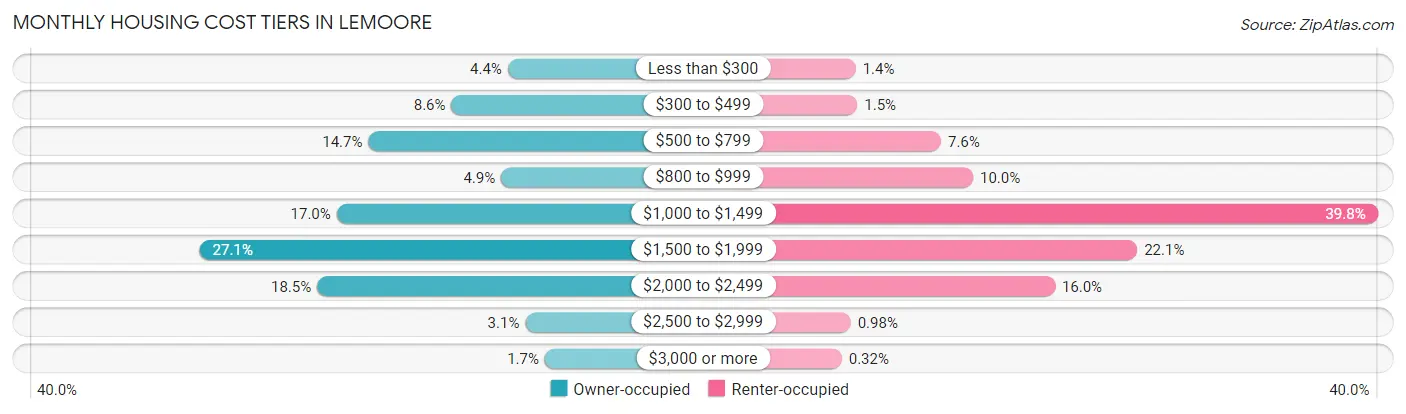
| Monthly Cost | Owner-occupied | Renter-occupied |
| Less than $300 | 209 (4.4%) | 55 (1.3%) |
| $300 to $499 | 405 (8.6%) | 60 (1.5%) |
| $500 to $799 | 694 (14.7%) | 311 (7.6%) |
| $800 to $999 | 232 (4.9%) | 407 (10.0%) |
| $1,000 to $1,499 | 804 (17.0%) | 1,621 (39.8%) |
| $1,500 to $1,999 | 1,281 (27.1%) | 900 (22.1%) |
| $2,000 to $2,499 | 872 (18.5%) | 653 (16.0%) |
| $2,500 to $2,999 | 148 (3.1%) | 40 (1.0%) |
| $3,000 or more | 80 (1.7%) | 13 (0.3%) |
| Total | 4,725 (100.0%) | 4,076 (100.0%) |
Physical Housing Characteristics in Lemoore
Housing Structures in Lemoore
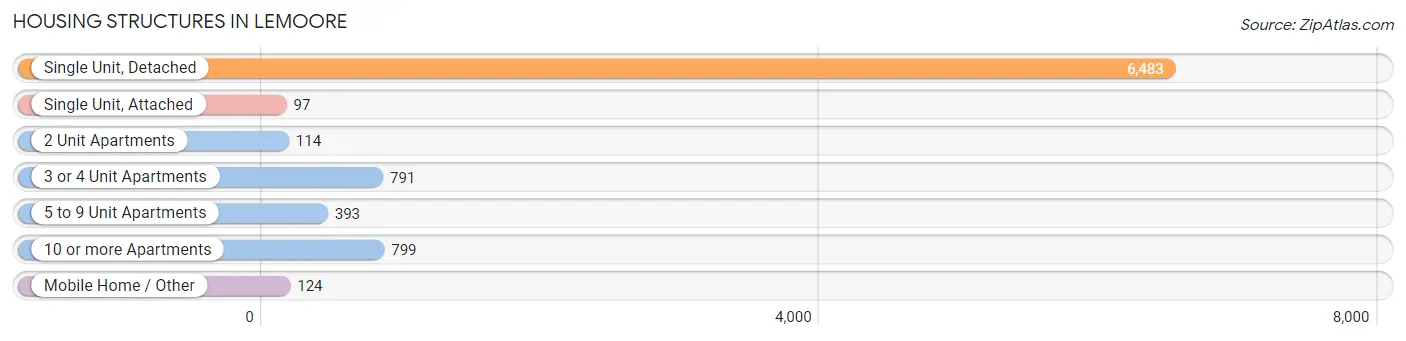
| Structure Type | # Housing Units | % Housing Units |
| Single Unit, Detached | 6,483 | 73.7% |
| Single Unit, Attached | 97 | 1.1% |
| 2 Unit Apartments | 114 | 1.3% |
| 3 or 4 Unit Apartments | 791 | 9.0% |
| 5 to 9 Unit Apartments | 393 | 4.5% |
| 10 or more Apartments | 799 | 9.1% |
| Mobile Home / Other | 124 | 1.4% |
| Total | 8,801 | 100.0% |
Housing Structures by Occupancy in Lemoore
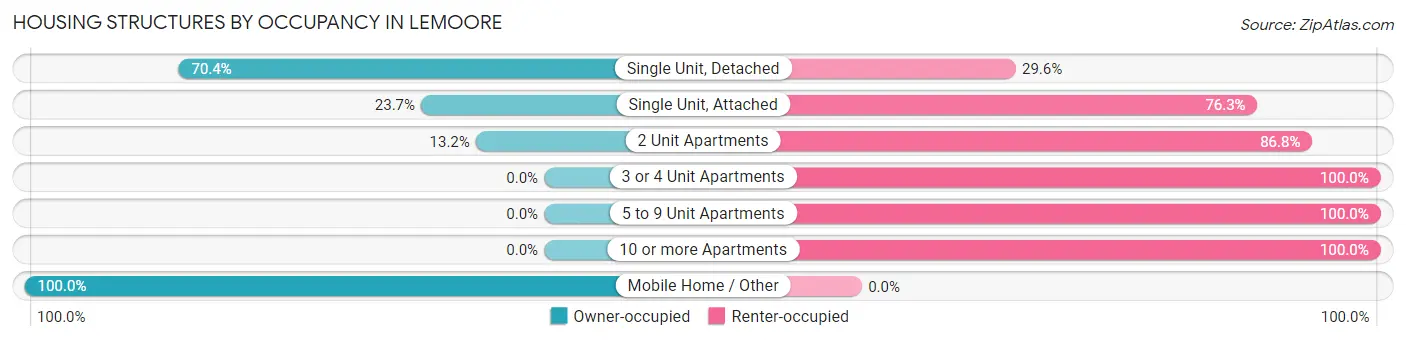
| Structure Type | Owner-occupied | Renter-occupied |
| Single Unit, Detached | 4,563 (70.4%) | 1,920 (29.6%) |
| Single Unit, Attached | 23 (23.7%) | 74 (76.3%) |
| 2 Unit Apartments | 15 (13.2%) | 99 (86.8%) |
| 3 or 4 Unit Apartments | 0 (0.0%) | 791 (100.0%) |
| 5 to 9 Unit Apartments | 0 (0.0%) | 393 (100.0%) |
| 10 or more Apartments | 0 (0.0%) | 799 (100.0%) |
| Mobile Home / Other | 124 (100.0%) | 0 (0.0%) |
| Total | 4,725 (53.7%) | 4,076 (46.3%) |
Housing Structures by Number of Rooms in Lemoore
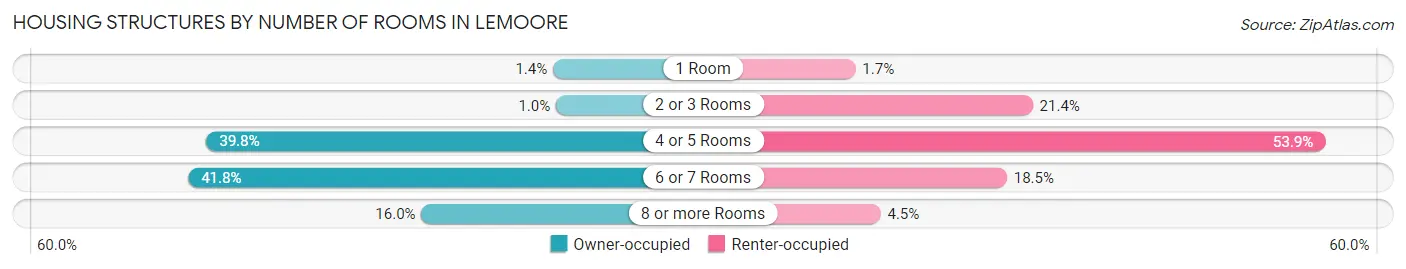
| Number of Rooms | Owner-occupied | Renter-occupied |
| 1 Room | 64 (1.3%) | 70 (1.7%) |
| 2 or 3 Rooms | 48 (1.0%) | 872 (21.4%) |
| 4 or 5 Rooms | 1,882 (39.8%) | 2,195 (53.8%) |
| 6 or 7 Rooms | 1,977 (41.8%) | 755 (18.5%) |
| 8 or more Rooms | 754 (16.0%) | 184 (4.5%) |
| Total | 4,725 (100.0%) | 4,076 (100.0%) |
Housing Structure by Heating Type in Lemoore
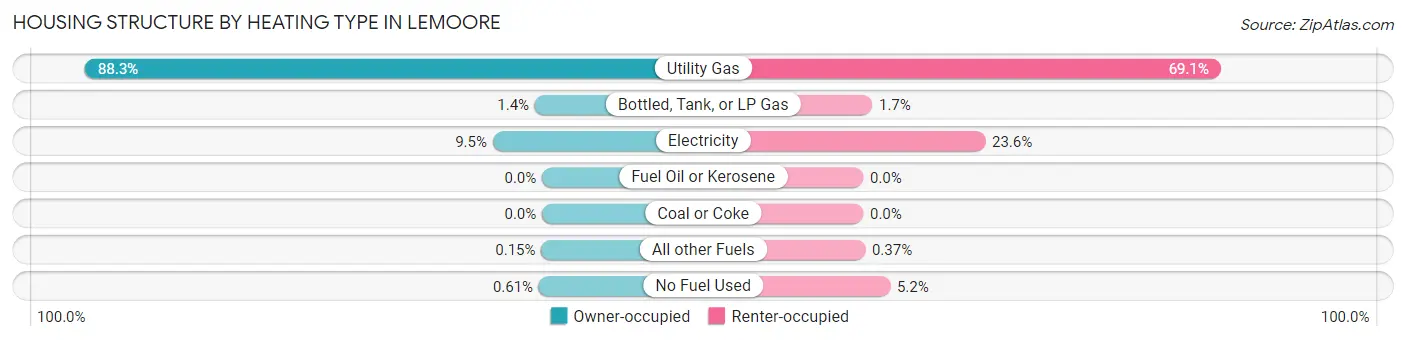
| Heating Type | Owner-occupied | Renter-occupied |
| Utility Gas | 4,174 (88.3%) | 2,817 (69.1%) |
| Bottled, Tank, or LP Gas | 65 (1.4%) | 71 (1.7%) |
| Electricity | 450 (9.5%) | 961 (23.6%) |
| Fuel Oil or Kerosene | 0 (0.0%) | 0 (0.0%) |
| Coal or Coke | 0 (0.0%) | 0 (0.0%) |
| All other Fuels | 7 (0.2%) | 15 (0.4%) |
| No Fuel Used | 29 (0.6%) | 212 (5.2%) |
| Total | 4,725 (100.0%) | 4,076 (100.0%) |
Household Vehicle Usage in Lemoore
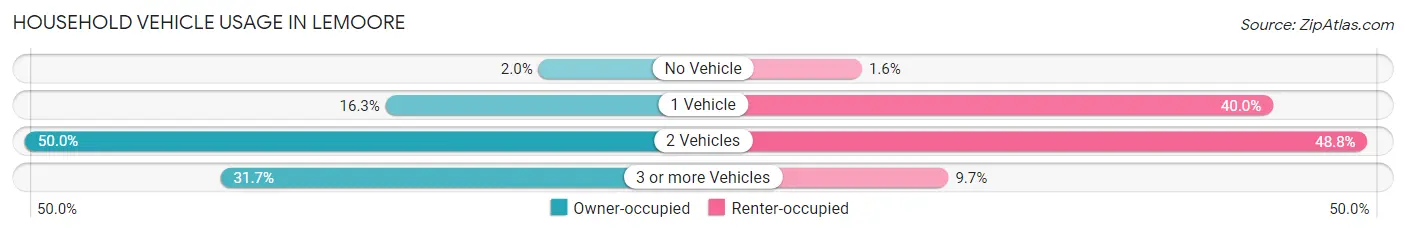
| Vehicles per Household | Owner-occupied | Renter-occupied |
| No Vehicle | 96 (2.0%) | 65 (1.6%) |
| 1 Vehicle | 770 (16.3%) | 1,629 (40.0%) |
| 2 Vehicles | 2,361 (50.0%) | 1,988 (48.8%) |
| 3 or more Vehicles | 1,498 (31.7%) | 394 (9.7%) |
| Total | 4,725 (100.0%) | 4,076 (100.0%) |
Real Estate & Mortgages in Lemoore
Real Estate and Mortgage Overview in Lemoore
| Characteristic | Without Mortgage | With Mortgage |
| Housing Units | 1,522 | 3,203 |
| Median Property Value | $283,100 | $308,600 |
| Median Household Income | $77,778 | $833 |
| Monthly Housing Costs | $547 | $80 |
| Real Estate Taxes | $1,864 | $79 |
Property Value by Mortgage Status in Lemoore
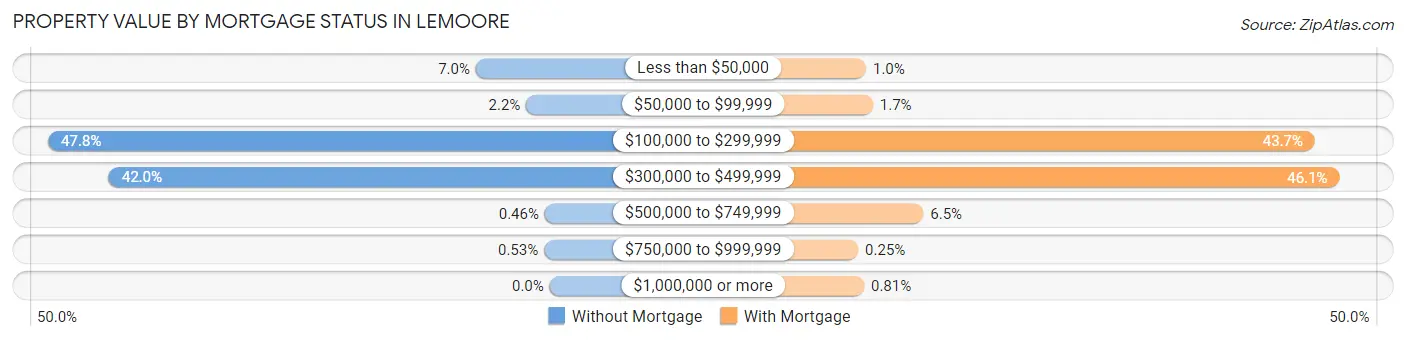
| Property Value | Without Mortgage | With Mortgage |
| Less than $50,000 | 107 (7.0%) | 32 (1.0%) |
| $50,000 to $99,999 | 34 (2.2%) | 53 (1.7%) |
| $100,000 to $299,999 | 727 (47.8%) | 1,401 (43.7%) |
| $300,000 to $499,999 | 639 (42.0%) | 1,476 (46.1%) |
| $500,000 to $749,999 | 7 (0.5%) | 207 (6.5%) |
| $750,000 to $999,999 | 8 (0.5%) | 8 (0.3%) |
| $1,000,000 or more | 0 (0.0%) | 26 (0.8%) |
| Total | 1,522 (100.0%) | 3,203 (100.0%) |
Household Income by Mortgage Status in Lemoore
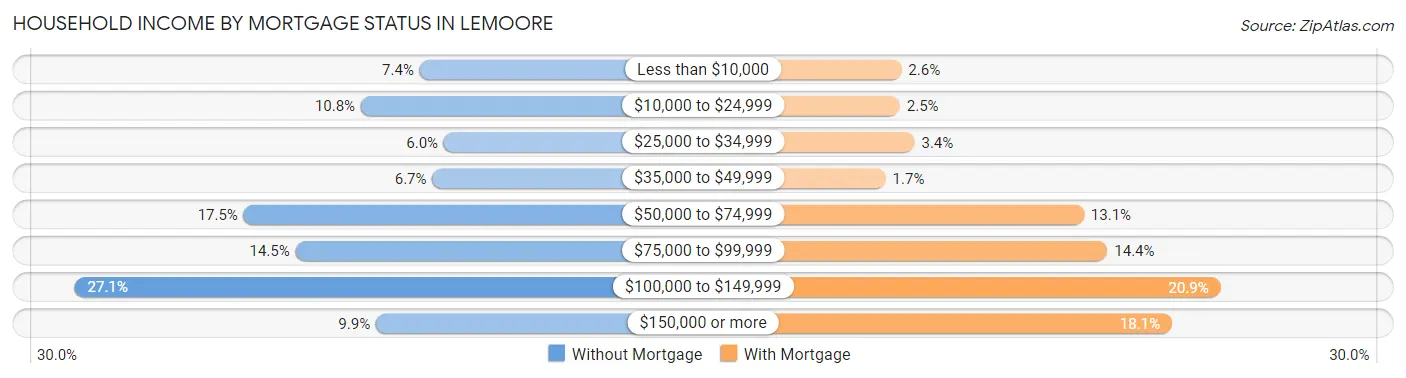
| Household Income | Without Mortgage | With Mortgage |
| Less than $10,000 | 113 (7.4%) | 84 (2.6%) |
| $10,000 to $24,999 | 164 (10.8%) | 81 (2.5%) |
| $25,000 to $34,999 | 92 (6.0%) | 108 (3.4%) |
| $35,000 to $49,999 | 102 (6.7%) | 55 (1.7%) |
| $50,000 to $74,999 | 266 (17.5%) | 418 (13.1%) |
| $75,000 to $99,999 | 221 (14.5%) | 461 (14.4%) |
| $100,000 to $149,999 | 413 (27.1%) | 668 (20.9%) |
| $150,000 or more | 151 (9.9%) | 579 (18.1%) |
| Total | 1,522 (100.0%) | 3,203 (100.0%) |
Property Value to Household Income Ratio in Lemoore
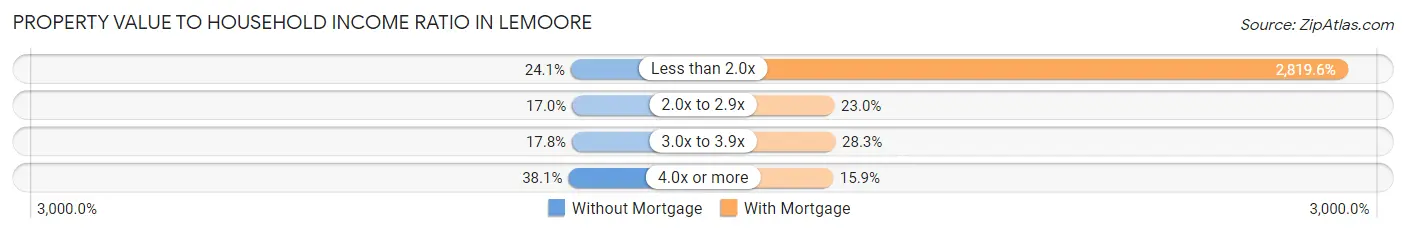
| Value-to-Income Ratio | Without Mortgage | With Mortgage |
| Less than 2.0x | 367 (24.1%) | 90,313 (2,819.6%) |
| 2.0x to 2.9x | 259 (17.0%) | 738 (23.0%) |
| 3.0x to 3.9x | 271 (17.8%) | 906 (28.3%) |
| 4.0x or more | 580 (38.1%) | 510 (15.9%) |
| Total | 1,522 (100.0%) | 3,203 (100.0%) |
Real Estate Taxes by Mortgage Status in Lemoore
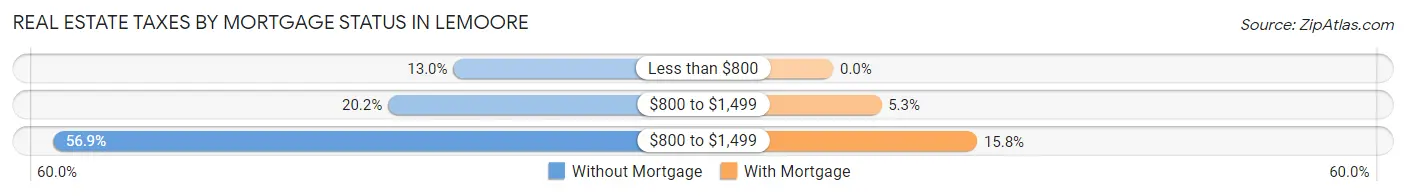
| Property Taxes | Without Mortgage | With Mortgage |
| Less than $800 | 198 (13.0%) | 0 (0.0%) |
| $800 to $1,499 | 307 (20.2%) | 169 (5.3%) |
| $800 to $1,499 | 866 (56.9%) | 505 (15.8%) |
| Total | 1,522 (100.0%) | 3,203 (100.0%) |
Health & Disability in Lemoore
Health Insurance Coverage by Age in Lemoore
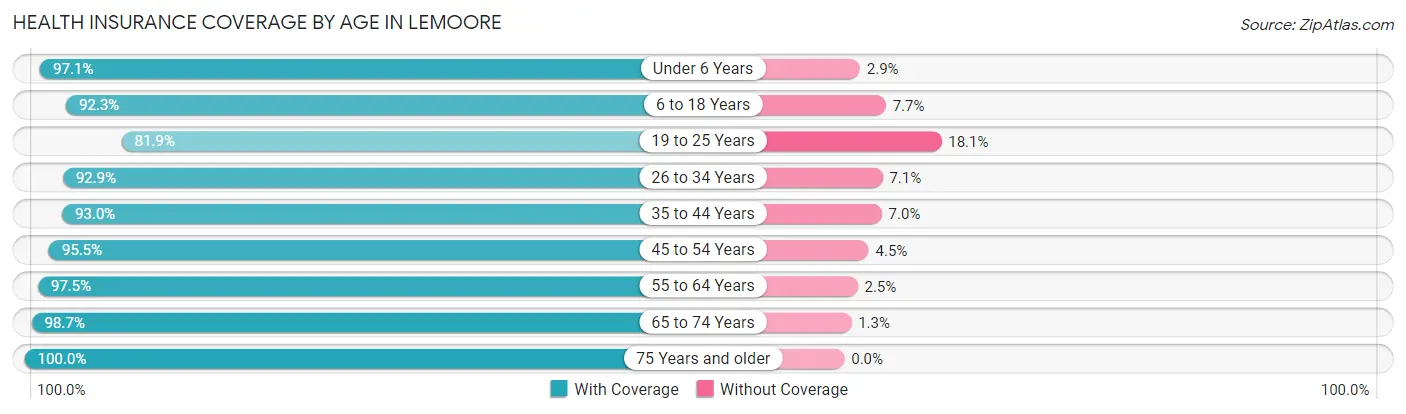
| Age Bracket | With Coverage | Without Coverage |
| Under 6 Years | 2,614 (97.1%) | 78 (2.9%) |
| 6 to 18 Years | 4,243 (92.3%) | 355 (7.7%) |
| 19 to 25 Years | 2,361 (81.9%) | 521 (18.1%) |
| 26 to 34 Years | 3,678 (92.9%) | 282 (7.1%) |
| 35 to 44 Years | 2,936 (93.0%) | 220 (7.0%) |
| 45 to 54 Years | 3,076 (95.5%) | 146 (4.5%) |
| 55 to 64 Years | 2,135 (97.5%) | 54 (2.5%) |
| 65 to 74 Years | 1,756 (98.7%) | 23 (1.3%) |
| 75 Years and older | 1,044 (100.0%) | 0 (0.0%) |
| Total | 23,843 (93.4%) | 1,679 (6.6%) |
Health Insurance Coverage by Citizenship Status in Lemoore
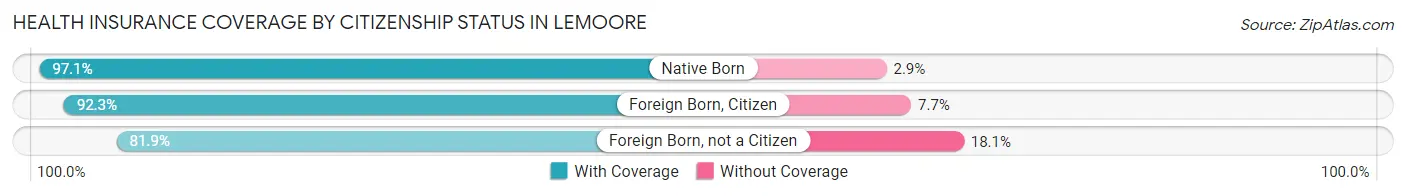
| Citizenship Status | With Coverage | Without Coverage |
| Native Born | 2,614 (97.1%) | 78 (2.9%) |
| Foreign Born, Citizen | 4,243 (92.3%) | 355 (7.7%) |
| Foreign Born, not a Citizen | 2,361 (81.9%) | 521 (18.1%) |
Health Insurance Coverage by Household Income in Lemoore
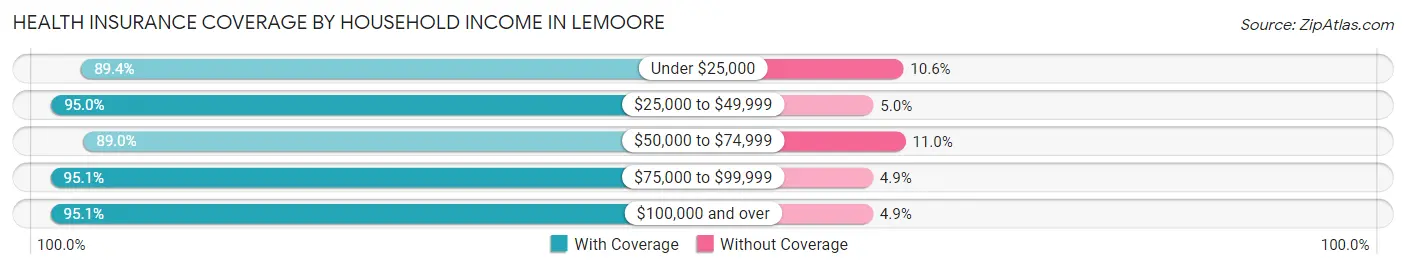
| Household Income | With Coverage | Without Coverage |
| Under $25,000 | 2,577 (89.4%) | 306 (10.6%) |
| $25,000 to $49,999 | 4,073 (95.0%) | 214 (5.0%) |
| $50,000 to $74,999 | 3,815 (89.0%) | 472 (11.0%) |
| $75,000 to $99,999 | 4,358 (95.1%) | 224 (4.9%) |
| $100,000 and over | 9,012 (95.1%) | 463 (4.9%) |
Public vs Private Health Insurance Coverage by Age in Lemoore
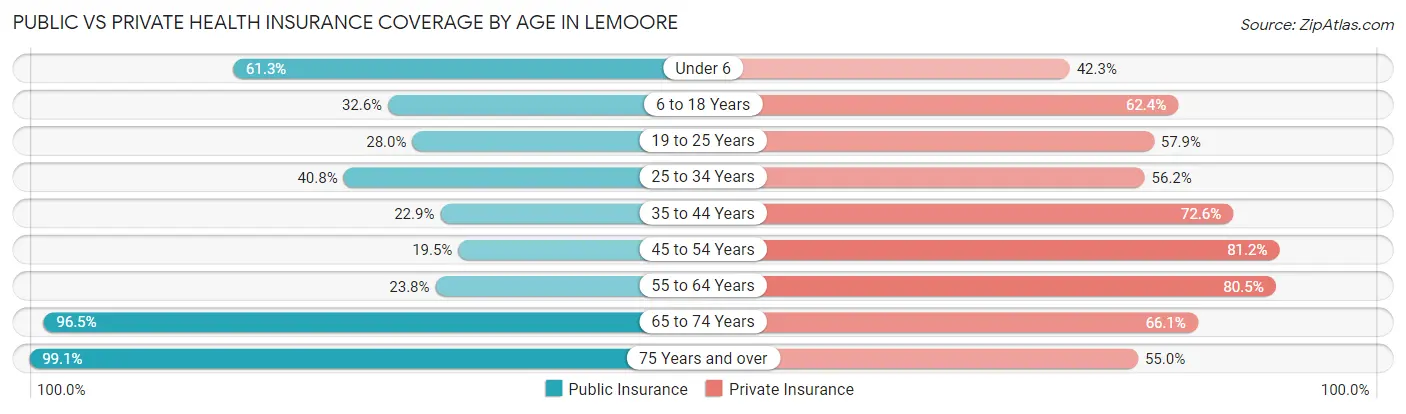
| Age Bracket | Public Insurance | Private Insurance |
| Under 6 | 1,651 (61.3%) | 1,139 (42.3%) |
| 6 to 18 Years | 1,497 (32.6%) | 2,869 (62.4%) |
| 19 to 25 Years | 808 (28.0%) | 1,669 (57.9%) |
| 25 to 34 Years | 1,616 (40.8%) | 2,226 (56.2%) |
| 35 to 44 Years | 721 (22.9%) | 2,292 (72.6%) |
| 45 to 54 Years | 629 (19.5%) | 2,616 (81.2%) |
| 55 to 64 Years | 520 (23.8%) | 1,762 (80.5%) |
| 65 to 74 Years | 1,717 (96.5%) | 1,175 (66.0%) |
| 75 Years and over | 1,035 (99.1%) | 574 (55.0%) |
| Total | 10,194 (39.9%) | 16,322 (63.9%) |
Disability Status by Sex by Age in Lemoore
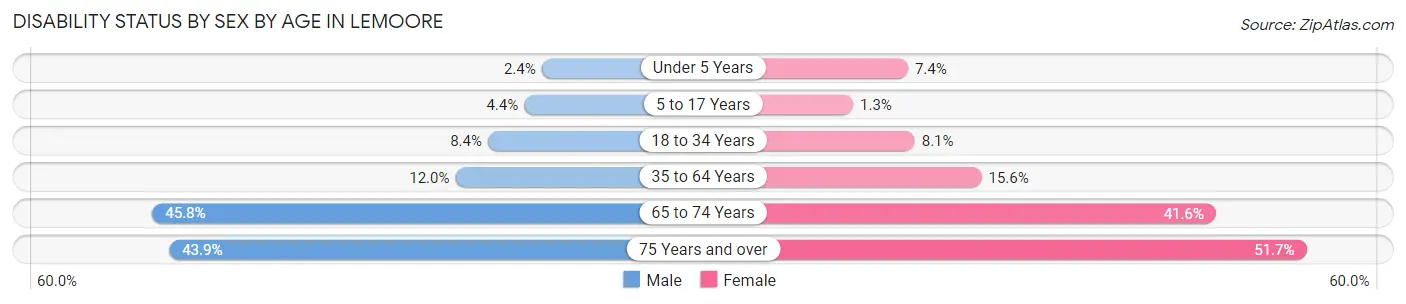
| Age Bracket | Male | Female |
| Under 5 Years | 29 (2.4%) | 77 (7.4%) |
| 5 to 17 Years | 106 (4.4%) | 30 (1.3%) |
| 18 to 34 Years | 274 (8.4%) | 312 (8.1%) |
| 35 to 64 Years | 572 (12.0%) | 593 (15.6%) |
| 65 to 74 Years | 346 (45.8%) | 426 (41.6%) |
| 75 Years and over | 230 (43.9%) | 269 (51.7%) |
Disability Class by Sex by Age in Lemoore
Disability Class: Hearing Difficulty
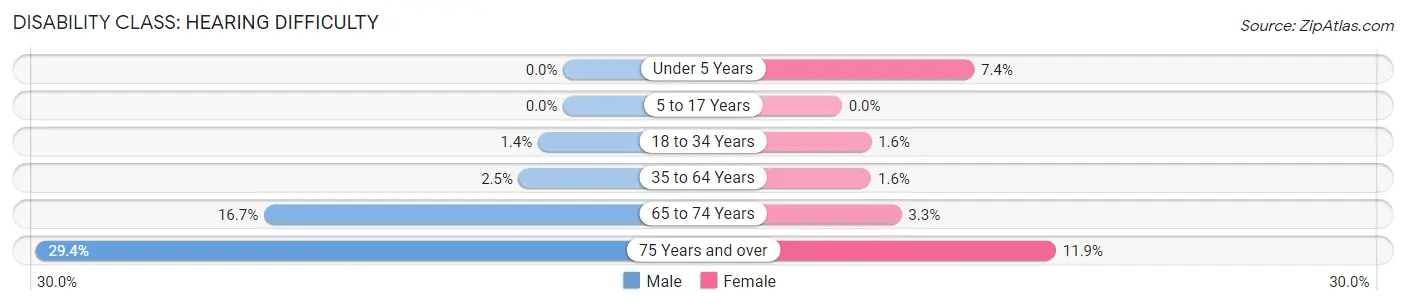
| Age Bracket | Male | Female |
| Under 5 Years | 0 (0.0%) | 77 (7.4%) |
| 5 to 17 Years | 0 (0.0%) | 0 (0.0%) |
| 18 to 34 Years | 46 (1.4%) | 63 (1.6%) |
| 35 to 64 Years | 118 (2.5%) | 62 (1.6%) |
| 65 to 74 Years | 126 (16.7%) | 34 (3.3%) |
| 75 Years and over | 154 (29.4%) | 62 (11.9%) |
Disability Class: Vision Difficulty
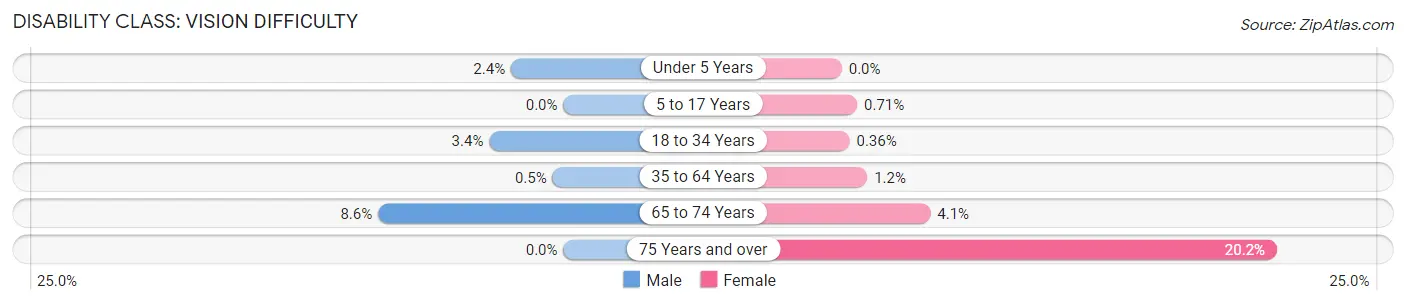
| Age Bracket | Male | Female |
| Under 5 Years | 29 (2.4%) | 0 (0.0%) |
| 5 to 17 Years | 0 (0.0%) | 17 (0.7%) |
| 18 to 34 Years | 112 (3.4%) | 14 (0.4%) |
| 35 to 64 Years | 24 (0.5%) | 45 (1.2%) |
| 65 to 74 Years | 65 (8.6%) | 42 (4.1%) |
| 75 Years and over | 0 (0.0%) | 105 (20.2%) |
Disability Class: Cognitive Difficulty
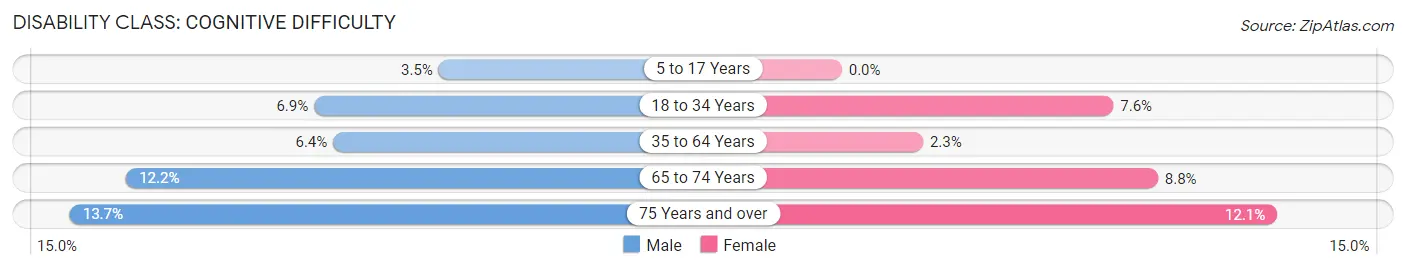
| Age Bracket | Male | Female |
| 5 to 17 Years | 84 (3.5%) | 0 (0.0%) |
| 18 to 34 Years | 226 (6.9%) | 290 (7.6%) |
| 35 to 64 Years | 305 (6.4%) | 86 (2.3%) |
| 65 to 74 Years | 92 (12.2%) | 90 (8.8%) |
| 75 Years and over | 72 (13.7%) | 63 (12.1%) |
Disability Class: Ambulatory Difficulty
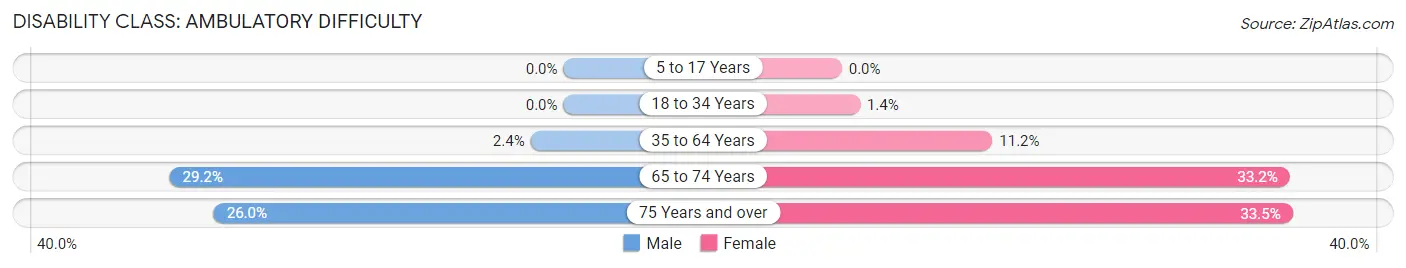
| Age Bracket | Male | Female |
| 5 to 17 Years | 0 (0.0%) | 0 (0.0%) |
| 18 to 34 Years | 0 (0.0%) | 52 (1.3%) |
| 35 to 64 Years | 116 (2.4%) | 426 (11.2%) |
| 65 to 74 Years | 221 (29.2%) | 340 (33.2%) |
| 75 Years and over | 136 (26.0%) | 174 (33.5%) |
Disability Class: Self-Care Difficulty
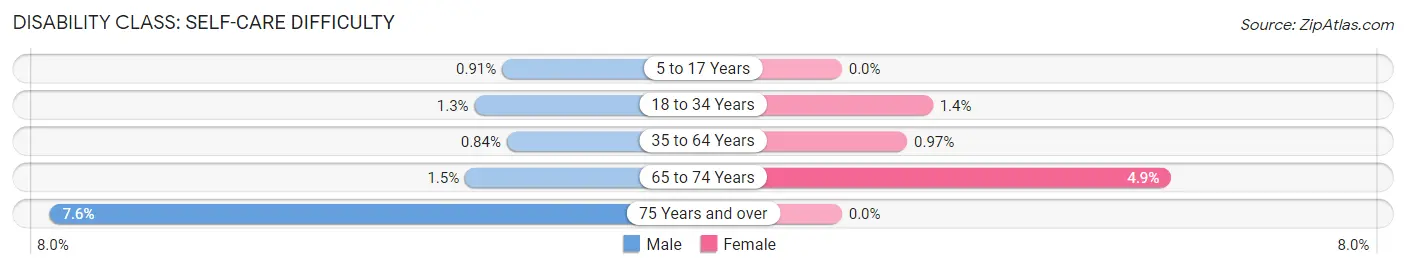
| Age Bracket | Male | Female |
| 5 to 17 Years | 22 (0.9%) | 0 (0.0%) |
| 18 to 34 Years | 43 (1.3%) | 52 (1.3%) |
| 35 to 64 Years | 40 (0.8%) | 37 (1.0%) |
| 65 to 74 Years | 11 (1.5%) | 50 (4.9%) |
| 75 Years and over | 40 (7.6%) | 0 (0.0%) |
Technology Access in Lemoore
Computing Device Access in Lemoore
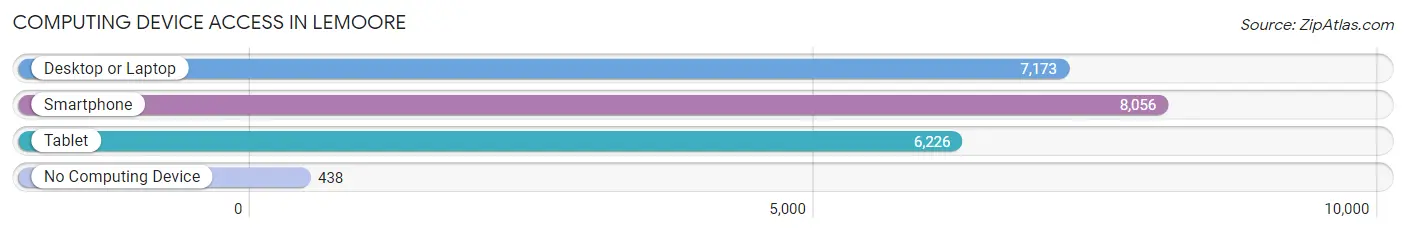
| Device Type | # Households | % Households |
| Desktop or Laptop | 7,173 | 81.5% |
| Smartphone | 8,056 | 91.5% |
| Tablet | 6,226 | 70.7% |
| No Computing Device | 438 | 5.0% |
| Total | 8,801 | 100.0% |
Internet Access in Lemoore
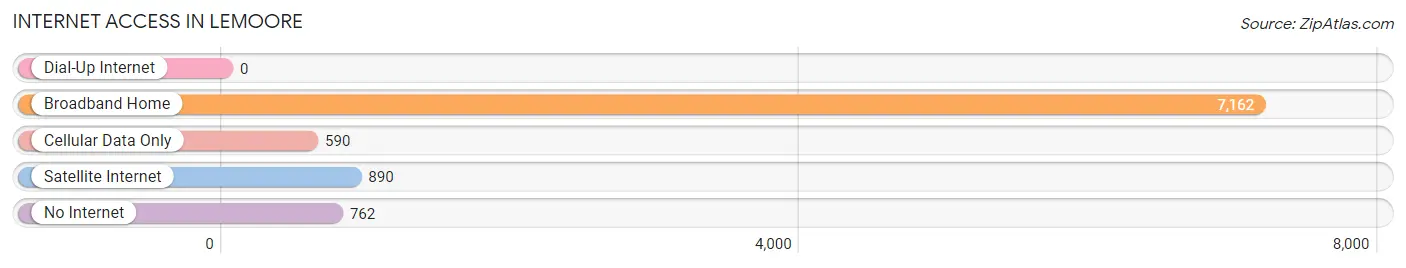
| Internet Type | # Households | % Households |
| Dial-Up Internet | 0 | 0.0% |
| Broadband Home | 7,162 | 81.4% |
| Cellular Data Only | 590 | 6.7% |
| Satellite Internet | 890 | 10.1% |
| No Internet | 762 | 8.7% |
| Total | 8,801 | 100.0% |
Lemoore Summary
Lemoore is a city located in Kings County, California, United States. It is situated in the San Joaquin Valley, approximately 230 miles (370 km) south of San Francisco and 190 miles (310 km) north of Los Angeles. The population was 24,531 at the 2010 census. The city is located 6.1 miles (9.8 km) west-southwest of Hanford, California, at an elevation of 230 feet (70 m).
History
Lemoore was founded in 1871 by Thomas L. Lemoore, a cattle rancher from Missouri. The city was incorporated in 1889. The city was named after Lemoore, who was a prominent rancher in the area.
The city was originally a farming community, but it has since grown into a major center for agriculture, manufacturing, and technology. The city is home to the Naval Air Station Lemoore, which is the largest employer in the area.
Geography
Lemoore is located at 36°20′N 119°46′W (36.33, -119.77). According to the United States Census Bureau, the city has a total area of 8.3 square miles (21.5 km2), all of it land.
Economy
Lemoore is a major center for agriculture, manufacturing, and technology. The city is home to the Naval Air Station Lemoore, which is the largest employer in the area. Other major employers include the Lemoore Union High School District, the Lemoore City School District, and the Kings County Office of Education.
The city is also home to a number of small businesses, including restaurants, retail stores, and service providers.
Demographics
As of the census of 2000, there were 24,531 people, 7,919 households, and 5,945 families residing in the city. The population density was 2,945.3 people per square mile (1,137.2/km2). There were 8,541 housing units at an average density of 1,033.3 per square mile (399.2/km2). The racial makeup of the city was 63.2% White, 4.2% African American, 1.2% Native American, 2.3% Asian, 0.3% Pacific Islander, 25.2% from other races, and 4.0% from two or more races. Hispanic or Latino of any race were 44.2% of the population.
There were 7,919 households, out of which 41.2% had children under the age of 18 living with them, 54.2% were married couples living together, 14.2% had a female householder with no husband present, and 25.2% were non-families. 20.2% of all households were made up of individuals, and 8.2% had someone living alone who was 65 years of age or older. The average household size was 3.06 and the average family size was 3.51.
In the city, the population was spread out, with 32.2% under the age of 18, 10.2% from 18 to 24, 29.2% from 25 to 44, 17.9% from 45 to 64, and 10.5% who were 65 years of age or older. The median age was 30 years. For every 100 females, there were 101.2 males. For every 100 females age 18 and over, there were 99.2 males.
The median income for a household in the city was $35,945, and the median income for a family was $40,945. Males had a median income of $30,945 versus $22,945 for females. The per capita income for the city was $14,945. About 14.2% of families and 17.2% of the population were below the poverty line, including 22.2% of those under age 18 and 8.2% of those age 65 or over.
Common Questions
What is Per Capita Income in Lemoore?
Per Capita income in Lemoore is $31,373.
What is the Median Family Income in Lemoore?
Median Family Income in Lemoore is $77,663.
What is the Median Household income in Lemoore?
Median Household Income in Lemoore is $78,366.
What is Income or Wage Gap in Lemoore?
Income or Wage Gap in Lemoore is 43.8%.
Women in Lemoore earn 56.2 cents for every dollar earned by a man.
What is Family Income Deficit in Lemoore?
Family Income Deficit in Lemoore is $14,197.
Families that are below poverty line in Lemoore earn $14,197 less on average than the poverty threshold level.
What is Inequality or Gini Index in Lemoore?
Inequality or Gini Index in Lemoore is 0.39.
What is the Total Population of Lemoore?
Total Population of Lemoore is 26,955.
What is the Total Male Population of Lemoore?
Total Male Population of Lemoore is 14,174.
What is the Total Female Population of Lemoore?
Total Female Population of Lemoore is 12,781.
What is the Ratio of Males per 100 Females in Lemoore?
There are 110.90 Males per 100 Females in Lemoore.
What is the Ratio of Females per 100 Males in Lemoore?
There are 90.17 Females per 100 Males in Lemoore.
What is the Median Population Age in Lemoore?
Median Population Age in Lemoore is 31.8 Years.
What is the Average Family Size in Lemoore
Average Family Size in Lemoore is 3.5 People.
What is the Average Household Size in Lemoore
Average Household Size in Lemoore is 3.1 People.
How Large is the Labor Force in Lemoore?
There are 13,111 People in the Labor Forcein in Lemoore.
What is the Percentage of People in the Labor Force in Lemoore?
63.2% of People are in the Labor Force in Lemoore.
What is the Unemployment Rate in Lemoore?
Unemployment Rate in Lemoore is 11.0%.