Cities with the Highest Percentage of Korean Population in Florida
RELATED REPORTS & OPTIONS
Korean
Florida
Compare Cities
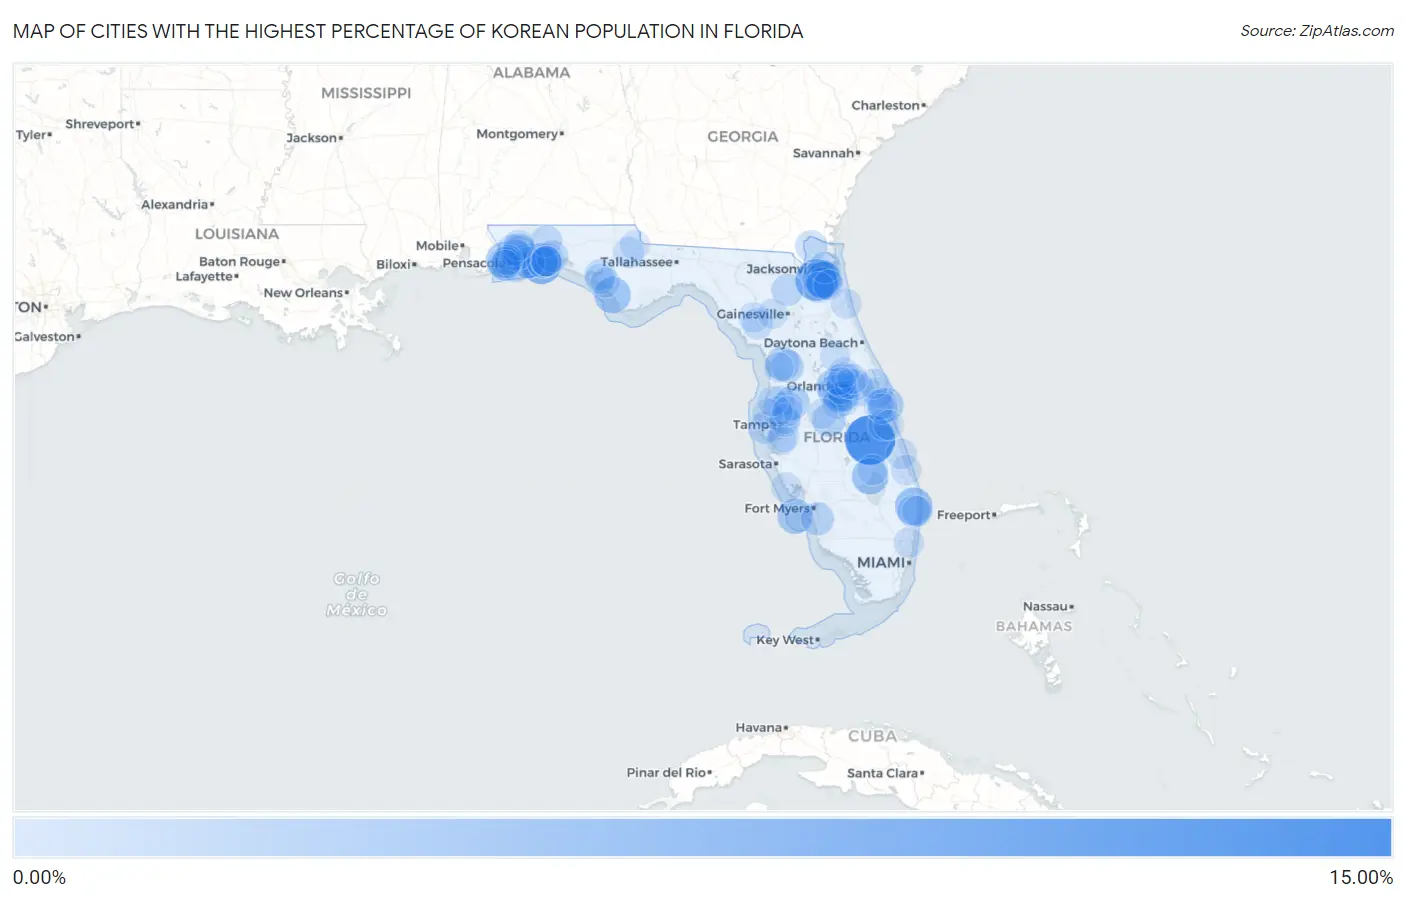
Map of Cities with the Highest Percentage of Korean Population in Florida
0.00%
15.00%
Cities with the Highest Percentage of Korean Population in Florida
| City | Korean | vs State | vs National | |
| 1. | Yeehaw Junction | 13.43% | 0.79%(+12.6)#1 | 1.31%(+12.1)#198 |
| 2. | Oakleaf Plantation | 8.51% | 0.79%(+7.72)#2 | 1.31%(+7.20)#328 |
| 3. | Mary Esther | 7.89% | 0.79%(+7.09)#3 | 1.31%(+6.58)#371 |
| 4. | Bellair Meadowbrook Terrace | 5.96% | 0.79%(+5.16)#4 | 1.31%(+4.65)#542 |
| 5. | Gun Club Estates | 5.88% | 0.79%(+5.09)#5 | 1.31%(+4.57)#551 |
| 6. | Orange Park | 5.65% | 0.79%(+4.85)#6 | 1.31%(+4.34)#587 |
| 7. | Mexico Beach | 5.31% | 0.79%(+4.52)#7 | 1.31%(+4.00)#641 |
| 8. | Buckhead Ridge | 5.16% | 0.79%(+4.36)#8 | 1.31%(+3.85)#665 |
| 9. | Bellview | 4.89% | 0.79%(+4.10)#9 | 1.31%(+3.58)#717 |
| 10. | Captiva | 4.64% | 0.79%(+3.84)#10 | 1.31%(+3.33)#767 |
| 11. | Patrick Afb | 4.23% | 0.79%(+3.44)#11 | 1.31%(+2.92)#859 |
| 12. | Holley | 4.11% | 0.79%(+3.32)#12 | 1.31%(+2.80)#892 |
| 13. | Gotha | 4.09% | 0.79%(+3.29)#13 | 1.31%(+2.78)#897 |
| 14. | Myrtle Grove | 3.93% | 0.79%(+3.14)#14 | 1.31%(+2.62)#950 |
| 15. | Pasadena Hills | 3.89% | 0.79%(+3.09)#15 | 1.31%(+2.58)#959 |
| 16. | Citrus Hills | 3.81% | 0.79%(+3.02)#16 | 1.31%(+2.50)#986 |
| 17. | Dundee | 3.54% | 0.79%(+2.74)#17 | 1.31%(+2.23)#1,093 |
| 18. | Hurlburt Field | 3.38% | 0.79%(+2.59)#18 | 1.31%(+2.07)#1,151 |
| 19. | Bagdad | 3.37% | 0.79%(+2.58)#19 | 1.31%(+2.06)#1,159 |
| 20. | Three Oaks | 3.20% | 0.79%(+2.41)#20 | 1.31%(+1.89)#1,233 |
| 21. | Inverness | 3.14% | 0.79%(+2.35)#21 | 1.31%(+1.83)#1,252 |
| 22. | Milton | 3.12% | 0.79%(+2.33)#22 | 1.31%(+1.81)#1,266 |
| 23. | Pensacola Station | 3.09% | 0.79%(+2.30)#23 | 1.31%(+1.78)#1,285 |
| 24. | Eglin Afb | 3.04% | 0.79%(+2.25)#24 | 1.31%(+1.73)#1,309 |
| 25. | Wedgefield | 2.89% | 0.79%(+2.09)#25 | 1.31%(+1.58)#1,399 |
| 26. | Atlantis | 2.89% | 0.79%(+2.09)#26 | 1.31%(+1.58)#1,400 |
| 27. | Fern Park | 2.86% | 0.79%(+2.07)#27 | 1.31%(+1.55)#1,418 |
| 28. | Wright | 2.76% | 0.79%(+1.96)#28 | 1.31%(+1.45)#1,485 |
| 29. | South Highpoint | 2.72% | 0.79%(+1.93)#29 | 1.31%(+1.41)#1,508 |
| 30. | Lake Butler | 2.71% | 0.79%(+1.92)#30 | 1.31%(+1.40)#1,513 |
| 31. | Fleming Island | 2.64% | 0.79%(+1.84)#31 | 1.31%(+1.33)#1,564 |
| 32. | Bay Hill | 2.64% | 0.79%(+1.84)#32 | 1.31%(+1.33)#1,566 |
| 33. | Oriole Beach | 2.54% | 0.79%(+1.75)#33 | 1.31%(+1.23)#1,622 |
| 34. | Niceville | 2.52% | 0.79%(+1.73)#34 | 1.31%(+1.21)#1,636 |
| 35. | Hilliard | 2.52% | 0.79%(+1.73)#35 | 1.31%(+1.21)#1,637 |
| 36. | Crestview | 2.48% | 0.79%(+1.69)#36 | 1.31%(+1.17)#1,658 |
| 37. | Jacksonville | 2.44% | 0.79%(+1.65)#37 | 1.31%(+1.13)#1,690 |
| 38. | Southchase | 2.43% | 0.79%(+1.63)#38 | 1.31%(+1.12)#1,695 |
| 39. | Navarre | 2.29% | 0.79%(+1.49)#39 | 1.31%(+0.977)#1,812 |
| 40. | Pace | 2.27% | 0.79%(+1.48)#40 | 1.31%(+0.962)#1,824 |
| 41. | Buenaventura Lakes | 2.24% | 0.79%(+1.44)#41 | 1.31%(+0.928)#1,853 |
| 42. | Tropical Park | 2.17% | 0.79%(+1.38)#42 | 1.31%(+0.861)#1,918 |
| 43. | Lynn Haven | 2.16% | 0.79%(+1.37)#43 | 1.31%(+0.853)#1,928 |
| 44. | Chiefland | 2.13% | 0.79%(+1.34)#44 | 1.31%(+0.823)#1,951 |
| 45. | Williamsburg | 2.13% | 0.79%(+1.33)#45 | 1.31%(+0.818)#1,958 |
| 46. | Hunters Creek | 2.12% | 0.79%(+1.33)#46 | 1.31%(+0.811)#1,971 |
| 47. | Wesley Chapel | 2.10% | 0.79%(+1.31)#47 | 1.31%(+0.790)#2,005 |
| 48. | Asbury Lake | 2.06% | 0.79%(+1.27)#48 | 1.31%(+0.752)#2,038 |
| 49. | Apollo Beach | 1.96% | 0.79%(+1.17)#49 | 1.31%(+0.653)#2,140 |
| 50. | Fort Walton Beach | 1.94% | 0.79%(+1.15)#50 | 1.31%(+0.631)#2,160 |
| 51. | Edgewood | 1.93% | 0.79%(+1.14)#51 | 1.31%(+0.624)#2,170 |
| 52. | Palm Bay | 1.93% | 0.79%(+1.14)#52 | 1.31%(+0.621)#2,174 |
| 53. | Avalon | 1.93% | 0.79%(+1.14)#53 | 1.31%(+0.621)#2,175 |
| 54. | Lake Lorraine | 1.93% | 0.79%(+1.13)#54 | 1.31%(+0.616)#2,179 |
| 55. | St Lucie Village | 1.91% | 0.79%(+1.11)#55 | 1.31%(+0.599)#2,203 |
| 56. | Altha | 1.90% | 0.79%(+1.11)#56 | 1.31%(+0.595)#2,210 |
| 57. | North Merritt Island | 1.90% | 0.79%(+1.11)#57 | 1.31%(+0.594)#2,211 |
| 58. | Bithlo | 1.87% | 0.79%(+1.07)#58 | 1.31%(+0.556)#2,265 |
| 59. | East Lake Orient Park | 1.84% | 0.79%(+1.04)#59 | 1.31%(+0.526)#2,303 |
| 60. | Connerton | 1.83% | 0.79%(+1.04)#60 | 1.31%(+0.523)#2,308 |
| 61. | Meadow Woods | 1.82% | 0.79%(+1.02)#61 | 1.31%(+0.510)#2,327 |
| 62. | Sharpes | 1.81% | 0.79%(+1.02)#62 | 1.31%(+0.504)#2,334 |
| 63. | Point Baker | 1.78% | 0.79%(+0.988)#63 | 1.31%(+0.472)#2,375 |
| 64. | Temple Terrace | 1.77% | 0.79%(+0.976)#64 | 1.31%(+0.461)#2,395 |
| 65. | Campbell | 1.77% | 0.79%(+0.974)#65 | 1.31%(+0.458)#2,400 |
| 66. | Okeechobee | 1.77% | 0.79%(+0.973)#66 | 1.31%(+0.457)#2,403 |
| 67. | Ruskin | 1.74% | 0.79%(+0.947)#67 | 1.31%(+0.432)#2,445 |
| 68. | St Augustine Shores | 1.74% | 0.79%(+0.946)#68 | 1.31%(+0.430)#2,447 |
| 69. | Merritt Island | 1.74% | 0.79%(+0.943)#69 | 1.31%(+0.428)#2,454 |
| 70. | Jensen Beach | 1.70% | 0.79%(+0.906)#70 | 1.31%(+0.391)#2,507 |
| 71. | West Pensacola | 1.69% | 0.79%(+0.900)#71 | 1.31%(+0.384)#2,522 |
| 72. | Union Park | 1.67% | 0.79%(+0.878)#72 | 1.31%(+0.363)#2,559 |
| 73. | Lockhart | 1.66% | 0.79%(+0.870)#73 | 1.31%(+0.355)#2,573 |
| 74. | Cedar Grove | 1.66% | 0.79%(+0.861)#74 | 1.31%(+0.346)#2,583 |
| 75. | Viera West | 1.64% | 0.79%(+0.847)#75 | 1.31%(+0.332)#2,605 |
| 76. | South Palm Beach | 1.64% | 0.79%(+0.844)#76 | 1.31%(+0.328)#2,613 |
| 77. | Fruit Cove | 1.63% | 0.79%(+0.833)#77 | 1.31%(+0.317)#2,637 |
| 78. | Fanning Springs | 1.62% | 0.79%(+0.821)#78 | 1.31%(+0.306)#2,652 |
| 79. | Cheval | 1.61% | 0.79%(+0.820)#79 | 1.31%(+0.305)#2,656 |
| 80. | Titusville | 1.59% | 0.79%(+0.798)#80 | 1.31%(+0.283)#2,687 |
| 81. | Whitfield Cdp Santa Rosa County | 1.59% | 0.79%(+0.795)#81 | 1.31%(+0.280)#2,692 |
| 82. | Lake Mary | 1.57% | 0.79%(+0.780)#82 | 1.31%(+0.265)#2,714 |
| 83. | East Lake | 1.57% | 0.79%(+0.778)#83 | 1.31%(+0.263)#2,721 |
| 84. | Lake Alfred | 1.57% | 0.79%(+0.777)#84 | 1.31%(+0.261)#2,724 |
| 85. | Newberry | 1.57% | 0.79%(+0.773)#85 | 1.31%(+0.257)#2,734 |
| 86. | Brent | 1.57% | 0.79%(+0.773)#86 | 1.31%(+0.257)#2,735 |
| 87. | Broadview Park | 1.56% | 0.79%(+0.763)#87 | 1.31%(+0.247)#2,760 |
| 88. | Oviedo | 1.53% | 0.79%(+0.740)#88 | 1.31%(+0.225)#2,800 |
| 89. | Lake Kathryn | 1.53% | 0.79%(+0.736)#89 | 1.31%(+0.221)#2,807 |
| 90. | Shalimar | 1.53% | 0.79%(+0.730)#90 | 1.31%(+0.215)#2,822 |
| 91. | Palm Shores | 1.52% | 0.79%(+0.727)#91 | 1.31%(+0.212)#2,826 |
| 92. | Warrington | 1.52% | 0.79%(+0.726)#92 | 1.31%(+0.211)#2,829 |
| 93. | Callaway | 1.51% | 0.79%(+0.714)#93 | 1.31%(+0.199)#2,858 |
| 94. | Englewood | 1.50% | 0.79%(+0.707)#94 | 1.31%(+0.192)#2,864 |
| 95. | Grant Valkaria | 1.48% | 0.79%(+0.688)#95 | 1.31%(+0.172)#2,903 |
| 96. | Moon Lake | 1.47% | 0.79%(+0.677)#96 | 1.31%(+0.161)#2,932 |
| 97. | Lecanto | 1.47% | 0.79%(+0.675)#97 | 1.31%(+0.160)#2,937 |
| 98. | Fairview Shores | 1.46% | 0.79%(+0.667)#98 | 1.31%(+0.152)#2,944 |
| 99. | Pebble Creek | 1.46% | 0.79%(+0.663)#99 | 1.31%(+0.148)#2,952 |
| 100. | Grand Ridge | 1.46% | 0.79%(+0.662)#100 | 1.31%(+0.146)#2,954 |
Common Questions
What are the Top 10 Cities with the Highest Percentage of Korean Population in Florida?
Top 10 Cities with the Highest Percentage of Korean Population in Florida are:
#1
13.43%
#2
8.51%
#3
7.89%
#4
5.96%
#5
5.88%
#6
5.65%
#7
5.31%
#8
5.16%
#9
4.89%
#10
4.64%
What city has the Highest Percentage of Korean Population in Florida?
Yeehaw Junction has the Highest Percentage of Korean Population in Florida with 13.43%.
What is the Percentage of Korean Population in the State of Florida?
Percentage of Korean Population in Florida is 0.79%.
What is the Percentage of Korean Population in the United States?
Percentage of Korean Population in the United States is 1.31%.