Porterville, CA Map & Demographics
Porterville Map
Porterville Overview
$22,910
PER CAPITA INCOME
$57,258
AVG FAMILY INCOME
$55,785
AVG HOUSEHOLD INCOME
22.7%
WAGE / INCOME GAP [ % ]
77.3¢/ $1
WAGE / INCOME GAP [ $ ]
$11,111
FAMILY INCOME DEFICIT
0.43
INEQUALITY / GINI INDEX
62,491
TOTAL POPULATION
31,694
MALE POPULATION
30,797
FEMALE POPULATION
102.91
MALES / 100 FEMALES
97.17
FEMALES / 100 MALES
31.3
MEDIAN AGE
3.7
AVG FAMILY SIZE
3.2
AVG HOUSEHOLD SIZE
28,583
LABOR FORCE [ PEOPLE ]
62.1%
PERCENT IN LABOR FORCE
10.1%
UNEMPLOYMENT RATE
Porterville Area Codes
Income in Porterville
Income Overview in Porterville
Per Capita Income in Porterville is $22,910, while median incomes of families and households are $57,258 and $55,785 respectively.
| Characteristic | Number | Measure |
| Per Capita Income | 62,491 | $22,910 |
| Median Family Income | 14,558 | $57,258 |
| Mean Family Income | 14,558 | $77,262 |
| Median Household Income | 18,925 | $55,785 |
| Mean Household Income | 18,925 | $72,468 |
| Income Deficit | 14,558 | $11,111 |
| Wage / Income Gap (%) | 62,491 | 22.72% |
| Wage / Income Gap ($) | 62,491 | 77.28¢ per $1 |
| Gini / Inequality Index | 62,491 | 0.43 |
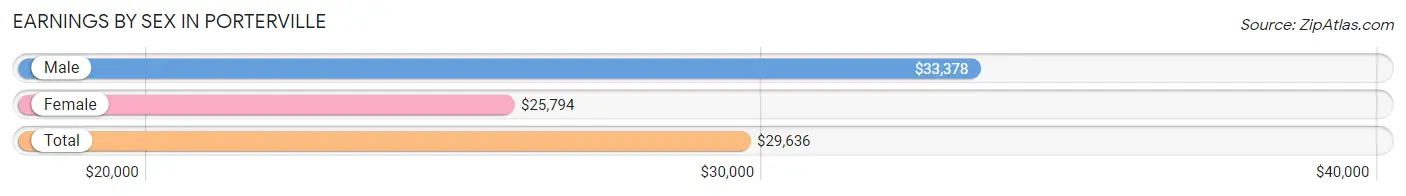
Earnings by Sex in Porterville
Average Earnings in Porterville are $29,636, $33,378 for men and $25,794 for women, a difference of 22.7%.
| Sex | Number | Average Earnings |
| Male | 15,546 (54.4%) | $33,378 |
| Female | 13,053 (45.6%) | $25,794 |
| Total | 28,599 (100.0%) | $29,636 |
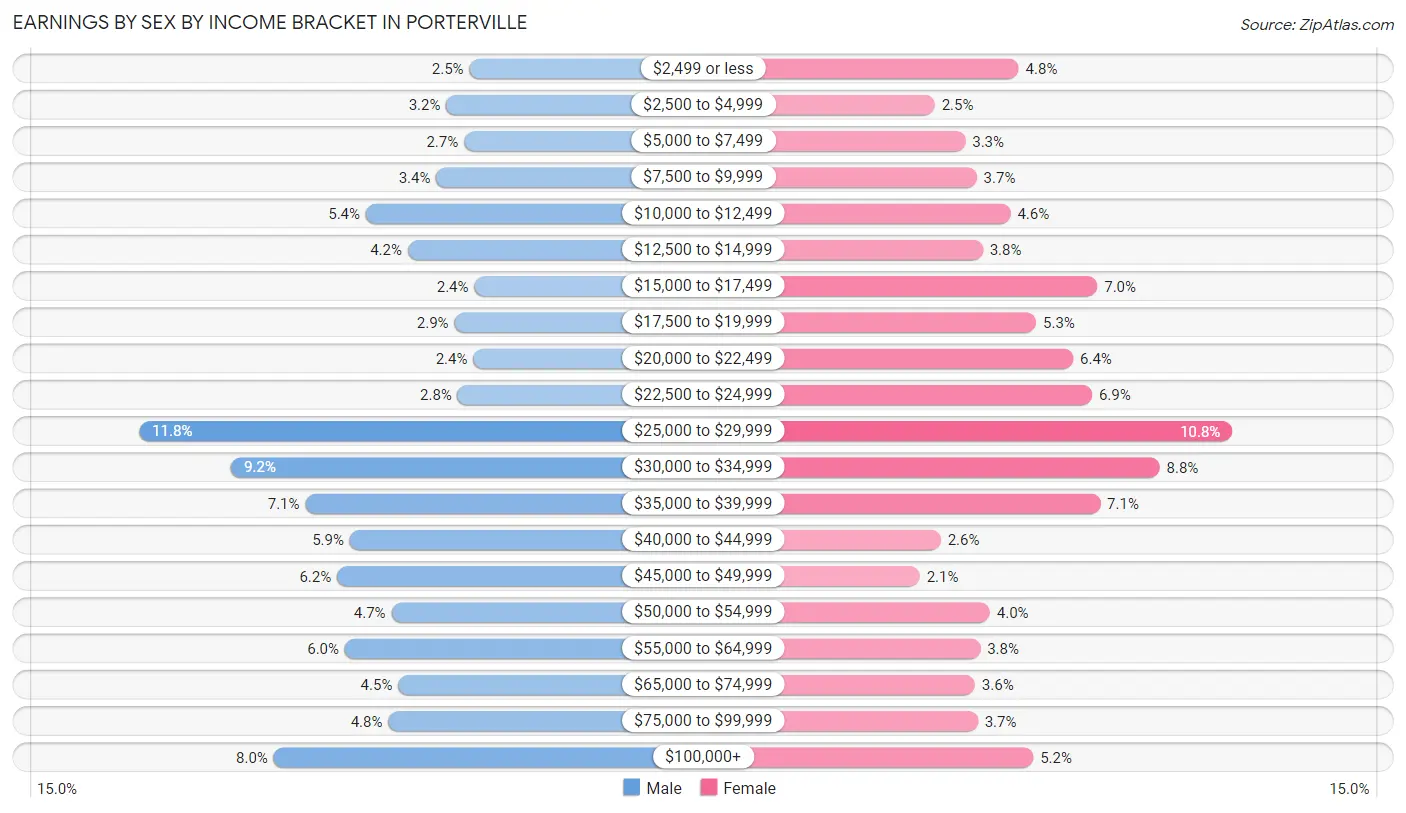
Earnings by Sex by Income Bracket in Porterville
The most common earnings brackets in Porterville are $25,000 to $29,999 for men (1,831 | 11.8%) and $25,000 to $29,999 for women (1,413 | 10.8%).
| Income | Male | Female |
| $2,499 or less | 389 (2.5%) | 630 (4.8%) |
| $2,500 to $4,999 | 489 (3.2%) | 322 (2.5%) |
| $5,000 to $7,499 | 412 (2.6%) | 435 (3.3%) |
| $7,500 to $9,999 | 533 (3.4%) | 476 (3.6%) |
| $10,000 to $12,499 | 841 (5.4%) | 600 (4.6%) |
| $12,500 to $14,999 | 657 (4.2%) | 498 (3.8%) |
| $15,000 to $17,499 | 367 (2.4%) | 919 (7.0%) |
| $17,500 to $19,999 | 454 (2.9%) | 694 (5.3%) |
| $20,000 to $22,499 | 372 (2.4%) | 830 (6.4%) |
| $22,500 to $24,999 | 440 (2.8%) | 900 (6.9%) |
| $25,000 to $29,999 | 1,831 (11.8%) | 1,413 (10.8%) |
| $30,000 to $34,999 | 1,431 (9.2%) | 1,147 (8.8%) |
| $35,000 to $39,999 | 1,105 (7.1%) | 929 (7.1%) |
| $40,000 to $44,999 | 911 (5.9%) | 345 (2.6%) |
| $45,000 to $49,999 | 967 (6.2%) | 267 (2.1%) |
| $50,000 to $54,999 | 729 (4.7%) | 525 (4.0%) |
| $55,000 to $64,999 | 933 (6.0%) | 489 (3.7%) |
| $65,000 to $74,999 | 699 (4.5%) | 470 (3.6%) |
| $75,000 to $99,999 | 743 (4.8%) | 480 (3.7%) |
| $100,000+ | 1,243 (8.0%) | 684 (5.2%) |
| Total | 15,546 (100.0%) | 13,053 (100.0%) |
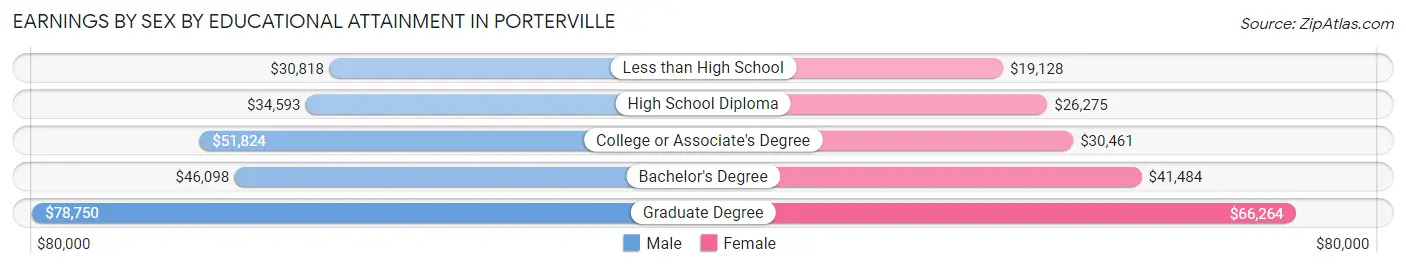
Earnings by Sex by Educational Attainment in Porterville
Average earnings in Porterville are $38,153 for men and $28,670 for women, a difference of 24.9%. Men with an educational attainment of graduate degree enjoy the highest average annual earnings of $78,750, while those with less than high school education earn the least with $30,818. Women with an educational attainment of graduate degree earn the most with the average annual earnings of $66,264, while those with less than high school education have the smallest earnings of $19,128.
| Educational Attainment | Male Income | Female Income |
| Less than High School | $30,818 | $19,128 |
| High School Diploma | $34,593 | $26,275 |
| College or Associate's Degree | $51,824 | $30,461 |
| Bachelor's Degree | $46,098 | $41,484 |
| Graduate Degree | $78,750 | $66,264 |
| Total | $38,153 | $28,670 |
Family Income in Porterville
Family Income Brackets in Porterville
According to the Porterville family income data, there are 2,955 families falling into the $50,000 to $74,999 income range, which is the most common income bracket and makes up 20.3% of all families. Conversely, the $10,000 to $14,999 income bracket is the least frequent group with only 262 families (1.8%) belonging to this category.
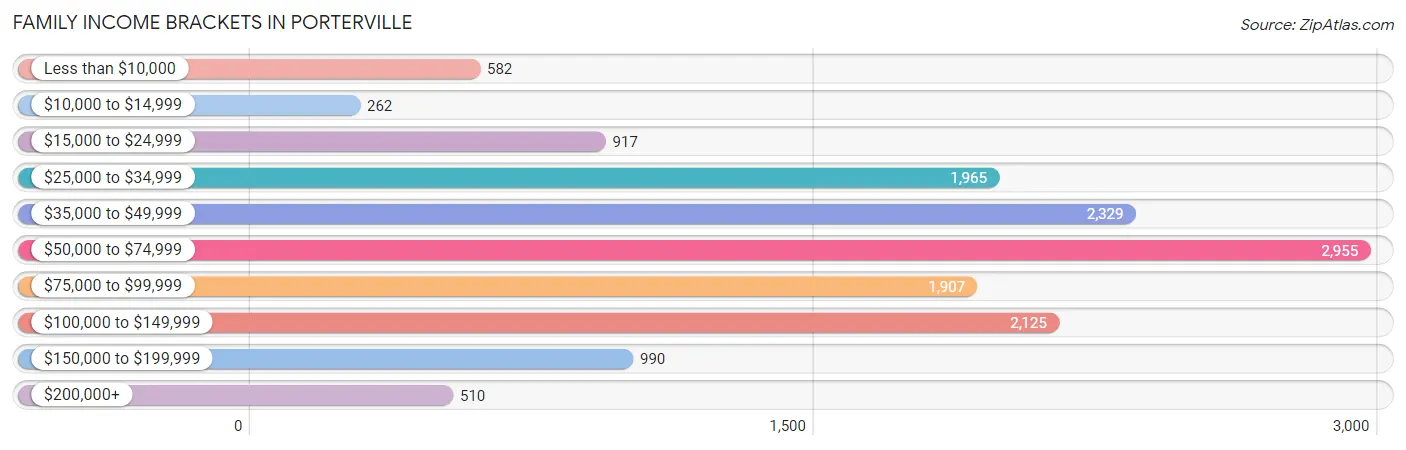
| Income Bracket | # Families | % Families |
| Less than $10,000 | 582 | 4.0% |
| $10,000 to $14,999 | 262 | 1.8% |
| $15,000 to $24,999 | 917 | 6.3% |
| $25,000 to $34,999 | 1,965 | 13.5% |
| $35,000 to $49,999 | 2,329 | 16.0% |
| $50,000 to $74,999 | 2,955 | 20.3% |
| $75,000 to $99,999 | 1,907 | 13.1% |
| $100,000 to $149,999 | 2,125 | 14.6% |
| $150,000 to $199,999 | 990 | 6.8% |
| $200,000+ | 510 | 3.5% |
Family Income by Famaliy Size in Porterville
7+ person families (669 | 4.6%) account for the highest median family income in Porterville with $121,128 per family, while 2-person families (4,810 | 33.0%) have the highest median income of $25,207 per family member.
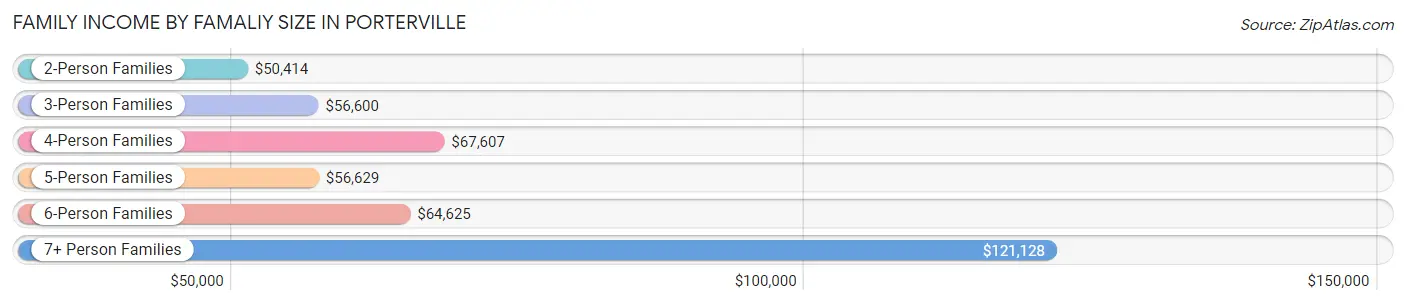
| Income Bracket | # Families | Median Income |
| 2-Person Families | 4,810 (33.0%) | $50,414 |
| 3-Person Families | 3,522 (24.2%) | $56,600 |
| 4-Person Families | 2,444 (16.8%) | $67,607 |
| 5-Person Families | 2,339 (16.1%) | $56,629 |
| 6-Person Families | 774 (5.3%) | $64,625 |
| 7+ Person Families | 669 (4.6%) | $121,128 |
| Total | 14,558 (100.0%) | $57,258 |
Family Income by Number of Earners in Porterville
The median family income in Porterville is $57,258, with families comprising 3+ earners (2,026) having the highest median family income of $104,091, while families with no earners (1,576) have the lowest median family income of $27,228, accounting for 13.9% and 10.8% of families, respectively.
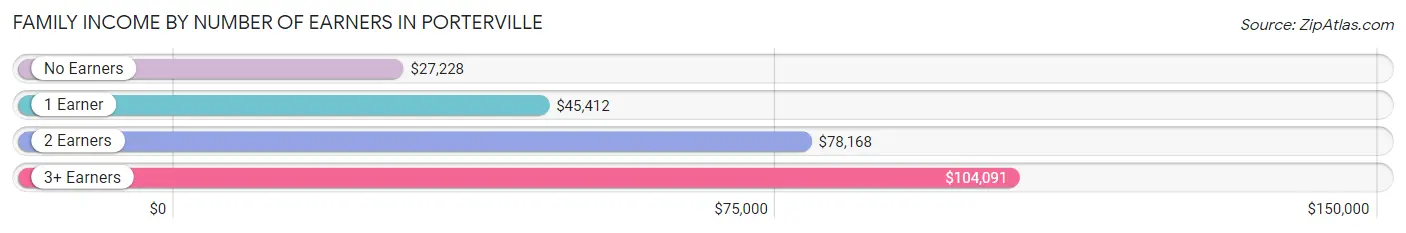
| Number of Earners | # Families | Median Income |
| No Earners | 1,576 (10.8%) | $27,228 |
| 1 Earner | 5,903 (40.6%) | $45,412 |
| 2 Earners | 5,053 (34.7%) | $78,168 |
| 3+ Earners | 2,026 (13.9%) | $104,091 |
| Total | 14,558 (100.0%) | $57,258 |
Household Income in Porterville
Household Income Brackets in Porterville
With 3,766 households falling in the category, the $50,000 to $74,999 income range is the most frequent in Porterville, accounting for 19.9% of all households. In contrast, only 662 households (3.5%) fall into the $200,000+ income bracket, making it the least populous group.
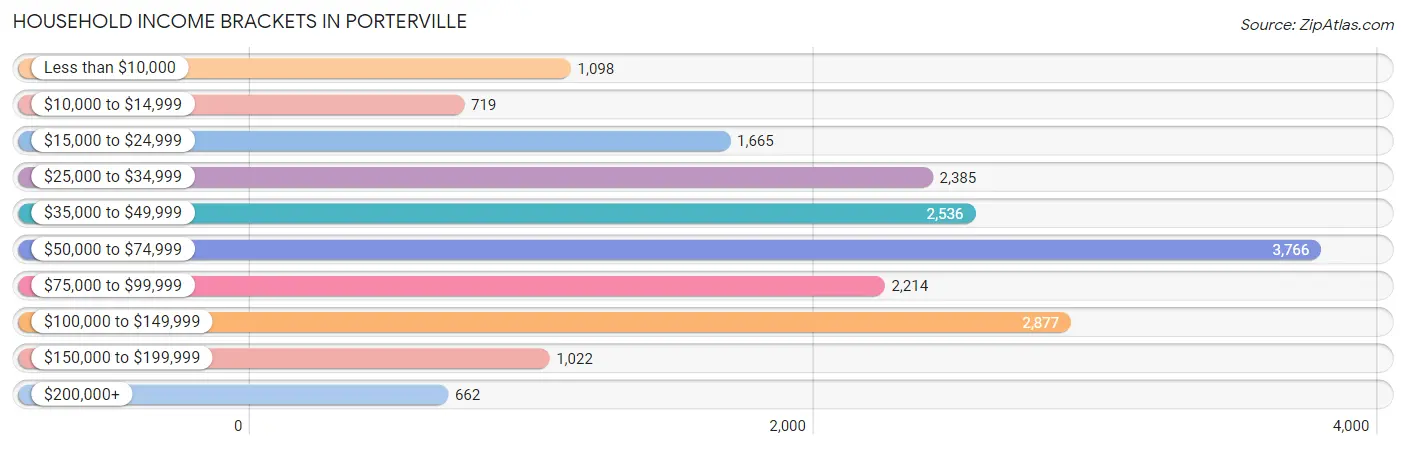
| Income Bracket | # Households | % Households |
| Less than $10,000 | 1,098 | 5.8% |
| $10,000 to $14,999 | 719 | 3.8% |
| $15,000 to $24,999 | 1,665 | 8.8% |
| $25,000 to $34,999 | 2,385 | 12.6% |
| $35,000 to $49,999 | 2,536 | 13.4% |
| $50,000 to $74,999 | 3,766 | 19.9% |
| $75,000 to $99,999 | 2,214 | 11.7% |
| $100,000 to $149,999 | 2,877 | 15.2% |
| $150,000 to $199,999 | 1,022 | 5.4% |
| $200,000+ | 662 | 3.5% |
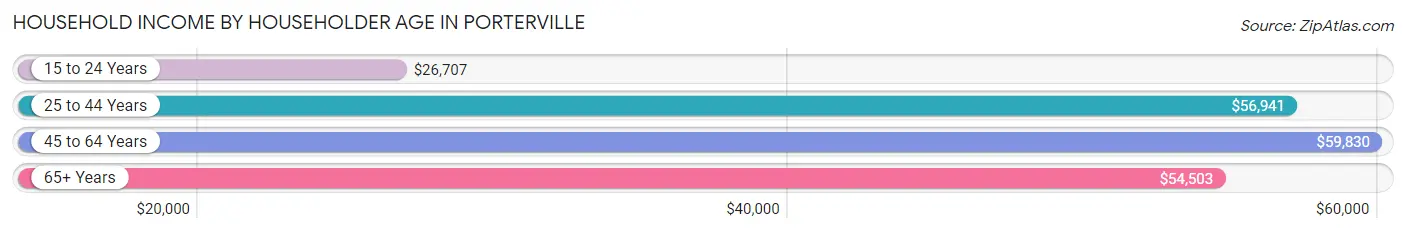
Household Income by Householder Age in Porterville
The median household income in Porterville is $55,785, with the highest median household income of $59,830 found in the 45 to 64 years age bracket for the primary householder. A total of 6,344 households (33.5%) fall into this category. Meanwhile, the 15 to 24 years age bracket for the primary householder has the lowest median household income of $26,707, with 1,124 households (5.9%) in this group.
| Income Bracket | # Households | Median Income |
| 15 to 24 Years | 1,124 (5.9%) | $26,707 |
| 25 to 44 Years | 7,506 (39.7%) | $56,941 |
| 45 to 64 Years | 6,344 (33.5%) | $59,830 |
| 65+ Years | 3,951 (20.9%) | $54,503 |
| Total | 18,925 (100.0%) | $55,785 |
Poverty in Porterville
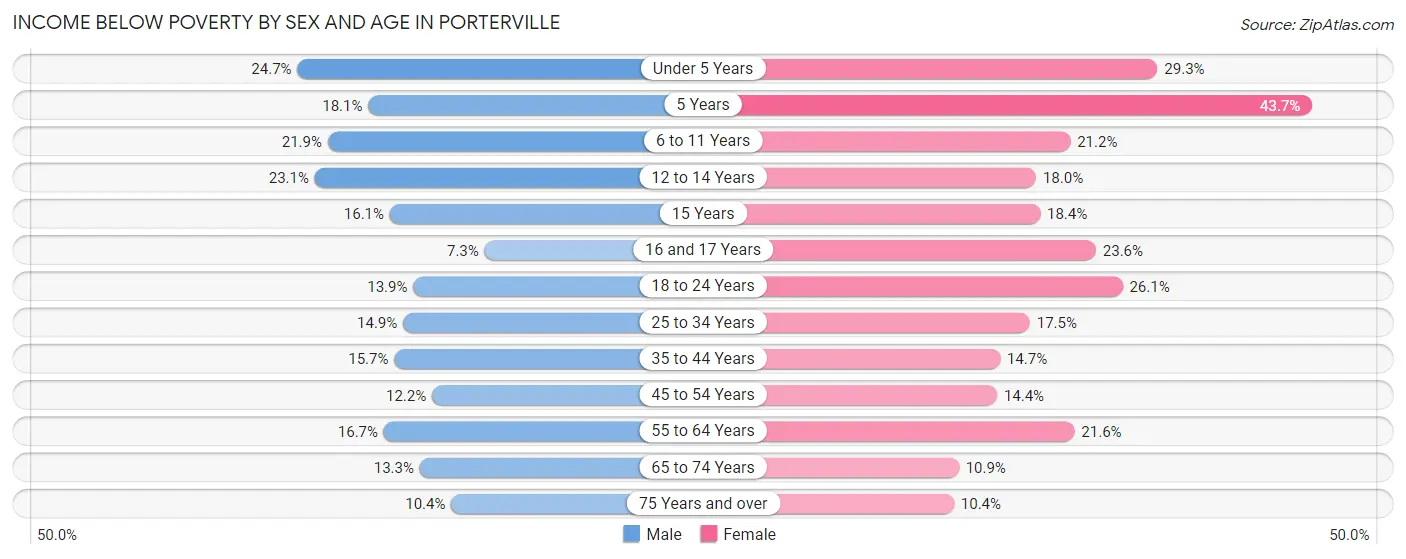
Income Below Poverty by Sex and Age in Porterville
With 16.3% poverty level for males and 19.1% for females among the residents of Porterville, under 5 year old males and 5 year old females are the most vulnerable to poverty, with 607 males (24.7%) and 182 females (43.6%) in their respective age groups living below the poverty level.
| Age Bracket | Male | Female |
| Under 5 Years | 607 (24.7%) | 526 (29.3%) |
| 5 Years | 76 (18.1%) | 182 (43.6%) |
| 6 to 11 Years | 741 (21.9%) | 632 (21.2%) |
| 12 to 14 Years | 461 (23.1%) | 331 (18.0%) |
| 15 Years | 99 (16.1%) | 92 (18.4%) |
| 16 and 17 Years | 87 (7.3%) | 361 (23.6%) |
| 18 to 24 Years | 467 (13.9%) | 856 (26.1%) |
| 25 to 34 Years | 592 (14.9%) | 724 (17.4%) |
| 35 to 44 Years | 728 (15.7%) | 619 (14.7%) |
| 45 to 54 Years | 389 (12.2%) | 445 (14.4%) |
| 55 to 64 Years | 417 (16.7%) | 694 (21.6%) |
| 65 to 74 Years | 295 (13.3%) | 230 (10.8%) |
| 75 Years and over | 125 (10.4%) | 136 (10.4%) |
| Total | 5,084 (16.3%) | 5,828 (19.1%) |
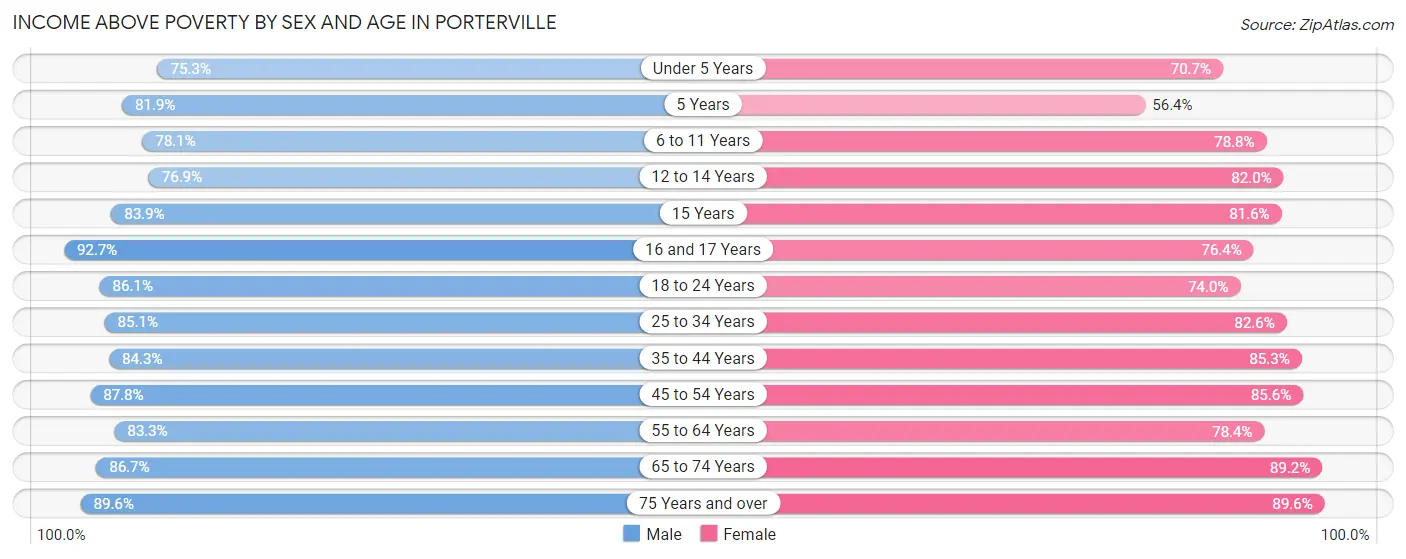
Income Above Poverty by Sex and Age in Porterville
According to the poverty statistics in Porterville, males aged 16 and 17 years and females aged 75 years and over are the age groups that are most secure financially, with 92.7% of males and 89.6% of females in these age groups living above the poverty line.
| Age Bracket | Male | Female |
| Under 5 Years | 1,852 (75.3%) | 1,270 (70.7%) |
| 5 Years | 344 (81.9%) | 235 (56.4%) |
| 6 to 11 Years | 2,649 (78.1%) | 2,349 (78.8%) |
| 12 to 14 Years | 1,537 (76.9%) | 1,506 (82.0%) |
| 15 Years | 516 (83.9%) | 408 (81.6%) |
| 16 and 17 Years | 1,103 (92.7%) | 1,170 (76.4%) |
| 18 to 24 Years | 2,886 (86.1%) | 2,430 (74.0%) |
| 25 to 34 Years | 3,388 (85.1%) | 3,426 (82.6%) |
| 35 to 44 Years | 3,911 (84.3%) | 3,597 (85.3%) |
| 45 to 54 Years | 2,801 (87.8%) | 2,645 (85.6%) |
| 55 to 64 Years | 2,086 (83.3%) | 2,521 (78.4%) |
| 65 to 74 Years | 1,919 (86.7%) | 1,890 (89.1%) |
| 75 Years and over | 1,077 (89.6%) | 1,172 (89.6%) |
| Total | 26,069 (83.7%) | 24,619 (80.9%) |
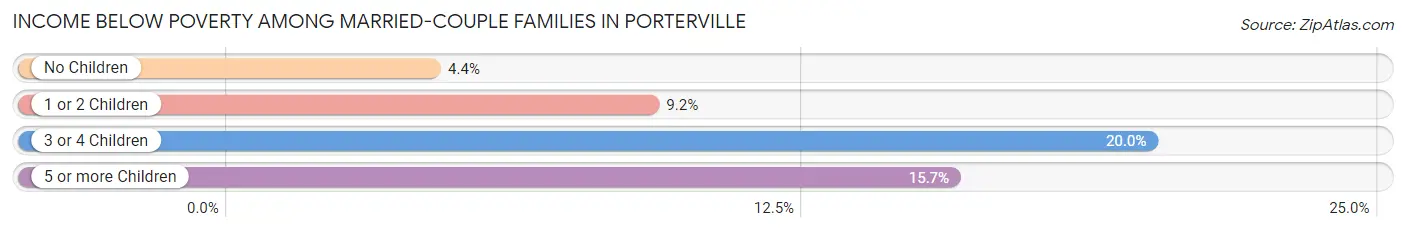
Income Below Poverty Among Married-Couple Families in Porterville
The poverty statistics for married-couple families in Porterville show that 9.2% or 860 of the total 9,325 families live below the poverty line. Families with 3 or 4 children have the highest poverty rate of 20.0%, comprising of 325 families. On the other hand, families with no children have the lowest poverty rate of 4.4%, which includes 175 families.
| Children | Above Poverty | Below Poverty |
| No Children | 3,780 (95.6%) | 175 (4.4%) |
| 1 or 2 Children | 3,178 (90.8%) | 321 (9.2%) |
| 3 or 4 Children | 1,298 (80.0%) | 325 (20.0%) |
| 5 or more Children | 209 (84.3%) | 39 (15.7%) |
| Total | 8,465 (90.8%) | 860 (9.2%) |
Income Below Poverty Among Single-Parent Households in Porterville
According to the poverty data in Porterville, 11.3% or 201 single-father households and 26.4% or 913 single-mother households are living below the poverty line. Among single-father households, those with 3 or 4 children have the highest poverty rate, with 101 households (28.1%) experiencing poverty. Likewise, among single-mother households, those with 3 or 4 children have the highest poverty rate, with 179 households (56.7%) falling below the poverty line.
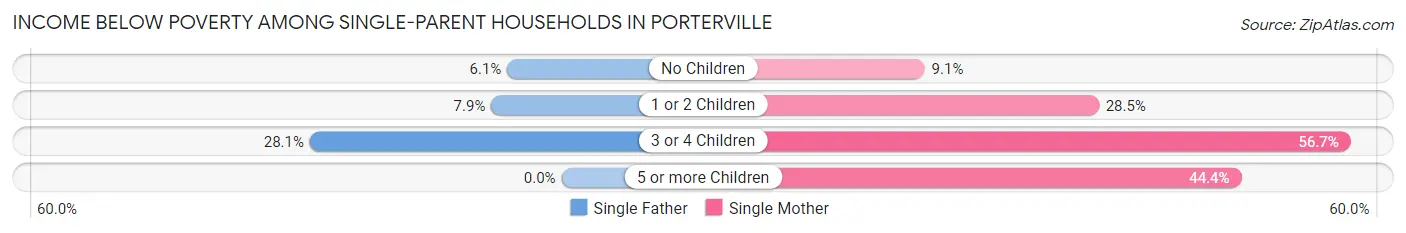
| Children | Single Father | Single Mother |
| No Children | 33 (6.1%) | 84 (9.0%) |
| 1 or 2 Children | 67 (7.9%) | 594 (28.5%) |
| 3 or 4 Children | 101 (28.1%) | 179 (56.7%) |
| 5 or more Children | 0 (0.0%) | 56 (44.4%) |
| Total | 201 (11.3%) | 913 (26.4%) |
Income Below Poverty Among Married-Couple vs Single-Parent Households in Porterville
The poverty data for Porterville shows that 860 of the married-couple family households (9.2%) and 1,114 of the single-parent households (21.3%) are living below the poverty level. Within the married-couple family households, those with 3 or 4 children have the highest poverty rate, with 325 households (20.0%) falling below the poverty line. Among the single-parent households, those with 3 or 4 children have the highest poverty rate, with 280 household (41.5%) living below poverty.
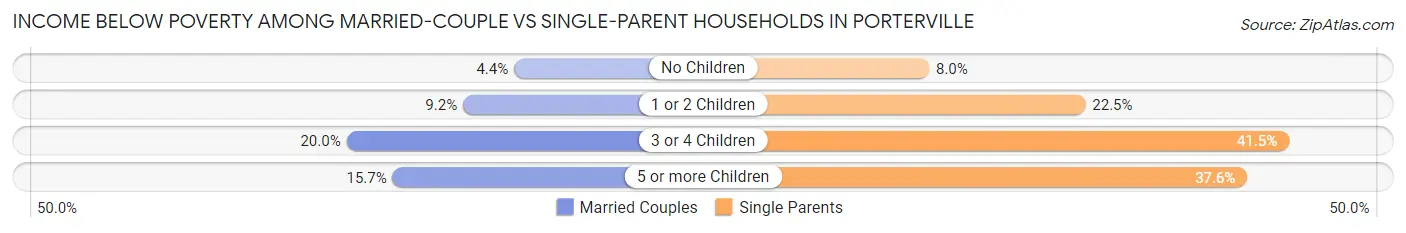
| Children | Married-Couple Families | Single-Parent Households |
| No Children | 175 (4.4%) | 117 (8.0%) |
| 1 or 2 Children | 321 (9.2%) | 661 (22.5%) |
| 3 or 4 Children | 325 (20.0%) | 280 (41.5%) |
| 5 or more Children | 39 (15.7%) | 56 (37.6%) |
| Total | 860 (9.2%) | 1,114 (21.3%) |
Race in Porterville
The most populous races in Porterville are Hispanic or Latino (45,042 | 72.1%), White / Caucasian (30,520 | 48.8%), and Some other Race (14,615 | 23.4%).
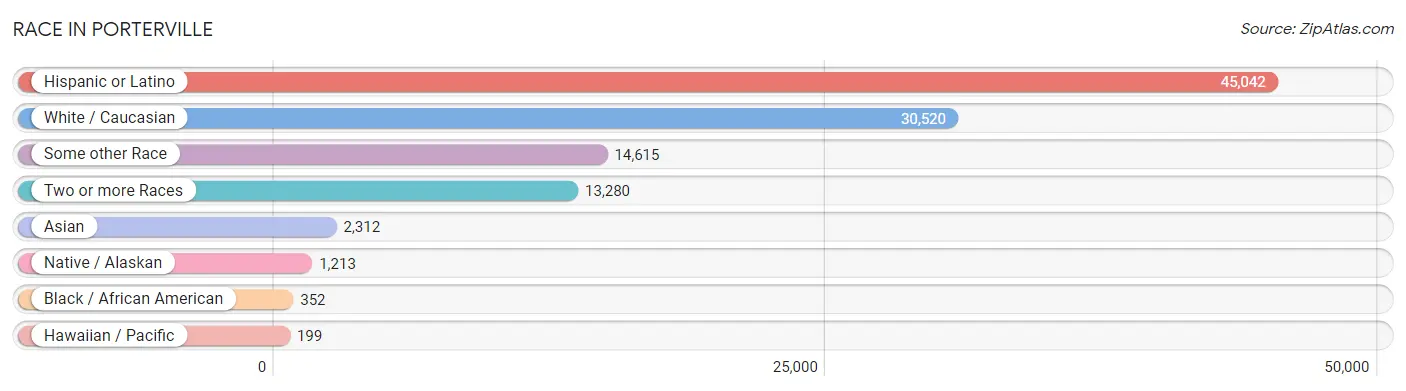
| Race | # Population | % Population |
| Asian | 2,312 | 3.7% |
| Black / African American | 352 | 0.6% |
| Hawaiian / Pacific | 199 | 0.3% |
| Hispanic or Latino | 45,042 | 72.1% |
| Native / Alaskan | 1,213 | 1.9% |
| White / Caucasian | 30,520 | 48.8% |
| Two or more Races | 13,280 | 21.2% |
| Some other Race | 14,615 | 23.4% |
| Total | 62,491 | 100.0% |
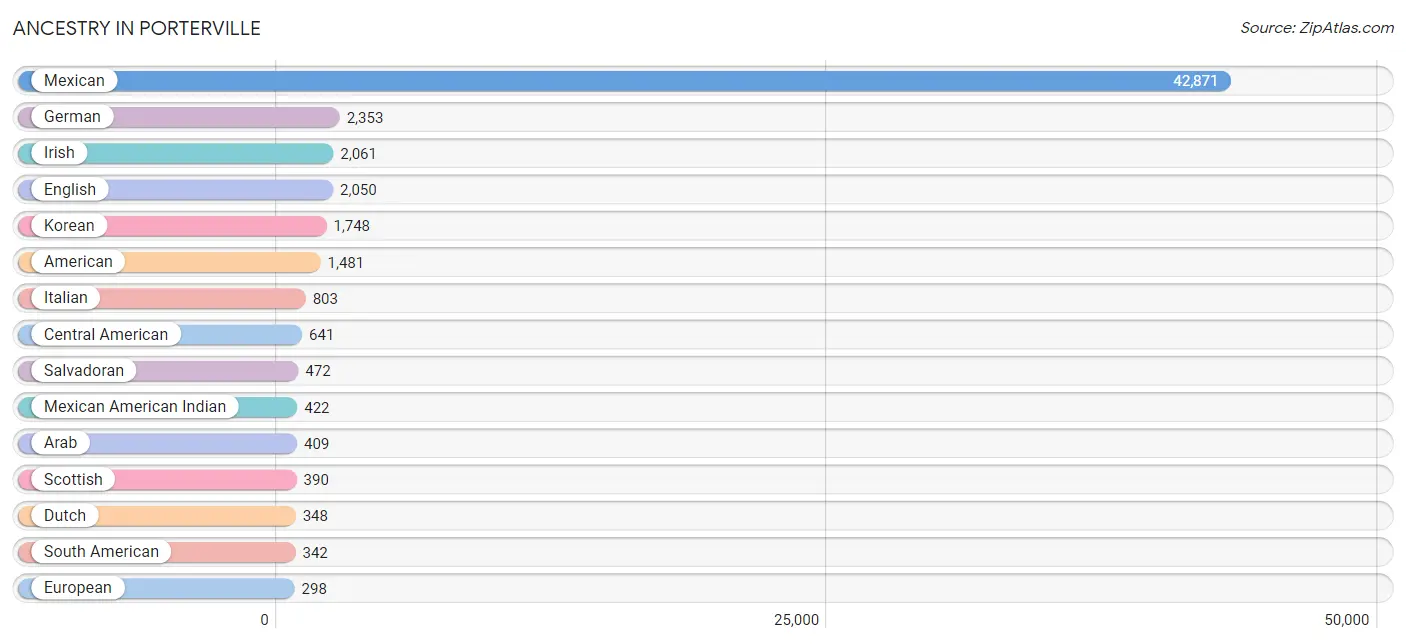
Ancestry in Porterville
The most populous ancestries reported in Porterville are Mexican (42,871 | 68.6%), German (2,353 | 3.8%), Irish (2,061 | 3.3%), English (2,050 | 3.3%), and Korean (1,748 | 2.8%), together accounting for 81.8% of all Porterville residents.
| Ancestry | # Population | % Population |
| American | 1,481 | 2.4% |
| Apache | 12 | 0.0% |
| Arab | 409 | 0.6% |
| Armenian | 19 | 0.0% |
| Bangladeshi | 280 | 0.4% |
| Basque | 18 | 0.0% |
| Belgian | 16 | 0.0% |
| Bhutanese | 230 | 0.4% |
| Blackfeet | 26 | 0.0% |
| Bolivian | 20 | 0.0% |
| British | 125 | 0.2% |
| Burmese | 29 | 0.1% |
| Central American | 641 | 1.0% |
| Central American Indian | 142 | 0.2% |
| Cherokee | 216 | 0.4% |
| Chilean | 101 | 0.2% |
| Choctaw | 178 | 0.3% |
| Colombian | 123 | 0.2% |
| Croatian | 29 | 0.1% |
| Cuban | 280 | 0.4% |
| Czech | 51 | 0.1% |
| Czechoslovakian | 21 | 0.0% |
| Danish | 10 | 0.0% |
| Dominican | 17 | 0.0% |
| Dutch | 348 | 0.6% |
| English | 2,050 | 3.3% |
| European | 298 | 0.5% |
| French | 184 | 0.3% |
| French Canadian | 184 | 0.3% |
| German | 2,353 | 3.8% |
| Greek | 8 | 0.0% |
| Guamanian / Chamorro | 74 | 0.1% |
| Guatemalan | 69 | 0.1% |
| Indian (Asian) | 124 | 0.2% |
| Irish | 2,061 | 3.3% |
| Iroquois | 73 | 0.1% |
| Italian | 803 | 1.3% |
| Korean | 1,748 | 2.8% |
| Laotian | 178 | 0.3% |
| Malaysian | 215 | 0.3% |
| Mexican | 42,871 | 68.6% |
| Mexican American Indian | 422 | 0.7% |
| Native Hawaiian | 10 | 0.0% |
| Navajo | 42 | 0.1% |
| Nigerian | 7 | 0.0% |
| Northern European | 37 | 0.1% |
| Norwegian | 176 | 0.3% |
| Panamanian | 100 | 0.2% |
| Peruvian | 98 | 0.2% |
| Polish | 45 | 0.1% |
| Portuguese | 262 | 0.4% |
| Potawatomi | 17 | 0.0% |
| Puerto Rican | 111 | 0.2% |
| Russian | 267 | 0.4% |
| Salvadoran | 472 | 0.8% |
| Scandinavian | 84 | 0.1% |
| Scotch-Irish | 134 | 0.2% |
| Scottish | 390 | 0.6% |
| Sioux | 63 | 0.1% |
| South American | 342 | 0.5% |
| Spaniard | 118 | 0.2% |
| Spanish | 41 | 0.1% |
| Sri Lankan | 179 | 0.3% |
| Subsaharan African | 7 | 0.0% |
| Swedish | 185 | 0.3% |
| Swiss | 62 | 0.1% |
| Syrian | 100 | 0.2% |
| Thai | 83 | 0.1% |
| Ukrainian | 6 | 0.0% |
| Welsh | 222 | 0.4% | View All 70 Rows |
Immigrants in Porterville
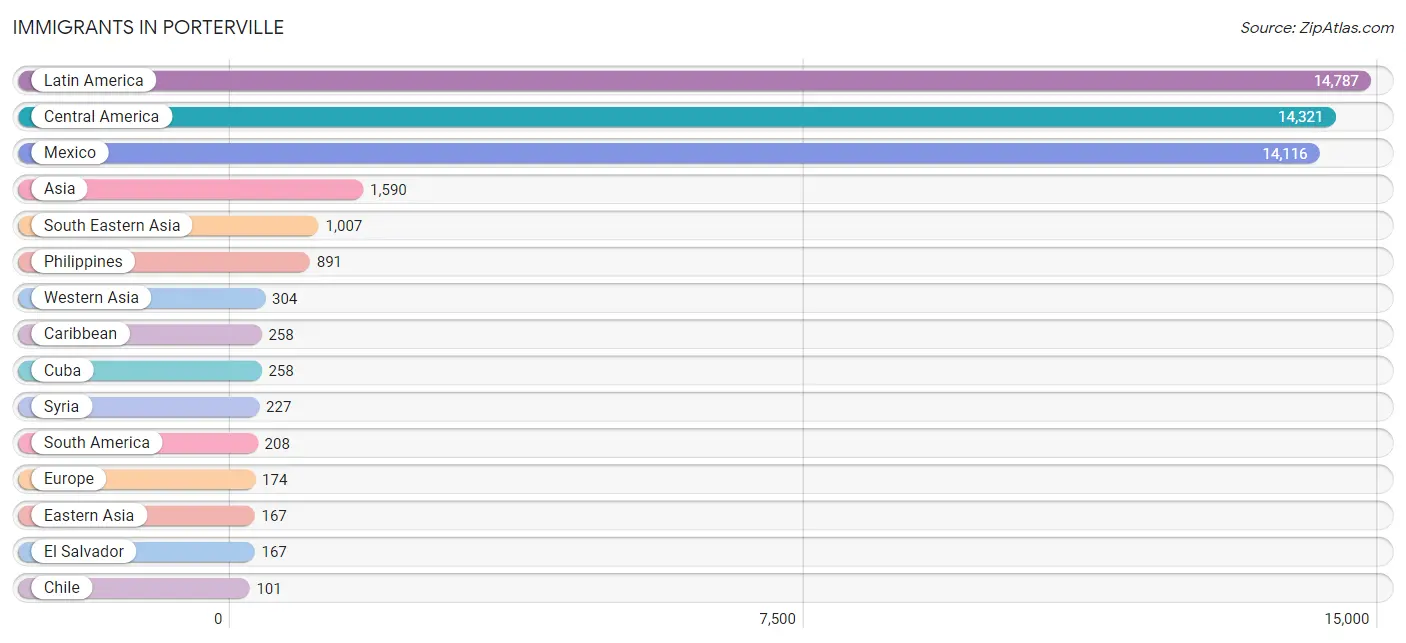
The most numerous immigrant groups reported in Porterville came from Latin America (14,787 | 23.7%), Central America (14,321 | 22.9%), Mexico (14,116 | 22.6%), Asia (1,590 | 2.5%), and South Eastern Asia (1,007 | 1.6%), together accounting for 73.3% of all Porterville residents.
| Immigration Origin | # Population | % Population |
| Asia | 1,590 | 2.5% |
| Bolivia | 20 | 0.0% |
| Caribbean | 258 | 0.4% |
| Central America | 14,321 | 22.9% |
| Chile | 101 | 0.2% |
| China | 86 | 0.1% |
| Colombia | 16 | 0.0% |
| Croatia | 4 | 0.0% |
| Cuba | 258 | 0.4% |
| Eastern Asia | 167 | 0.3% |
| Eastern Europe | 17 | 0.0% |
| El Salvador | 167 | 0.3% |
| England | 32 | 0.1% |
| Europe | 174 | 0.3% |
| Germany | 47 | 0.1% |
| Guatemala | 38 | 0.1% |
| India | 58 | 0.1% |
| Ireland | 4 | 0.0% |
| Italy | 28 | 0.0% |
| Japan | 14 | 0.0% |
| Korea | 67 | 0.1% |
| Laos | 47 | 0.1% |
| Latin America | 14,787 | 23.7% |
| Mexico | 14,116 | 22.6% |
| Northern Europe | 65 | 0.1% |
| Oceania | 45 | 0.1% |
| Pakistan | 34 | 0.1% |
| Peru | 71 | 0.1% |
| Philippines | 891 | 1.4% |
| Portugal | 5 | 0.0% |
| Russia | 13 | 0.0% |
| South America | 208 | 0.3% |
| South Central Asia | 92 | 0.2% |
| South Eastern Asia | 1,007 | 1.6% |
| Southern Europe | 45 | 0.1% |
| Spain | 12 | 0.0% |
| Syria | 227 | 0.4% |
| Taiwan | 10 | 0.0% |
| Vietnam | 69 | 0.1% |
| Western Asia | 304 | 0.5% |
| Western Europe | 47 | 0.1% |
| Yemen | 77 | 0.1% | View All 42 Rows |
Sex and Age in Porterville
Sex and Age in Porterville
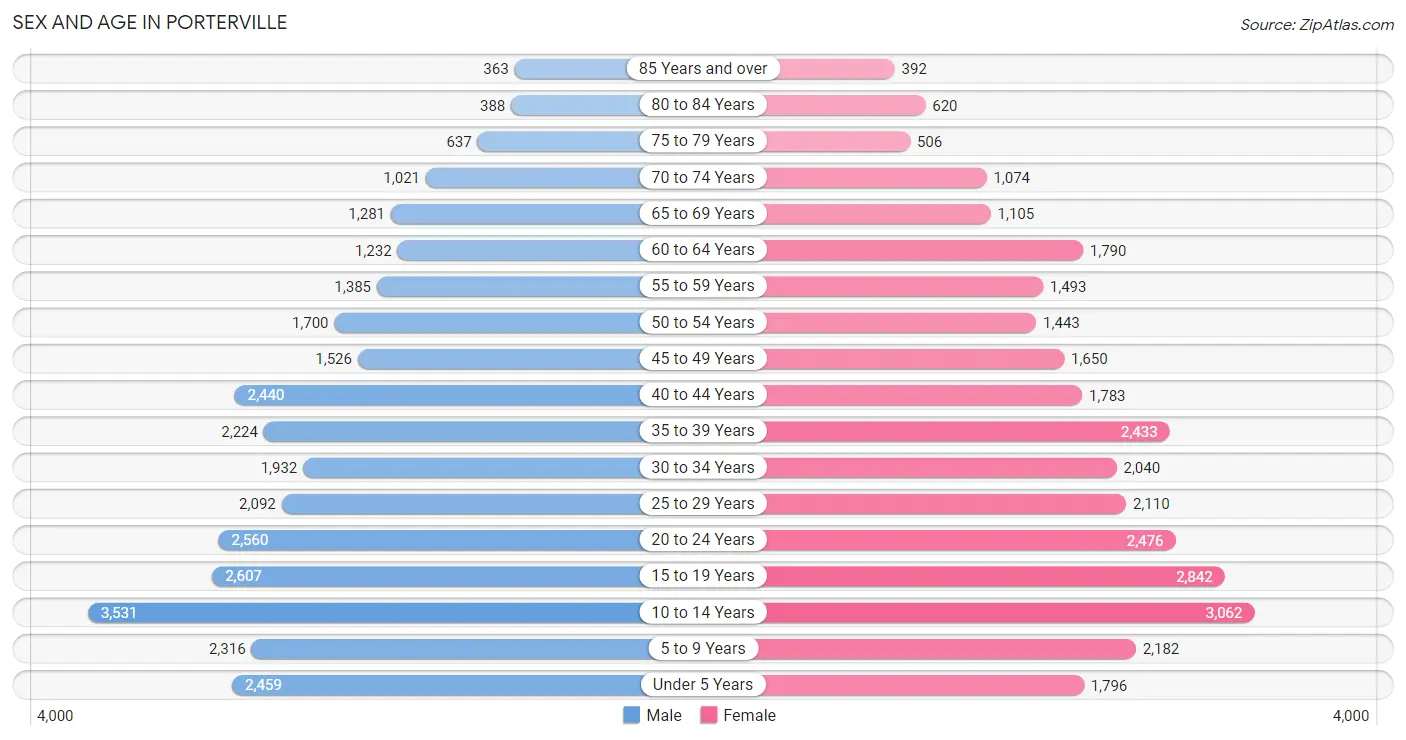
The most populous age groups in Porterville are 10 to 14 Years (3,531 | 11.1%) for men and 10 to 14 Years (3,062 | 9.9%) for women.
| Age Bracket | Male | Female |
| Under 5 Years | 2,459 (7.8%) | 1,796 (5.8%) |
| 5 to 9 Years | 2,316 (7.3%) | 2,182 (7.1%) |
| 10 to 14 Years | 3,531 (11.1%) | 3,062 (9.9%) |
| 15 to 19 Years | 2,607 (8.2%) | 2,842 (9.2%) |
| 20 to 24 Years | 2,560 (8.1%) | 2,476 (8.0%) |
| 25 to 29 Years | 2,092 (6.6%) | 2,110 (6.9%) |
| 30 to 34 Years | 1,932 (6.1%) | 2,040 (6.6%) |
| 35 to 39 Years | 2,224 (7.0%) | 2,433 (7.9%) |
| 40 to 44 Years | 2,440 (7.7%) | 1,783 (5.8%) |
| 45 to 49 Years | 1,526 (4.8%) | 1,650 (5.4%) |
| 50 to 54 Years | 1,700 (5.4%) | 1,443 (4.7%) |
| 55 to 59 Years | 1,385 (4.4%) | 1,493 (4.9%) |
| 60 to 64 Years | 1,232 (3.9%) | 1,790 (5.8%) |
| 65 to 69 Years | 1,281 (4.0%) | 1,105 (3.6%) |
| 70 to 74 Years | 1,021 (3.2%) | 1,074 (3.5%) |
| 75 to 79 Years | 637 (2.0%) | 506 (1.6%) |
| 80 to 84 Years | 388 (1.2%) | 620 (2.0%) |
| 85 Years and over | 363 (1.1%) | 392 (1.3%) |
| Total | 31,694 (100.0%) | 30,797 (100.0%) |
Families and Households in Porterville
Median Family Size in Porterville
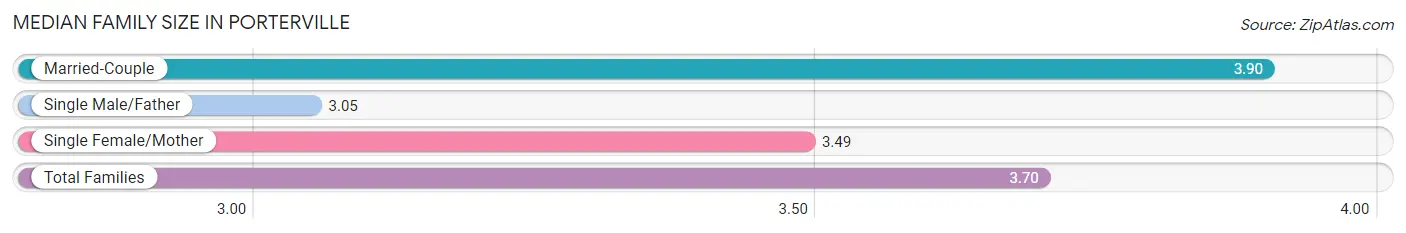
The median family size in Porterville is 3.70 persons per family, with married-couple families (9,325 | 64.0%) accounting for the largest median family size of 3.9 persons per family. On the other hand, single male/father families (1,779 | 12.2%) represent the smallest median family size with 3.05 persons per family.
| Family Type | # Families | Family Size |
| Married-Couple | 9,325 (64.0%) | 3.90 |
| Single Male/Father | 1,779 (12.2%) | 3.05 |
| Single Female/Mother | 3,454 (23.7%) | 3.49 |
| Total Families | 14,558 (100.0%) | 3.70 |
Median Household Size in Porterville
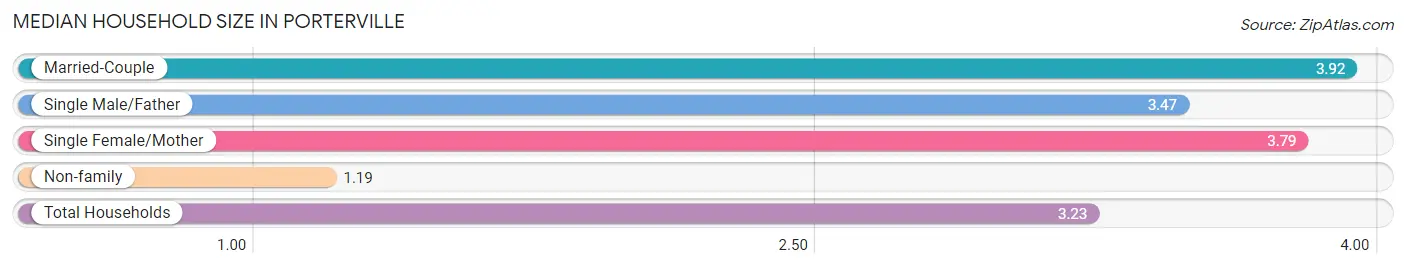
The median household size in Porterville is 3.23 persons per household, with married-couple households (9,325 | 49.3%) accounting for the largest median household size of 3.92 persons per household. non-family households (4,367 | 23.1%) represent the smallest median household size with 1.19 persons per household.
| Household Type | # Households | Household Size |
| Married-Couple | 9,325 (49.3%) | 3.92 |
| Single Male/Father | 1,779 (9.4%) | 3.47 |
| Single Female/Mother | 3,454 (18.2%) | 3.79 |
| Non-family | 4,367 (23.1%) | 1.19 |
| Total Households | 18,925 (100.0%) | 3.23 |
Household Size by Marriage Status in Porterville
Out of a total of 18,925 households in Porterville, 14,558 (76.9%) are family households, while 4,367 (23.1%) are nonfamily households. The most numerous type of family households are 2-person households, comprising 4,212, and the most common type of nonfamily households are 1-person households, comprising 3,615.
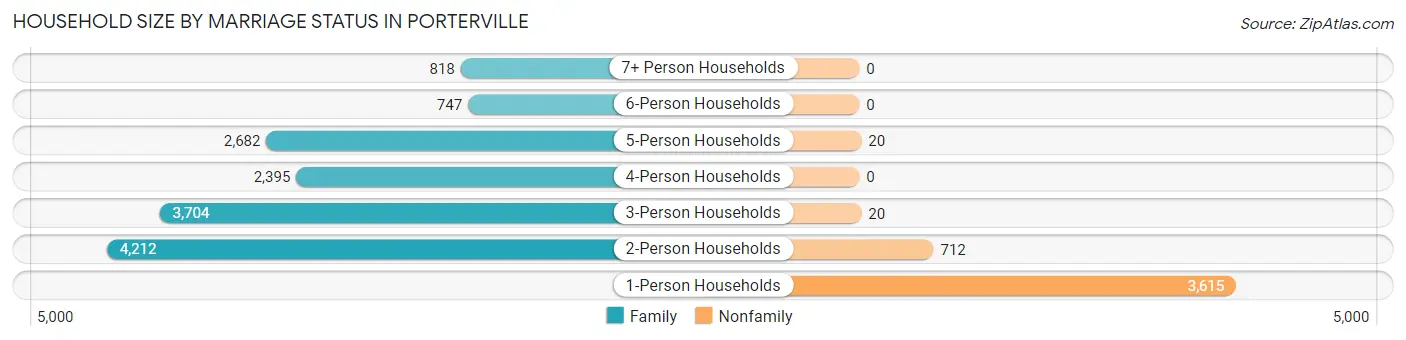
| Household Size | Family Households | Nonfamily Households |
| 1-Person Households | - | 3,615 (19.1%) |
| 2-Person Households | 4,212 (22.3%) | 712 (3.8%) |
| 3-Person Households | 3,704 (19.6%) | 20 (0.1%) |
| 4-Person Households | 2,395 (12.7%) | 0 (0.0%) |
| 5-Person Households | 2,682 (14.2%) | 20 (0.1%) |
| 6-Person Households | 747 (4.0%) | 0 (0.0%) |
| 7+ Person Households | 818 (4.3%) | 0 (0.0%) |
| Total | 14,558 (76.9%) | 4,367 (23.1%) |
Female Fertility in Porterville
Fertility by Age in Porterville
Average fertility rate in Porterville is 69.0 births per 1,000 women. Women in the age bracket of 20 to 34 years have the highest fertility rate with 121.0 births per 1,000 women. Women in the age bracket of 20 to 34 years acount for 74.9% of all women with births.
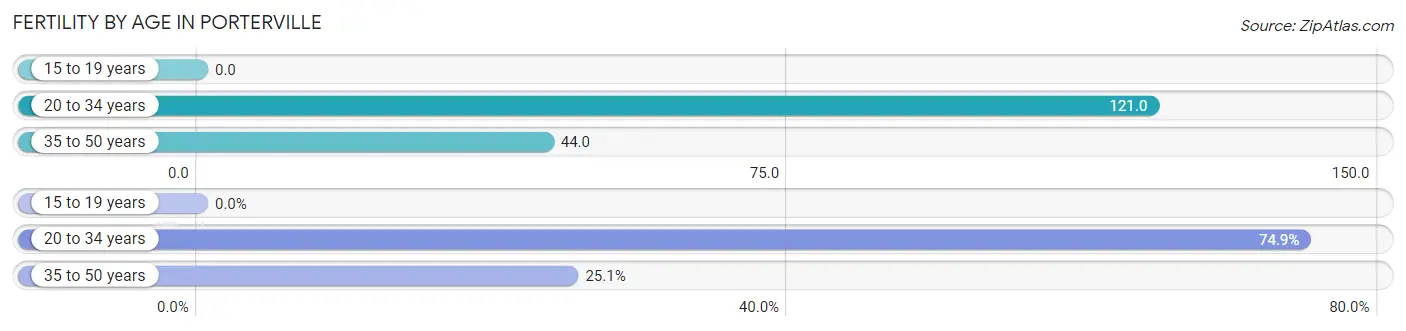
| Age Bracket | Women with Births | Births / 1,000 Women |
| 15 to 19 years | 0 (0.0%) | 0.0 |
| 20 to 34 years | 801 (74.9%) | 121.0 |
| 35 to 50 years | 269 (25.1%) | 44.0 |
| Total | 1,070 (100.0%) | 69.0 |
Fertility by Age by Marriage Status in Porterville
34.1% of women with births (1,070) in Porterville are married. The highest percentage of unmarried women with births falls into 20 to 34 years age bracket with 68.2% of them unmarried at the time of birth, while the lowest percentage of unmarried women with births belong to 35 to 50 years age bracket with 59.1% of them unmarried.
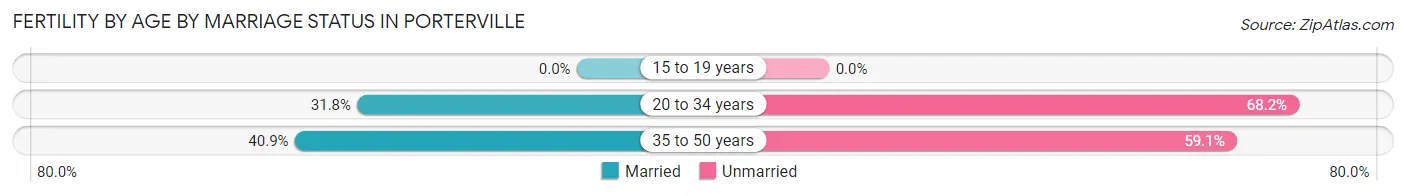
| Age Bracket | Married | Unmarried |
| 15 to 19 years | 0 (0.0%) | 0 (0.0%) |
| 20 to 34 years | 255 (31.8%) | 546 (68.2%) |
| 35 to 50 years | 110 (40.9%) | 159 (59.1%) |
| Total | 365 (34.1%) | 705 (65.9%) |
Fertility by Education in Porterville
Average fertility rate in Porterville is 69.0 births per 1,000 women. Women with the education attainment of graduate degree have the highest fertility rate of 171.0 births per 1,000 women, while women with the education attainment of college or associate's degree have the lowest fertility at 52.0 births per 1,000 women. Women with the education attainment of high school diploma represent 31.0% of all women with births.
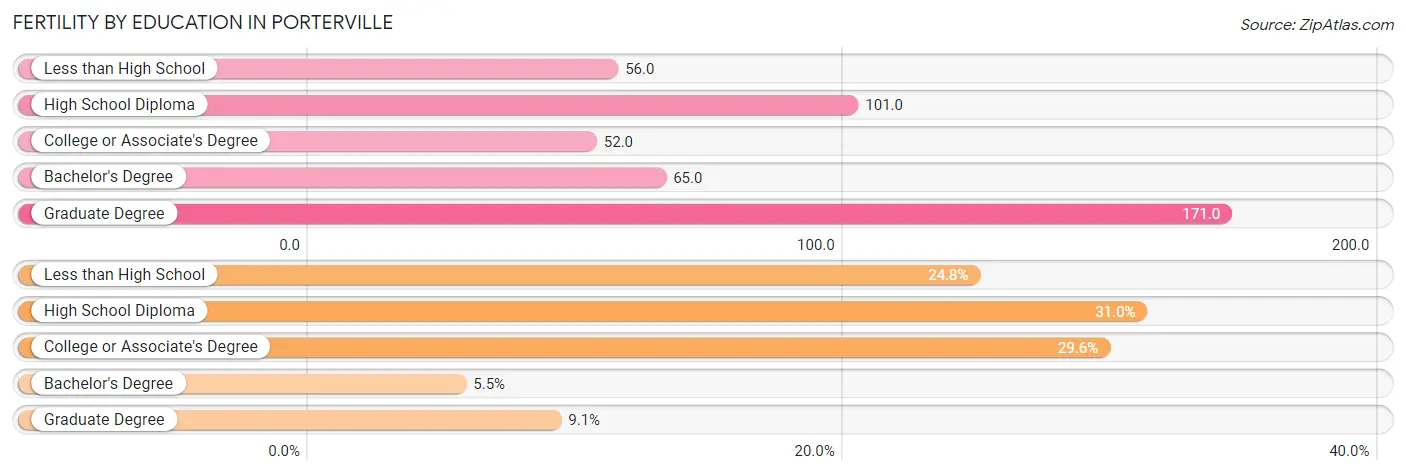
| Educational Attainment | Women with Births | Births / 1,000 Women |
| Less than High School | 265 (24.8%) | 56.0 |
| High School Diploma | 332 (31.0%) | 101.0 |
| College or Associate's Degree | 317 (29.6%) | 52.0 |
| Bachelor's Degree | 59 (5.5%) | 65.0 |
| Graduate Degree | 97 (9.1%) | 171.0 |
| Total | 1,070 (100.0%) | 69.0 |
Fertility by Education by Marriage Status in Porterville
65.9% of women with births in Porterville are unmarried. Women with the educational attainment of bachelor's degree are most likely to be married with 100.0% of them married at childbirth, while women with the educational attainment of less than high school are least likely to be married with 84.5% of them unmarried at childbirth.
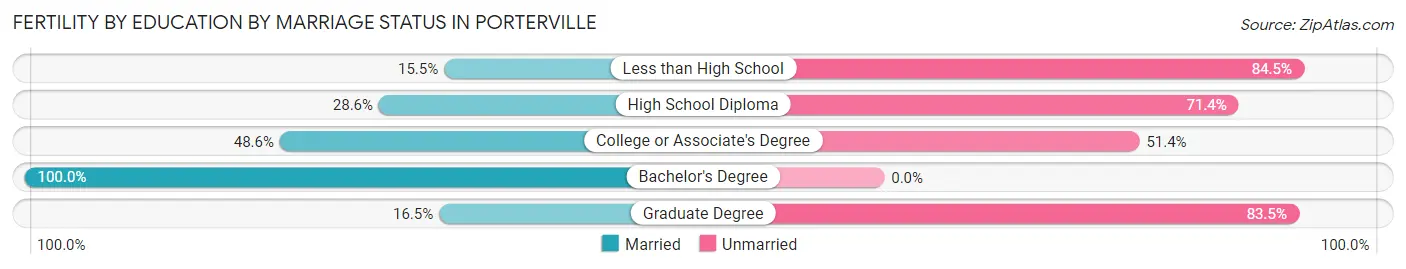
| Educational Attainment | Married | Unmarried |
| Less than High School | 41 (15.5%) | 224 (84.5%) |
| High School Diploma | 95 (28.6%) | 237 (71.4%) |
| College or Associate's Degree | 154 (48.6%) | 163 (51.4%) |
| Bachelor's Degree | 59 (100.0%) | 0 (0.0%) |
| Graduate Degree | 16 (16.5%) | 81 (83.5%) |
| Total | 365 (34.1%) | 705 (65.9%) |
Employment Characteristics in Porterville
Employment by Class of Employer in Porterville
Among the 24,690 employed individuals in Porterville, private company employees (14,723 | 59.6%), local government employees (2,829 | 11.5%), and state government employees (2,271 | 9.2%) make up the most common classes of employment.
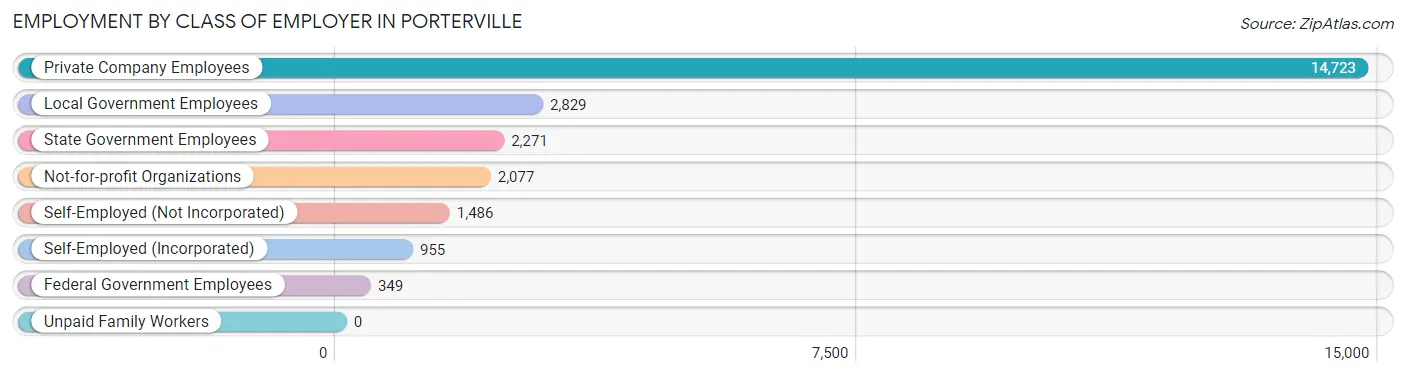
| Employer Class | # Employees | % Employees |
| Private Company Employees | 14,723 | 59.6% |
| Self-Employed (Incorporated) | 955 | 3.9% |
| Self-Employed (Not Incorporated) | 1,486 | 6.0% |
| Not-for-profit Organizations | 2,077 | 8.4% |
| Local Government Employees | 2,829 | 11.5% |
| State Government Employees | 2,271 | 9.2% |
| Federal Government Employees | 349 | 1.4% |
| Unpaid Family Workers | 0 | 0.0% |
| Total | 24,690 | 100.0% |
Employment Status by Age in Porterville
According to the labor force statistics for Porterville, out of the total population over 16 years of age (46,027), 62.1% or 28,583 individuals are in the labor force, with 10.1% or 2,887 of them unemployed. The age group with the highest labor force participation rate is 30 to 34 years, with 84.8% or 3,368 individuals in the labor force. Within the labor force, the 25 to 29 years age range has the highest percentage of unemployed individuals, with 18.7% or 607 of them being unemployed.
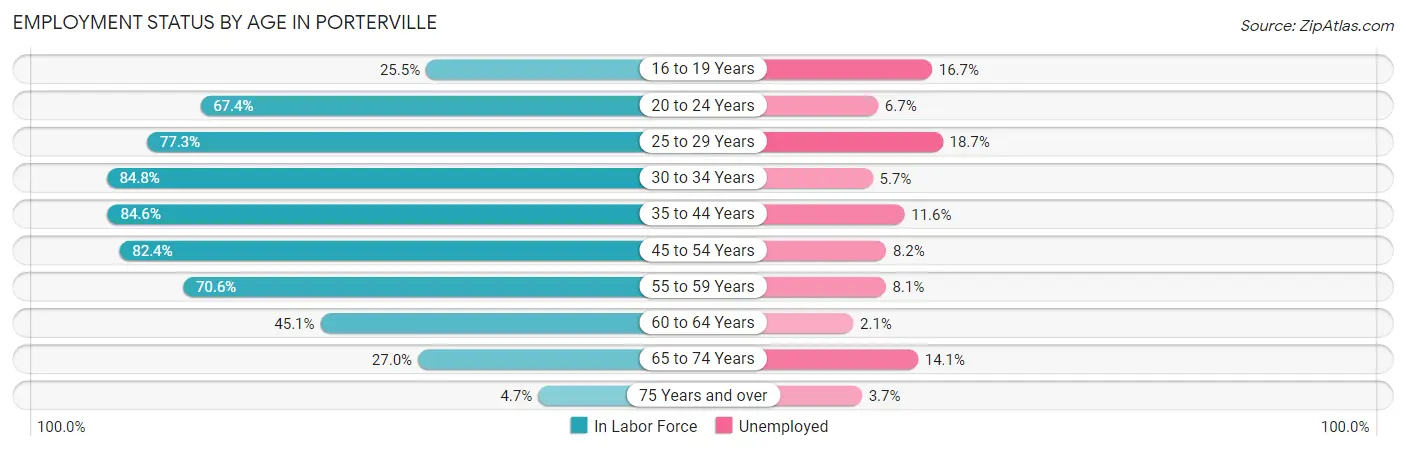
| Age Bracket | In Labor Force | Unemployed |
| 16 to 19 Years | 1,104 (25.5%) | 184 (16.7%) |
| 20 to 24 Years | 3,394 (67.4%) | 227 (6.7%) |
| 25 to 29 Years | 3,248 (77.3%) | 607 (18.7%) |
| 30 to 34 Years | 3,368 (84.8%) | 192 (5.7%) |
| 35 to 44 Years | 7,512 (84.6%) | 871 (11.6%) |
| 45 to 54 Years | 5,207 (82.4%) | 427 (8.2%) |
| 55 to 59 Years | 2,032 (70.6%) | 165 (8.1%) |
| 60 to 64 Years | 1,363 (45.1%) | 29 (2.1%) |
| 65 to 74 Years | 1,210 (27.0%) | 171 (14.1%) |
| 75 Years and over | 137 (4.7%) | 5 (3.7%) |
| Total | 28,583 (62.1%) | 2,887 (10.1%) |
Employment Status by Educational Attainment in Porterville
According to labor force statistics for Porterville, 77.6% of individuals (22,716) out of the total population between 25 and 64 years of age (29,273) are in the labor force, with 10.1% or 2,294 of them being unemployed. The group with the highest labor force participation rate are those with the educational attainment of bachelor's degree or higher, with 90.1% or 3,440 individuals in the labor force. Within the labor force, individuals with less than high school education have the highest percentage of unemployment, with 18.6% or 1,119 of them being unemployed.
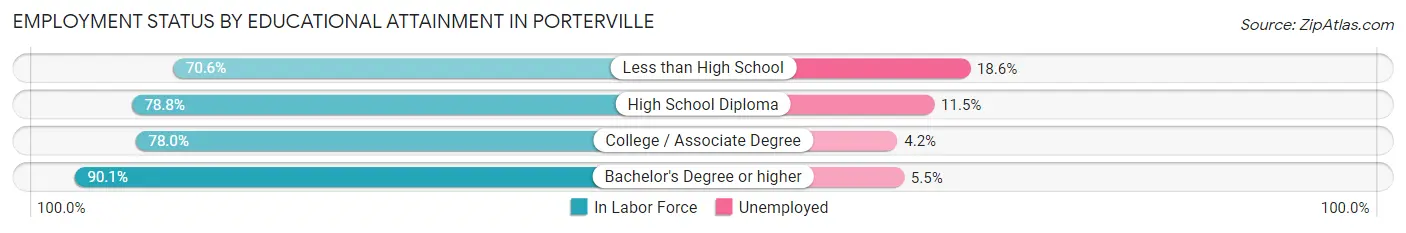
| Educational Attainment | In Labor Force | Unemployed |
| Less than High School | 6,015 (70.6%) | 1,585 (18.6%) |
| High School Diploma | 5,808 (78.8%) | 848 (11.5%) |
| College / Associate Degree | 7,461 (78.0%) | 402 (4.2%) |
| Bachelor's Degree or higher | 3,440 (90.1%) | 210 (5.5%) |
| Total | 22,716 (77.6%) | 2,957 (10.1%) |
Employment Occupations by Sex in Porterville
Management, Business, Science and Arts Occupations
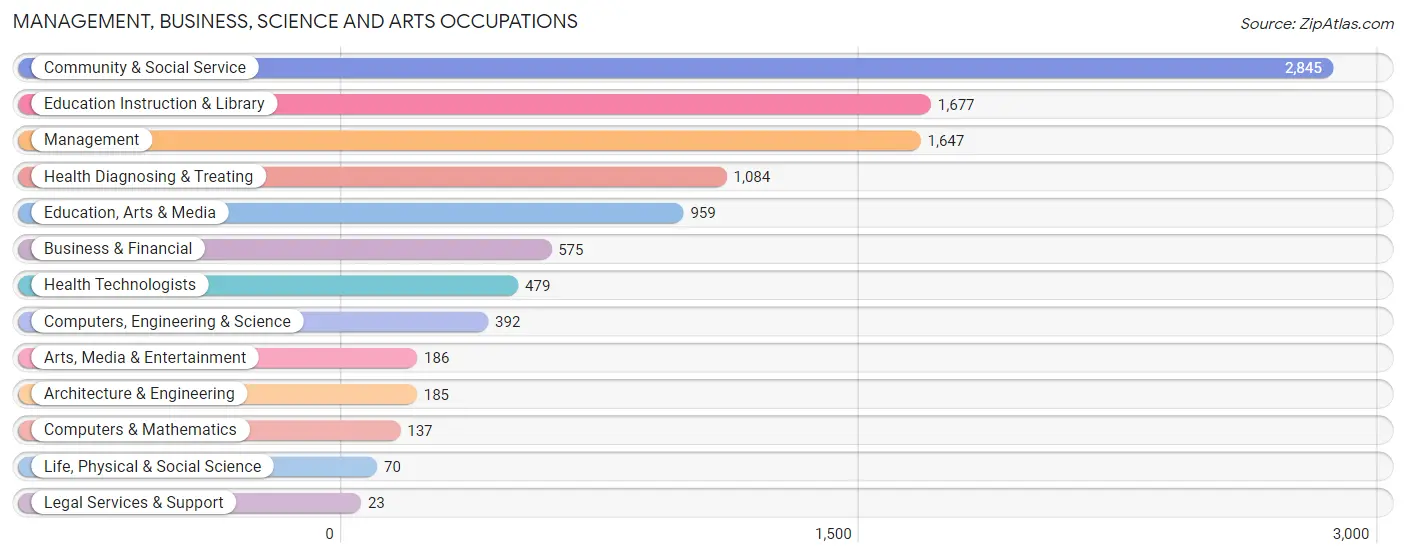
The most common Management, Business, Science and Arts occupations in Porterville are Community & Social Service (2,845 | 11.1%), Education Instruction & Library (1,677 | 6.5%), Management (1,647 | 6.4%), Health Diagnosing & Treating (1,084 | 4.2%), and Education, Arts & Media (959 | 3.7%).
Management, Business, Science and Arts Occupations by Sex
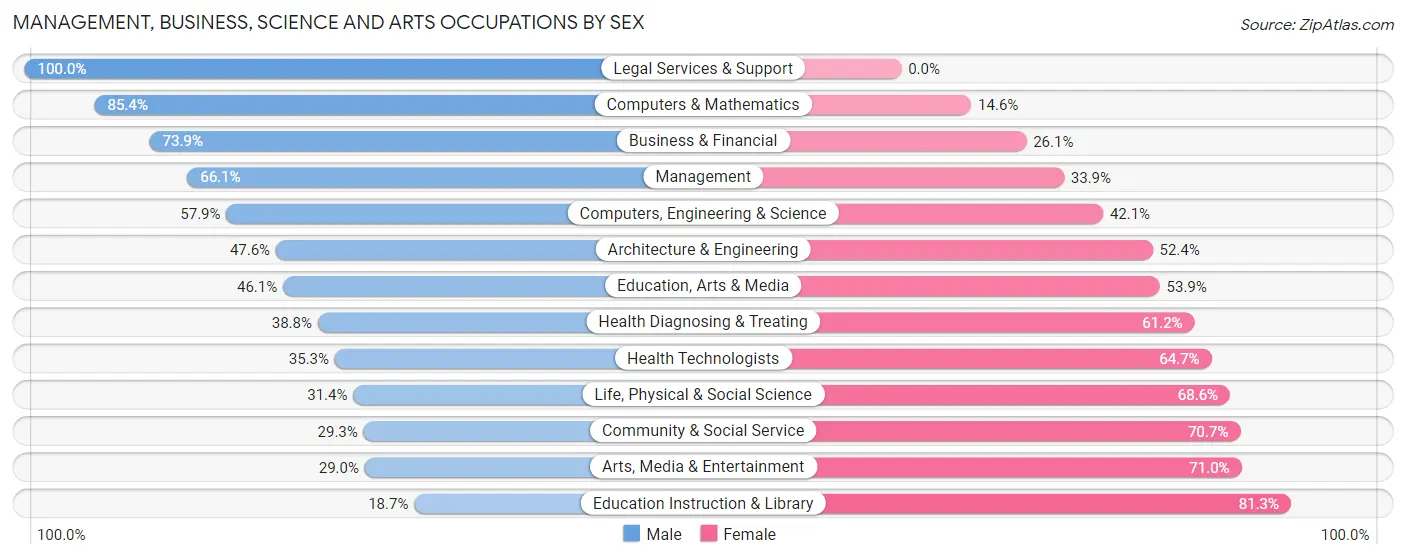
Within the Management, Business, Science and Arts occupations in Porterville, the most male-oriented occupations are Legal Services & Support (100.0%), Computers & Mathematics (85.4%), and Business & Financial (73.9%), while the most female-oriented occupations are Education Instruction & Library (81.3%), Arts, Media & Entertainment (71.0%), and Community & Social Service (70.7%).
| Occupation | Male | Female |
| Management | 1,088 (66.1%) | 559 (33.9%) |
| Business & Financial | 425 (73.9%) | 150 (26.1%) |
| Computers, Engineering & Science | 227 (57.9%) | 165 (42.1%) |
| Computers & Mathematics | 117 (85.4%) | 20 (14.6%) |
| Architecture & Engineering | 88 (47.6%) | 97 (52.4%) |
| Life, Physical & Social Science | 22 (31.4%) | 48 (68.6%) |
| Community & Social Service | 833 (29.3%) | 2,012 (70.7%) |
| Education, Arts & Media | 442 (46.1%) | 517 (53.9%) |
| Legal Services & Support | 23 (100.0%) | 0 (0.0%) |
| Education Instruction & Library | 314 (18.7%) | 1,363 (81.3%) |
| Arts, Media & Entertainment | 54 (29.0%) | 132 (71.0%) |
| Health Diagnosing & Treating | 421 (38.8%) | 663 (61.2%) |
| Health Technologists | 169 (35.3%) | 310 (64.7%) |
| Total (Category) | 2,994 (45.8%) | 3,549 (54.2%) |
| Total (Overall) | 14,156 (55.1%) | 11,516 (44.9%) |
Services Occupations
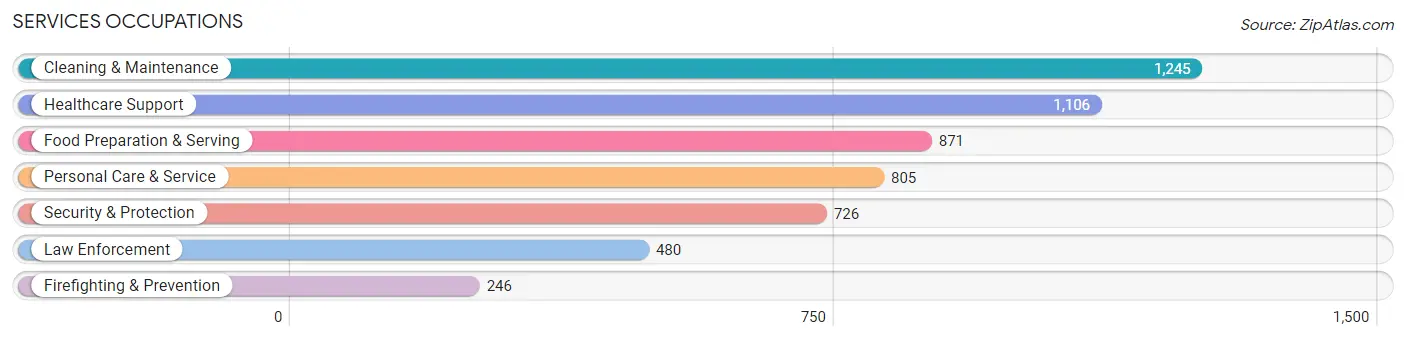
The most common Services occupations in Porterville are Cleaning & Maintenance (1,245 | 4.9%), Healthcare Support (1,106 | 4.3%), Food Preparation & Serving (871 | 3.4%), Personal Care & Service (805 | 3.1%), and Security & Protection (726 | 2.8%).
Services Occupations by Sex
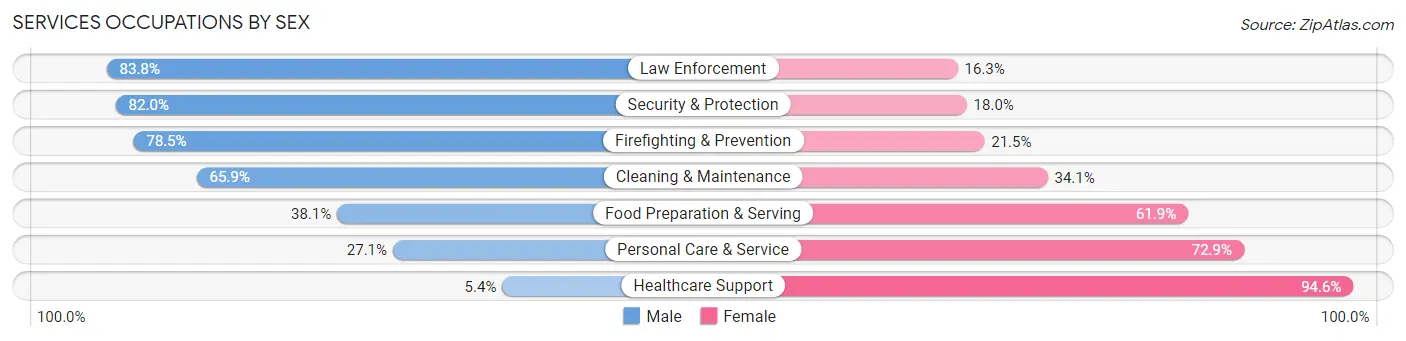
Within the Services occupations in Porterville, the most male-oriented occupations are Law Enforcement (83.8%), Security & Protection (82.0%), and Firefighting & Prevention (78.5%), while the most female-oriented occupations are Healthcare Support (94.6%), Personal Care & Service (72.9%), and Food Preparation & Serving (61.9%).
| Occupation | Male | Female |
| Healthcare Support | 60 (5.4%) | 1,046 (94.6%) |
| Security & Protection | 595 (82.0%) | 131 (18.0%) |
| Firefighting & Prevention | 193 (78.5%) | 53 (21.5%) |
| Law Enforcement | 402 (83.8%) | 78 (16.3%) |
| Food Preparation & Serving | 332 (38.1%) | 539 (61.9%) |
| Cleaning & Maintenance | 821 (65.9%) | 424 (34.1%) |
| Personal Care & Service | 218 (27.1%) | 587 (72.9%) |
| Total (Category) | 2,026 (42.6%) | 2,727 (57.4%) |
| Total (Overall) | 14,156 (55.1%) | 11,516 (44.9%) |
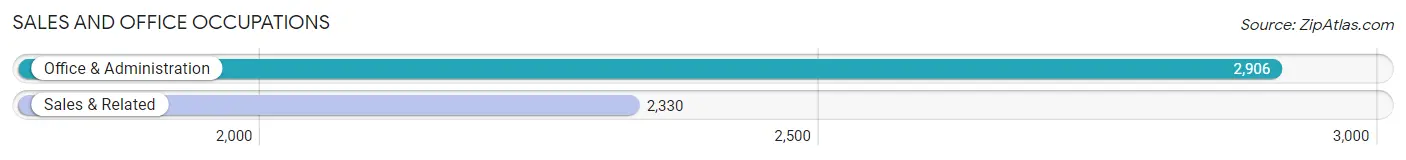
Sales and Office Occupations
The most common Sales and Office occupations in Porterville are Office & Administration (2,906 | 11.3%), and Sales & Related (2,330 | 9.1%).
Sales and Office Occupations by Sex
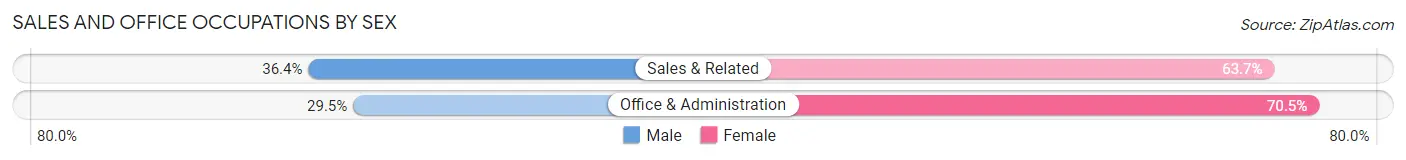
| Occupation | Male | Female |
| Sales & Related | 847 (36.3%) | 1,483 (63.6%) |
| Office & Administration | 856 (29.5%) | 2,050 (70.5%) |
| Total (Category) | 1,703 (32.5%) | 3,533 (67.5%) |
| Total (Overall) | 14,156 (55.1%) | 11,516 (44.9%) |
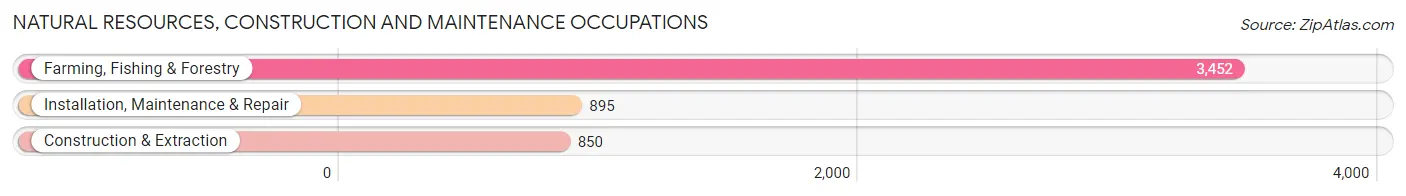
Natural Resources, Construction and Maintenance Occupations
The most common Natural Resources, Construction and Maintenance occupations in Porterville are Farming, Fishing & Forestry (3,452 | 13.5%), Installation, Maintenance & Repair (895 | 3.5%), and Construction & Extraction (850 | 3.3%).
Natural Resources, Construction and Maintenance Occupations by Sex
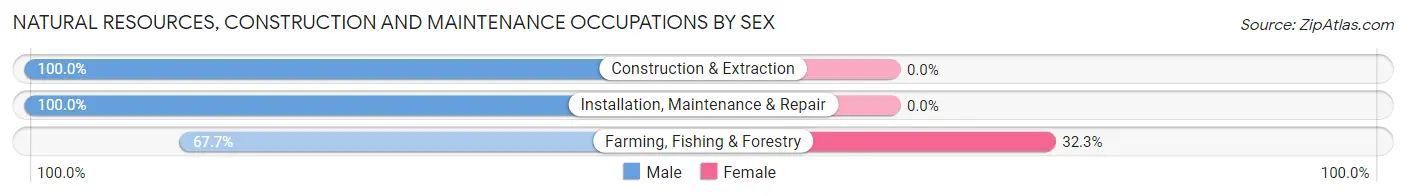
| Occupation | Male | Female |
| Farming, Fishing & Forestry | 2,336 (67.7%) | 1,116 (32.3%) |
| Construction & Extraction | 850 (100.0%) | 0 (0.0%) |
| Installation, Maintenance & Repair | 895 (100.0%) | 0 (0.0%) |
| Total (Category) | 4,081 (78.5%) | 1,116 (21.5%) |
| Total (Overall) | 14,156 (55.1%) | 11,516 (44.9%) |
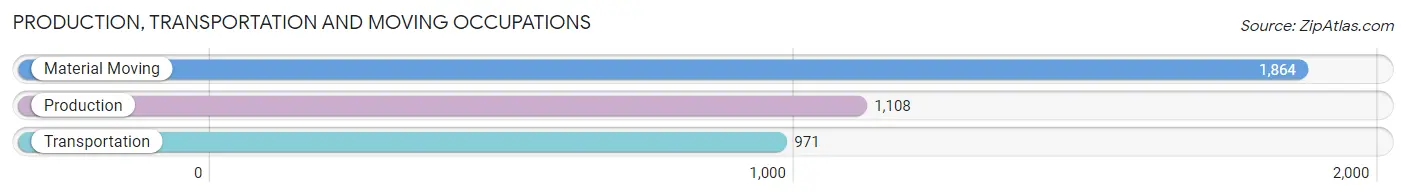
Production, Transportation and Moving Occupations
The most common Production, Transportation and Moving occupations in Porterville are Material Moving (1,864 | 7.3%), Production (1,108 | 4.3%), and Transportation (971 | 3.8%).
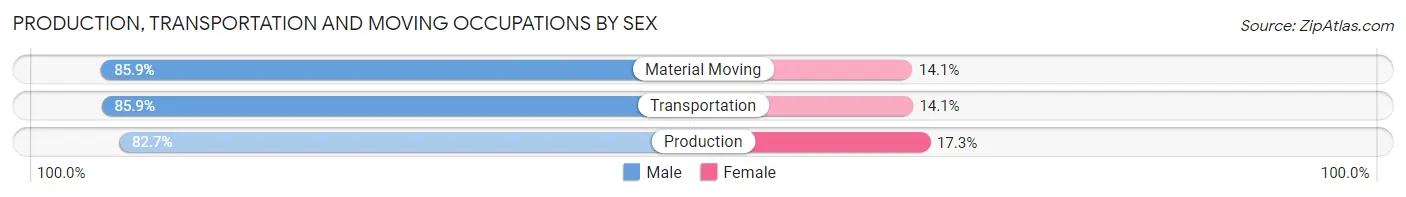
Production, Transportation and Moving Occupations by Sex
| Occupation | Male | Female |
| Production | 916 (82.7%) | 192 (17.3%) |
| Transportation | 834 (85.9%) | 137 (14.1%) |
| Material Moving | 1,602 (85.9%) | 262 (14.1%) |
| Total (Category) | 3,352 (85.0%) | 591 (15.0%) |
| Total (Overall) | 14,156 (55.1%) | 11,516 (44.9%) |
Employment Industries by Sex in Porterville
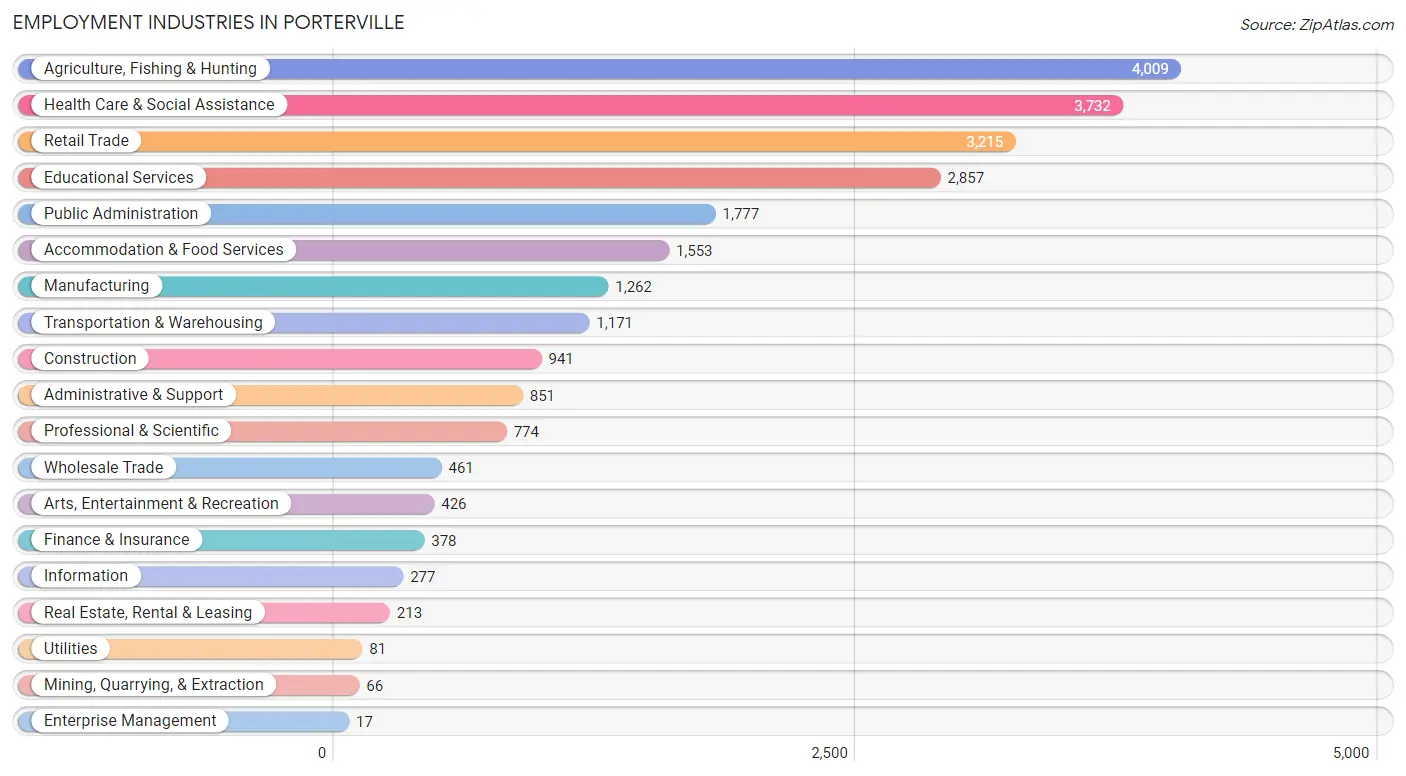
Employment Industries in Porterville
The major employment industries in Porterville include Agriculture, Fishing & Hunting (4,009 | 15.6%), Health Care & Social Assistance (3,732 | 14.5%), Retail Trade (3,215 | 12.5%), Educational Services (2,857 | 11.1%), and Public Administration (1,777 | 6.9%).
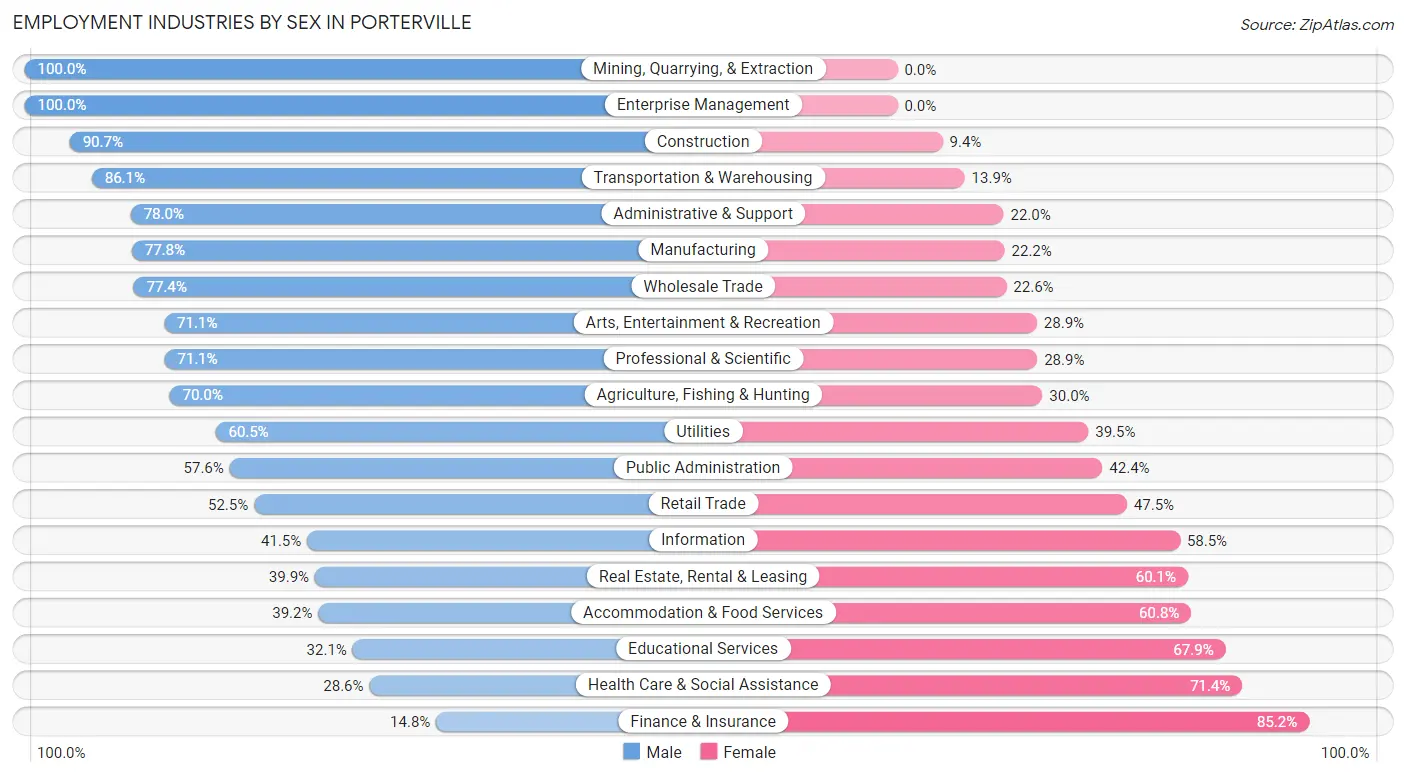
Employment Industries by Sex in Porterville
The Porterville industries that see more men than women are Mining, Quarrying, & Extraction (100.0%), Enterprise Management (100.0%), and Construction (90.6%), whereas the industries that tend to have a higher number of women are Finance & Insurance (85.2%), Health Care & Social Assistance (71.4%), and Educational Services (67.9%).
| Industry | Male | Female |
| Agriculture, Fishing & Hunting | 2,806 (70.0%) | 1,203 (30.0%) |
| Mining, Quarrying, & Extraction | 66 (100.0%) | 0 (0.0%) |
| Construction | 853 (90.6%) | 88 (9.3%) |
| Manufacturing | 982 (77.8%) | 280 (22.2%) |
| Wholesale Trade | 357 (77.4%) | 104 (22.6%) |
| Retail Trade | 1,688 (52.5%) | 1,527 (47.5%) |
| Transportation & Warehousing | 1,008 (86.1%) | 163 (13.9%) |
| Utilities | 49 (60.5%) | 32 (39.5%) |
| Information | 115 (41.5%) | 162 (58.5%) |
| Finance & Insurance | 56 (14.8%) | 322 (85.2%) |
| Real Estate, Rental & Leasing | 85 (39.9%) | 128 (60.1%) |
| Professional & Scientific | 550 (71.1%) | 224 (28.9%) |
| Enterprise Management | 17 (100.0%) | 0 (0.0%) |
| Administrative & Support | 664 (78.0%) | 187 (22.0%) |
| Educational Services | 917 (32.1%) | 1,940 (67.9%) |
| Health Care & Social Assistance | 1,069 (28.6%) | 2,663 (71.4%) |
| Arts, Entertainment & Recreation | 303 (71.1%) | 123 (28.9%) |
| Accommodation & Food Services | 609 (39.2%) | 944 (60.8%) |
| Public Administration | 1,023 (57.6%) | 754 (42.4%) |
| Total | 14,156 (55.1%) | 11,516 (44.9%) |
Education in Porterville
School Enrollment in Porterville
The most common levels of schooling among the 19,872 students in Porterville are middle school (5,126 | 25.8%), high school (5,016 | 25.2%), and college / undergraduate (3,723 | 18.7%).
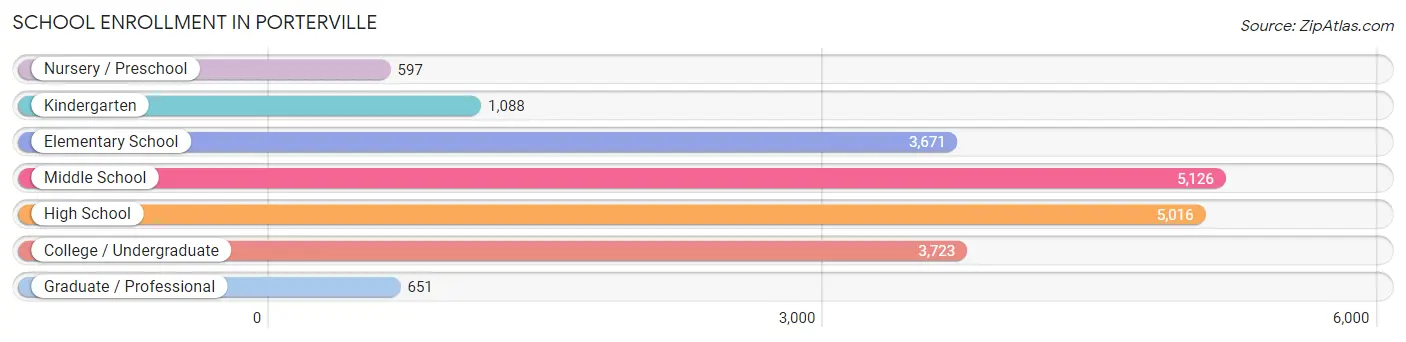
| School Level | # Students | % Students |
| Nursery / Preschool | 597 | 3.0% |
| Kindergarten | 1,088 | 5.5% |
| Elementary School | 3,671 | 18.5% |
| Middle School | 5,126 | 25.8% |
| High School | 5,016 | 25.2% |
| College / Undergraduate | 3,723 | 18.7% |
| Graduate / Professional | 651 | 3.3% |
| Total | 19,872 | 100.0% |
School Enrollment by Age by Funding Source in Porterville
Out of a total of 19,872 students who are enrolled in schools in Porterville, 1,093 (5.5%) attend a private institution, while the remaining 18,779 (94.5%) are enrolled in public schools. The age group of 35 years and over has the highest likelihood of being enrolled in private schools, with 413 (41.6% in the age bracket) enrolled. Conversely, the age group of 15 to 17 year olds has the lowest likelihood of being enrolled in a private school, with 3,672 (98.7% in the age bracket) attending a public institution.
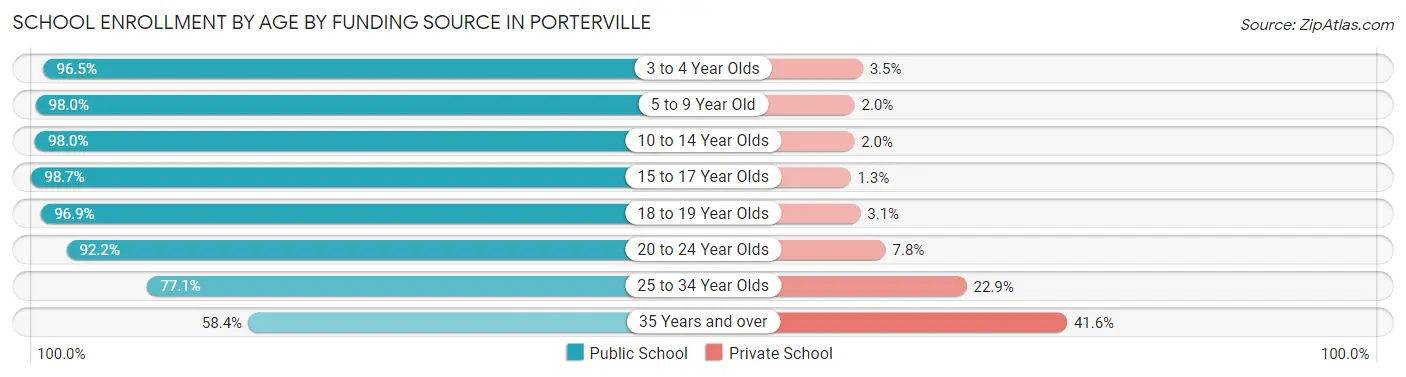
| Age Bracket | Public School | Private School |
| 3 to 4 Year Olds | 491 (96.5%) | 18 (3.5%) |
| 5 to 9 Year Old | 4,267 (98.0%) | 89 (2.0%) |
| 10 to 14 Year Olds | 6,314 (98.0%) | 126 (2.0%) |
| 15 to 17 Year Olds | 3,672 (98.7%) | 47 (1.3%) |
| 18 to 19 Year Olds | 1,000 (96.9%) | 32 (3.1%) |
| 20 to 24 Year Olds | 1,688 (92.2%) | 143 (7.8%) |
| 25 to 34 Year Olds | 765 (77.1%) | 227 (22.9%) |
| 35 Years and over | 580 (58.4%) | 413 (41.6%) |
| Total | 18,779 (94.5%) | 1,093 (5.5%) |
Educational Attainment by Field of Study in Porterville
Education (858 | 16.2%), business (664 | 12.5%), science & technology (619 | 11.7%), liberal arts & history (541 | 10.2%), and bio, nature & agricultural (449 | 8.5%) are the most common fields of study among 5,296 individuals in Porterville who have obtained a bachelor's degree or higher.
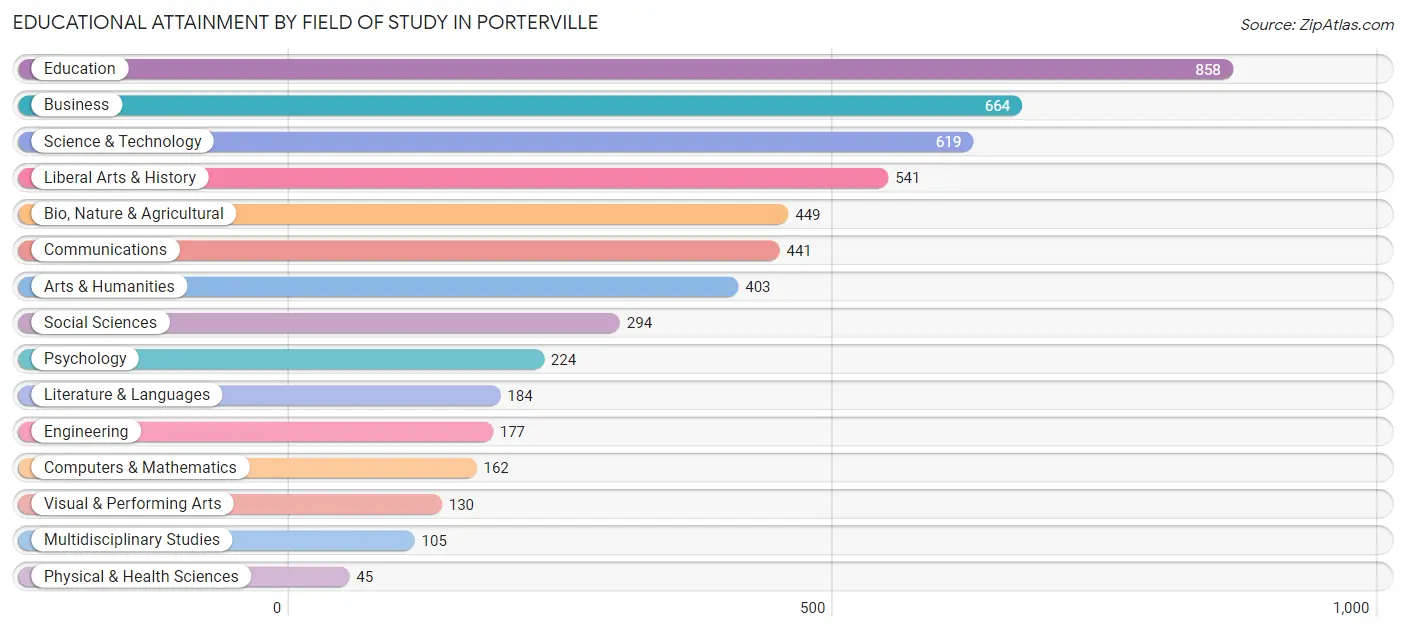
| Field of Study | # Graduates | % Graduates |
| Computers & Mathematics | 162 | 3.1% |
| Bio, Nature & Agricultural | 449 | 8.5% |
| Physical & Health Sciences | 45 | 0.9% |
| Psychology | 224 | 4.2% |
| Social Sciences | 294 | 5.6% |
| Engineering | 177 | 3.3% |
| Multidisciplinary Studies | 105 | 2.0% |
| Science & Technology | 619 | 11.7% |
| Business | 664 | 12.5% |
| Education | 858 | 16.2% |
| Literature & Languages | 184 | 3.5% |
| Liberal Arts & History | 541 | 10.2% |
| Visual & Performing Arts | 130 | 2.5% |
| Communications | 441 | 8.3% |
| Arts & Humanities | 403 | 7.6% |
| Total | 5,296 | 100.0% |
Transportation & Commute in Porterville
Vehicle Availability by Sex in Porterville
The most prevalent vehicle ownership categories in Porterville are males with 2 vehicles (5,781, accounting for 41.9%) and females with 2 vehicles (3,830, making up 53.3%).
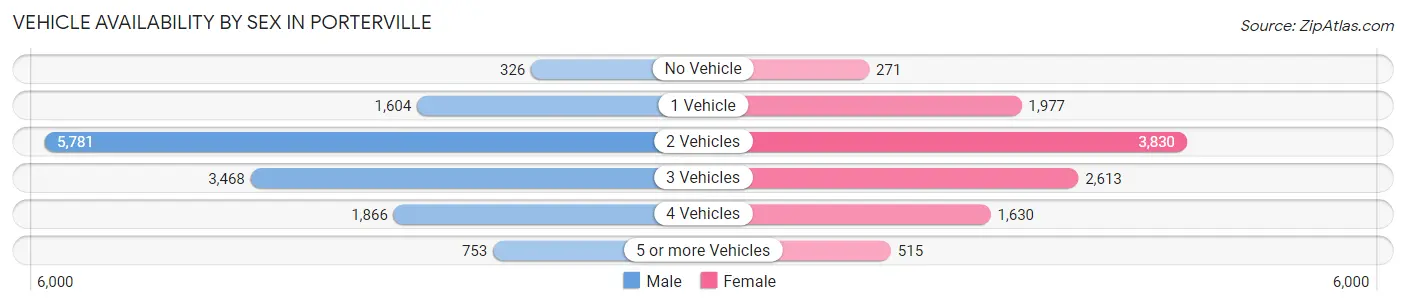
| Vehicles Available | Male | Female |
| No Vehicle | 326 (2.4%) | 271 (2.5%) |
| 1 Vehicle | 1,604 (11.6%) | 1,977 (18.2%) |
| 2 Vehicles | 5,781 (41.9%) | 3,830 (35.3%) |
| 3 Vehicles | 3,468 (25.1%) | 2,613 (24.1%) |
| 4 Vehicles | 1,866 (13.5%) | 1,630 (15.0%) |
| 5 or more Vehicles | 753 (5.5%) | 515 (4.8%) |
| Total | 13,798 (100.0%) | 10,836 (100.0%) |
Commute Time in Porterville
The most frequently occuring commute durations in Porterville are 5 to 9 minutes (5,220 commuters, 21.7%), 10 to 14 minutes (4,248 commuters, 17.6%), and 15 to 19 minutes (4,240 commuters, 17.6%).
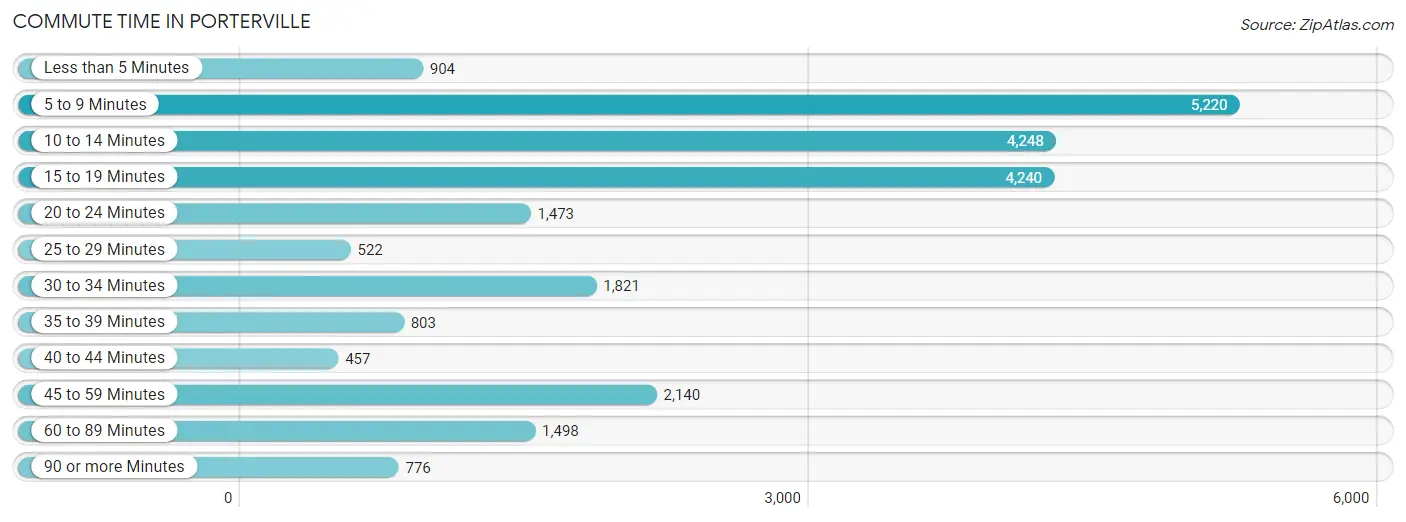
| Commute Time | # Commuters | % Commuters |
| Less than 5 Minutes | 904 | 3.7% |
| 5 to 9 Minutes | 5,220 | 21.7% |
| 10 to 14 Minutes | 4,248 | 17.6% |
| 15 to 19 Minutes | 4,240 | 17.6% |
| 20 to 24 Minutes | 1,473 | 6.1% |
| 25 to 29 Minutes | 522 | 2.2% |
| 30 to 34 Minutes | 1,821 | 7.6% |
| 35 to 39 Minutes | 803 | 3.3% |
| 40 to 44 Minutes | 457 | 1.9% |
| 45 to 59 Minutes | 2,140 | 8.9% |
| 60 to 89 Minutes | 1,498 | 6.2% |
| 90 or more Minutes | 776 | 3.2% |
Commute Time by Sex in Porterville
The most common commute times in Porterville are 5 to 9 minutes (2,802 commuters, 20.5%) for males and 5 to 9 minutes (2,418 commuters, 23.2%) for females.
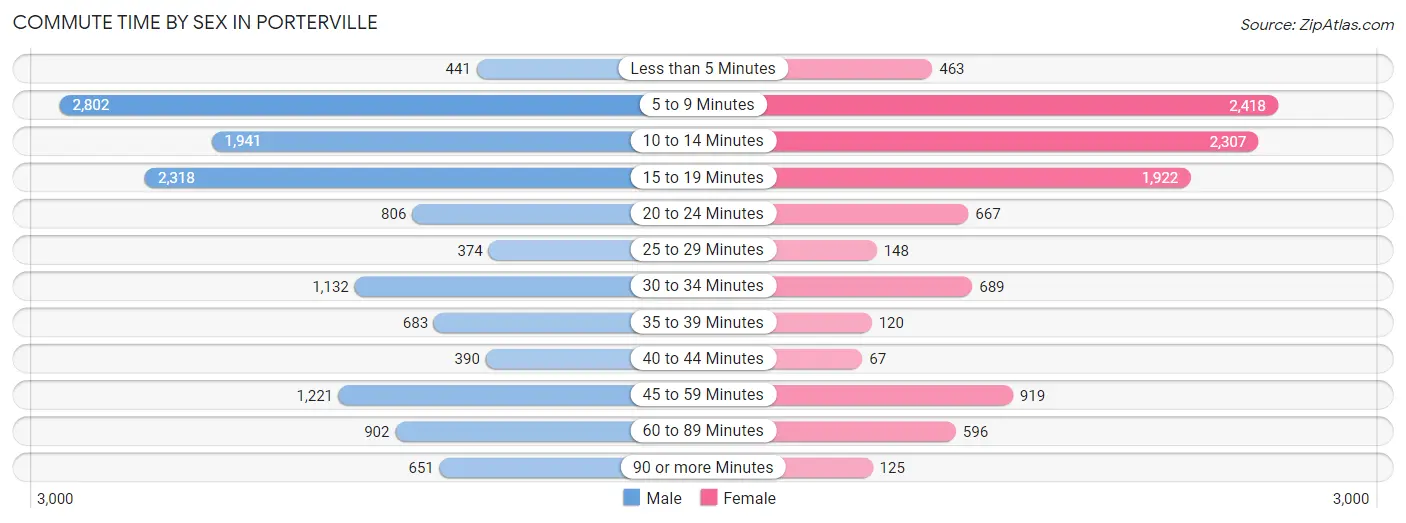
| Commute Time | Male | Female |
| Less than 5 Minutes | 441 (3.2%) | 463 (4.4%) |
| 5 to 9 Minutes | 2,802 (20.5%) | 2,418 (23.2%) |
| 10 to 14 Minutes | 1,941 (14.2%) | 2,307 (22.1%) |
| 15 to 19 Minutes | 2,318 (17.0%) | 1,922 (18.4%) |
| 20 to 24 Minutes | 806 (5.9%) | 667 (6.4%) |
| 25 to 29 Minutes | 374 (2.7%) | 148 (1.4%) |
| 30 to 34 Minutes | 1,132 (8.3%) | 689 (6.6%) |
| 35 to 39 Minutes | 683 (5.0%) | 120 (1.1%) |
| 40 to 44 Minutes | 390 (2.9%) | 67 (0.6%) |
| 45 to 59 Minutes | 1,221 (8.9%) | 919 (8.8%) |
| 60 to 89 Minutes | 902 (6.6%) | 596 (5.7%) |
| 90 or more Minutes | 651 (4.8%) | 125 (1.2%) |
Time of Departure to Work by Sex in Porterville
The most frequent times of departure to work in Porterville are 12:00 AM to 4:59 AM (1,861, 13.6%) for males and 7:30 AM to 7:59 AM (2,383, 22.8%) for females.
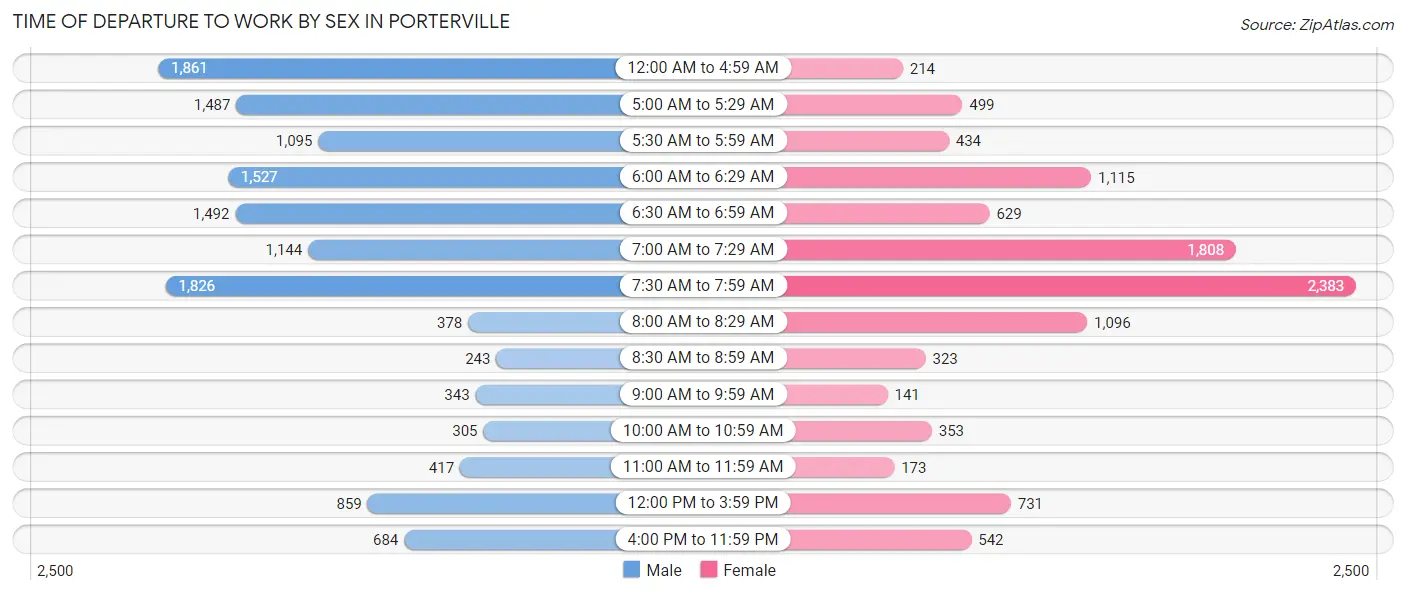
| Time of Departure | Male | Female |
| 12:00 AM to 4:59 AM | 1,861 (13.6%) | 214 (2.1%) |
| 5:00 AM to 5:29 AM | 1,487 (10.9%) | 499 (4.8%) |
| 5:30 AM to 5:59 AM | 1,095 (8.0%) | 434 (4.2%) |
| 6:00 AM to 6:29 AM | 1,527 (11.2%) | 1,115 (10.7%) |
| 6:30 AM to 6:59 AM | 1,492 (10.9%) | 629 (6.0%) |
| 7:00 AM to 7:29 AM | 1,144 (8.4%) | 1,808 (17.3%) |
| 7:30 AM to 7:59 AM | 1,826 (13.4%) | 2,383 (22.8%) |
| 8:00 AM to 8:29 AM | 378 (2.8%) | 1,096 (10.5%) |
| 8:30 AM to 8:59 AM | 243 (1.8%) | 323 (3.1%) |
| 9:00 AM to 9:59 AM | 343 (2.5%) | 141 (1.3%) |
| 10:00 AM to 10:59 AM | 305 (2.2%) | 353 (3.4%) |
| 11:00 AM to 11:59 AM | 417 (3.0%) | 173 (1.7%) |
| 12:00 PM to 3:59 PM | 859 (6.3%) | 731 (7.0%) |
| 4:00 PM to 11:59 PM | 684 (5.0%) | 542 (5.2%) |
| Total | 13,661 (100.0%) | 10,441 (100.0%) |
Housing Occupancy in Porterville
Occupancy by Ownership in Porterville
Of the total 18,925 dwellings in Porterville, owner-occupied units account for 10,418 (55.0%), while renter-occupied units make up 8,507 (45.0%).
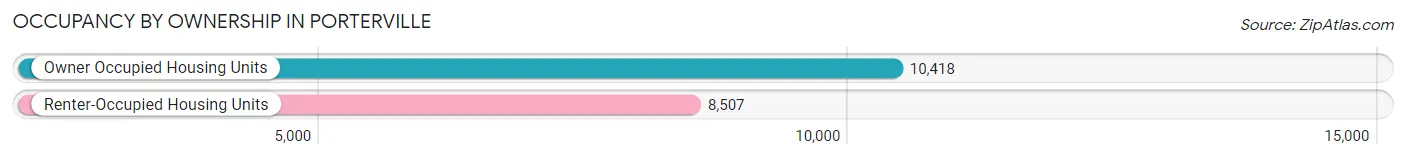
| Occupancy | # Housing Units | % Housing Units |
| Owner Occupied Housing Units | 10,418 | 55.0% |
| Renter-Occupied Housing Units | 8,507 | 45.0% |
| Total Occupied Housing Units | 18,925 | 100.0% |
Occupancy by Household Size in Porterville
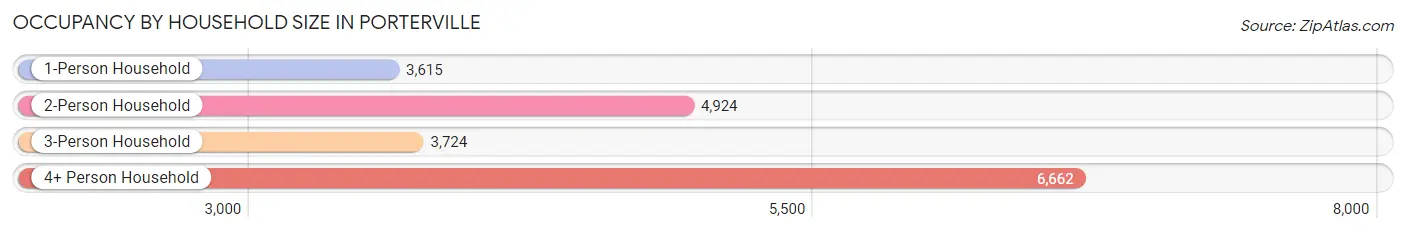
| Household Size | # Housing Units | % Housing Units |
| 1-Person Household | 3,615 | 19.1% |
| 2-Person Household | 4,924 | 26.0% |
| 3-Person Household | 3,724 | 19.7% |
| 4+ Person Household | 6,662 | 35.2% |
| Total Housing Units | 18,925 | 100.0% |
Occupancy by Ownership by Household Size in Porterville
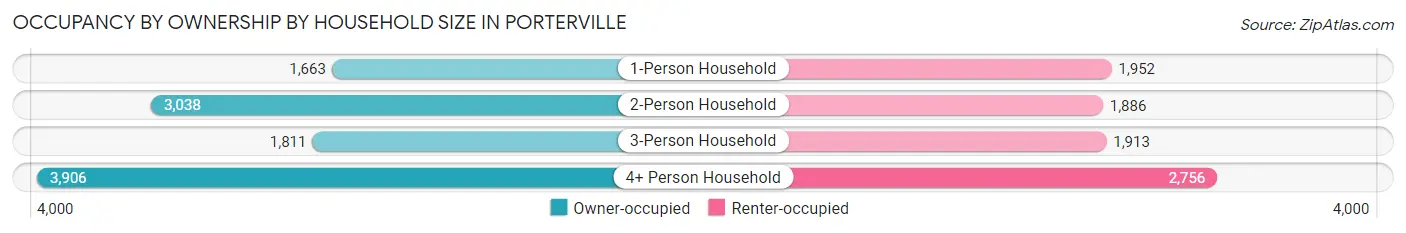
| Household Size | Owner-occupied | Renter-occupied |
| 1-Person Household | 1,663 (46.0%) | 1,952 (54.0%) |
| 2-Person Household | 3,038 (61.7%) | 1,886 (38.3%) |
| 3-Person Household | 1,811 (48.6%) | 1,913 (51.4%) |
| 4+ Person Household | 3,906 (58.6%) | 2,756 (41.4%) |
| Total Housing Units | 10,418 (55.0%) | 8,507 (45.0%) |
Occupancy by Educational Attainment in Porterville
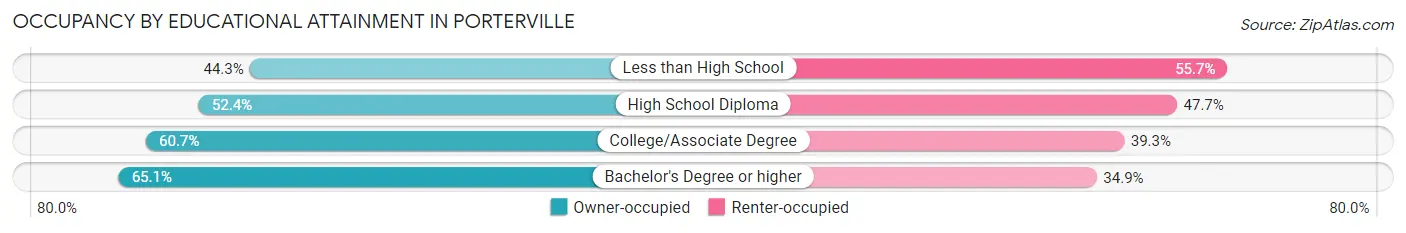
| Household Size | Owner-occupied | Renter-occupied |
| Less than High School | 2,272 (44.3%) | 2,854 (55.7%) |
| High School Diploma | 2,310 (52.3%) | 2,103 (47.6%) |
| College/Associate Degree | 3,785 (60.7%) | 2,449 (39.3%) |
| Bachelor's Degree or higher | 2,051 (65.1%) | 1,101 (34.9%) |
Occupancy by Age of Householder in Porterville
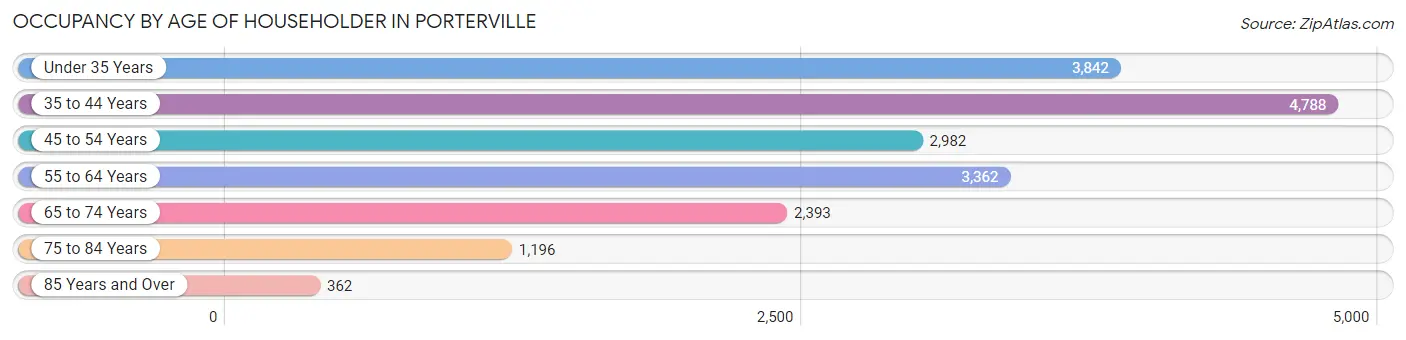
| Age Bracket | # Households | % Households |
| Under 35 Years | 3,842 | 20.3% |
| 35 to 44 Years | 4,788 | 25.3% |
| 45 to 54 Years | 2,982 | 15.8% |
| 55 to 64 Years | 3,362 | 17.8% |
| 65 to 74 Years | 2,393 | 12.6% |
| 75 to 84 Years | 1,196 | 6.3% |
| 85 Years and Over | 362 | 1.9% |
| Total | 18,925 | 100.0% |
Housing Finances in Porterville
Median Income by Occupancy in Porterville
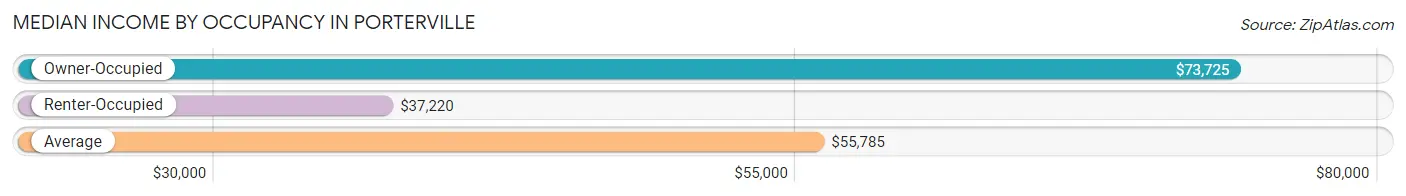
| Occupancy Type | # Households | Median Income |
| Owner-Occupied | 10,418 (55.0%) | $73,725 |
| Renter-Occupied | 8,507 (45.0%) | $37,220 |
| Average | 18,925 (100.0%) | $55,785 |
Occupancy by Householder Income Bracket in Porterville
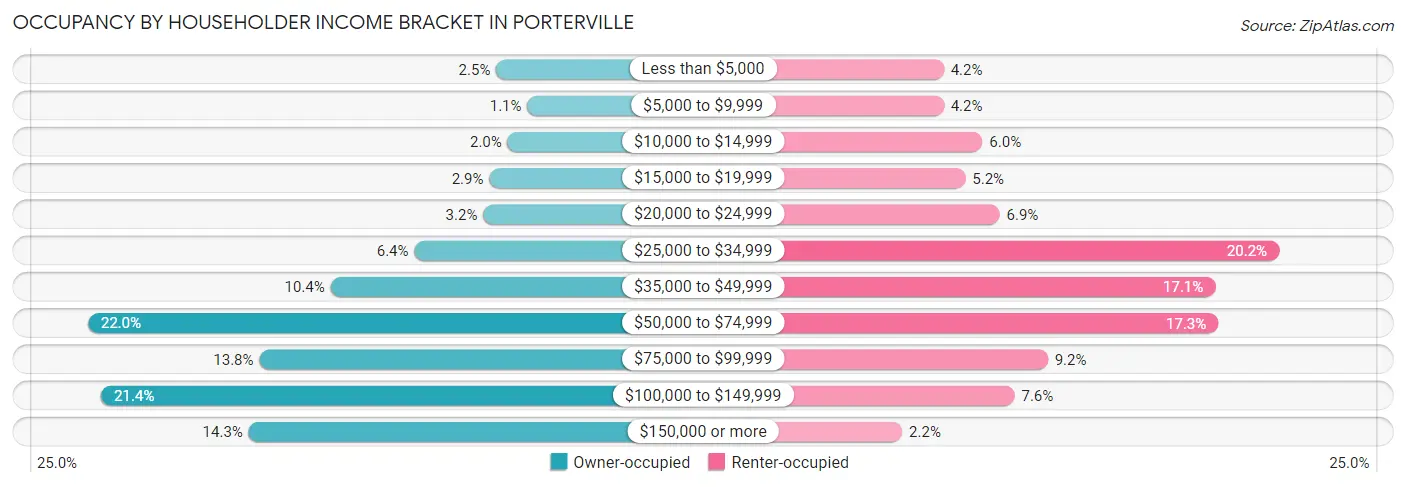
| Income Bracket | Owner-occupied | Renter-occupied |
| Less than $5,000 | 265 (2.5%) | 357 (4.2%) |
| $5,000 to $9,999 | 110 (1.1%) | 357 (4.2%) |
| $10,000 to $14,999 | 208 (2.0%) | 514 (6.0%) |
| $15,000 to $19,999 | 299 (2.9%) | 445 (5.2%) |
| $20,000 to $24,999 | 329 (3.2%) | 584 (6.9%) |
| $25,000 to $34,999 | 671 (6.4%) | 1,715 (20.2%) |
| $35,000 to $49,999 | 1,087 (10.4%) | 1,456 (17.1%) |
| $50,000 to $74,999 | 2,291 (22.0%) | 1,468 (17.3%) |
| $75,000 to $99,999 | 1,440 (13.8%) | 778 (9.1%) |
| $100,000 to $149,999 | 2,225 (21.4%) | 644 (7.6%) |
| $150,000 or more | 1,493 (14.3%) | 189 (2.2%) |
| Total | 10,418 (100.0%) | 8,507 (100.0%) |
Monthly Housing Cost Tiers in Porterville
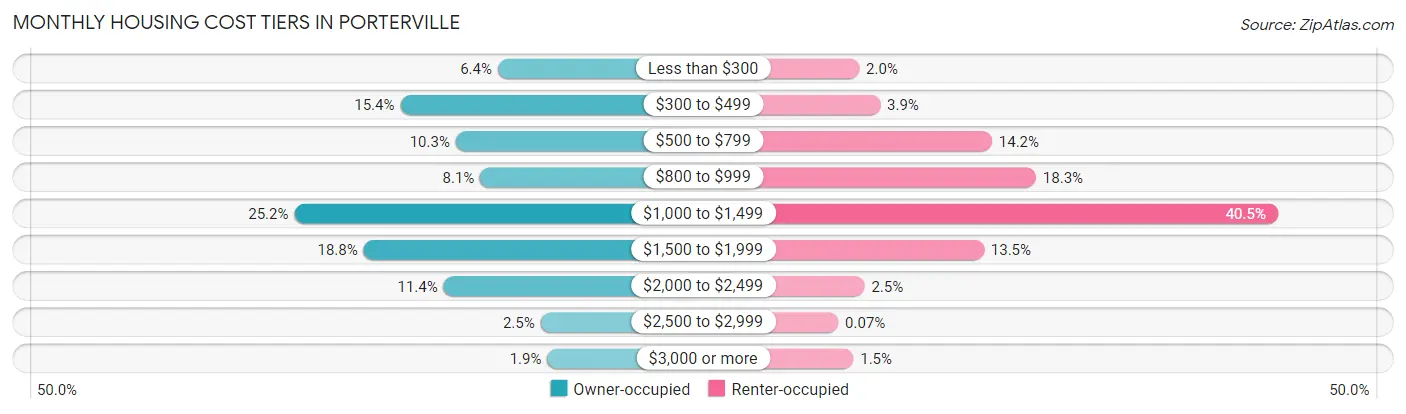
| Monthly Cost | Owner-occupied | Renter-occupied |
| Less than $300 | 671 (6.4%) | 170 (2.0%) |
| $300 to $499 | 1,605 (15.4%) | 334 (3.9%) |
| $500 to $799 | 1,074 (10.3%) | 1,210 (14.2%) |
| $800 to $999 | 840 (8.1%) | 1,554 (18.3%) |
| $1,000 to $1,499 | 2,622 (25.2%) | 3,448 (40.5%) |
| $1,500 to $1,999 | 1,959 (18.8%) | 1,147 (13.5%) |
| $2,000 to $2,499 | 1,191 (11.4%) | 212 (2.5%) |
| $2,500 to $2,999 | 260 (2.5%) | 6 (0.1%) |
| $3,000 or more | 196 (1.9%) | 124 (1.5%) |
| Total | 10,418 (100.0%) | 8,507 (100.0%) |
Physical Housing Characteristics in Porterville
Housing Structures in Porterville
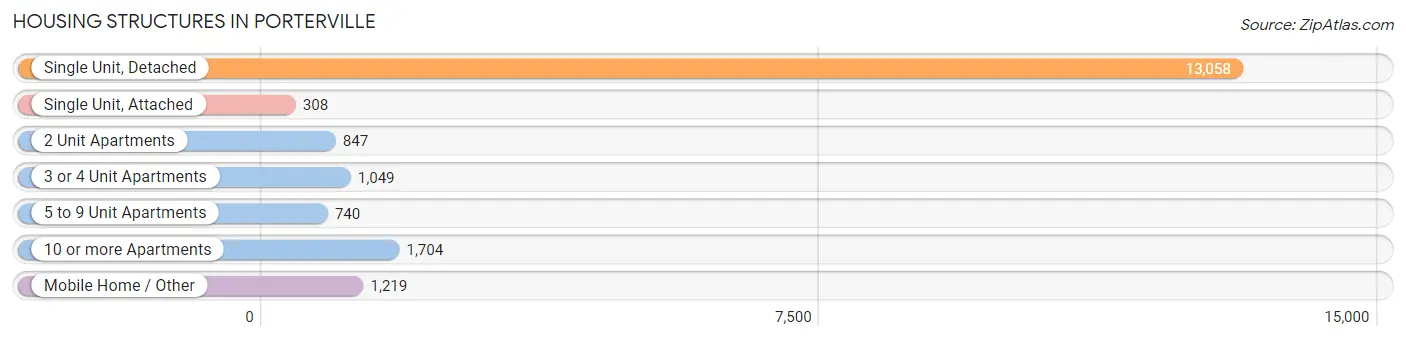
| Structure Type | # Housing Units | % Housing Units |
| Single Unit, Detached | 13,058 | 69.0% |
| Single Unit, Attached | 308 | 1.6% |
| 2 Unit Apartments | 847 | 4.5% |
| 3 or 4 Unit Apartments | 1,049 | 5.5% |
| 5 to 9 Unit Apartments | 740 | 3.9% |
| 10 or more Apartments | 1,704 | 9.0% |
| Mobile Home / Other | 1,219 | 6.4% |
| Total | 18,925 | 100.0% |
Housing Structures by Occupancy in Porterville
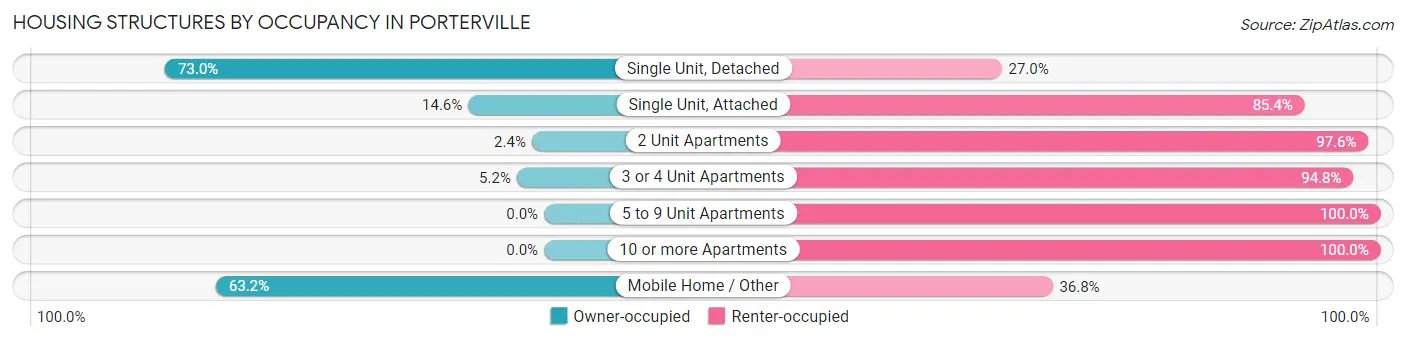
| Structure Type | Owner-occupied | Renter-occupied |
| Single Unit, Detached | 9,528 (73.0%) | 3,530 (27.0%) |
| Single Unit, Attached | 45 (14.6%) | 263 (85.4%) |
| 2 Unit Apartments | 20 (2.4%) | 827 (97.6%) |
| 3 or 4 Unit Apartments | 55 (5.2%) | 994 (94.8%) |
| 5 to 9 Unit Apartments | 0 (0.0%) | 740 (100.0%) |
| 10 or more Apartments | 0 (0.0%) | 1,704 (100.0%) |
| Mobile Home / Other | 770 (63.2%) | 449 (36.8%) |
| Total | 10,418 (55.0%) | 8,507 (45.0%) |
Housing Structures by Number of Rooms in Porterville
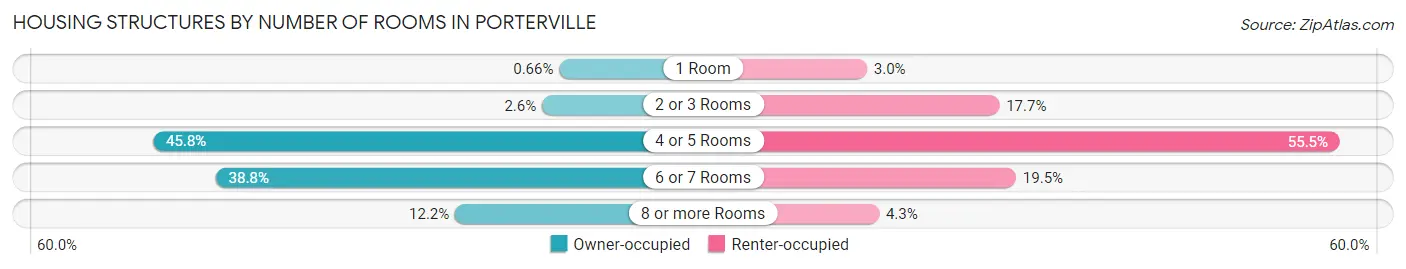
| Number of Rooms | Owner-occupied | Renter-occupied |
| 1 Room | 69 (0.7%) | 254 (3.0%) |
| 2 or 3 Rooms | 268 (2.6%) | 1,504 (17.7%) |
| 4 or 5 Rooms | 4,766 (45.8%) | 4,720 (55.5%) |
| 6 or 7 Rooms | 4,042 (38.8%) | 1,661 (19.5%) |
| 8 or more Rooms | 1,273 (12.2%) | 368 (4.3%) |
| Total | 10,418 (100.0%) | 8,507 (100.0%) |
Housing Structure by Heating Type in Porterville
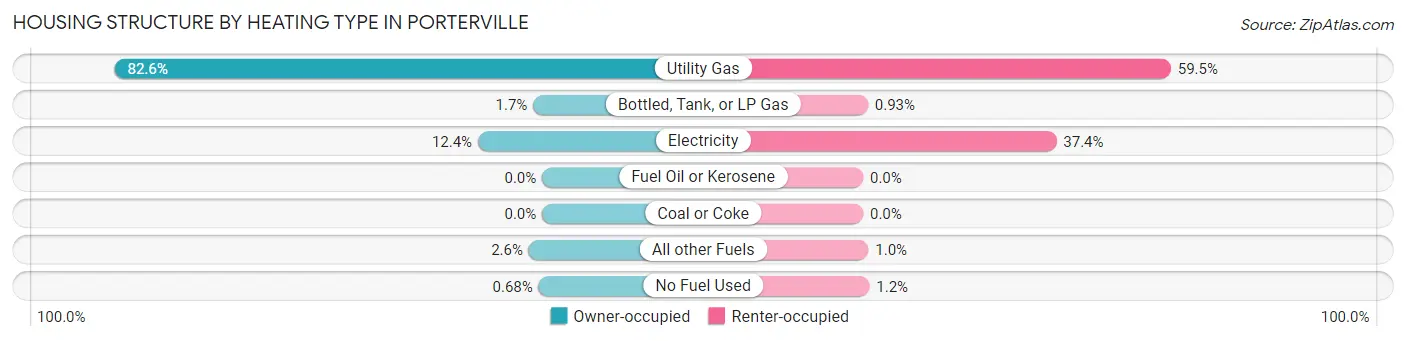
| Heating Type | Owner-occupied | Renter-occupied |
| Utility Gas | 8,607 (82.6%) | 5,059 (59.5%) |
| Bottled, Tank, or LP Gas | 180 (1.7%) | 79 (0.9%) |
| Electricity | 1,292 (12.4%) | 3,178 (37.4%) |
| Fuel Oil or Kerosene | 0 (0.0%) | 0 (0.0%) |
| Coal or Coke | 0 (0.0%) | 0 (0.0%) |
| All other Fuels | 268 (2.6%) | 87 (1.0%) |
| No Fuel Used | 71 (0.7%) | 104 (1.2%) |
| Total | 10,418 (100.0%) | 8,507 (100.0%) |
Household Vehicle Usage in Porterville
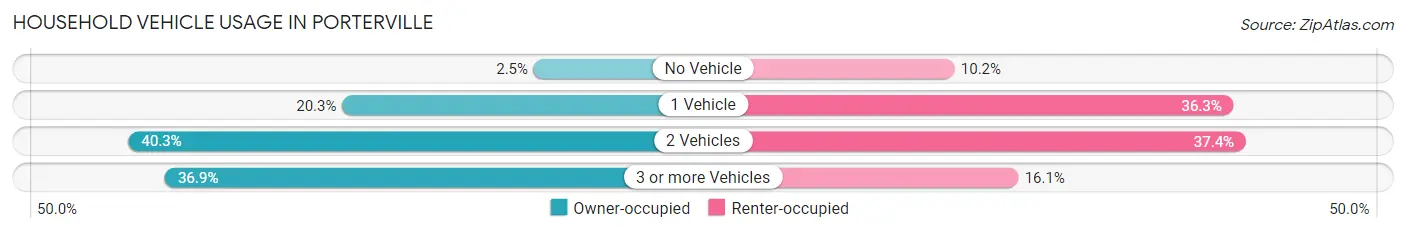
| Vehicles per Household | Owner-occupied | Renter-occupied |
| No Vehicle | 256 (2.5%) | 865 (10.2%) |
| 1 Vehicle | 2,119 (20.3%) | 3,086 (36.3%) |
| 2 Vehicles | 4,200 (40.3%) | 3,184 (37.4%) |
| 3 or more Vehicles | 3,843 (36.9%) | 1,372 (16.1%) |
| Total | 10,418 (100.0%) | 8,507 (100.0%) |
Real Estate & Mortgages in Porterville
Real Estate and Mortgage Overview in Porterville
| Characteristic | Without Mortgage | With Mortgage |
| Housing Units | 3,620 | 6,798 |
| Median Property Value | $216,800 | $260,400 |
| Median Household Income | $49,709 | $1,212 |
| Monthly Housing Costs | $445 | $196 |
| Real Estate Taxes | $1,375 | $234 |
Property Value by Mortgage Status in Porterville
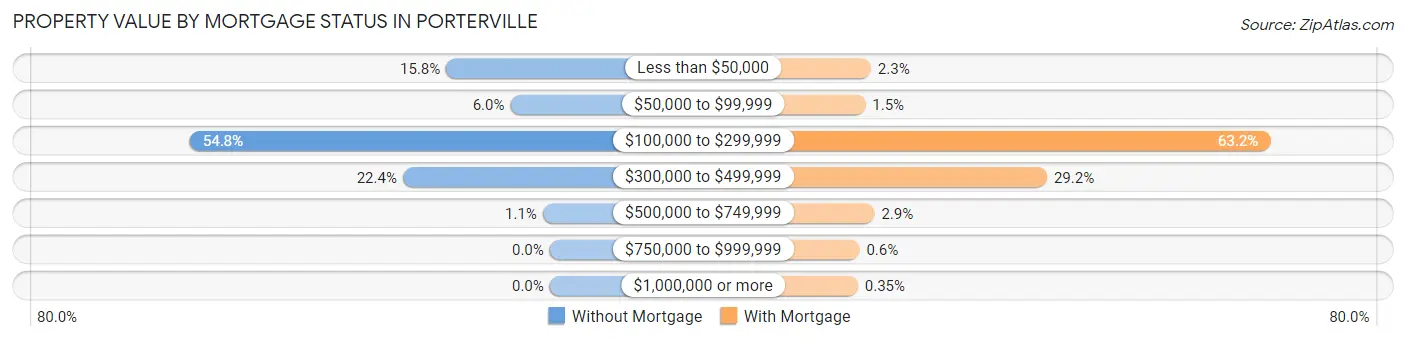
| Property Value | Without Mortgage | With Mortgage |
| Less than $50,000 | 571 (15.8%) | 159 (2.3%) |
| $50,000 to $99,999 | 217 (6.0%) | 101 (1.5%) |
| $100,000 to $299,999 | 1,984 (54.8%) | 4,294 (63.2%) |
| $300,000 to $499,999 | 810 (22.4%) | 1,983 (29.2%) |
| $500,000 to $749,999 | 38 (1.1%) | 196 (2.9%) |
| $750,000 to $999,999 | 0 (0.0%) | 41 (0.6%) |
| $1,000,000 or more | 0 (0.0%) | 24 (0.4%) |
| Total | 3,620 (100.0%) | 6,798 (100.0%) |
Household Income by Mortgage Status in Porterville
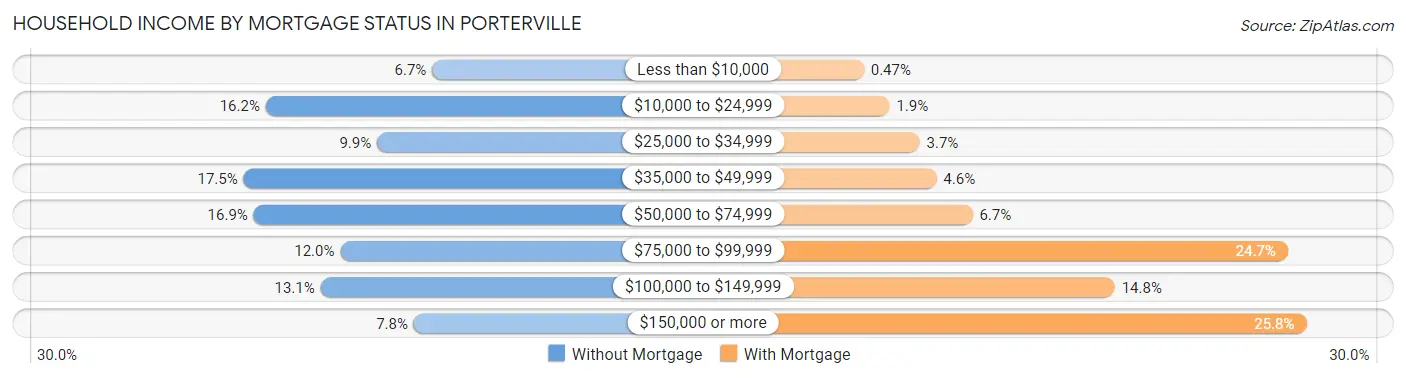
| Household Income | Without Mortgage | With Mortgage |
| Less than $10,000 | 243 (6.7%) | 32 (0.5%) |
| $10,000 to $24,999 | 587 (16.2%) | 132 (1.9%) |
| $25,000 to $34,999 | 357 (9.9%) | 249 (3.7%) |
| $35,000 to $49,999 | 633 (17.5%) | 314 (4.6%) |
| $50,000 to $74,999 | 612 (16.9%) | 454 (6.7%) |
| $75,000 to $99,999 | 433 (12.0%) | 1,679 (24.7%) |
| $100,000 to $149,999 | 474 (13.1%) | 1,007 (14.8%) |
| $150,000 or more | 281 (7.8%) | 1,751 (25.8%) |
| Total | 3,620 (100.0%) | 6,798 (100.0%) |
Property Value to Household Income Ratio in Porterville
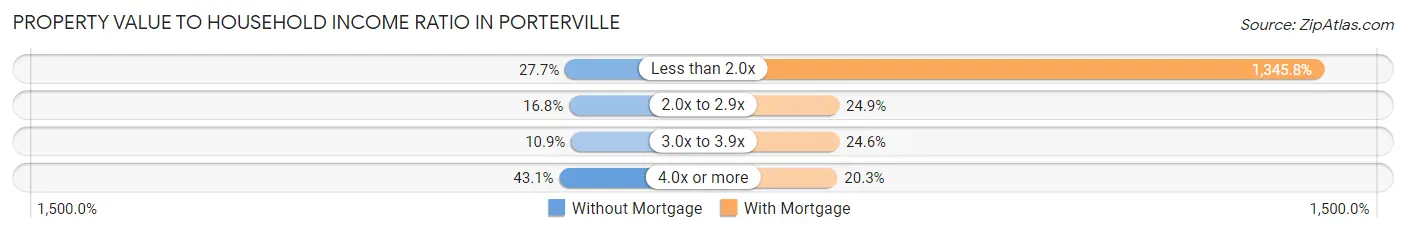
| Value-to-Income Ratio | Without Mortgage | With Mortgage |
| Less than 2.0x | 1,003 (27.7%) | 91,484 (1,345.7%) |
| 2.0x to 2.9x | 609 (16.8%) | 1,693 (24.9%) |
| 3.0x to 3.9x | 395 (10.9%) | 1,673 (24.6%) |
| 4.0x or more | 1,561 (43.1%) | 1,382 (20.3%) |
| Total | 3,620 (100.0%) | 6,798 (100.0%) |
Real Estate Taxes by Mortgage Status in Porterville
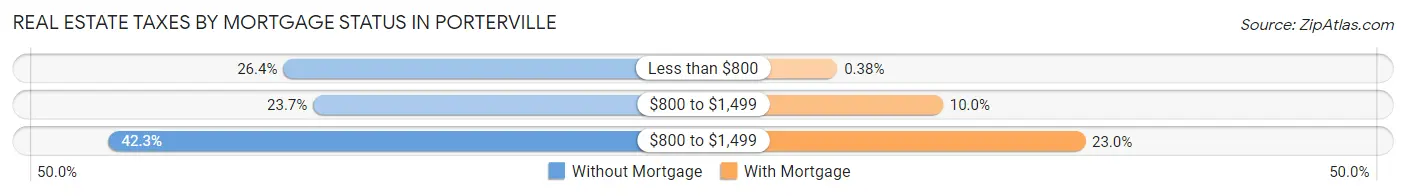
| Property Taxes | Without Mortgage | With Mortgage |
| Less than $800 | 955 (26.4%) | 26 (0.4%) |
| $800 to $1,499 | 856 (23.6%) | 681 (10.0%) |
| $800 to $1,499 | 1,532 (42.3%) | 1,564 (23.0%) |
| Total | 3,620 (100.0%) | 6,798 (100.0%) |
Health & Disability in Porterville
Health Insurance Coverage by Age in Porterville
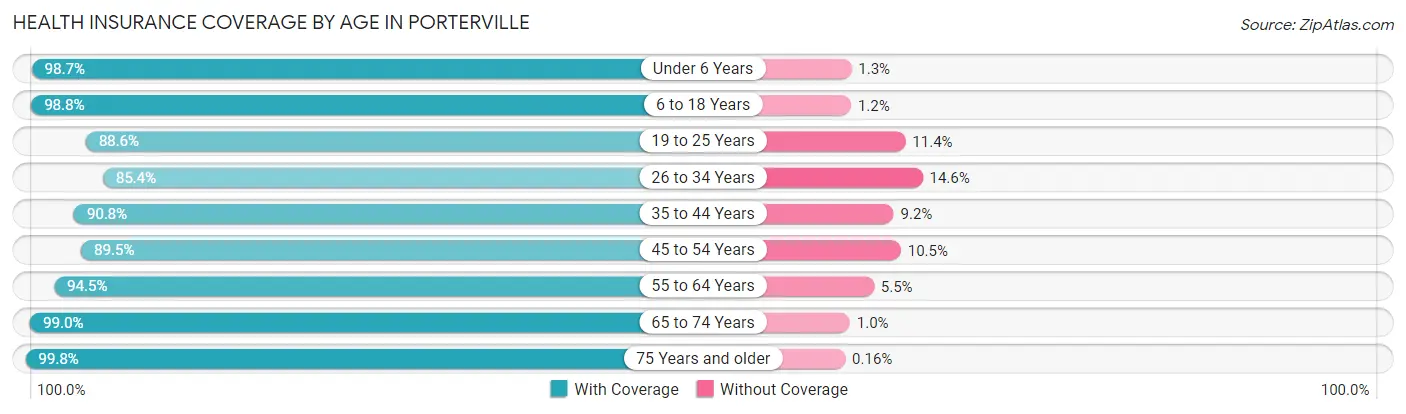
| Age Bracket | With Coverage | Without Coverage |
| Under 6 Years | 5,025 (98.7%) | 67 (1.3%) |
| 6 to 18 Years | 14,444 (98.8%) | 181 (1.2%) |
| 19 to 25 Years | 6,045 (88.6%) | 778 (11.4%) |
| 26 to 34 Years | 6,330 (85.4%) | 1,081 (14.6%) |
| 35 to 44 Years | 8,024 (90.8%) | 812 (9.2%) |
| 45 to 54 Years | 5,618 (89.5%) | 662 (10.5%) |
| 55 to 64 Years | 5,403 (94.5%) | 315 (5.5%) |
| 65 to 74 Years | 4,289 (99.0%) | 45 (1.0%) |
| 75 Years and older | 2,506 (99.8%) | 4 (0.2%) |
| Total | 57,684 (93.6%) | 3,945 (6.4%) |
Health Insurance Coverage by Citizenship Status in Porterville
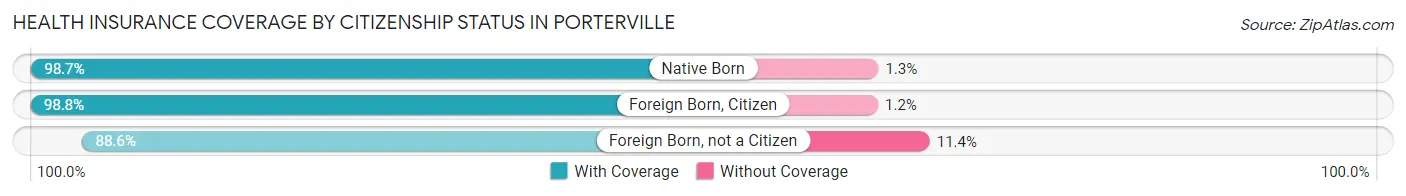
| Citizenship Status | With Coverage | Without Coverage |
| Native Born | 5,025 (98.7%) | 67 (1.3%) |
| Foreign Born, Citizen | 14,444 (98.8%) | 181 (1.2%) |
| Foreign Born, not a Citizen | 6,045 (88.6%) | 778 (11.4%) |
Health Insurance Coverage by Household Income in Porterville
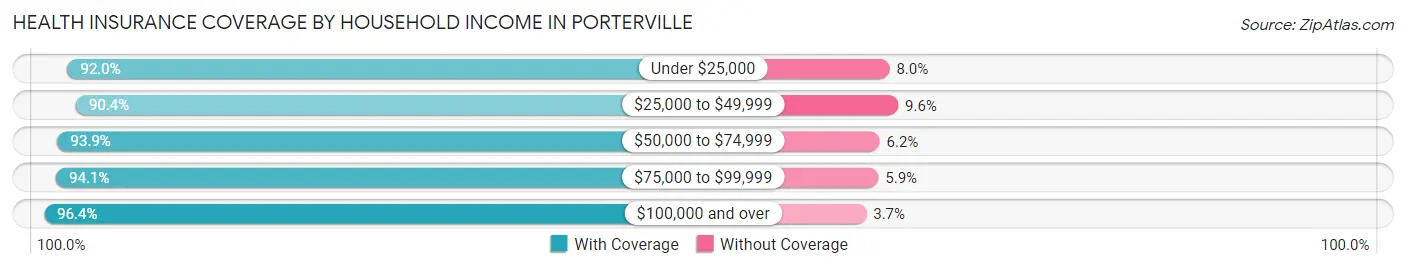
| Household Income | With Coverage | Without Coverage |
| Under $25,000 | 6,730 (92.0%) | 585 (8.0%) |
| $25,000 to $49,999 | 13,459 (90.4%) | 1,431 (9.6%) |
| $50,000 to $74,999 | 11,511 (93.9%) | 754 (6.1%) |
| $75,000 to $99,999 | 7,954 (94.1%) | 500 (5.9%) |
| $100,000 and over | 17,435 (96.4%) | 661 (3.6%) |
Public vs Private Health Insurance Coverage by Age in Porterville
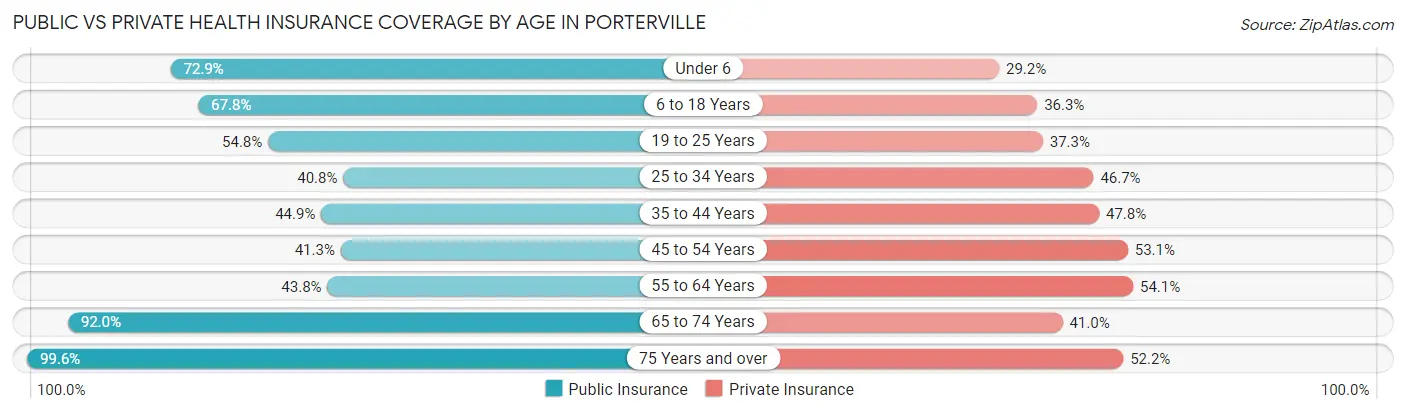
| Age Bracket | Public Insurance | Private Insurance |
| Under 6 | 3,713 (72.9%) | 1,486 (29.2%) |
| 6 to 18 Years | 9,915 (67.8%) | 5,304 (36.3%) |
| 19 to 25 Years | 3,739 (54.8%) | 2,546 (37.3%) |
| 25 to 34 Years | 3,027 (40.8%) | 3,462 (46.7%) |
| 35 to 44 Years | 3,971 (44.9%) | 4,219 (47.7%) |
| 45 to 54 Years | 2,595 (41.3%) | 3,334 (53.1%) |
| 55 to 64 Years | 2,504 (43.8%) | 3,091 (54.1%) |
| 65 to 74 Years | 3,986 (92.0%) | 1,775 (41.0%) |
| 75 Years and over | 2,499 (99.6%) | 1,311 (52.2%) |
| Total | 35,949 (58.3%) | 26,528 (43.0%) |
Disability Status by Sex by Age in Porterville
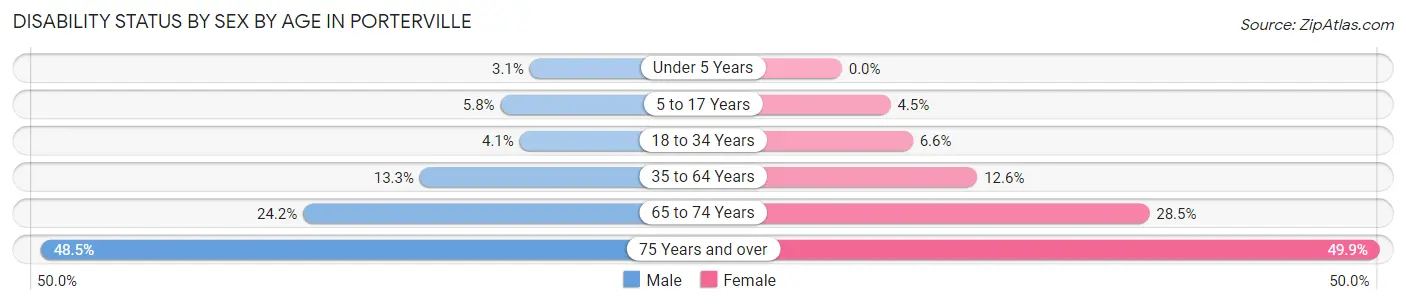
| Age Bracket | Male | Female |
| Under 5 Years | 77 (3.1%) | 0 (0.0%) |
| 5 to 17 Years | 447 (5.8%) | 329 (4.5%) |
| 18 to 34 Years | 298 (4.1%) | 489 (6.6%) |
| 35 to 64 Years | 1,374 (13.3%) | 1,322 (12.6%) |
| 65 to 74 Years | 535 (24.2%) | 605 (28.5%) |
| 75 Years and over | 583 (48.5%) | 653 (49.9%) |
Disability Class by Sex by Age in Porterville
Disability Class: Hearing Difficulty
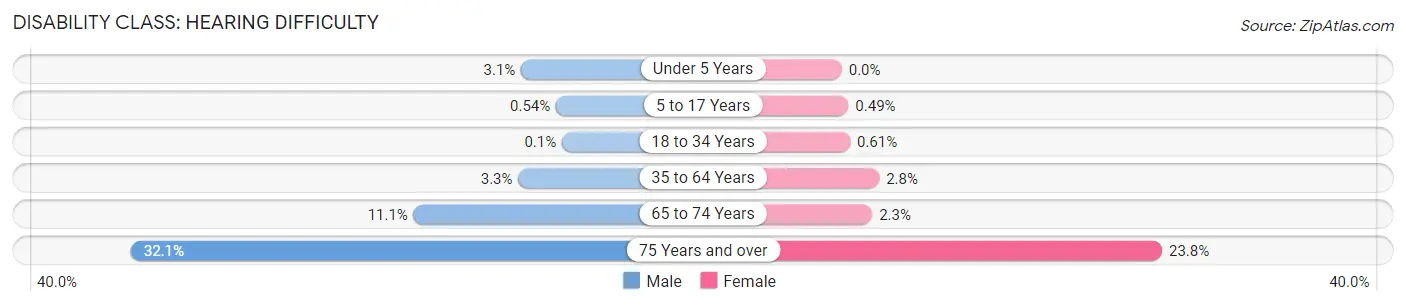
| Age Bracket | Male | Female |
| Under 5 Years | 77 (3.1%) | 0 (0.0%) |
| 5 to 17 Years | 41 (0.5%) | 36 (0.5%) |
| 18 to 34 Years | 7 (0.1%) | 45 (0.6%) |
| 35 to 64 Years | 344 (3.3%) | 293 (2.8%) |
| 65 to 74 Years | 246 (11.1%) | 48 (2.3%) |
| 75 Years and over | 386 (32.1%) | 311 (23.8%) |
Disability Class: Vision Difficulty
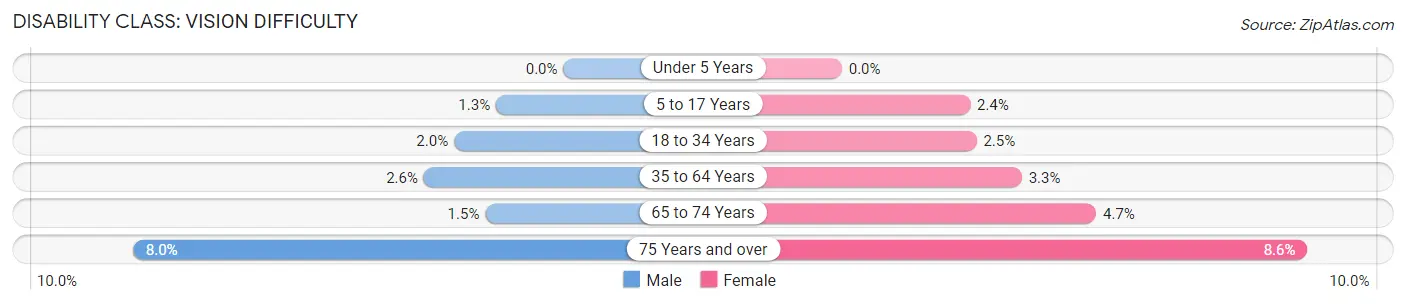
| Age Bracket | Male | Female |
| Under 5 Years | 0 (0.0%) | 0 (0.0%) |
| 5 to 17 Years | 96 (1.3%) | 173 (2.4%) |
| 18 to 34 Years | 149 (2.0%) | 186 (2.5%) |
| 35 to 64 Years | 267 (2.6%) | 351 (3.3%) |
| 65 to 74 Years | 32 (1.5%) | 100 (4.7%) |
| 75 Years and over | 96 (8.0%) | 113 (8.6%) |
Disability Class: Cognitive Difficulty
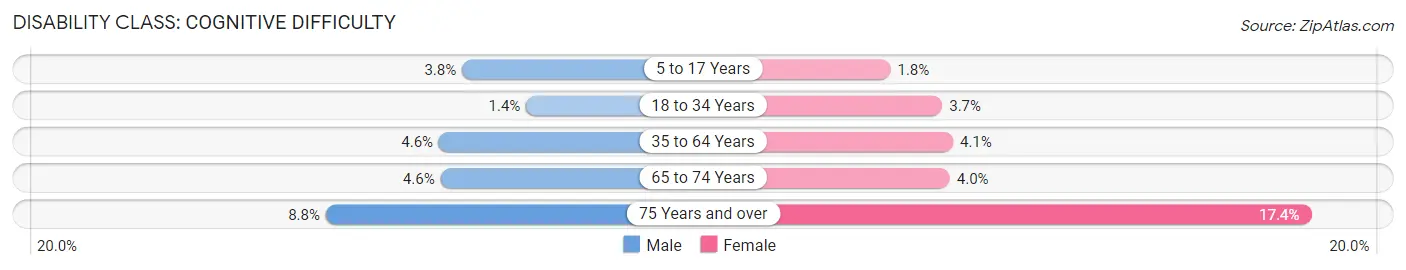
| Age Bracket | Male | Female |
| 5 to 17 Years | 288 (3.8%) | 132 (1.8%) |
| 18 to 34 Years | 101 (1.4%) | 277 (3.7%) |
| 35 to 64 Years | 476 (4.6%) | 435 (4.1%) |
| 65 to 74 Years | 101 (4.6%) | 85 (4.0%) |
| 75 Years and over | 106 (8.8%) | 228 (17.4%) |
Disability Class: Ambulatory Difficulty
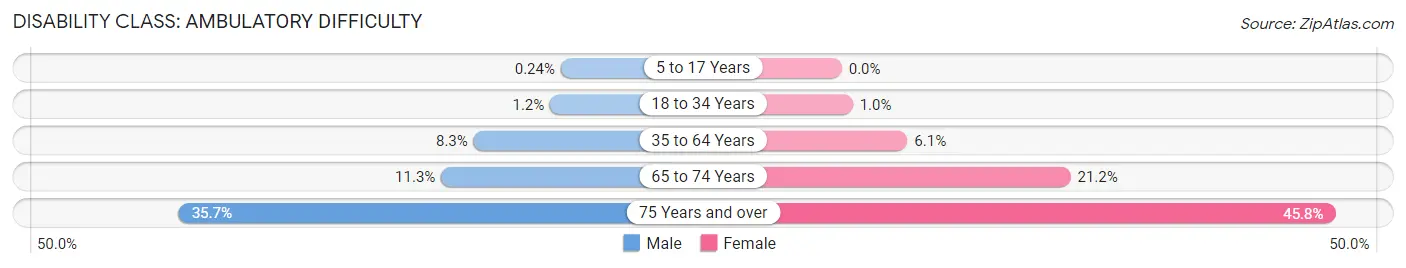
| Age Bracket | Male | Female |
| 5 to 17 Years | 18 (0.2%) | 0 (0.0%) |
| 18 to 34 Years | 90 (1.2%) | 75 (1.0%) |
| 35 to 64 Years | 859 (8.3%) | 641 (6.1%) |
| 65 to 74 Years | 251 (11.3%) | 450 (21.2%) |
| 75 Years and over | 429 (35.7%) | 599 (45.8%) |
Disability Class: Self-Care Difficulty
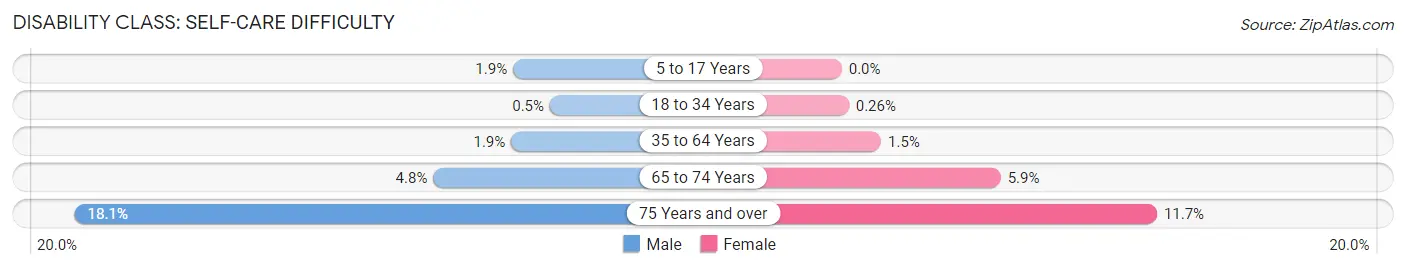
| Age Bracket | Male | Female |
| 5 to 17 Years | 143 (1.9%) | 0 (0.0%) |
| 18 to 34 Years | 37 (0.5%) | 19 (0.3%) |
| 35 to 64 Years | 200 (1.9%) | 154 (1.5%) |
| 65 to 74 Years | 107 (4.8%) | 125 (5.9%) |
| 75 Years and over | 218 (18.1%) | 153 (11.7%) |
Technology Access in Porterville
Computing Device Access in Porterville
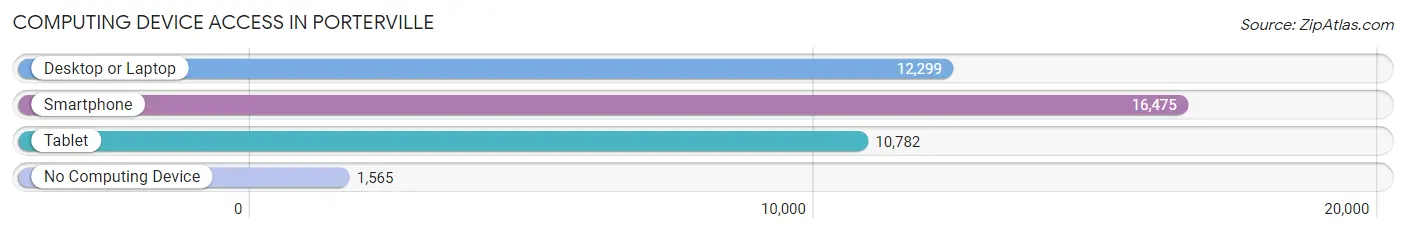
| Device Type | # Households | % Households |
| Desktop or Laptop | 12,299 | 65.0% |
| Smartphone | 16,475 | 87.1% |
| Tablet | 10,782 | 57.0% |
| No Computing Device | 1,565 | 8.3% |
| Total | 18,925 | 100.0% |
Internet Access in Porterville
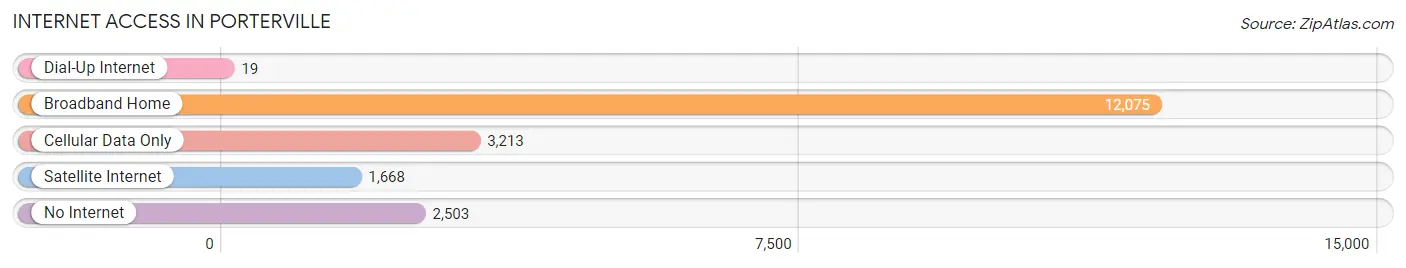
| Internet Type | # Households | % Households |
| Dial-Up Internet | 19 | 0.1% |
| Broadband Home | 12,075 | 63.8% |
| Cellular Data Only | 3,213 | 17.0% |
| Satellite Internet | 1,668 | 8.8% |
| No Internet | 2,503 | 13.2% |
| Total | 18,925 | 100.0% |
Porterville Summary
Porterville is a city located in the San Joaquin Valley of California, in Tulare County. It is situated in the foothills of the Sierra Nevada mountain range, and is approximately 60 miles south of Fresno. The city has a population of approximately 55,000 people, and is the largest city in Tulare County.
History
Porterville was founded in 1864 by Benjamin F. Porter, a settler from Illinois. Porter had been a gold miner in the Sierra Nevada foothills, and he decided to settle in the area after finding gold in the nearby hills. He named the town after himself, and it quickly grew into a small farming community.
In the late 19th century, Porterville became a major center for the production of citrus fruits, and the city was known as the “Citrus Capital of the World”. The citrus industry was a major source of income for the city, and it helped to fuel the city’s growth.
In the early 20th century, Porterville began to experience a period of rapid growth. The city was incorporated in 1902, and the population grew from 1,000 to over 10,000 by the 1920s. The city continued to grow throughout the 20th century, and by the 2000s, the population had reached over 55,000.
Geography
Porterville is located in the San Joaquin Valley of California, in Tulare County. It is situated in the foothills of the Sierra Nevada mountain range, and is approximately 60 miles south of Fresno. The city has a total area of 11.2 square miles, and is located at an elevation of approximately 1,000 feet.
The climate in Porterville is generally warm and dry, with hot summers and mild winters. The average annual temperature is around 65 degrees Fahrenheit, and the average annual precipitation is around 8 inches.
Economy
Porterville’s economy is largely based on agriculture, and the city is known as the “Citrus Capital of the World”. The city is home to a number of citrus processing plants, and the citrus industry is a major source of income for the city.
In addition to the citrus industry, Porterville is also home to a number of other industries, including manufacturing, retail, and healthcare. The city is also home to a number of government agencies, including the Tulare County Sheriff’s Office and the Porterville Unified School District.
Demographics
As of the 2010 census, Porterville had a population of 55,466 people. The racial makeup of the city was 57.2% White, 2.3% African American, 1.2% Native American, 1.3% Asian, 0.2% Pacific Islander, and 37.0% from other races. Hispanic or Latino of any race were 58.2% of the population.
The median household income in Porterville was $37,845, and the median family income was $45,837. The per capita income for the city was $17,845. About 19.2% of the population was below the poverty line.
Common Questions
What is Per Capita Income in Porterville?
Per Capita income in Porterville is $22,910.
What is the Median Family Income in Porterville?
Median Family Income in Porterville is $57,258.
What is the Median Household income in Porterville?
Median Household Income in Porterville is $55,785.
What is Income or Wage Gap in Porterville?
Income or Wage Gap in Porterville is 22.7%.
Women in Porterville earn 77.3 cents for every dollar earned by a man.
What is Family Income Deficit in Porterville?
Family Income Deficit in Porterville is $11,111.
Families that are below poverty line in Porterville earn $11,111 less on average than the poverty threshold level.
What is Inequality or Gini Index in Porterville?
Inequality or Gini Index in Porterville is 0.43.
What is the Total Population of Porterville?
Total Population of Porterville is 62,491.
What is the Total Male Population of Porterville?
Total Male Population of Porterville is 31,694.
What is the Total Female Population of Porterville?
Total Female Population of Porterville is 30,797.
What is the Ratio of Males per 100 Females in Porterville?
There are 102.91 Males per 100 Females in Porterville.
What is the Ratio of Females per 100 Males in Porterville?
There are 97.17 Females per 100 Males in Porterville.
What is the Median Population Age in Porterville?
Median Population Age in Porterville is 31.3 Years.
What is the Average Family Size in Porterville
Average Family Size in Porterville is 3.7 People.
What is the Average Household Size in Porterville
Average Household Size in Porterville is 3.2 People.
How Large is the Labor Force in Porterville?
There are 28,583 People in the Labor Forcein in Porterville.
What is the Percentage of People in the Labor Force in Porterville?
62.1% of People are in the Labor Force in Porterville.
What is the Unemployment Rate in Porterville?
Unemployment Rate in Porterville is 10.1%.