Cities with the Highest Percentage of Immigrants from Caribbean in Maryland
RELATED REPORTS & OPTIONS
Caribbean
Maryland
Compare Cities
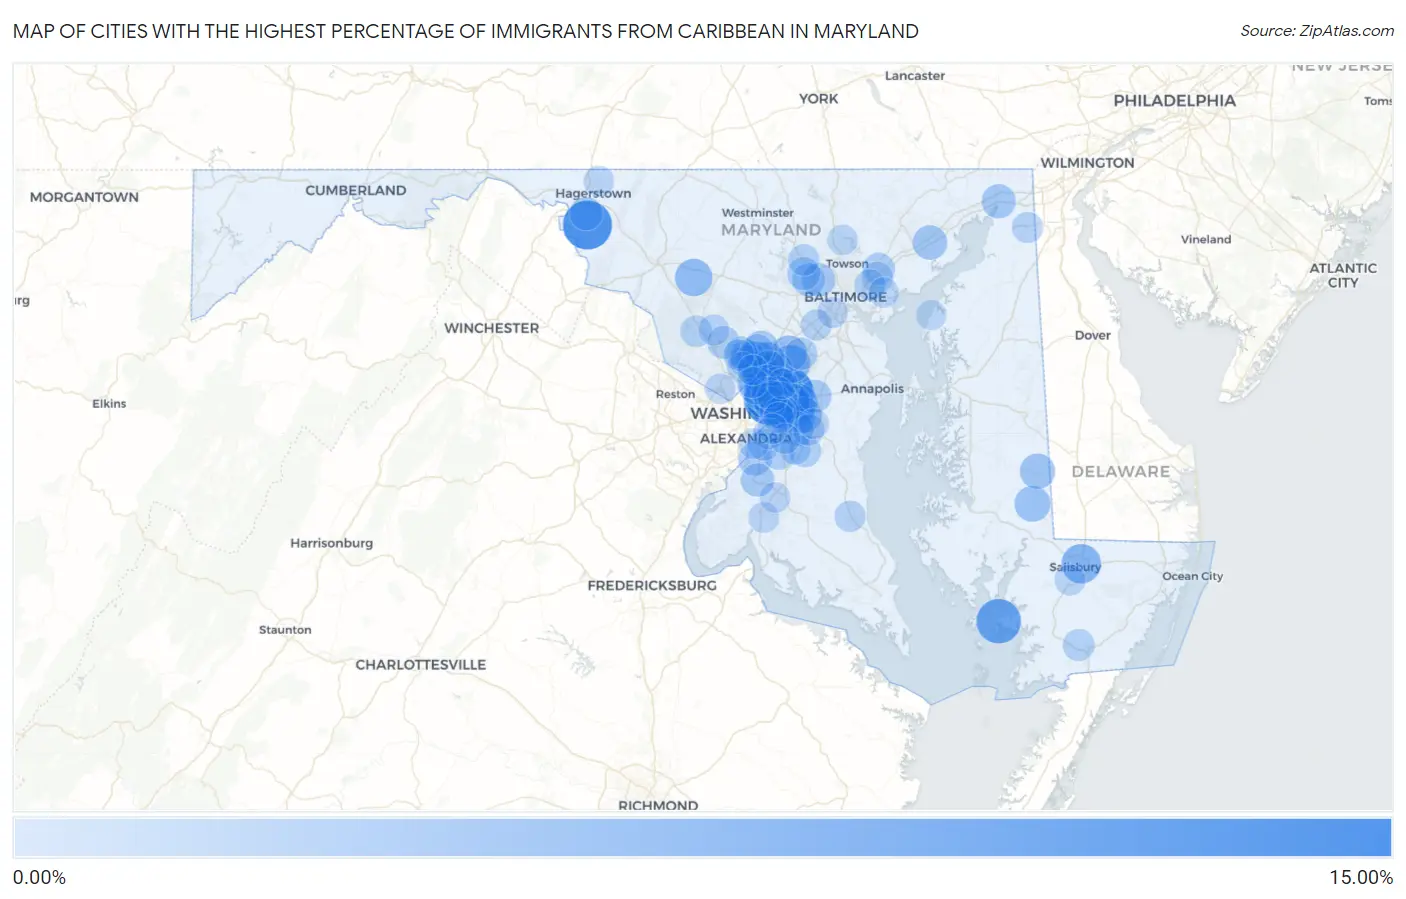
Map of Cities with the Highest Percentage of Immigrants from Caribbean in Maryland
0.00%
15.00%
Cities with the Highest Percentage of Immigrants from Caribbean in Maryland
| City | Caribbean | vs State | vs National | |
| 1. | Cottage City | 10.76% | 1.18%(+9.59)#-1 | 1.37%(+9.39)#0 |
| 2. | Fairplay | 10.50% | 1.18%(+9.32)#0 | 1.37%(+9.12)#1 |
| 3. | Chance | 8.24% | 1.18%(+7.06)#1 | 1.37%(+6.87)#2 |
| 4. | Lanham | 7.45% | 1.18%(+6.27)#2 | 1.37%(+6.08)#3 |
| 5. | Seabrook | 5.96% | 1.18%(+4.79)#3 | 1.37%(+4.59)#4 |
| 6. | Colesville | 5.93% | 1.18%(+4.75)#4 | 1.37%(+4.55)#5 |
| 7. | Salisbury | 5.69% | 1.18%(+4.51)#5 | 1.37%(+4.32)#6 |
| 8. | Glenarden | 5.68% | 1.18%(+4.51)#6 | 1.37%(+4.31)#7 |
| 9. | Mount Rainier | 5.60% | 1.18%(+4.43)#7 | 1.37%(+4.23)#8 |
| 10. | New Carrollton | 5.43% | 1.18%(+4.26)#8 | 1.37%(+4.06)#9 |
| 11. | Hillandale | 5.40% | 1.18%(+4.22)#9 | 1.37%(+4.03)#10 |
| 12. | South Laurel | 5.06% | 1.18%(+3.88)#10 | 1.37%(+3.68)#11 |
| 13. | Mitchellville | 4.82% | 1.18%(+3.64)#11 | 1.37%(+3.44)#12 |
| 14. | Monrovia | 4.77% | 1.18%(+3.59)#12 | 1.37%(+3.39)#13 |
| 15. | Chillum | 4.70% | 1.18%(+3.53)#13 | 1.37%(+3.33)#14 |
| 16. | Lake Arbor | 4.66% | 1.18%(+3.49)#14 | 1.37%(+3.29)#15 |
| 17. | Largo | 4.64% | 1.18%(+3.46)#15 | 1.37%(+3.26)#16 |
| 18. | Landover | 4.38% | 1.18%(+3.21)#16 | 1.37%(+3.01)#17 |
| 19. | Laurel | 4.33% | 1.18%(+3.15)#46 | 1.37%(+2.96)#1,909 |
| 20. | Woodlawn Cdp Prince George S County | 4.30% | 1.18%(+3.12)#47 | 1.37%(+2.93)#1,910 |
| 21. | Beltsville | 4.17% | 1.18%(+2.99)#48 | 1.37%(+2.80)#1,911 |
| 22. | Summerfield | 4.06% | 1.18%(+2.88)#49 | 1.37%(+2.69)#1,912 |
| 23. | Eldorado | 4.00% | 1.18%(+2.82)#50 | 1.37%(+2.63)#1,913 |
| 24. | White Oak | 4.00% | 1.18%(+2.82)#51 | 1.37%(+2.62)#1,914 |
| 25. | Fairland | 3.97% | 1.18%(+2.79)#52 | 1.37%(+2.59)#1,915 |
| 26. | Kettering | 3.96% | 1.18%(+2.79)#53 | 1.37%(+2.59)#1,916 |
| 27. | Brentwood | 3.89% | 1.18%(+2.71)#54 | 1.37%(+2.51)#1,917 |
| 28. | Adelphi | 3.77% | 1.18%(+2.59)#55 | 1.37%(+2.40)#1,918 |
| 29. | Federalsburg | 3.69% | 1.18%(+2.51)#56 | 1.37%(+2.32)#1,919 |
| 30. | Springdale | 3.62% | 1.18%(+2.44)#57 | 1.37%(+2.24)#1,920 |
| 31. | Westphalia | 3.61% | 1.18%(+2.43)#58 | 1.37%(+2.23)#1,921 |
| 32. | Riverdale Park | 3.50% | 1.18%(+2.32)#59 | 1.37%(+2.13)#1,922 |
| 33. | Berwyn Heights | 3.47% | 1.18%(+2.30)#60 | 1.37%(+2.10)#1,923 |
| 34. | North Brentwood | 3.39% | 1.18%(+2.22)#61 | 1.37%(+2.02)#1,924 |
| 35. | Riverside | 3.33% | 1.18%(+2.15)#62 | 1.37%(+1.95)#1,925 |
| 36. | East Riverdale | 3.31% | 1.18%(+2.13)#63 | 1.37%(+1.94)#1,926 |
| 37. | Cheverly | 3.26% | 1.18%(+2.08)#64 | 1.37%(+1.89)#1,927 |
| 38. | North East | 3.15% | 1.18%(+1.97)#65 | 1.37%(+1.78)#1,928 |
| 39. | Landover Hills | 3.12% | 1.18%(+1.94)#66 | 1.37%(+1.74)#1,929 |
| 40. | Peppermill Village | 3.11% | 1.18%(+1.93)#67 | 1.37%(+1.73)#1,930 |
| 41. | Takoma Park | 3.07% | 1.18%(+1.90)#68 | 1.37%(+1.70)#1,931 |
| 42. | Langley Park | 3.04% | 1.18%(+1.86)#69 | 1.37%(+1.66)#1,932 |
| 43. | Fairmount Heights | 2.95% | 1.18%(+1.78)#70 | 1.37%(+1.58)#1,933 |
| 44. | Fort Washington | 2.94% | 1.18%(+1.77)#71 | 1.37%(+1.57)#1,934 |
| 45. | Spencerville | 2.90% | 1.18%(+1.72)#72 | 1.37%(+1.52)#1,935 |
| 46. | Lochearn | 2.88% | 1.18%(+1.71)#73 | 1.37%(+1.51)#1,936 |
| 47. | Layhill | 2.81% | 1.18%(+1.63)#74 | 1.37%(+1.44)#1,937 |
| 48. | Accokeek | 2.79% | 1.18%(+1.61)#75 | 1.37%(+1.41)#1,938 |
| 49. | St James | 2.73% | 1.18%(+1.55)#76 | 1.37%(+1.36)#1,939 |
| 50. | Milford Mill | 2.65% | 1.18%(+1.48)#77 | 1.37%(+1.28)#1,940 |
| 51. | Bowie | 2.64% | 1.18%(+1.46)#78 | 1.37%(+1.27)#1,941 |
| 52. | Randallstown | 2.62% | 1.18%(+1.44)#79 | 1.37%(+1.24)#1,942 |
| 53. | Glenmont | 2.56% | 1.18%(+1.38)#80 | 1.37%(+1.19)#1,943 |
| 54. | Redland | 2.43% | 1.18%(+1.25)#81 | 1.37%(+1.06)#1,944 |
| 55. | Flower Hill | 2.34% | 1.18%(+1.17)#82 | 1.37%(+0.972)#2,045 |
| 56. | Maryland City | 2.28% | 1.18%(+1.10)#83 | 1.37%(+0.906)#2,046 |
| 57. | Leisure World | 2.21% | 1.18%(+1.03)#84 | 1.37%(+0.834)#2,047 |
| 58. | Clinton | 2.17% | 1.18%(+0.988)#85 | 1.37%(+0.793)#2,048 |
| 59. | Marlton | 2.16% | 1.18%(+0.987)#86 | 1.37%(+0.791)#2,049 |
| 60. | White Marsh | 2.16% | 1.18%(+0.980)#87 | 1.37%(+0.785)#2,050 |
| 61. | Colmar Manor | 2.11% | 1.18%(+0.934)#88 | 1.37%(+0.738)#2,051 |
| 62. | West Pocomoke | 2.06% | 1.18%(+0.883)#89 | 1.37%(+0.687)#2,052 |
| 63. | Calverton | 2.05% | 1.18%(+0.870)#90 | 1.37%(+0.674)#2,053 |
| 64. | Seat Pleasant | 1.98% | 1.18%(+0.804)#91 | 1.37%(+0.608)#2,054 |
| 65. | Owings Mills | 1.97% | 1.18%(+0.792)#92 | 1.37%(+0.596)#2,055 |
| 66. | Rossville | 1.95% | 1.18%(+0.777)#93 | 1.37%(+0.582)#2,056 |
| 67. | Germantown | 1.95% | 1.18%(+0.772)#94 | 1.37%(+0.576)#2,057 |
| 68. | Cloverly | 1.93% | 1.18%(+0.758)#95 | 1.37%(+0.562)#2,058 |
| 69. | Rosaryville | 1.90% | 1.18%(+0.719)#96 | 1.37%(+0.523)#2,059 |
| 70. | Hyattsville | 1.89% | 1.18%(+0.717)#97 | 1.37%(+0.522)#2,060 |
| 71. | Oxon Hill | 1.86% | 1.18%(+0.680)#98 | 1.37%(+0.484)#2,061 |
| 72. | Wheaton | 1.84% | 1.18%(+0.659)#99 | 1.37%(+0.464)#2,062 |
| 73. | Marlboro Village | 1.81% | 1.18%(+0.631)#100 | 1.37%(+0.436)#2,063 |
| 74. | Aspen Hill | 1.77% | 1.18%(+0.598)#101 | 1.37%(+0.402)#2,281 |
| 75. | Edmonston | 1.77% | 1.18%(+0.593)#102 | 1.37%(+0.398)#2,282 |
| 76. | Chesapeake City | 1.75% | 1.18%(+0.571)#103 | 1.37%(+0.375)#2,283 |
| 77. | Rosedale | 1.73% | 1.18%(+0.553)#104 | 1.37%(+0.358)#2,284 |
| 78. | Prince Frederick | 1.73% | 1.18%(+0.549)#105 | 1.37%(+0.354)#2,285 |
| 79. | Elkridge | 1.71% | 1.18%(+0.534)#106 | 1.37%(+0.338)#2,286 |
| 80. | Marlow Heights | 1.69% | 1.18%(+0.518)#107 | 1.37%(+0.322)#2,287 |
| 81. | Silver Spring | 1.65% | 1.18%(+0.476)#108 | 1.37%(+0.280)#2,288 |
| 82. | Fruitland | 1.62% | 1.18%(+0.447)#109 | 1.37%(+0.252)#2,289 |
| 83. | Lansdowne | 1.59% | 1.18%(+0.412)#110 | 1.37%(+0.216)#2,290 |
| 84. | Montgomery Village | 1.58% | 1.18%(+0.400)#111 | 1.37%(+0.205)#2,291 |
| 85. | Abingdon | 1.57% | 1.18%(+0.388)#112 | 1.37%(+0.193)#2,292 |
| 86. | Capitol Heights | 1.54% | 1.18%(+0.360)#113 | 1.37%(+0.165)#2,293 |
| 87. | Kemp Mill | 1.53% | 1.18%(+0.348)#114 | 1.37%(+0.153)#2,294 |
| 88. | National Harbor | 1.52% | 1.18%(+0.346)#115 | 1.37%(+0.151)#2,295 |
| 89. | La Plata | 1.52% | 1.18%(+0.340)#116 | 1.37%(+0.145)#2,296 |
| 90. | Paramount Long Meadow | 1.50% | 1.18%(+0.326)#117 | 1.37%(+0.130)#2,297 |
| 91. | Greenbelt | 1.50% | 1.18%(+0.324)#118 | 1.37%(+0.129)#2,298 |
| 92. | Brock Hall | 1.50% | 1.18%(+0.324)#119 | 1.37%(+0.128)#2,299 |
| 93. | Woodlawn Cdp Baltimore County | 1.50% | 1.18%(+0.322)#120 | 1.37%(+0.126)#2,300 |
| 94. | Andrews Afb | 1.45% | 1.18%(+0.275)#121 | 1.37%(+0.080)#2,301 |
| 95. | Cockeysville | 1.45% | 1.18%(+0.268)#122 | 1.37%(+0.073)#2,302 |
| 96. | Waldorf | 1.41% | 1.18%(+0.236)#123 | 1.37%(+0.041)#2,303 |
| 97. | Cabin John | 1.41% | 1.18%(+0.235)#124 | 1.37%(+0.039)#2,304 |
| 98. | Silver Hill | 1.36% | 1.18%(+0.180)#125 | 1.37%(-0.016)#2,305 |
| 99. | Essex | 1.34% | 1.18%(+0.167)#126 | 1.37%(-0.028)#2,306 |
| 100. | Tolchester | 1.32% | 1.18%(+0.139)#127 | 1.37%(-0.057)#2,307 |
Common Questions
What are the Top 10 Cities with the Highest Percentage of Immigrants from Caribbean in Maryland?
Top 10 Cities with the Highest Percentage of Immigrants from Caribbean in Maryland are:
#1
10.76%
#2
10.50%
#3
8.24%
#4
7.45%
#5
5.96%
#6
5.93%
#7
5.69%
#8
5.68%
#9
5.60%
#10
5.43%
What city has the Highest Percentage of Immigrants from Caribbean in Maryland?
Cottage City has the Highest Percentage of Immigrants from Caribbean in Maryland with 10.76%.
What is the Percentage of Immigrants from Caribbean in the State of Maryland?
Percentage of Immigrants from Caribbean in Maryland is 1.18%.
What is the Percentage of Immigrants from Caribbean in the United States?
Percentage of Immigrants from Caribbean in the United States is 1.37%.