Joshua Tree, CA Map & Demographics
Joshua Tree Map
Joshua Tree Overview
$31,173
PER CAPITA INCOME
$72,321
AVG FAMILY INCOME
$54,678
AVG HOUSEHOLD INCOME
39.8%
WAGE / INCOME GAP [ % ]
60.2¢/ $1
WAGE / INCOME GAP [ $ ]
$12,312
FAMILY INCOME DEFICIT
0.45
INEQUALITY / GINI INDEX
6,751
TOTAL POPULATION
3,042
MALE POPULATION
3,709
FEMALE POPULATION
82.02
MALES / 100 FEMALES
121.93
FEMALES / 100 MALES
39.9
MEDIAN AGE
3.2
AVG FAMILY SIZE
2.5
AVG HOUSEHOLD SIZE
2,929
LABOR FORCE [ PEOPLE ]
53.3%
PERCENT IN LABOR FORCE
10.9%
UNEMPLOYMENT RATE
Joshua Tree Zip Codes
Joshua Tree Area Codes
Income in Joshua Tree
Income Overview in Joshua Tree
Per Capita Income in Joshua Tree is $31,173, while median incomes of families and households are $72,321 and $54,678 respectively.
| Characteristic | Number | Measure |
| Per Capita Income | 6,751 | $31,173 |
| Median Family Income | 1,437 | $72,321 |
| Mean Family Income | 1,437 | $84,533 |
| Median Household Income | 2,671 | $54,678 |
| Mean Household Income | 2,671 | $73,928 |
| Income Deficit | 1,437 | $12,312 |
| Wage / Income Gap (%) | 6,751 | 39.80% |
| Wage / Income Gap ($) | 6,751 | 60.20¢ per $1 |
| Gini / Inequality Index | 6,751 | 0.45 |
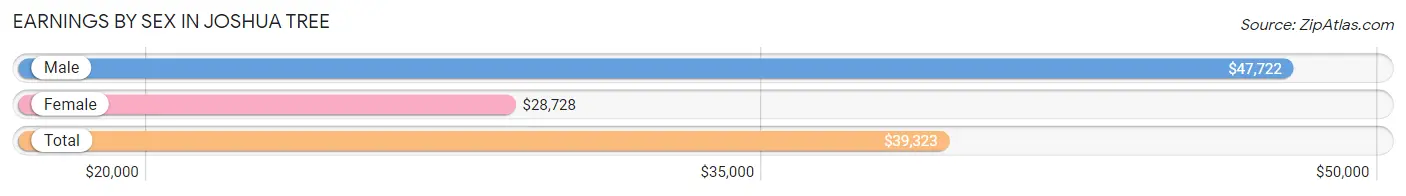
Earnings by Sex in Joshua Tree
Average Earnings in Joshua Tree are $39,323, $47,722 for men and $28,728 for women, a difference of 39.8%.
| Sex | Number | Average Earnings |
| Male | 1,610 (54.9%) | $47,722 |
| Female | 1,320 (45.1%) | $28,728 |
| Total | 2,930 (100.0%) | $39,323 |
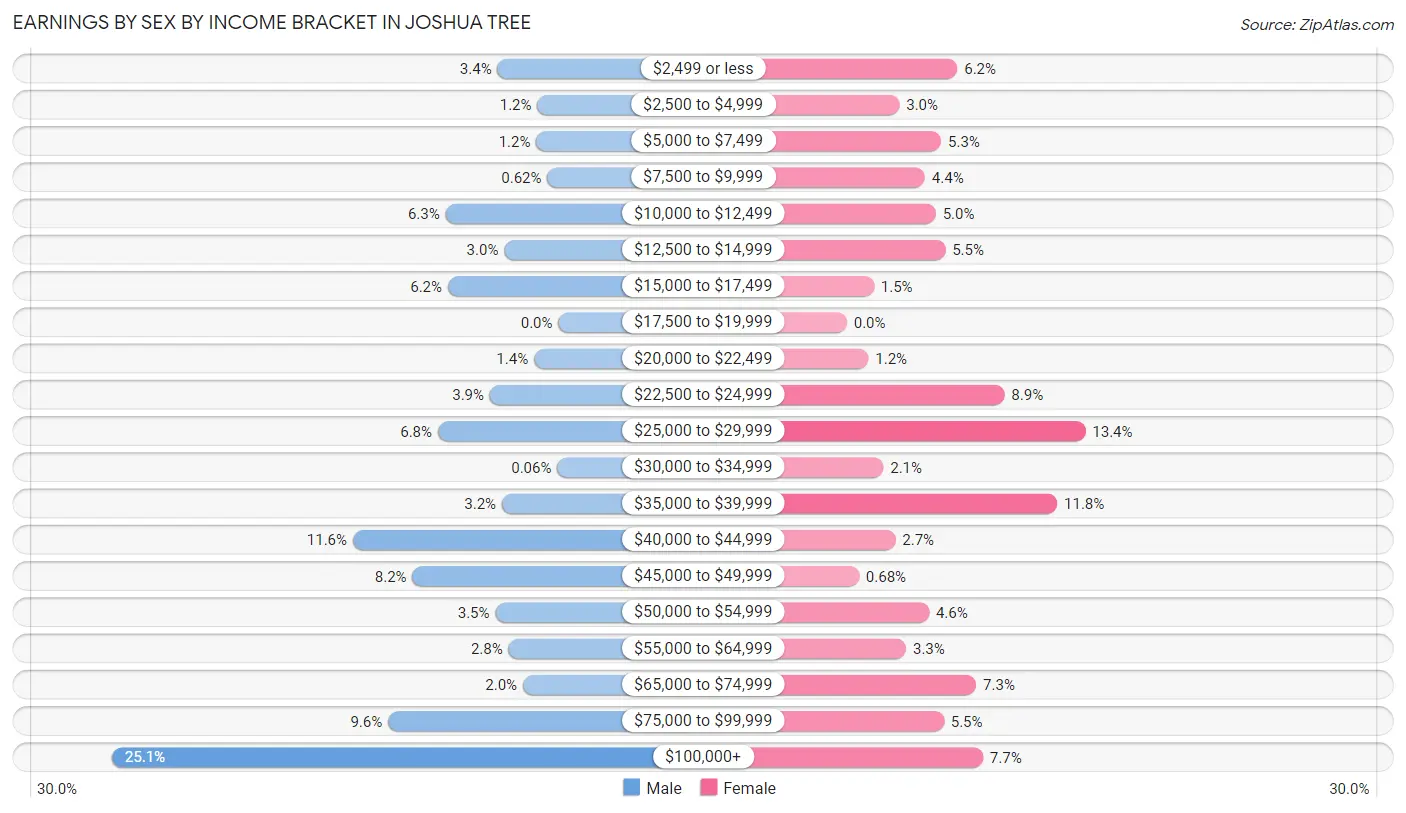
Earnings by Sex by Income Bracket in Joshua Tree
The most common earnings brackets in Joshua Tree are $100,000+ for men (404 | 25.1%) and $25,000 to $29,999 for women (177 | 13.4%).
| Income | Male | Female |
| $2,499 or less | 55 (3.4%) | 82 (6.2%) |
| $2,500 to $4,999 | 19 (1.2%) | 39 (2.9%) |
| $5,000 to $7,499 | 20 (1.2%) | 70 (5.3%) |
| $7,500 to $9,999 | 10 (0.6%) | 58 (4.4%) |
| $10,000 to $12,499 | 102 (6.3%) | 66 (5.0%) |
| $12,500 to $14,999 | 49 (3.0%) | 73 (5.5%) |
| $15,000 to $17,499 | 100 (6.2%) | 20 (1.5%) |
| $17,500 to $19,999 | 0 (0.0%) | 0 (0.0%) |
| $20,000 to $22,499 | 22 (1.4%) | 16 (1.2%) |
| $22,500 to $24,999 | 62 (3.8%) | 117 (8.9%) |
| $25,000 to $29,999 | 109 (6.8%) | 177 (13.4%) |
| $30,000 to $34,999 | 1 (0.1%) | 27 (2.1%) |
| $35,000 to $39,999 | 51 (3.2%) | 156 (11.8%) |
| $40,000 to $44,999 | 186 (11.6%) | 36 (2.7%) |
| $45,000 to $49,999 | 132 (8.2%) | 9 (0.7%) |
| $50,000 to $54,999 | 57 (3.5%) | 61 (4.6%) |
| $55,000 to $64,999 | 45 (2.8%) | 44 (3.3%) |
| $65,000 to $74,999 | 32 (2.0%) | 96 (7.3%) |
| $75,000 to $99,999 | 154 (9.6%) | 72 (5.4%) |
| $100,000+ | 404 (25.1%) | 101 (7.6%) |
| Total | 1,610 (100.0%) | 1,320 (100.0%) |
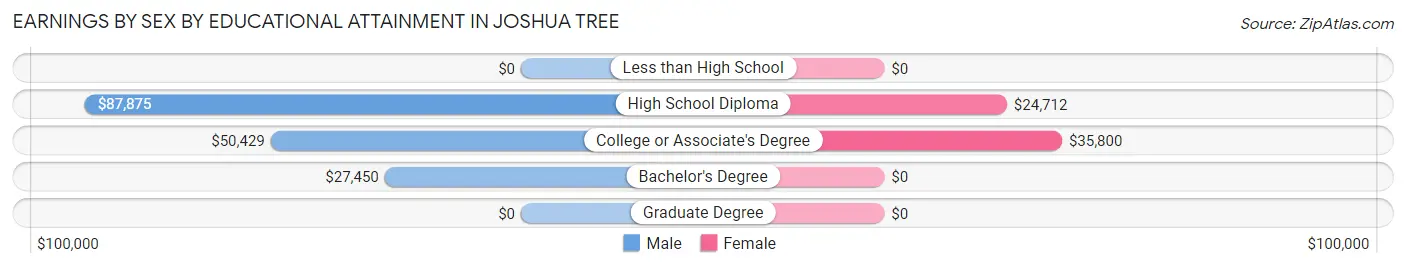
Earnings by Sex by Educational Attainment in Joshua Tree
Average earnings in Joshua Tree are $48,848 for men and $28,208 for women, a difference of 42.2%. Men with an educational attainment of high school diploma enjoy the highest average annual earnings of $87,875, while those with bachelor's degree education earn the least with $27,450. Women with an educational attainment of college or associate's degree earn the most with the average annual earnings of $35,800, while those with high school diploma education have the smallest earnings of $24,712.
| Educational Attainment | Male Income | Female Income |
| Less than High School | - | - |
| High School Diploma | $87,875 | $24,712 |
| College or Associate's Degree | $50,429 | $35,800 |
| Bachelor's Degree | $27,450 | $0 |
| Graduate Degree | - | - |
| Total | $48,848 | $28,208 |
Family Income in Joshua Tree
Family Income Brackets in Joshua Tree
According to the Joshua Tree family income data, there are 309 families falling into the $75,000 to $99,999 income range, which is the most common income bracket and makes up 21.5% of all families.
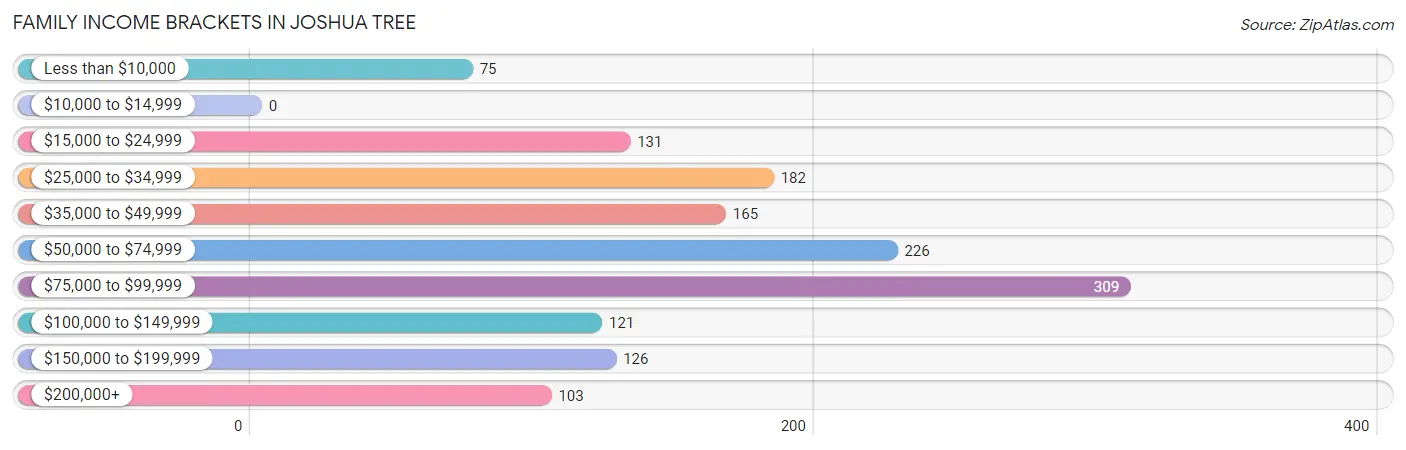
| Income Bracket | # Families | % Families |
| Less than $10,000 | 75 | 5.2% |
| $10,000 to $14,999 | 0 | 0.0% |
| $15,000 to $24,999 | 131 | 9.1% |
| $25,000 to $34,999 | 182 | 12.7% |
| $35,000 to $49,999 | 165 | 11.5% |
| $50,000 to $74,999 | 226 | 15.7% |
| $75,000 to $99,999 | 309 | 21.5% |
| $100,000 to $149,999 | 121 | 8.4% |
| $150,000 to $199,999 | 126 | 8.8% |
| $200,000+ | 103 | 7.2% |
Family Income by Famaliy Size in Joshua Tree
4-person families (129 | 9.0%) account for the highest median family income in Joshua Tree with $83,185 per family, while 2-person families (788 | 54.8%) have the highest median income of $34,573 per family member.
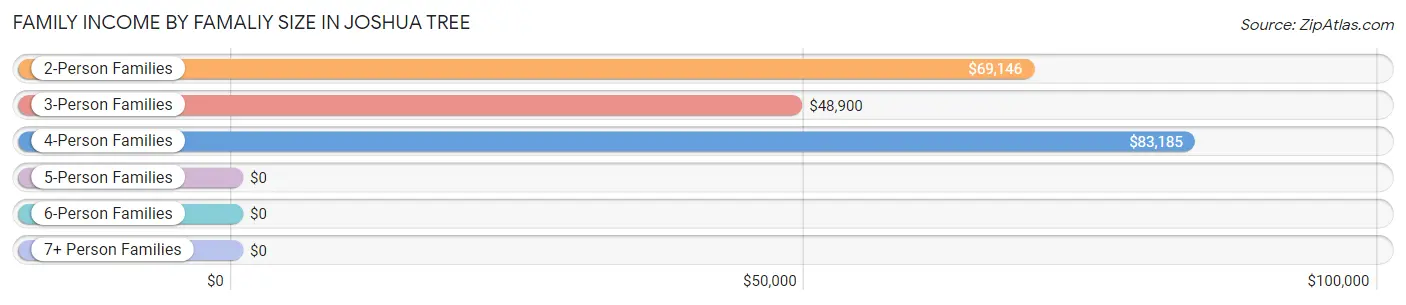
| Income Bracket | # Families | Median Income |
| 2-Person Families | 788 (54.8%) | $69,146 |
| 3-Person Families | 346 (24.1%) | $48,900 |
| 4-Person Families | 129 (9.0%) | $83,185 |
| 5-Person Families | 71 (4.9%) | $0 |
| 6-Person Families | 87 (6.0%) | $0 |
| 7+ Person Families | 16 (1.1%) | $0 |
| Total | 1,437 (100.0%) | $72,321 |
Family Income by Number of Earners in Joshua Tree
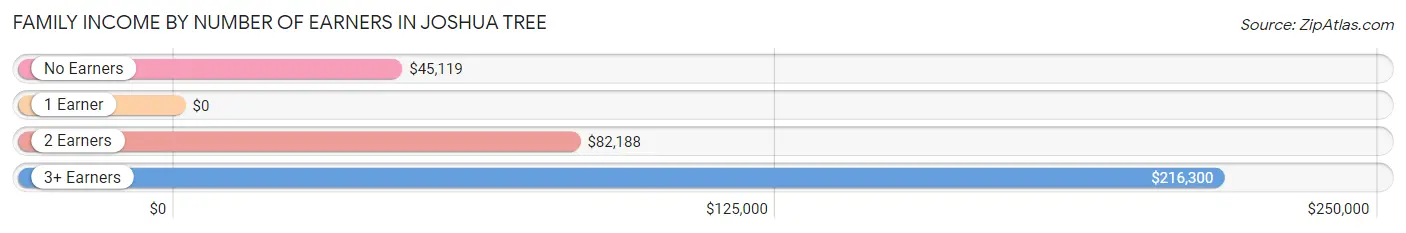
| Number of Earners | # Families | Median Income |
| No Earners | 392 (27.3%) | $45,119 |
| 1 Earner | 557 (38.8%) | $0 |
| 2 Earners | 392 (27.3%) | $82,188 |
| 3+ Earners | 96 (6.7%) | $216,300 |
| Total | 1,437 (100.0%) | $72,321 |
Household Income in Joshua Tree
Household Income Brackets in Joshua Tree
With 433 households falling in the category, the $75,000 to $99,999 income range is the most frequent in Joshua Tree, accounting for 16.2% of all households. In contrast, only 118 households (4.4%) fall into the $200,000+ income bracket, making it the least populous group.
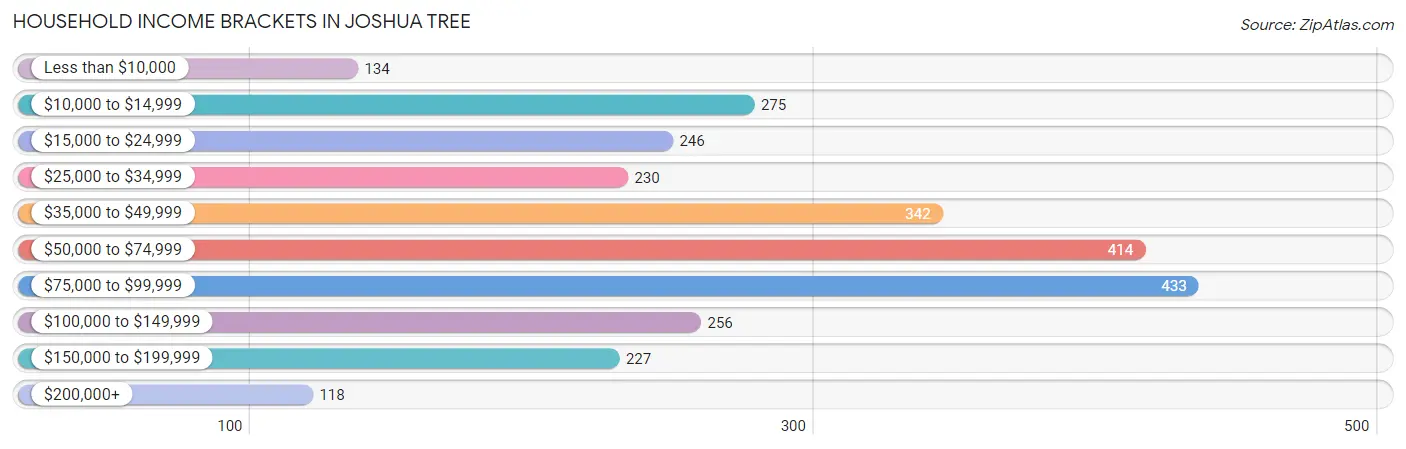
| Income Bracket | # Households | % Households |
| Less than $10,000 | 134 | 5.0% |
| $10,000 to $14,999 | 275 | 10.3% |
| $15,000 to $24,999 | 246 | 9.2% |
| $25,000 to $34,999 | 230 | 8.6% |
| $35,000 to $49,999 | 342 | 12.8% |
| $50,000 to $74,999 | 414 | 15.5% |
| $75,000 to $99,999 | 433 | 16.2% |
| $100,000 to $149,999 | 256 | 9.6% |
| $150,000 to $199,999 | 227 | 8.5% |
| $200,000+ | 118 | 4.4% |
Household Income by Householder Age in Joshua Tree
The median household income in Joshua Tree is $54,678, with the highest median household income of $74,179 found in the 25 to 44 years age bracket for the primary householder. A total of 857 households (32.1%) fall into this category. Meanwhile, the 15 to 24 years age bracket for the primary householder has the lowest median household income of $0, with 101 households (3.8%) in this group.
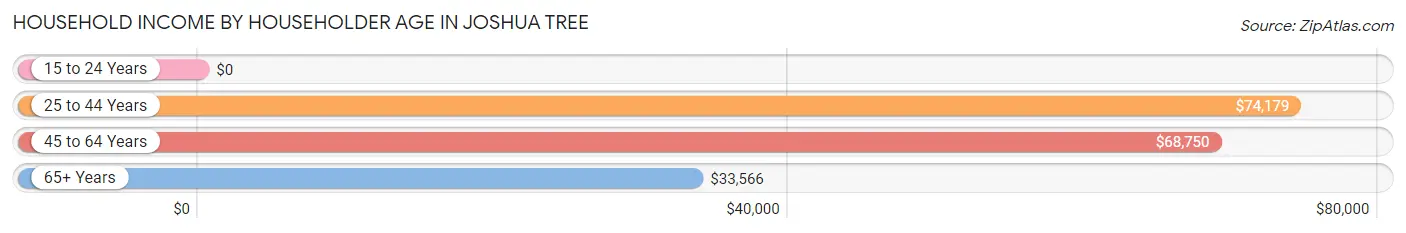
| Income Bracket | # Households | Median Income |
| 15 to 24 Years | 101 (3.8%) | $0 |
| 25 to 44 Years | 857 (32.1%) | $74,179 |
| 45 to 64 Years | 942 (35.3%) | $68,750 |
| 65+ Years | 771 (28.9%) | $33,566 |
| Total | 2,671 (100.0%) | $54,678 |
Poverty in Joshua Tree
Income Below Poverty by Sex and Age in Joshua Tree
With 22.1% poverty level for males and 22.4% for females among the residents of Joshua Tree, 12 to 14 year old males and 16 and 17 year old females are the most vulnerable to poverty, with 33 males (55.0%) and 23 females (100.0%) in their respective age groups living below the poverty level.
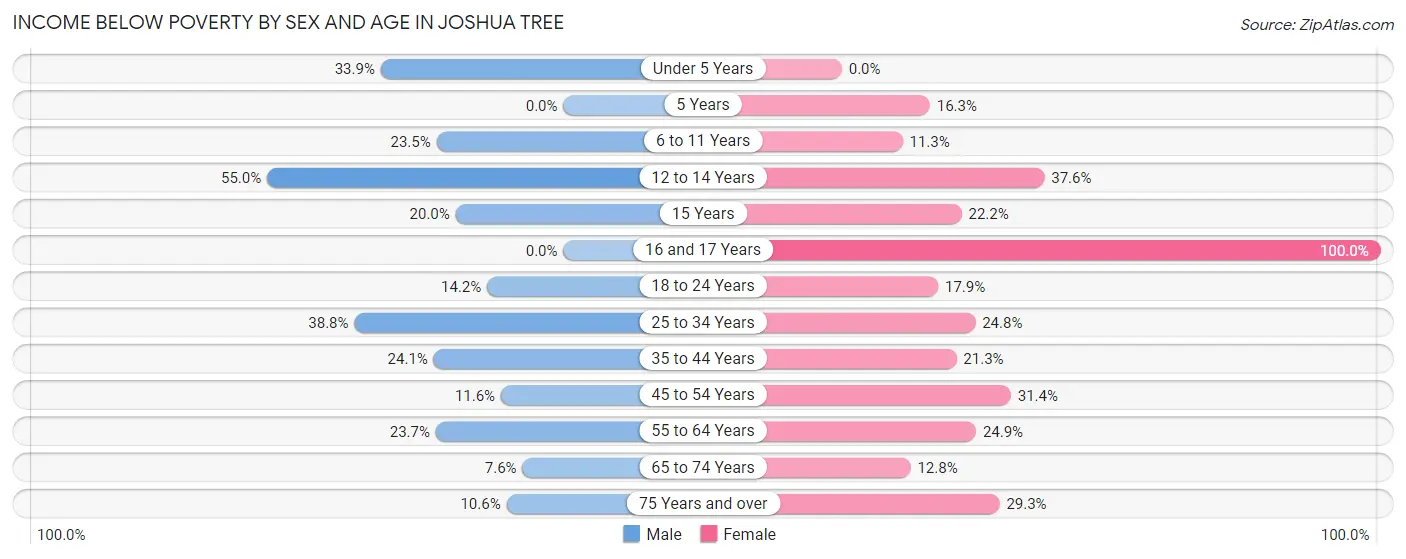
| Age Bracket | Male | Female |
| Under 5 Years | 40 (33.9%) | 0 (0.0%) |
| 5 Years | 0 (0.0%) | 8 (16.3%) |
| 6 to 11 Years | 24 (23.5%) | 24 (11.3%) |
| 12 to 14 Years | 33 (55.0%) | 53 (37.6%) |
| 15 Years | 9 (20.0%) | 40 (22.2%) |
| 16 and 17 Years | 0 (0.0%) | 23 (100.0%) |
| 18 to 24 Years | 44 (14.1%) | 40 (17.9%) |
| 25 to 34 Years | 230 (38.8%) | 135 (24.8%) |
| 35 to 44 Years | 97 (24.1%) | 67 (21.3%) |
| 45 to 54 Years | 36 (11.6%) | 117 (31.4%) |
| 55 to 64 Years | 94 (23.7%) | 128 (24.9%) |
| 65 to 74 Years | 31 (7.6%) | 57 (12.8%) |
| 75 Years and over | 15 (10.6%) | 91 (29.3%) |
| Total | 653 (22.1%) | 783 (22.4%) |
Income Above Poverty by Sex and Age in Joshua Tree
According to the poverty statistics in Joshua Tree, males aged 5 years and females aged under 5 years are the age groups that are most secure financially, with 100.0% of males and 100.0% of females in these age groups living above the poverty line.
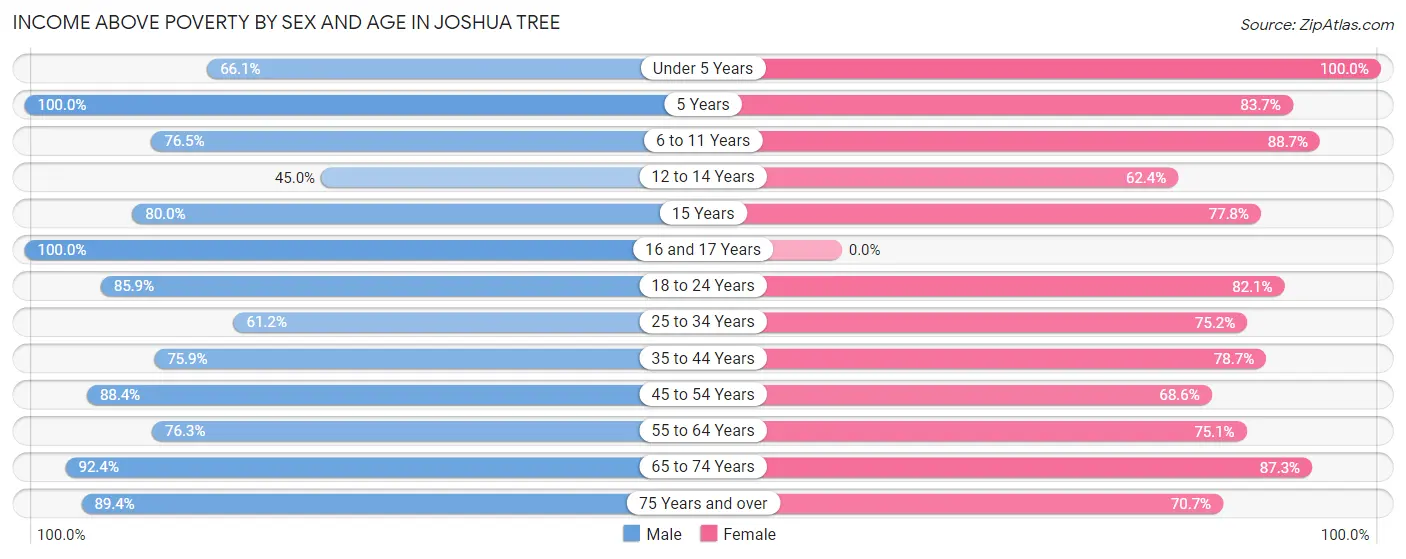
| Age Bracket | Male | Female |
| Under 5 Years | 78 (66.1%) | 161 (100.0%) |
| 5 Years | 19 (100.0%) | 41 (83.7%) |
| 6 to 11 Years | 78 (76.5%) | 189 (88.7%) |
| 12 to 14 Years | 27 (45.0%) | 88 (62.4%) |
| 15 Years | 36 (80.0%) | 140 (77.8%) |
| 16 and 17 Years | 48 (100.0%) | 0 (0.0%) |
| 18 to 24 Years | 267 (85.9%) | 184 (82.1%) |
| 25 to 34 Years | 363 (61.2%) | 410 (75.2%) |
| 35 to 44 Years | 306 (75.9%) | 248 (78.7%) |
| 45 to 54 Years | 275 (88.4%) | 256 (68.6%) |
| 55 to 64 Years | 303 (76.3%) | 386 (75.1%) |
| 65 to 74 Years | 377 (92.4%) | 390 (87.3%) |
| 75 Years and over | 127 (89.4%) | 220 (70.7%) |
| Total | 2,304 (77.9%) | 2,713 (77.6%) |
Income Below Poverty Among Married-Couple Families in Joshua Tree
The poverty statistics for married-couple families in Joshua Tree show that 5.5% or 55 of the total 1,008 families live below the poverty line. Families with 1 or 2 children have the highest poverty rate of 6.5%, comprising of 21 families. On the other hand, families with 3 or 4 children have the lowest poverty rate of 0.0%, which includes 0 families.
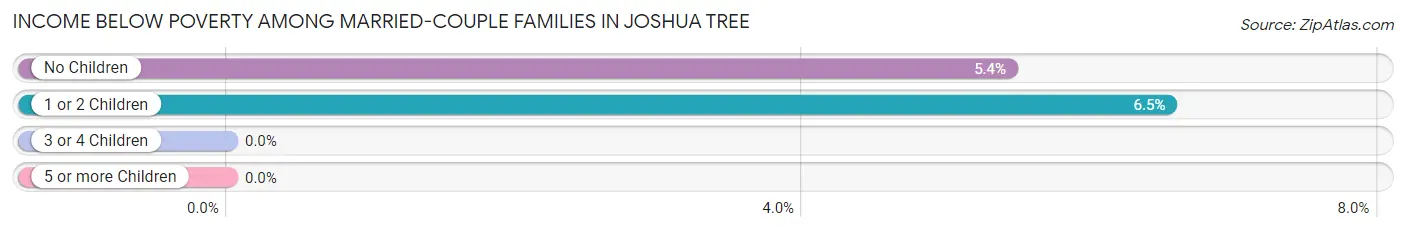
| Children | Above Poverty | Below Poverty |
| No Children | 592 (94.6%) | 34 (5.4%) |
| 1 or 2 Children | 300 (93.5%) | 21 (6.5%) |
| 3 or 4 Children | 61 (100.0%) | 0 (0.0%) |
| 5 or more Children | 0 (0.0%) | 0 (0.0%) |
| Total | 953 (94.5%) | 55 (5.5%) |
Income Below Poverty Among Single-Parent Households in Joshua Tree
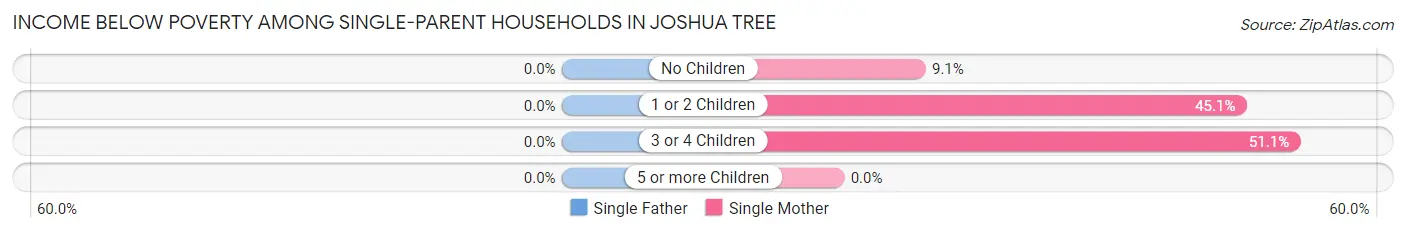
| Children | Single Father | Single Mother |
| No Children | 0 (0.0%) | 17 (9.1%) |
| 1 or 2 Children | 0 (0.0%) | 46 (45.1%) |
| 3 or 4 Children | 0 (0.0%) | 46 (51.1%) |
| 5 or more Children | 0 (0.0%) | 0 (0.0%) |
| Total | 0 (0.0%) | 109 (28.8%) |
Income Below Poverty Among Married-Couple vs Single-Parent Households in Joshua Tree
The poverty data for Joshua Tree shows that 55 of the married-couple family households (5.5%) and 109 of the single-parent households (25.4%) are living below the poverty level. Within the married-couple family households, those with 1 or 2 children have the highest poverty rate, with 21 households (6.5%) falling below the poverty line. Among the single-parent households, those with 3 or 4 children have the highest poverty rate, with 46 household (51.1%) living below poverty.
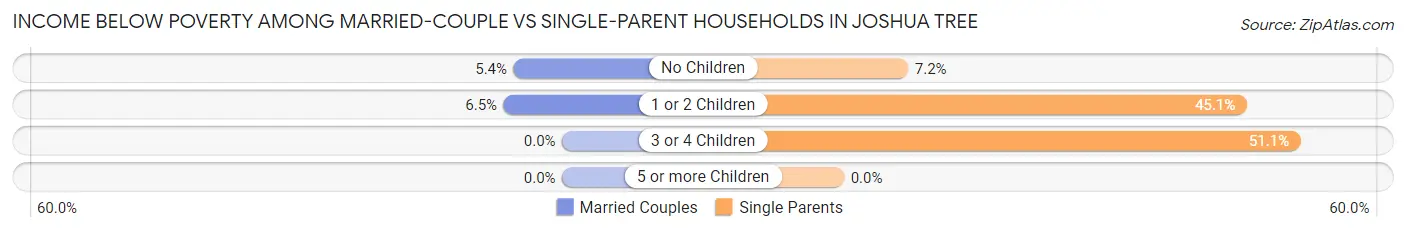
| Children | Married-Couple Families | Single-Parent Households |
| No Children | 34 (5.4%) | 17 (7.2%) |
| 1 or 2 Children | 21 (6.5%) | 46 (45.1%) |
| 3 or 4 Children | 0 (0.0%) | 46 (51.1%) |
| 5 or more Children | 0 (0.0%) | 0 (0.0%) |
| Total | 55 (5.5%) | 109 (25.4%) |
Race in Joshua Tree
The most populous races in Joshua Tree are White / Caucasian (5,236 | 77.6%), Hispanic or Latino (1,694 | 25.1%), and Two or more Races (721 | 10.7%).
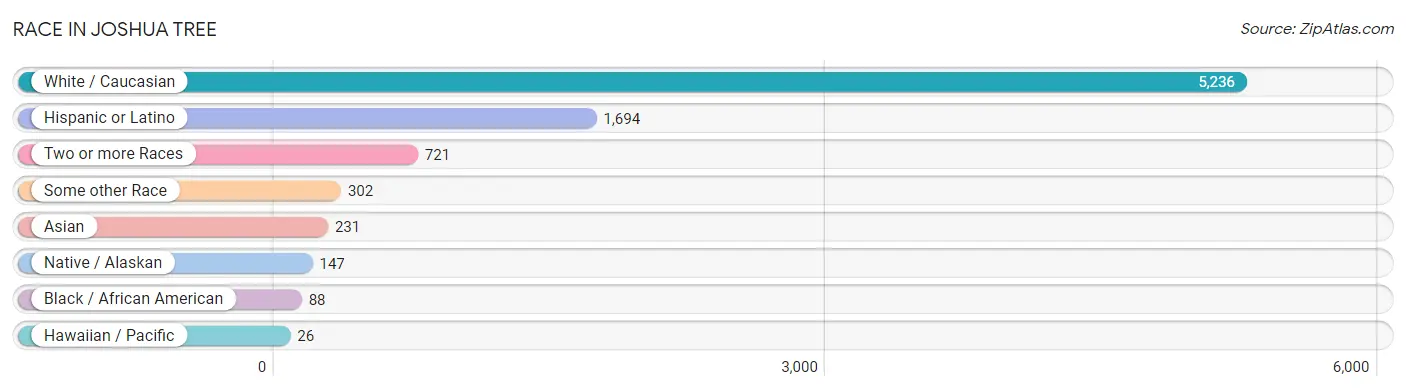
| Race | # Population | % Population |
| Asian | 231 | 3.4% |
| Black / African American | 88 | 1.3% |
| Hawaiian / Pacific | 26 | 0.4% |
| Hispanic or Latino | 1,694 | 25.1% |
| Native / Alaskan | 147 | 2.2% |
| White / Caucasian | 5,236 | 77.6% |
| Two or more Races | 721 | 10.7% |
| Some other Race | 302 | 4.5% |
| Total | 6,751 | 100.0% |
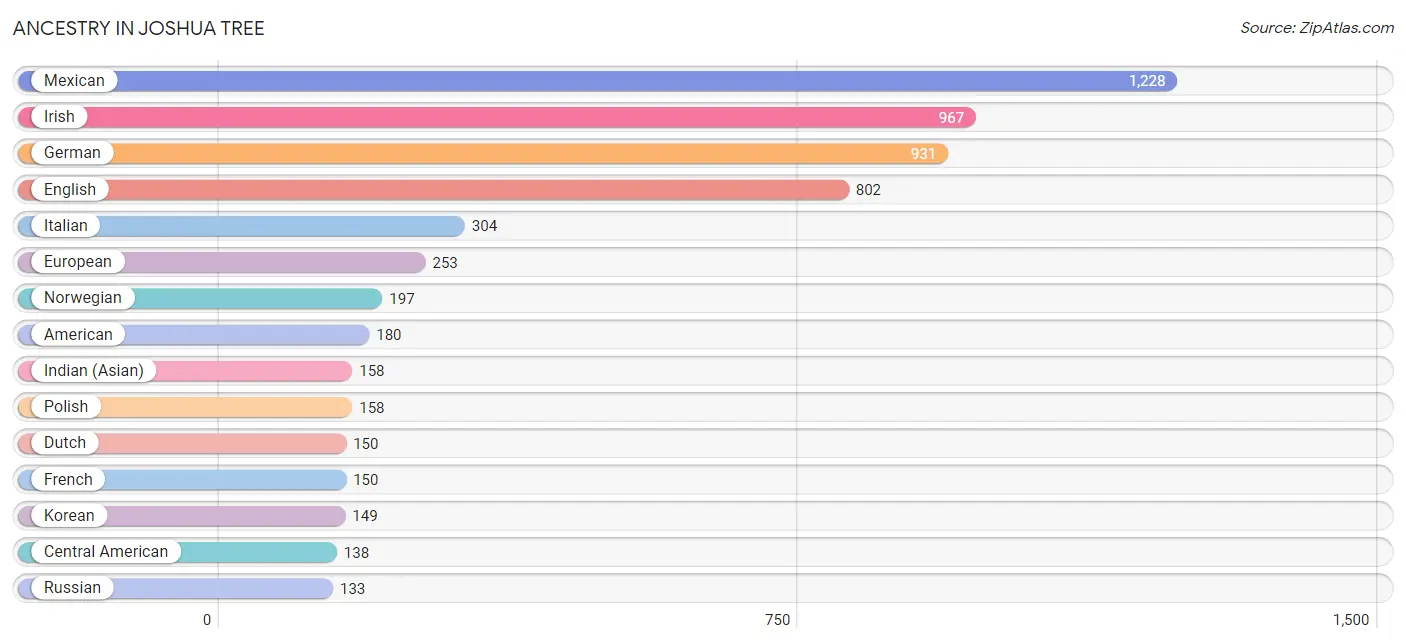
Ancestry in Joshua Tree
The most populous ancestries reported in Joshua Tree are Mexican (1,228 | 18.2%), Irish (967 | 14.3%), German (931 | 13.8%), English (802 | 11.9%), and Italian (304 | 4.5%), together accounting for 62.7% of all Joshua Tree residents.
| Ancestry | # Population | % Population |
| American | 180 | 2.7% |
| Apache | 4 | 0.1% |
| Armenian | 20 | 0.3% |
| Australian | 67 | 1.0% |
| Austrian | 26 | 0.4% |
| Blackfeet | 35 | 0.5% |
| British | 31 | 0.5% |
| Burmese | 12 | 0.2% |
| Canadian | 11 | 0.2% |
| Central American | 138 | 2.0% |
| Cherokee | 10 | 0.2% |
| Colombian | 119 | 1.8% |
| Costa Rican | 57 | 0.8% |
| Cuban | 43 | 0.6% |
| Czech | 11 | 0.2% |
| Dutch | 150 | 2.2% |
| Eastern European | 55 | 0.8% |
| English | 802 | 11.9% |
| European | 253 | 3.7% |
| French | 150 | 2.2% |
| French Canadian | 9 | 0.1% |
| German | 931 | 13.8% |
| Guatemalan | 59 | 0.9% |
| Honduran | 22 | 0.3% |
| Hungarian | 54 | 0.8% |
| Icelander | 17 | 0.3% |
| Indian (Asian) | 158 | 2.3% |
| Iranian | 11 | 0.2% |
| Irish | 967 | 14.3% |
| Italian | 304 | 4.5% |
| Korean | 149 | 2.2% |
| Lithuanian | 20 | 0.3% |
| Mexican | 1,228 | 18.2% |
| Native Hawaiian | 26 | 0.4% |
| Northern European | 24 | 0.4% |
| Norwegian | 197 | 2.9% |
| Osage | 11 | 0.2% |
| Pakistani | 12 | 0.2% |
| Polish | 158 | 2.3% |
| Romanian | 86 | 1.3% |
| Russian | 133 | 2.0% |
| Scandinavian | 17 | 0.3% |
| Scottish | 82 | 1.2% |
| South American | 119 | 1.8% |
| Spaniard | 98 | 1.5% |
| Spanish | 64 | 0.9% |
| Swedish | 106 | 1.6% |
| Swiss | 27 | 0.4% |
| Yaqui | 22 | 0.3% | View All 49 Rows |
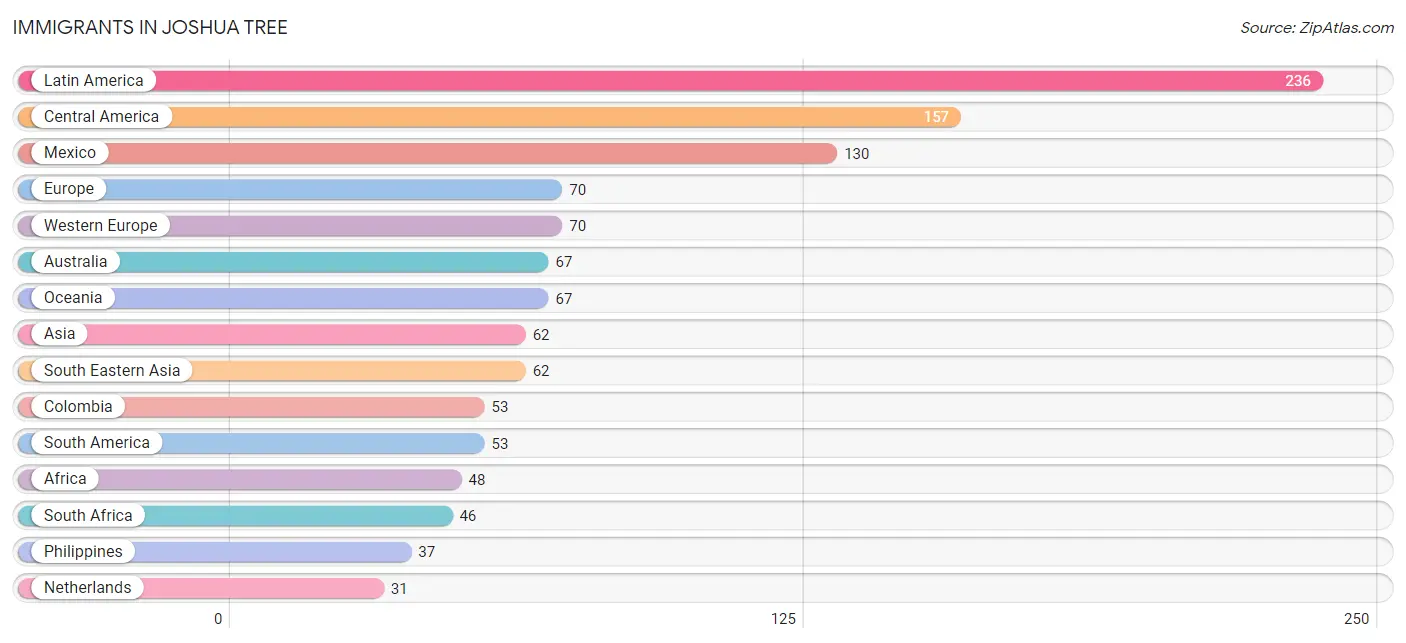
Immigrants in Joshua Tree
The most numerous immigrant groups reported in Joshua Tree came from Latin America (236 | 3.5%), Central America (157 | 2.3%), Mexico (130 | 1.9%), Europe (70 | 1.0%), and Western Europe (70 | 1.0%), together accounting for 9.8% of all Joshua Tree residents.
| Immigration Origin | # Population | % Population |
| Africa | 48 | 0.7% |
| Asia | 62 | 0.9% |
| Australia | 67 | 1.0% |
| Austria | 26 | 0.4% |
| Canada | 13 | 0.2% |
| Caribbean | 26 | 0.4% |
| Central America | 157 | 2.3% |
| Colombia | 53 | 0.8% |
| Costa Rica | 27 | 0.4% |
| Cuba | 26 | 0.4% |
| Europe | 70 | 1.0% |
| France | 13 | 0.2% |
| Latin America | 236 | 3.5% |
| Mexico | 130 | 1.9% |
| Netherlands | 31 | 0.5% |
| Northern Africa | 2 | 0.0% |
| Oceania | 67 | 1.0% |
| Philippines | 37 | 0.5% |
| South Africa | 46 | 0.7% |
| South America | 53 | 0.8% |
| South Eastern Asia | 62 | 0.9% |
| Thailand | 12 | 0.2% |
| Vietnam | 13 | 0.2% |
| Western Europe | 70 | 1.0% | View All 24 Rows |
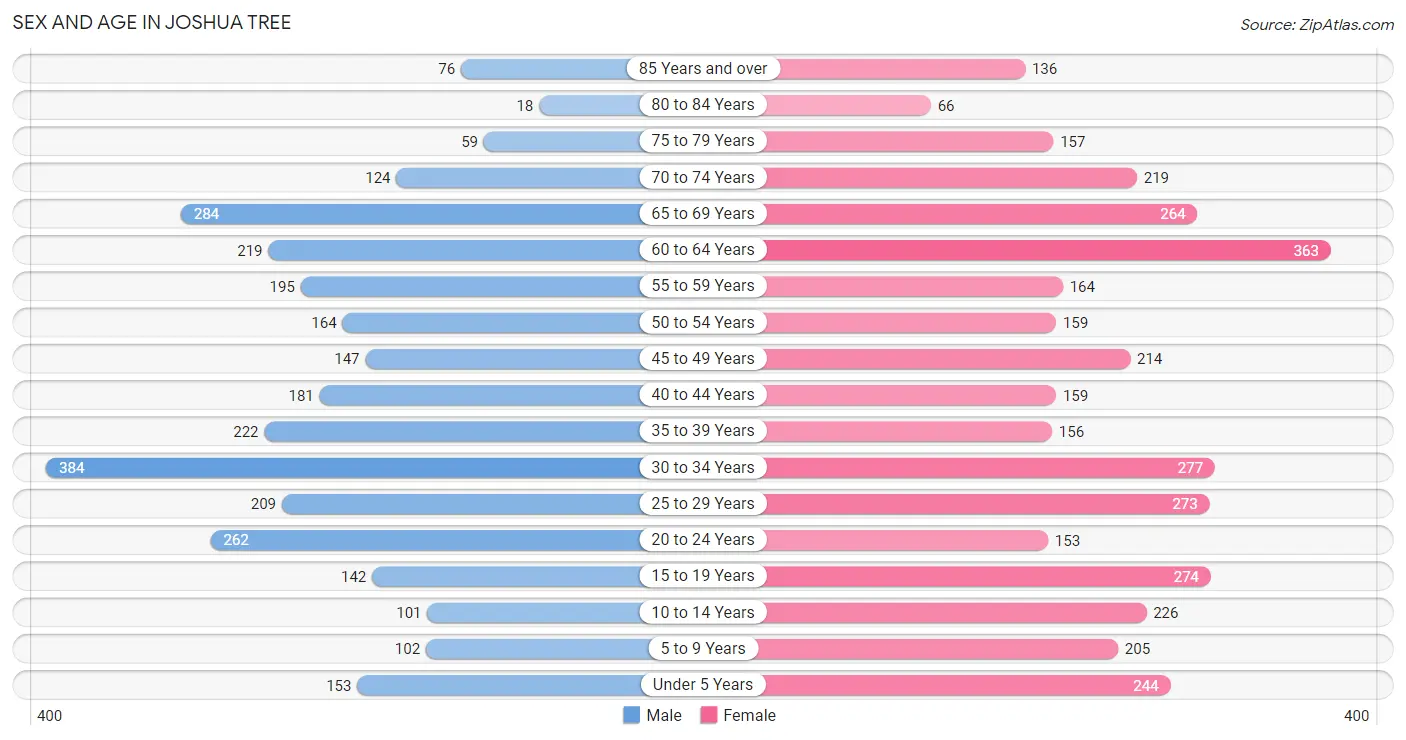
Sex and Age in Joshua Tree
Sex and Age in Joshua Tree
The most populous age groups in Joshua Tree are 30 to 34 Years (384 | 12.6%) for men and 60 to 64 Years (363 | 9.8%) for women.
| Age Bracket | Male | Female |
| Under 5 Years | 153 (5.0%) | 244 (6.6%) |
| 5 to 9 Years | 102 (3.4%) | 205 (5.5%) |
| 10 to 14 Years | 101 (3.3%) | 226 (6.1%) |
| 15 to 19 Years | 142 (4.7%) | 274 (7.4%) |
| 20 to 24 Years | 262 (8.6%) | 153 (4.1%) |
| 25 to 29 Years | 209 (6.9%) | 273 (7.4%) |
| 30 to 34 Years | 384 (12.6%) | 277 (7.5%) |
| 35 to 39 Years | 222 (7.3%) | 156 (4.2%) |
| 40 to 44 Years | 181 (5.9%) | 159 (4.3%) |
| 45 to 49 Years | 147 (4.8%) | 214 (5.8%) |
| 50 to 54 Years | 164 (5.4%) | 159 (4.3%) |
| 55 to 59 Years | 195 (6.4%) | 164 (4.4%) |
| 60 to 64 Years | 219 (7.2%) | 363 (9.8%) |
| 65 to 69 Years | 284 (9.3%) | 264 (7.1%) |
| 70 to 74 Years | 124 (4.1%) | 219 (5.9%) |
| 75 to 79 Years | 59 (1.9%) | 157 (4.2%) |
| 80 to 84 Years | 18 (0.6%) | 66 (1.8%) |
| 85 Years and over | 76 (2.5%) | 136 (3.7%) |
| Total | 3,042 (100.0%) | 3,709 (100.0%) |
Families and Households in Joshua Tree
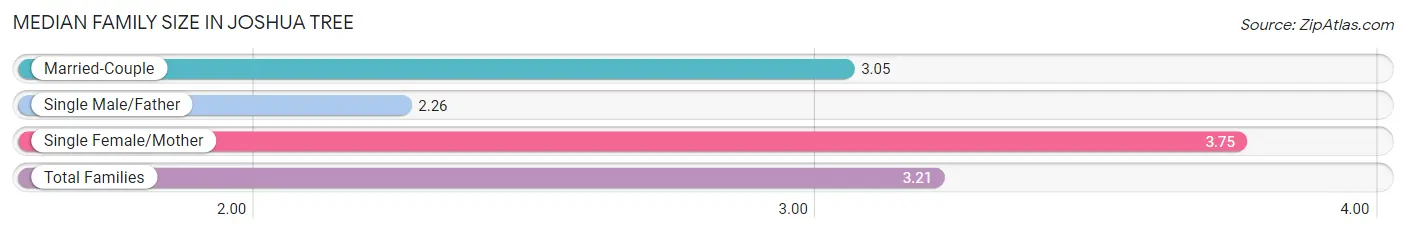
Median Family Size in Joshua Tree
The median family size in Joshua Tree is 3.21 persons per family, with single female/mother families (379 | 26.4%) accounting for the largest median family size of 3.75 persons per family. On the other hand, single male/father families (50 | 3.5%) represent the smallest median family size with 2.26 persons per family.
| Family Type | # Families | Family Size |
| Married-Couple | 1,008 (70.2%) | 3.05 |
| Single Male/Father | 50 (3.5%) | 2.26 |
| Single Female/Mother | 379 (26.4%) | 3.75 |
| Total Families | 1,437 (100.0%) | 3.21 |
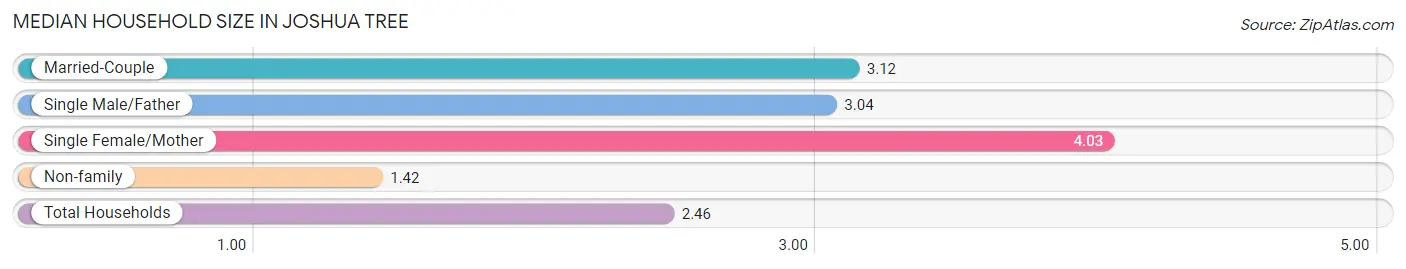
Median Household Size in Joshua Tree
The median household size in Joshua Tree is 2.46 persons per household, with single female/mother households (379 | 14.2%) accounting for the largest median household size of 4.03 persons per household. non-family households (1,234 | 46.2%) represent the smallest median household size with 1.42 persons per household.
| Household Type | # Households | Household Size |
| Married-Couple | 1,008 (37.7%) | 3.12 |
| Single Male/Father | 50 (1.9%) | 3.04 |
| Single Female/Mother | 379 (14.2%) | 4.03 |
| Non-family | 1,234 (46.2%) | 1.42 |
| Total Households | 2,671 (100.0%) | 2.46 |
Household Size by Marriage Status in Joshua Tree
Out of a total of 2,671 households in Joshua Tree, 1,437 (53.8%) are family households, while 1,234 (46.2%) are nonfamily households. The most numerous type of family households are 2-person households, comprising 722, and the most common type of nonfamily households are 1-person households, comprising 893.
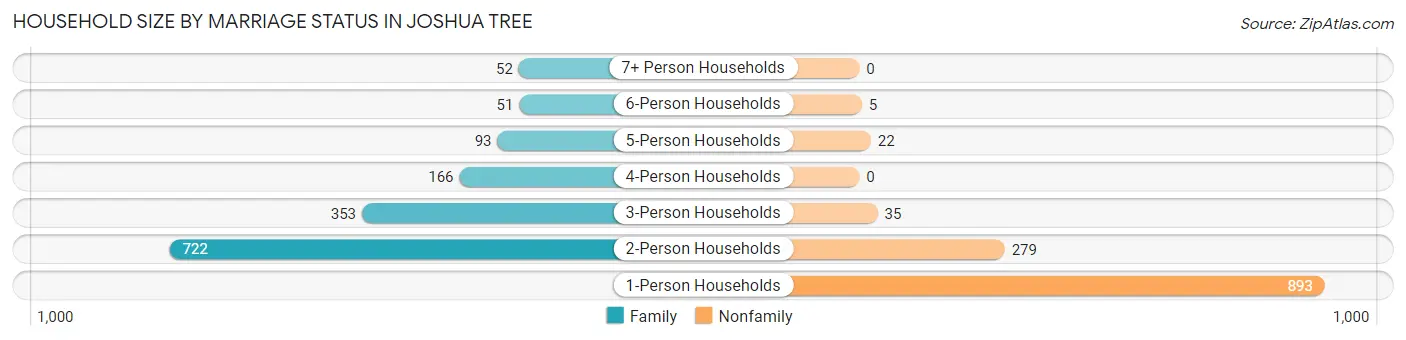
| Household Size | Family Households | Nonfamily Households |
| 1-Person Households | - | 893 (33.4%) |
| 2-Person Households | 722 (27.0%) | 279 (10.4%) |
| 3-Person Households | 353 (13.2%) | 35 (1.3%) |
| 4-Person Households | 166 (6.2%) | 0 (0.0%) |
| 5-Person Households | 93 (3.5%) | 22 (0.8%) |
| 6-Person Households | 51 (1.9%) | 5 (0.2%) |
| 7+ Person Households | 52 (1.9%) | 0 (0.0%) |
| Total | 1,437 (53.8%) | 1,234 (46.2%) |
Female Fertility in Joshua Tree
Fertility by Age in Joshua Tree
Average fertility rate in Joshua Tree is 16.0 births per 1,000 women. Women in the age bracket of 20 to 34 years have the highest fertility rate with 36.0 births per 1,000 women. Women in the age bracket of 20 to 34 years acount for 100.0% of all women with births.
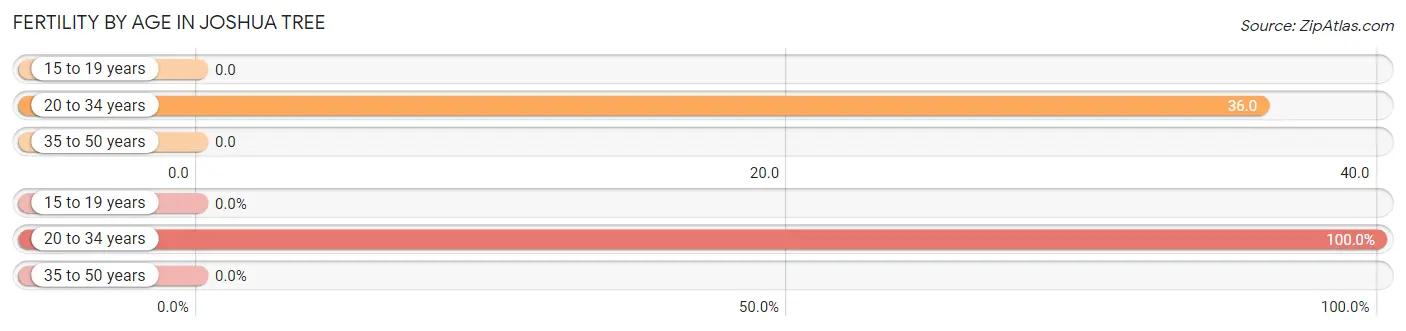
| Age Bracket | Women with Births | Births / 1,000 Women |
| 15 to 19 years | 0 (0.0%) | 0.0 |
| 20 to 34 years | 25 (100.0%) | 36.0 |
| 35 to 50 years | 0 (0.0%) | 0.0 |
| Total | 25 (100.0%) | 16.0 |
Fertility by Age by Marriage Status in Joshua Tree
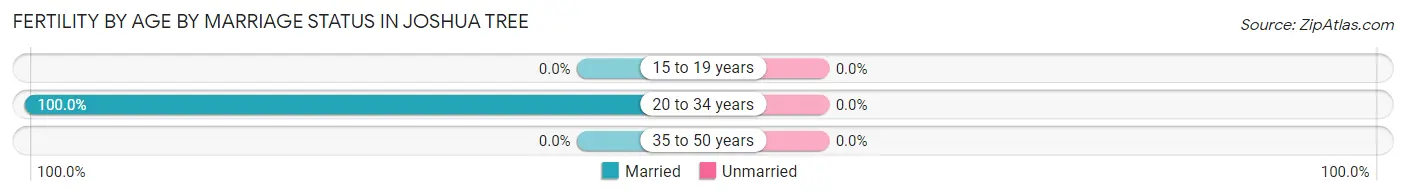
| Age Bracket | Married | Unmarried |
| 15 to 19 years | 0 (0.0%) | 0 (0.0%) |
| 20 to 34 years | 25 (100.0%) | 0 (0.0%) |
| 35 to 50 years | 0 (0.0%) | 0 (0.0%) |
| Total | 25 (100.0%) | 0 (0.0%) |
Fertility by Education in Joshua Tree
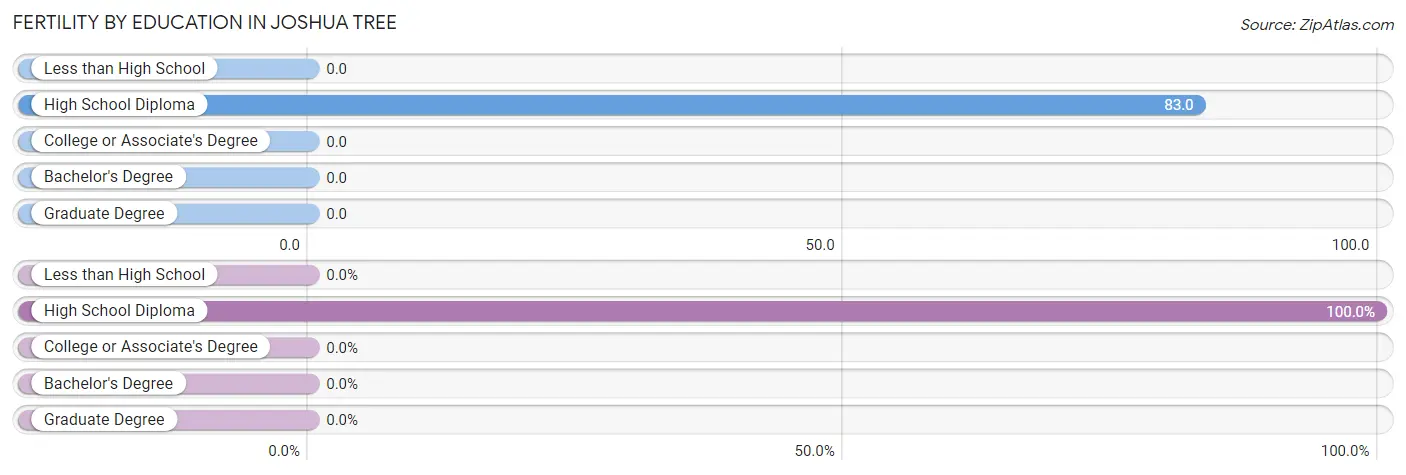
| Educational Attainment | Women with Births | Births / 1,000 Women |
| Less than High School | 0 (0.0%) | 0.0 |
| High School Diploma | 25 (100.0%) | 83.0 |
| College or Associate's Degree | 0 (0.0%) | 0.0 |
| Bachelor's Degree | 0 (0.0%) | 0.0 |
| Graduate Degree | 0 (0.0%) | 0.0 |
| Total | 25 (100.0%) | 16.0 |
Fertility by Education by Marriage Status in Joshua Tree
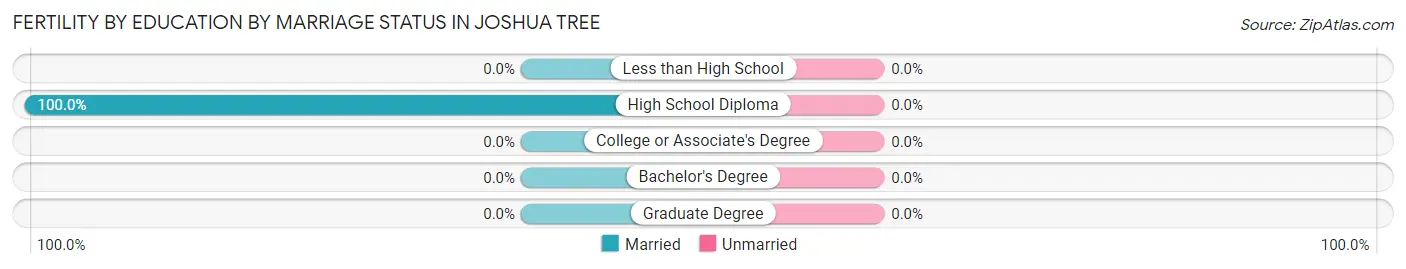
| Educational Attainment | Married | Unmarried |
| Less than High School | 0 (0.0%) | 0 (0.0%) |
| High School Diploma | 25 (100.0%) | 0 (0.0%) |
| College or Associate's Degree | 0 (0.0%) | 0 (0.0%) |
| Bachelor's Degree | 0 (0.0%) | 0 (0.0%) |
| Graduate Degree | 0 (0.0%) | 0 (0.0%) |
| Total | 25 (100.0%) | 0 (0.0%) |
Employment Characteristics in Joshua Tree
Employment by Class of Employer in Joshua Tree
Among the 2,621 employed individuals in Joshua Tree, private company employees (1,305 | 49.8%), self-employed (not incorporated) (386 | 14.7%), and federal government employees (359 | 13.7%) make up the most common classes of employment.
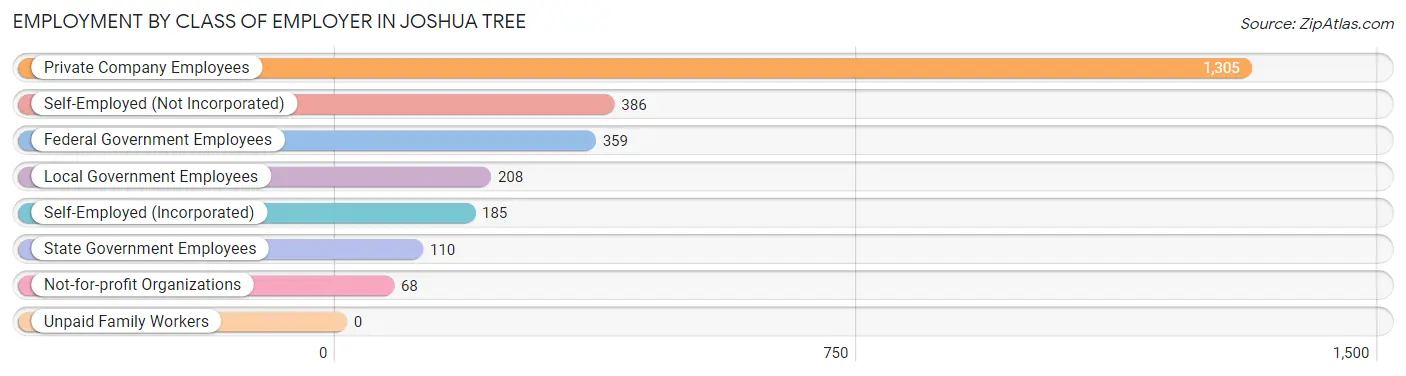
| Employer Class | # Employees | % Employees |
| Private Company Employees | 1,305 | 49.8% |
| Self-Employed (Incorporated) | 185 | 7.1% |
| Self-Employed (Not Incorporated) | 386 | 14.7% |
| Not-for-profit Organizations | 68 | 2.6% |
| Local Government Employees | 208 | 7.9% |
| State Government Employees | 110 | 4.2% |
| Federal Government Employees | 359 | 13.7% |
| Unpaid Family Workers | 0 | 0.0% |
| Total | 2,621 | 100.0% |
Employment Status by Age in Joshua Tree
According to the labor force statistics for Joshua Tree, out of the total population over 16 years of age (5,495), 53.3% or 2,929 individuals are in the labor force, with 10.9% or 319 of them unemployed. The age group with the highest labor force participation rate is 20 to 24 years, with 99.5% or 413 individuals in the labor force. Within the labor force, the 55 to 59 years age range has the highest percentage of unemployed individuals, with 25.7% or 52 of them being unemployed.
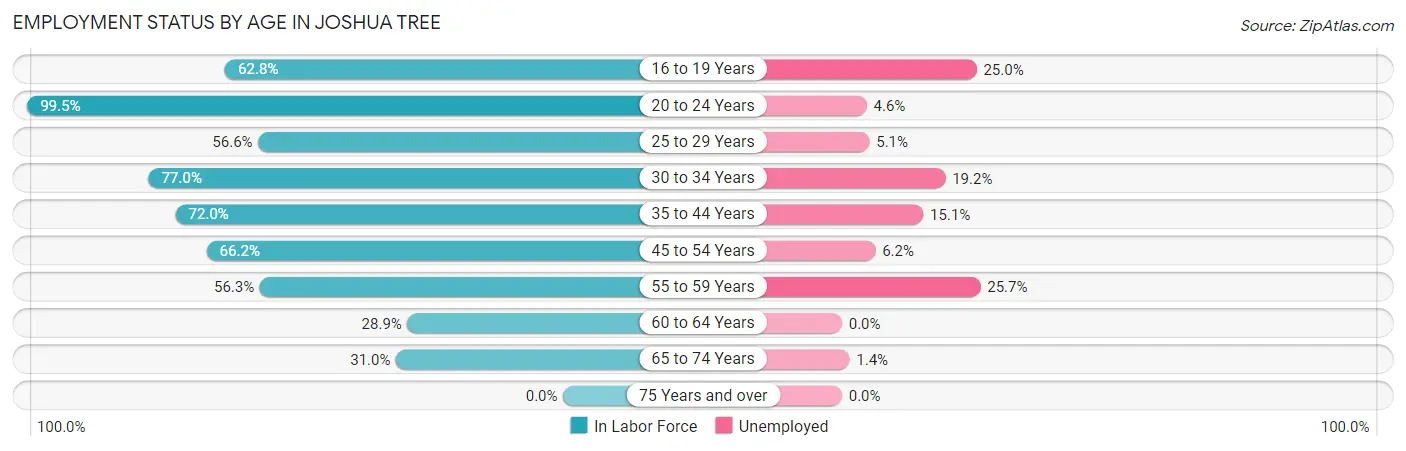
| Age Bracket | In Labor Force | Unemployed |
| 16 to 19 Years | 120 (62.8%) | 30 (25.0%) |
| 20 to 24 Years | 413 (99.5%) | 19 (4.6%) |
| 25 to 29 Years | 273 (56.6%) | 14 (5.1%) |
| 30 to 34 Years | 509 (77.0%) | 98 (19.2%) |
| 35 to 44 Years | 517 (72.0%) | 78 (15.1%) |
| 45 to 54 Years | 453 (66.2%) | 28 (6.2%) |
| 55 to 59 Years | 202 (56.3%) | 52 (25.7%) |
| 60 to 64 Years | 168 (28.9%) | 0 (0.0%) |
| 65 to 74 Years | 276 (31.0%) | 4 (1.4%) |
| 75 Years and over | 0 (0.0%) | 0 (0.0%) |
| Total | 2,929 (53.3%) | 319 (10.9%) |
Employment Status by Educational Attainment in Joshua Tree
According to labor force statistics for Joshua Tree, 60.9% of individuals (2,123) out of the total population between 25 and 64 years of age (3,486) are in the labor force, with 12.6% or 267 of them being unemployed. The group with the highest labor force participation rate are those with the educational attainment of bachelor's degree or higher, with 79.2% or 786 individuals in the labor force. Within the labor force, individuals with high school diploma education have the highest percentage of unemployment, with 18.9% or 84 of them being unemployed.
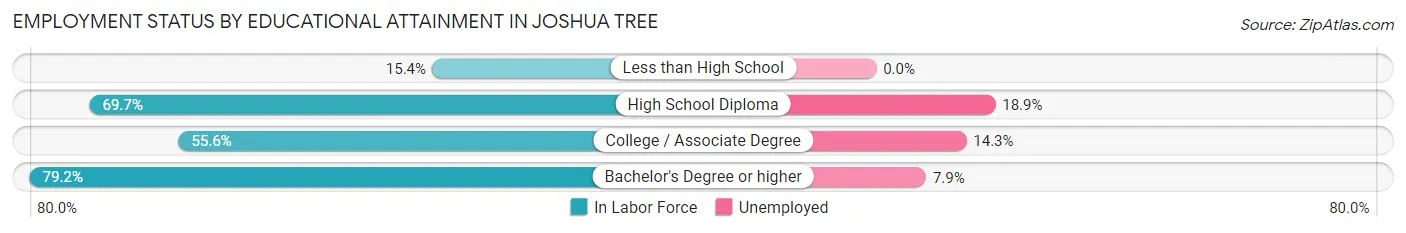
| Educational Attainment | In Labor Force | Unemployed |
| Less than High School | 54 (15.4%) | 0 (0.0%) |
| High School Diploma | 444 (69.7%) | 120 (18.9%) |
| College / Associate Degree | 837 (55.6%) | 215 (14.3%) |
| Bachelor's Degree or higher | 786 (79.2%) | 78 (7.9%) |
| Total | 2,123 (60.9%) | 439 (12.6%) |
Employment Occupations by Sex in Joshua Tree
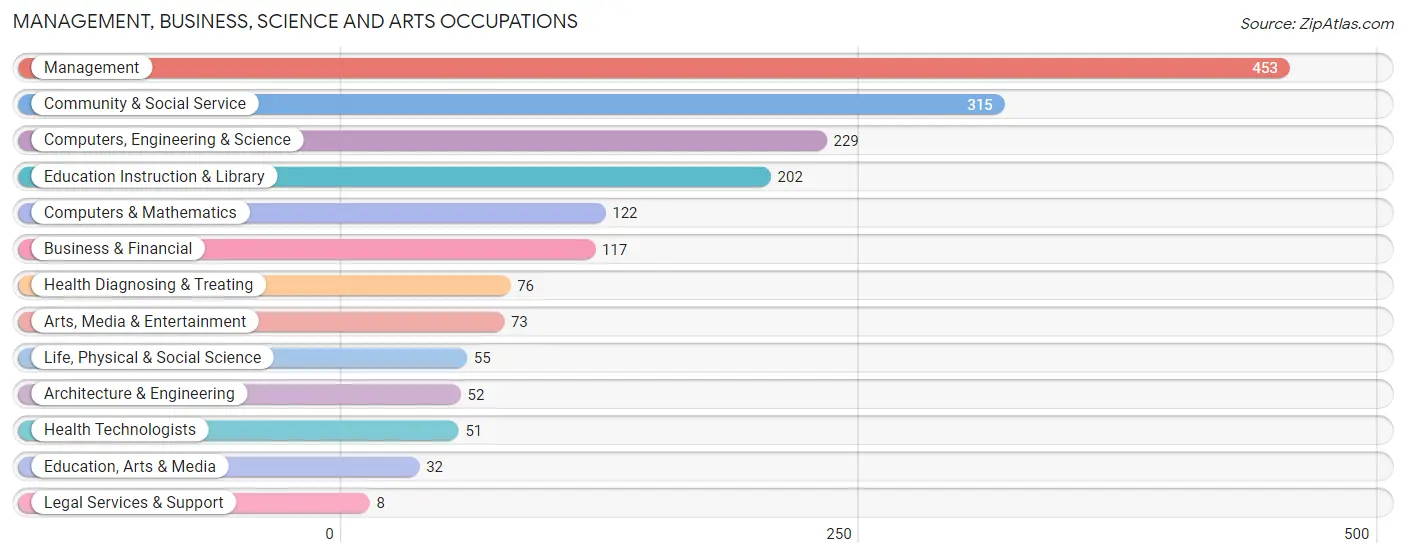
Management, Business, Science and Arts Occupations
The most common Management, Business, Science and Arts occupations in Joshua Tree are Management (453 | 17.8%), Community & Social Service (315 | 12.4%), Computers, Engineering & Science (229 | 9.0%), Education Instruction & Library (202 | 7.9%), and Computers & Mathematics (122 | 4.8%).
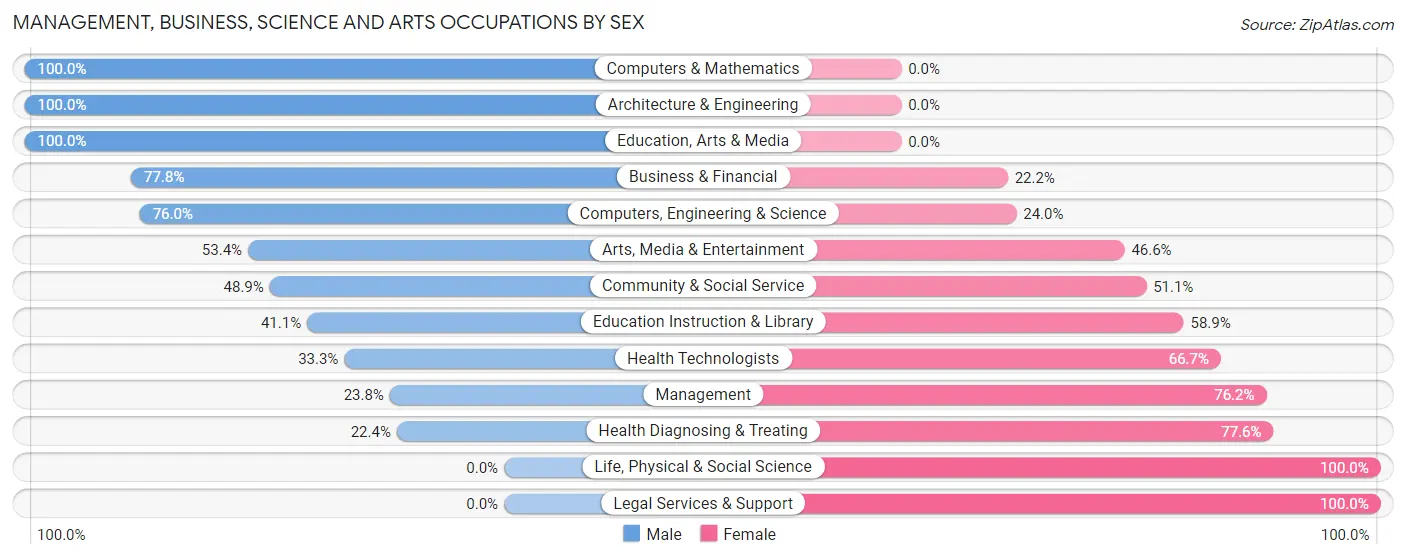
Management, Business, Science and Arts Occupations by Sex
Within the Management, Business, Science and Arts occupations in Joshua Tree, the most male-oriented occupations are Computers & Mathematics (100.0%), Architecture & Engineering (100.0%), and Education, Arts & Media (100.0%), while the most female-oriented occupations are Life, Physical & Social Science (100.0%), Legal Services & Support (100.0%), and Health Diagnosing & Treating (77.6%).
| Occupation | Male | Female |
| Management | 108 (23.8%) | 345 (76.2%) |
| Business & Financial | 91 (77.8%) | 26 (22.2%) |
| Computers, Engineering & Science | 174 (76.0%) | 55 (24.0%) |
| Computers & Mathematics | 122 (100.0%) | 0 (0.0%) |
| Architecture & Engineering | 52 (100.0%) | 0 (0.0%) |
| Life, Physical & Social Science | 0 (0.0%) | 55 (100.0%) |
| Community & Social Service | 154 (48.9%) | 161 (51.1%) |
| Education, Arts & Media | 32 (100.0%) | 0 (0.0%) |
| Legal Services & Support | 0 (0.0%) | 8 (100.0%) |
| Education Instruction & Library | 83 (41.1%) | 119 (58.9%) |
| Arts, Media & Entertainment | 39 (53.4%) | 34 (46.6%) |
| Health Diagnosing & Treating | 17 (22.4%) | 59 (77.6%) |
| Health Technologists | 17 (33.3%) | 34 (66.7%) |
| Total (Category) | 544 (45.7%) | 646 (54.3%) |
| Total (Overall) | 1,359 (53.4%) | 1,186 (46.6%) |
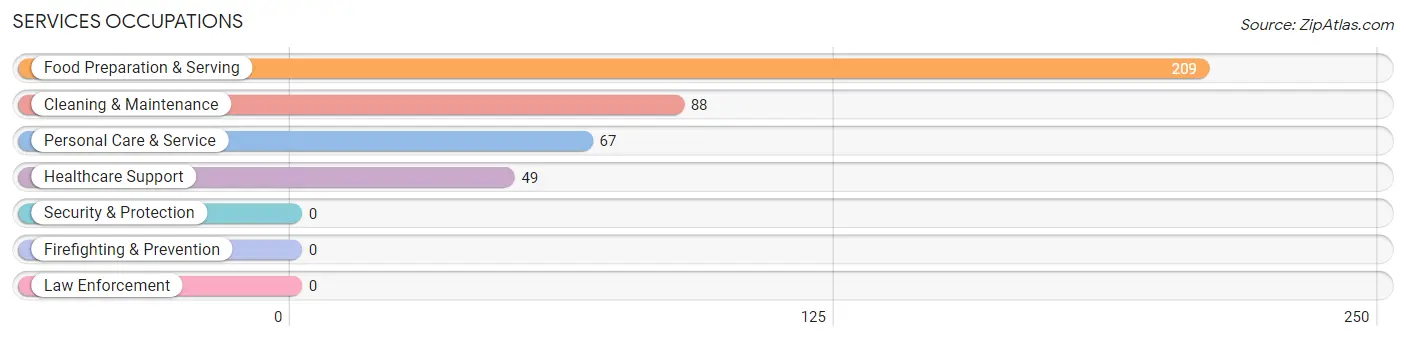
Services Occupations
The most common Services occupations in Joshua Tree are Food Preparation & Serving (209 | 8.2%), Cleaning & Maintenance (88 | 3.5%), Personal Care & Service (67 | 2.6%), and Healthcare Support (49 | 1.9%).
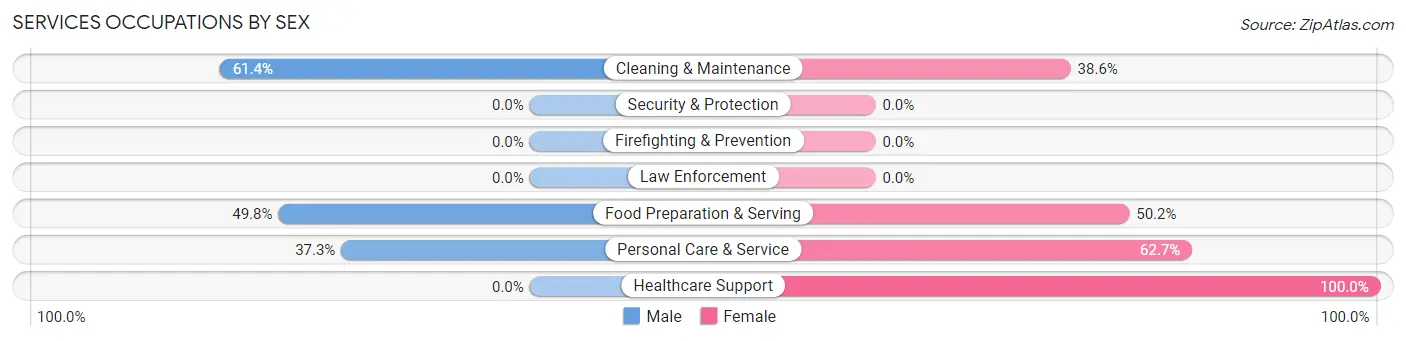
Services Occupations by Sex
Within the Services occupations in Joshua Tree, the most male-oriented occupations are Cleaning & Maintenance (61.4%), Food Preparation & Serving (49.8%), and Personal Care & Service (37.3%), while the most female-oriented occupations are Healthcare Support (100.0%), Personal Care & Service (62.7%), and Food Preparation & Serving (50.2%).
| Occupation | Male | Female |
| Healthcare Support | 0 (0.0%) | 49 (100.0%) |
| Security & Protection | 0 (0.0%) | 0 (0.0%) |
| Firefighting & Prevention | 0 (0.0%) | 0 (0.0%) |
| Law Enforcement | 0 (0.0%) | 0 (0.0%) |
| Food Preparation & Serving | 104 (49.8%) | 105 (50.2%) |
| Cleaning & Maintenance | 54 (61.4%) | 34 (38.6%) |
| Personal Care & Service | 25 (37.3%) | 42 (62.7%) |
| Total (Category) | 183 (44.3%) | 230 (55.7%) |
| Total (Overall) | 1,359 (53.4%) | 1,186 (46.6%) |
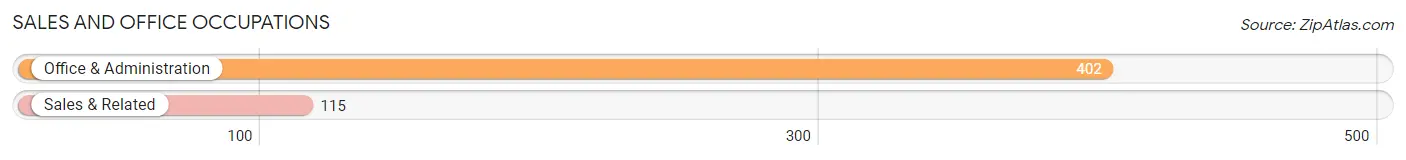
Sales and Office Occupations
The most common Sales and Office occupations in Joshua Tree are Office & Administration (402 | 15.8%), and Sales & Related (115 | 4.5%).
Sales and Office Occupations by Sex
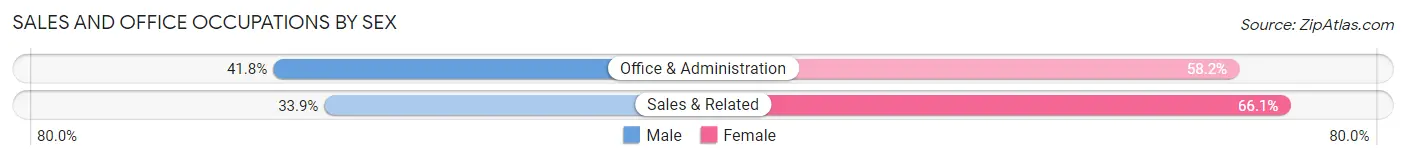
| Occupation | Male | Female |
| Sales & Related | 39 (33.9%) | 76 (66.1%) |
| Office & Administration | 168 (41.8%) | 234 (58.2%) |
| Total (Category) | 207 (40.0%) | 310 (60.0%) |
| Total (Overall) | 1,359 (53.4%) | 1,186 (46.6%) |
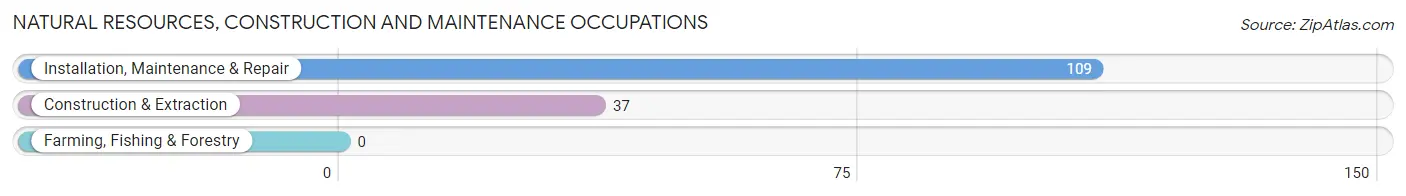
Natural Resources, Construction and Maintenance Occupations
The most common Natural Resources, Construction and Maintenance occupations in Joshua Tree are Installation, Maintenance & Repair (109 | 4.3%), and Construction & Extraction (37 | 1.5%).
Natural Resources, Construction and Maintenance Occupations by Sex
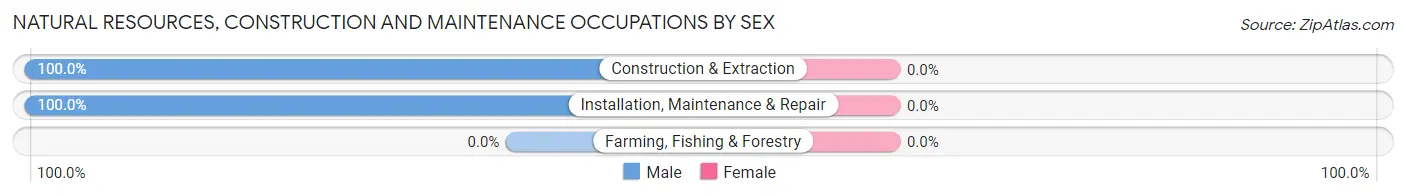
| Occupation | Male | Female |
| Farming, Fishing & Forestry | 0 (0.0%) | 0 (0.0%) |
| Construction & Extraction | 37 (100.0%) | 0 (0.0%) |
| Installation, Maintenance & Repair | 109 (100.0%) | 0 (0.0%) |
| Total (Category) | 146 (100.0%) | 0 (0.0%) |
| Total (Overall) | 1,359 (53.4%) | 1,186 (46.6%) |
Production, Transportation and Moving Occupations
The most common Production, Transportation and Moving occupations in Joshua Tree are Production (137 | 5.4%), Transportation (81 | 3.2%), and Material Moving (61 | 2.4%).
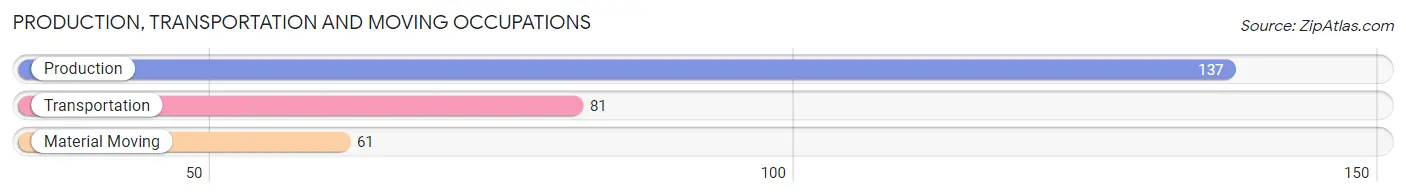
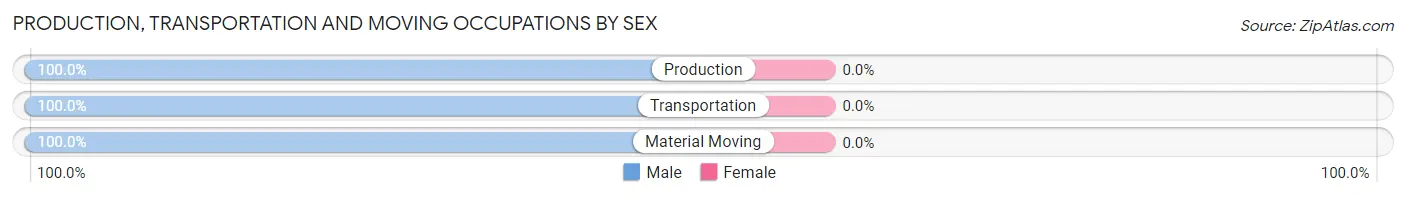
Production, Transportation and Moving Occupations by Sex
| Occupation | Male | Female |
| Production | 137 (100.0%) | 0 (0.0%) |
| Transportation | 81 (100.0%) | 0 (0.0%) |
| Material Moving | 61 (100.0%) | 0 (0.0%) |
| Total (Category) | 279 (100.0%) | 0 (0.0%) |
| Total (Overall) | 1,359 (53.4%) | 1,186 (46.6%) |
Employment Industries by Sex in Joshua Tree
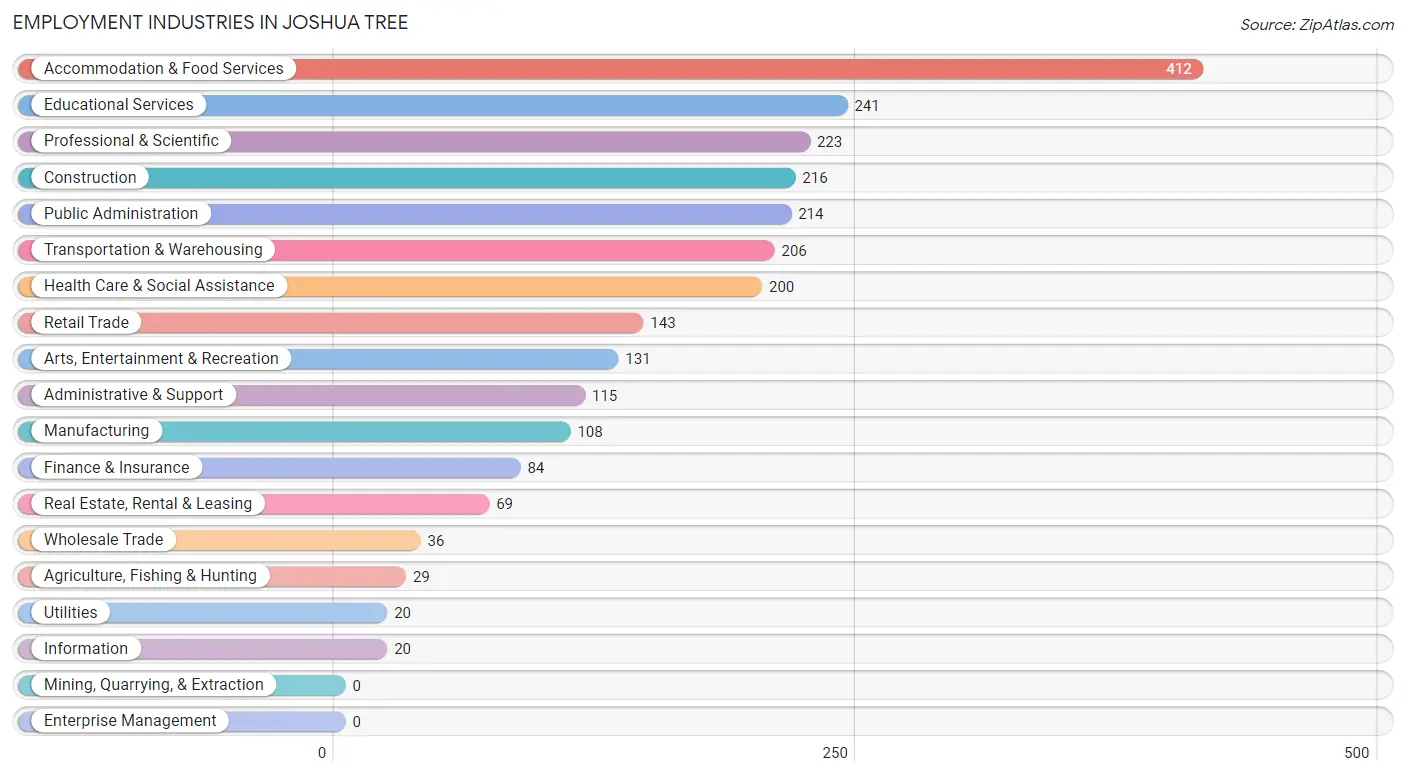
Employment Industries in Joshua Tree
The major employment industries in Joshua Tree include Accommodation & Food Services (412 | 16.2%), Educational Services (241 | 9.5%), Professional & Scientific (223 | 8.8%), Construction (216 | 8.5%), and Public Administration (214 | 8.4%).
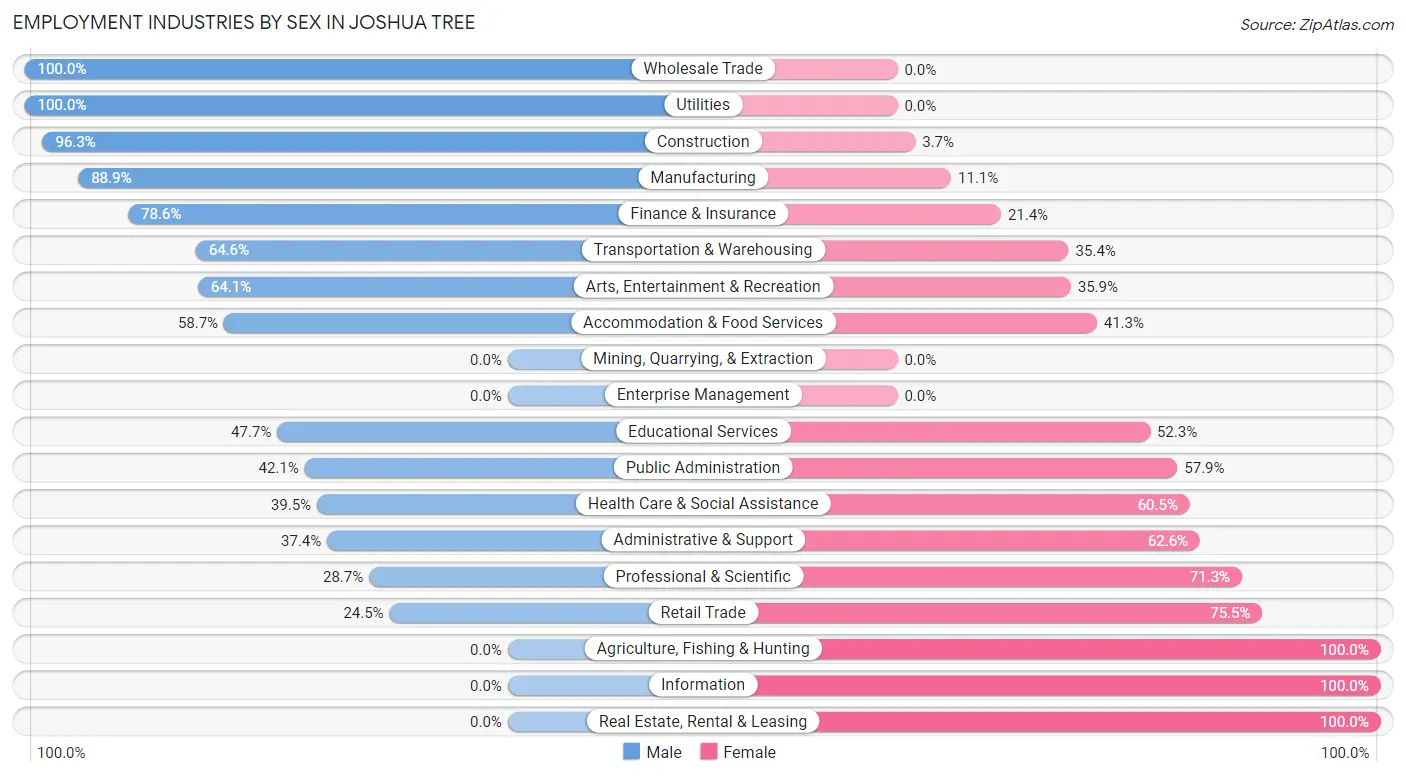
Employment Industries by Sex in Joshua Tree
The Joshua Tree industries that see more men than women are Wholesale Trade (100.0%), Utilities (100.0%), and Construction (96.3%), whereas the industries that tend to have a higher number of women are Agriculture, Fishing & Hunting (100.0%), Information (100.0%), and Real Estate, Rental & Leasing (100.0%).
| Industry | Male | Female |
| Agriculture, Fishing & Hunting | 0 (0.0%) | 29 (100.0%) |
| Mining, Quarrying, & Extraction | 0 (0.0%) | 0 (0.0%) |
| Construction | 208 (96.3%) | 8 (3.7%) |
| Manufacturing | 96 (88.9%) | 12 (11.1%) |
| Wholesale Trade | 36 (100.0%) | 0 (0.0%) |
| Retail Trade | 35 (24.5%) | 108 (75.5%) |
| Transportation & Warehousing | 133 (64.6%) | 73 (35.4%) |
| Utilities | 20 (100.0%) | 0 (0.0%) |
| Information | 0 (0.0%) | 20 (100.0%) |
| Finance & Insurance | 66 (78.6%) | 18 (21.4%) |
| Real Estate, Rental & Leasing | 0 (0.0%) | 69 (100.0%) |
| Professional & Scientific | 64 (28.7%) | 159 (71.3%) |
| Enterprise Management | 0 (0.0%) | 0 (0.0%) |
| Administrative & Support | 43 (37.4%) | 72 (62.6%) |
| Educational Services | 115 (47.7%) | 126 (52.3%) |
| Health Care & Social Assistance | 79 (39.5%) | 121 (60.5%) |
| Arts, Entertainment & Recreation | 84 (64.1%) | 47 (35.9%) |
| Accommodation & Food Services | 242 (58.7%) | 170 (41.3%) |
| Public Administration | 90 (42.1%) | 124 (57.9%) |
| Total | 1,359 (53.4%) | 1,186 (46.6%) |
Education in Joshua Tree
School Enrollment in Joshua Tree
The most common levels of schooling among the 1,242 students in Joshua Tree are high school (392 | 31.6%), elementary school (246 | 19.8%), and college / undergraduate (242 | 19.5%).
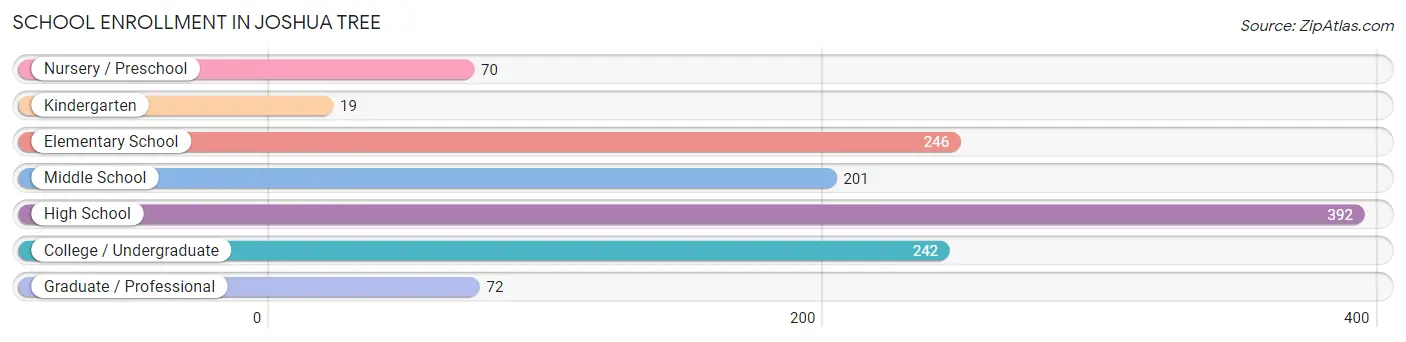
| School Level | # Students | % Students |
| Nursery / Preschool | 70 | 5.6% |
| Kindergarten | 19 | 1.5% |
| Elementary School | 246 | 19.8% |
| Middle School | 201 | 16.2% |
| High School | 392 | 31.6% |
| College / Undergraduate | 242 | 19.5% |
| Graduate / Professional | 72 | 5.8% |
| Total | 1,242 | 100.0% |
School Enrollment by Age by Funding Source in Joshua Tree
Out of a total of 1,242 students who are enrolled in schools in Joshua Tree, 225 (18.1%) attend a private institution, while the remaining 1,017 (81.9%) are enrolled in public schools. The age group of 10 to 14 year olds has the highest likelihood of being enrolled in private schools, with 95 (29.0% in the age bracket) enrolled. Conversely, the age group of 18 to 19 year olds has the lowest likelihood of being enrolled in a private school, with 29 (100.0% in the age bracket) attending a public institution.
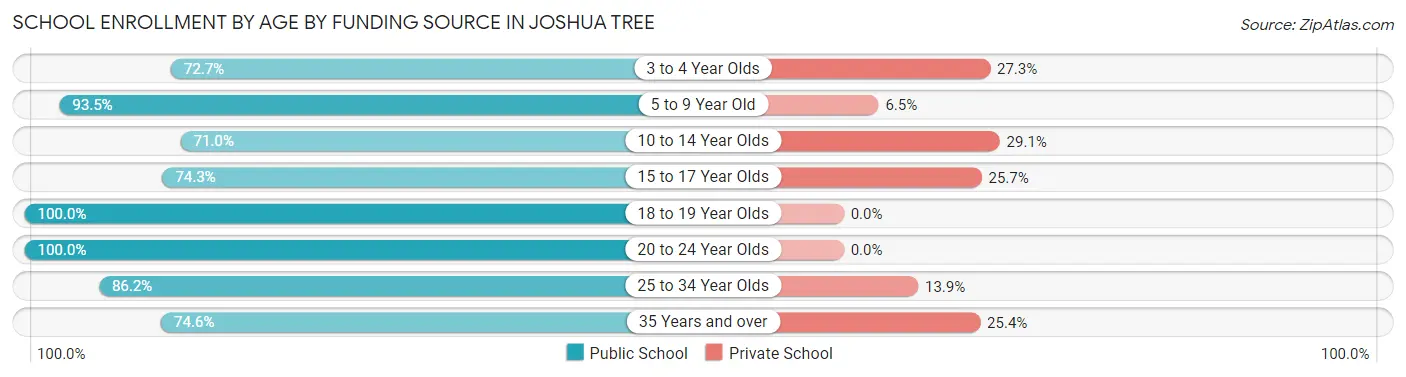
| Age Bracket | Public School | Private School |
| 3 to 4 Year Olds | 40 (72.7%) | 15 (27.3%) |
| 5 to 9 Year Old | 216 (93.5%) | 15 (6.5%) |
| 10 to 14 Year Olds | 232 (71.0%) | 95 (29.0%) |
| 15 to 17 Year Olds | 220 (74.3%) | 76 (25.7%) |
| 18 to 19 Year Olds | 29 (100.0%) | 0 (0.0%) |
| 20 to 24 Year Olds | 180 (100.0%) | 0 (0.0%) |
| 25 to 34 Year Olds | 56 (86.2%) | 9 (13.9%) |
| 35 Years and over | 44 (74.6%) | 15 (25.4%) |
| Total | 1,017 (81.9%) | 225 (18.1%) |
Educational Attainment by Field of Study in Joshua Tree
Business (269 | 19.7%), literature & languages (180 | 13.2%), arts & humanities (157 | 11.5%), science & technology (153 | 11.2%), and social sciences (152 | 11.1%) are the most common fields of study among 1,365 individuals in Joshua Tree who have obtained a bachelor's degree or higher.
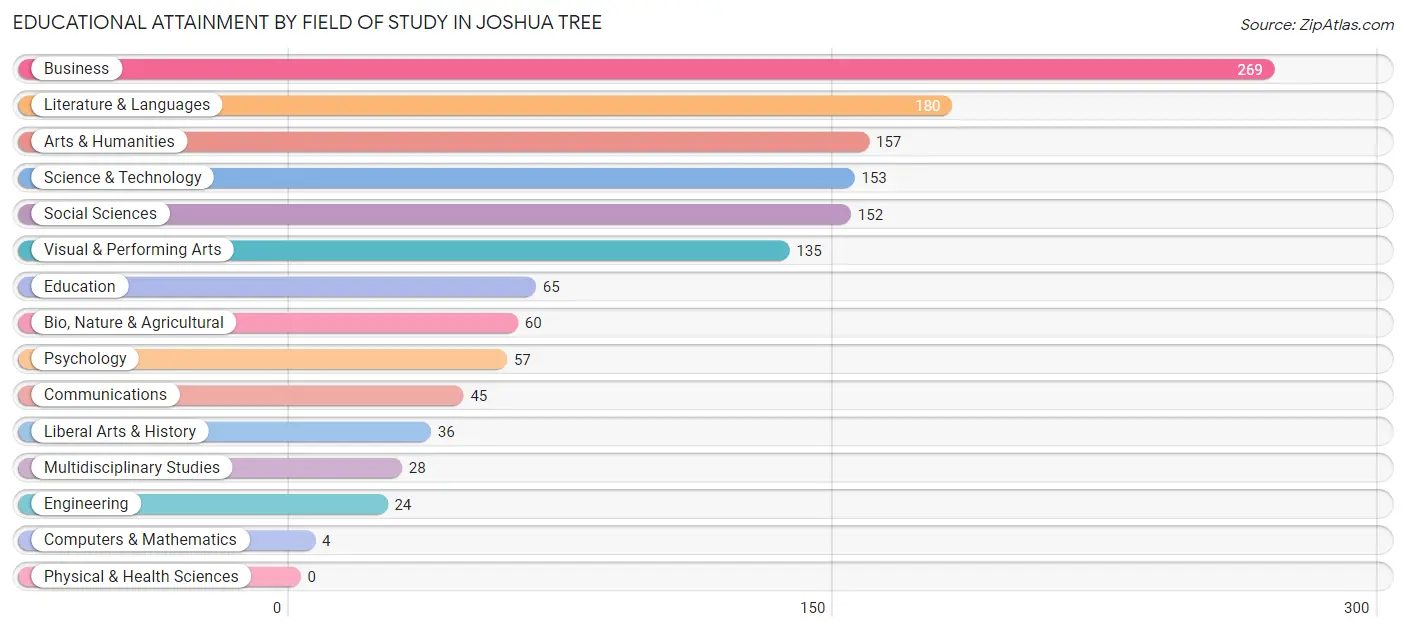
| Field of Study | # Graduates | % Graduates |
| Computers & Mathematics | 4 | 0.3% |
| Bio, Nature & Agricultural | 60 | 4.4% |
| Physical & Health Sciences | 0 | 0.0% |
| Psychology | 57 | 4.2% |
| Social Sciences | 152 | 11.1% |
| Engineering | 24 | 1.8% |
| Multidisciplinary Studies | 28 | 2.1% |
| Science & Technology | 153 | 11.2% |
| Business | 269 | 19.7% |
| Education | 65 | 4.8% |
| Literature & Languages | 180 | 13.2% |
| Liberal Arts & History | 36 | 2.6% |
| Visual & Performing Arts | 135 | 9.9% |
| Communications | 45 | 3.3% |
| Arts & Humanities | 157 | 11.5% |
| Total | 1,365 | 100.0% |
Transportation & Commute in Joshua Tree
Vehicle Availability by Sex in Joshua Tree
The most prevalent vehicle ownership categories in Joshua Tree are males with 2 vehicles (592, accounting for 41.3%) and females with 2 vehicles (453, making up 50.1%).
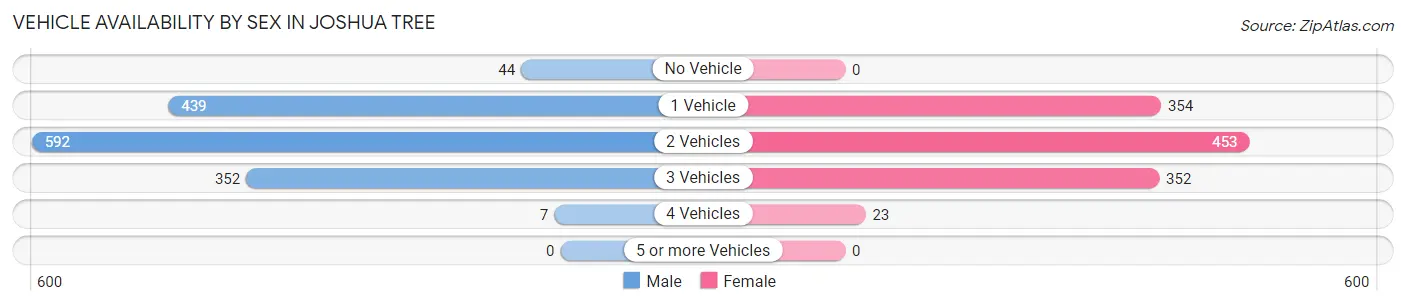
| Vehicles Available | Male | Female |
| No Vehicle | 44 (3.1%) | 0 (0.0%) |
| 1 Vehicle | 439 (30.6%) | 354 (29.9%) |
| 2 Vehicles | 592 (41.3%) | 453 (38.3%) |
| 3 Vehicles | 352 (24.5%) | 352 (29.8%) |
| 4 Vehicles | 7 (0.5%) | 23 (1.9%) |
| 5 or more Vehicles | 0 (0.0%) | 0 (0.0%) |
| Total | 1,434 (100.0%) | 1,182 (100.0%) |
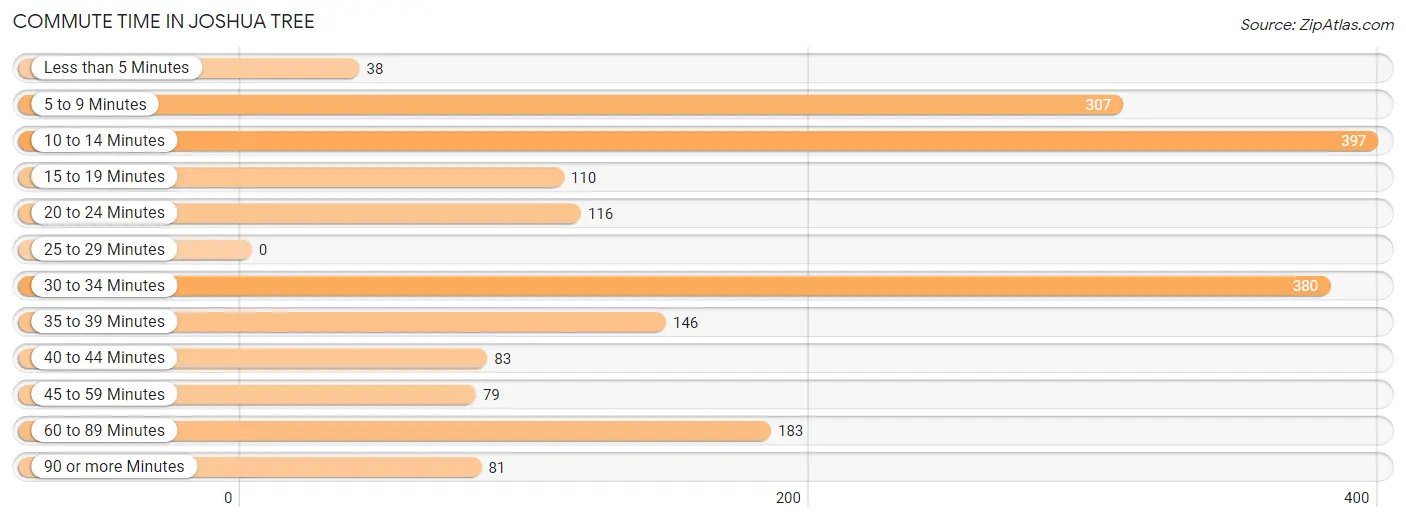
Commute Time in Joshua Tree
The most frequently occuring commute durations in Joshua Tree are 10 to 14 minutes (397 commuters, 20.7%), 30 to 34 minutes (380 commuters, 19.8%), and 5 to 9 minutes (307 commuters, 16.0%).
| Commute Time | # Commuters | % Commuters |
| Less than 5 Minutes | 38 | 2.0% |
| 5 to 9 Minutes | 307 | 16.0% |
| 10 to 14 Minutes | 397 | 20.7% |
| 15 to 19 Minutes | 110 | 5.7% |
| 20 to 24 Minutes | 116 | 6.0% |
| 25 to 29 Minutes | 0 | 0.0% |
| 30 to 34 Minutes | 380 | 19.8% |
| 35 to 39 Minutes | 146 | 7.6% |
| 40 to 44 Minutes | 83 | 4.3% |
| 45 to 59 Minutes | 79 | 4.1% |
| 60 to 89 Minutes | 183 | 9.5% |
| 90 or more Minutes | 81 | 4.2% |
Commute Time by Sex in Joshua Tree
The most common commute times in Joshua Tree are 30 to 34 minutes (317 commuters, 27.7%) for males and 10 to 14 minutes (255 commuters, 32.9%) for females.
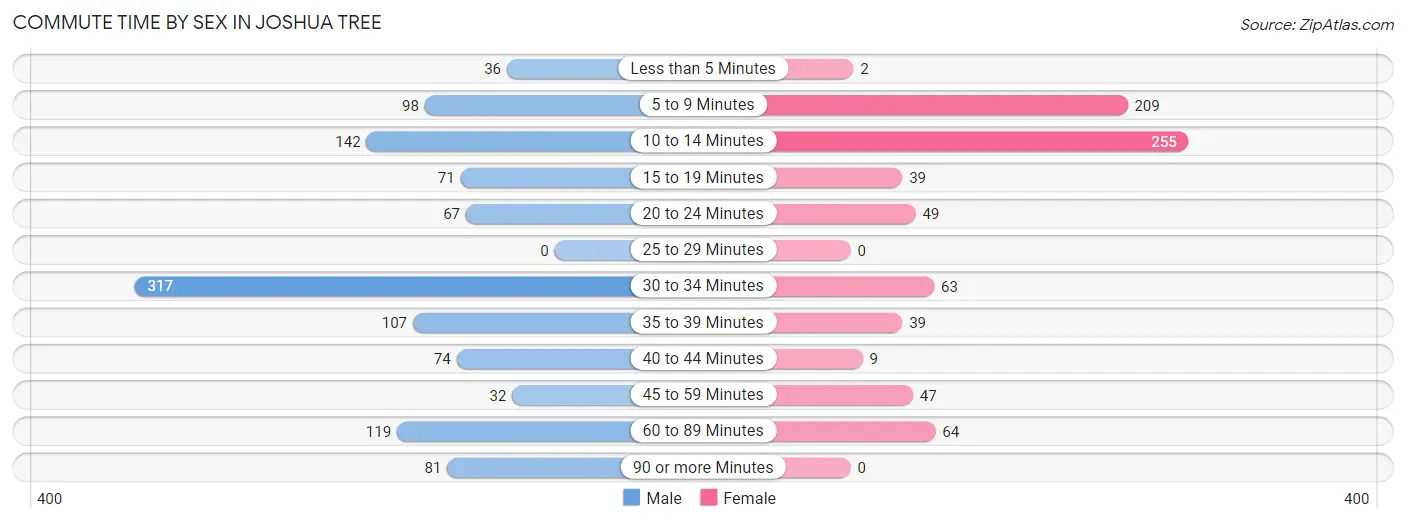
| Commute Time | Male | Female |
| Less than 5 Minutes | 36 (3.2%) | 2 (0.3%) |
| 5 to 9 Minutes | 98 (8.6%) | 209 (26.9%) |
| 10 to 14 Minutes | 142 (12.4%) | 255 (32.9%) |
| 15 to 19 Minutes | 71 (6.2%) | 39 (5.0%) |
| 20 to 24 Minutes | 67 (5.9%) | 49 (6.3%) |
| 25 to 29 Minutes | 0 (0.0%) | 0 (0.0%) |
| 30 to 34 Minutes | 317 (27.7%) | 63 (8.1%) |
| 35 to 39 Minutes | 107 (9.3%) | 39 (5.0%) |
| 40 to 44 Minutes | 74 (6.5%) | 9 (1.2%) |
| 45 to 59 Minutes | 32 (2.8%) | 47 (6.1%) |
| 60 to 89 Minutes | 119 (10.4%) | 64 (8.3%) |
| 90 or more Minutes | 81 (7.1%) | 0 (0.0%) |
Time of Departure to Work by Sex in Joshua Tree
The most frequent times of departure to work in Joshua Tree are 5:30 AM to 5:59 AM (223, 19.5%) for males and 6:30 AM to 6:59 AM (204, 26.3%) for females.
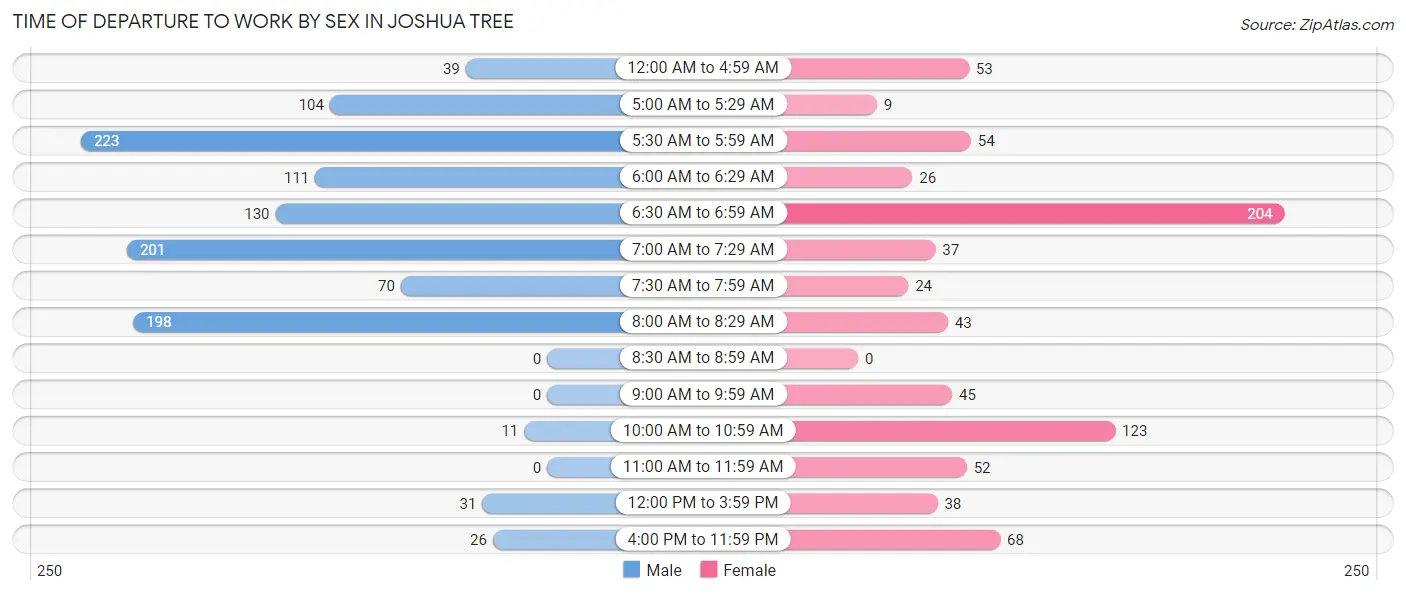
| Time of Departure | Male | Female |
| 12:00 AM to 4:59 AM | 39 (3.4%) | 53 (6.8%) |
| 5:00 AM to 5:29 AM | 104 (9.1%) | 9 (1.2%) |
| 5:30 AM to 5:59 AM | 223 (19.5%) | 54 (7.0%) |
| 6:00 AM to 6:29 AM | 111 (9.7%) | 26 (3.4%) |
| 6:30 AM to 6:59 AM | 130 (11.4%) | 204 (26.3%) |
| 7:00 AM to 7:29 AM | 201 (17.6%) | 37 (4.8%) |
| 7:30 AM to 7:59 AM | 70 (6.1%) | 24 (3.1%) |
| 8:00 AM to 8:29 AM | 198 (17.3%) | 43 (5.5%) |
| 8:30 AM to 8:59 AM | 0 (0.0%) | 0 (0.0%) |
| 9:00 AM to 9:59 AM | 0 (0.0%) | 45 (5.8%) |
| 10:00 AM to 10:59 AM | 11 (1.0%) | 123 (15.9%) |
| 11:00 AM to 11:59 AM | 0 (0.0%) | 52 (6.7%) |
| 12:00 PM to 3:59 PM | 31 (2.7%) | 38 (4.9%) |
| 4:00 PM to 11:59 PM | 26 (2.3%) | 68 (8.8%) |
| Total | 1,144 (100.0%) | 776 (100.0%) |
Housing Occupancy in Joshua Tree
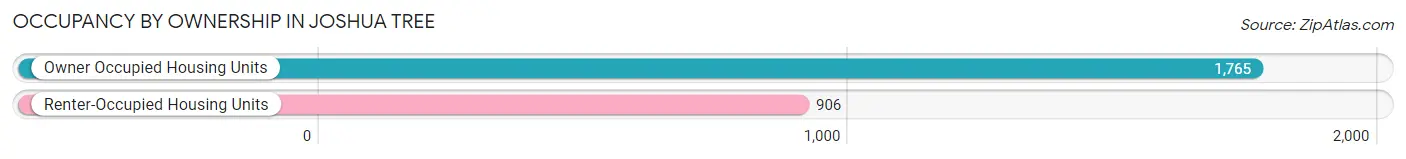
Occupancy by Ownership in Joshua Tree
Of the total 2,671 dwellings in Joshua Tree, owner-occupied units account for 1,765 (66.1%), while renter-occupied units make up 906 (33.9%).
| Occupancy | # Housing Units | % Housing Units |
| Owner Occupied Housing Units | 1,765 | 66.1% |
| Renter-Occupied Housing Units | 906 | 33.9% |
| Total Occupied Housing Units | 2,671 | 100.0% |
Occupancy by Household Size in Joshua Tree
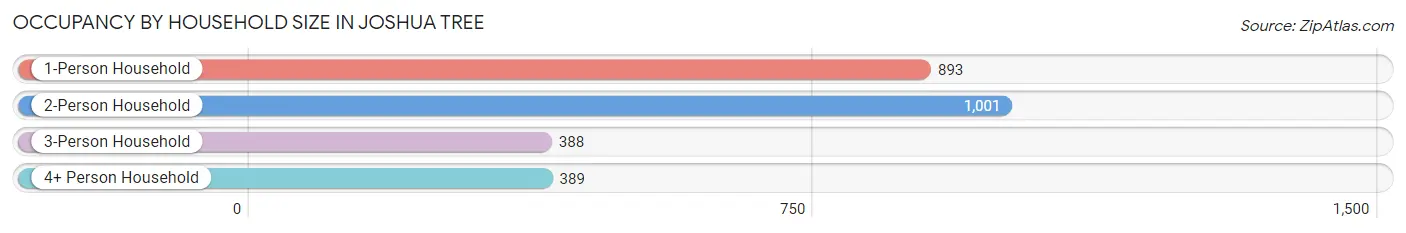
| Household Size | # Housing Units | % Housing Units |
| 1-Person Household | 893 | 33.4% |
| 2-Person Household | 1,001 | 37.5% |
| 3-Person Household | 388 | 14.5% |
| 4+ Person Household | 389 | 14.6% |
| Total Housing Units | 2,671 | 100.0% |
Occupancy by Ownership by Household Size in Joshua Tree
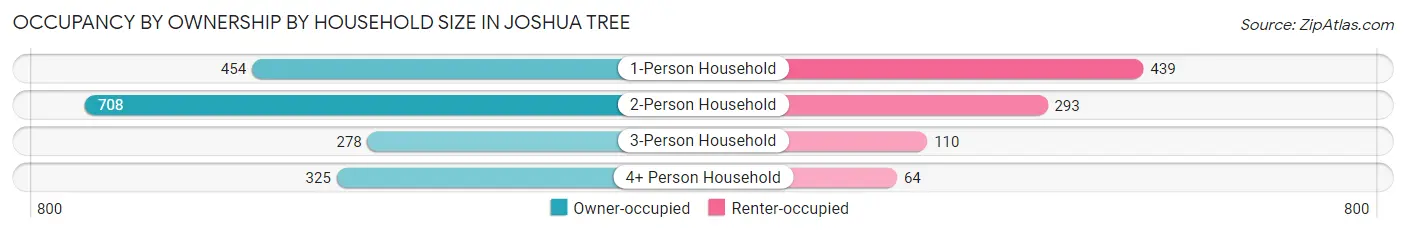
| Household Size | Owner-occupied | Renter-occupied |
| 1-Person Household | 454 (50.8%) | 439 (49.2%) |
| 2-Person Household | 708 (70.7%) | 293 (29.3%) |
| 3-Person Household | 278 (71.7%) | 110 (28.3%) |
| 4+ Person Household | 325 (83.6%) | 64 (16.5%) |
| Total Housing Units | 1,765 (66.1%) | 906 (33.9%) |
Occupancy by Educational Attainment in Joshua Tree
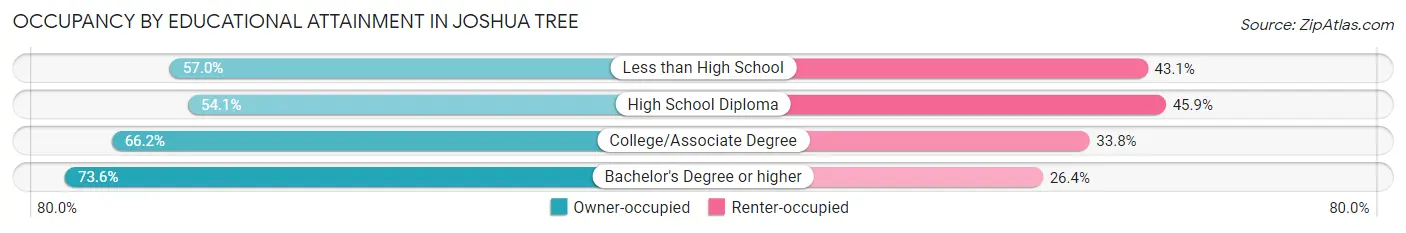
| Household Size | Owner-occupied | Renter-occupied |
| Less than High School | 86 (57.0%) | 65 (43.0%) |
| High School Diploma | 206 (54.1%) | 175 (45.9%) |
| College/Associate Degree | 902 (66.2%) | 461 (33.8%) |
| Bachelor's Degree or higher | 571 (73.6%) | 205 (26.4%) |
Occupancy by Age of Householder in Joshua Tree
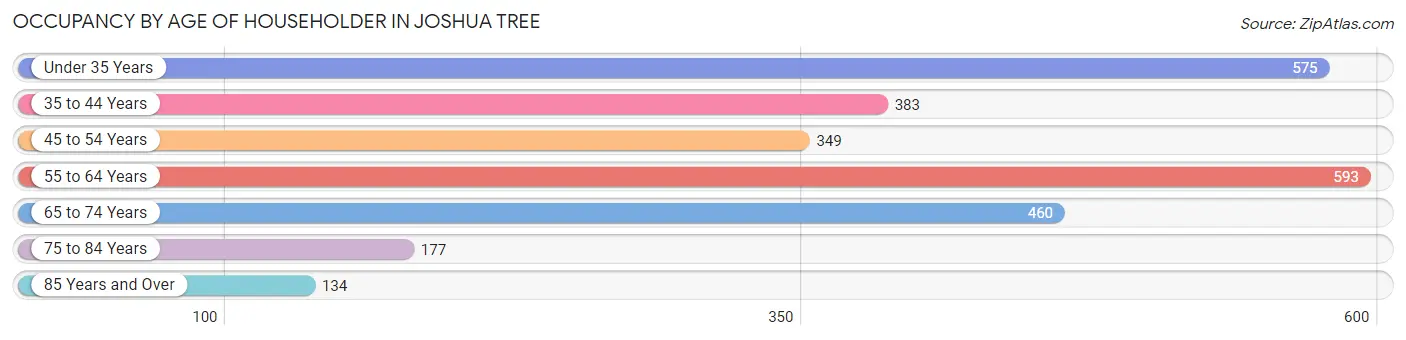
| Age Bracket | # Households | % Households |
| Under 35 Years | 575 | 21.5% |
| 35 to 44 Years | 383 | 14.3% |
| 45 to 54 Years | 349 | 13.1% |
| 55 to 64 Years | 593 | 22.2% |
| 65 to 74 Years | 460 | 17.2% |
| 75 to 84 Years | 177 | 6.6% |
| 85 Years and Over | 134 | 5.0% |
| Total | 2,671 | 100.0% |
Housing Finances in Joshua Tree
Median Income by Occupancy in Joshua Tree
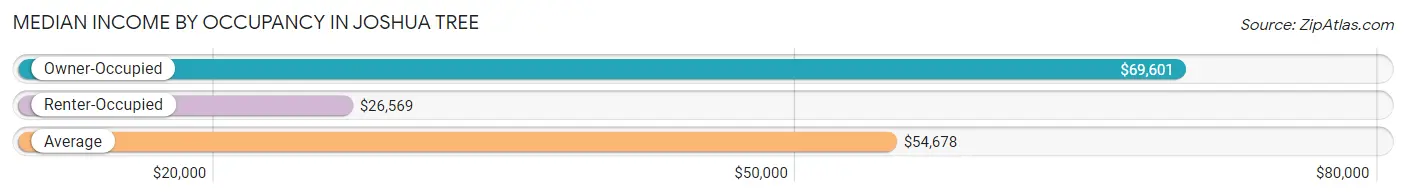
| Occupancy Type | # Households | Median Income |
| Owner-Occupied | 1,765 (66.1%) | $69,601 |
| Renter-Occupied | 906 (33.9%) | $26,569 |
| Average | 2,671 (100.0%) | $54,678 |
Occupancy by Householder Income Bracket in Joshua Tree
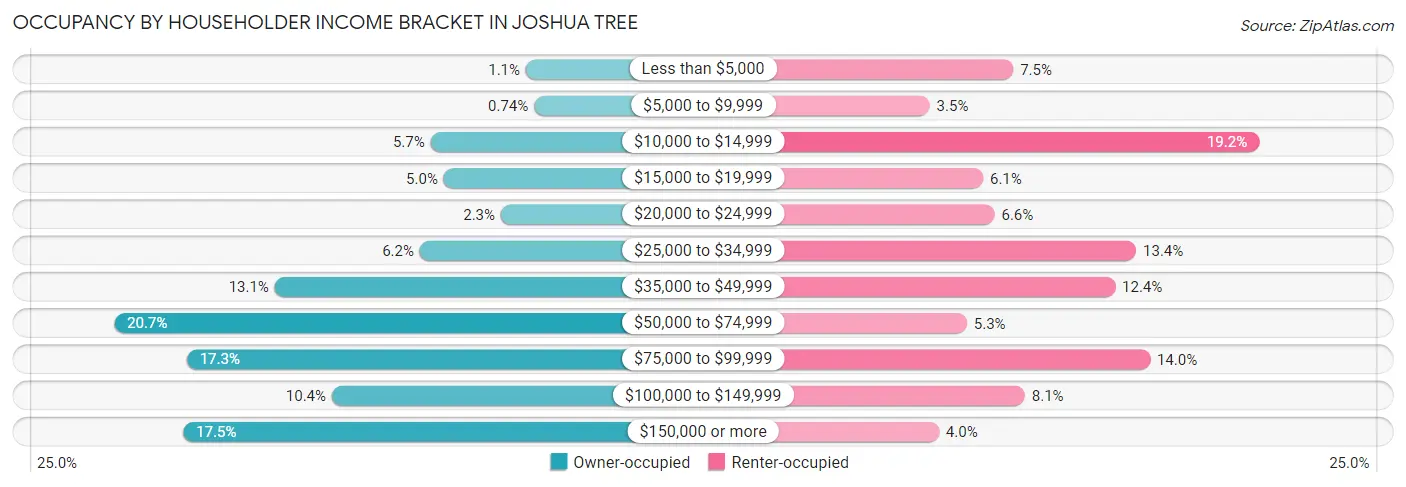
| Income Bracket | Owner-occupied | Renter-occupied |
| Less than $5,000 | 20 (1.1%) | 68 (7.5%) |
| $5,000 to $9,999 | 13 (0.7%) | 32 (3.5%) |
| $10,000 to $14,999 | 100 (5.7%) | 174 (19.2%) |
| $15,000 to $19,999 | 89 (5.0%) | 55 (6.1%) |
| $20,000 to $24,999 | 41 (2.3%) | 60 (6.6%) |
| $25,000 to $34,999 | 109 (6.2%) | 121 (13.4%) |
| $35,000 to $49,999 | 231 (13.1%) | 112 (12.4%) |
| $50,000 to $74,999 | 366 (20.7%) | 48 (5.3%) |
| $75,000 to $99,999 | 305 (17.3%) | 127 (14.0%) |
| $100,000 to $149,999 | 183 (10.4%) | 73 (8.1%) |
| $150,000 or more | 308 (17.4%) | 36 (4.0%) |
| Total | 1,765 (100.0%) | 906 (100.0%) |
Monthly Housing Cost Tiers in Joshua Tree
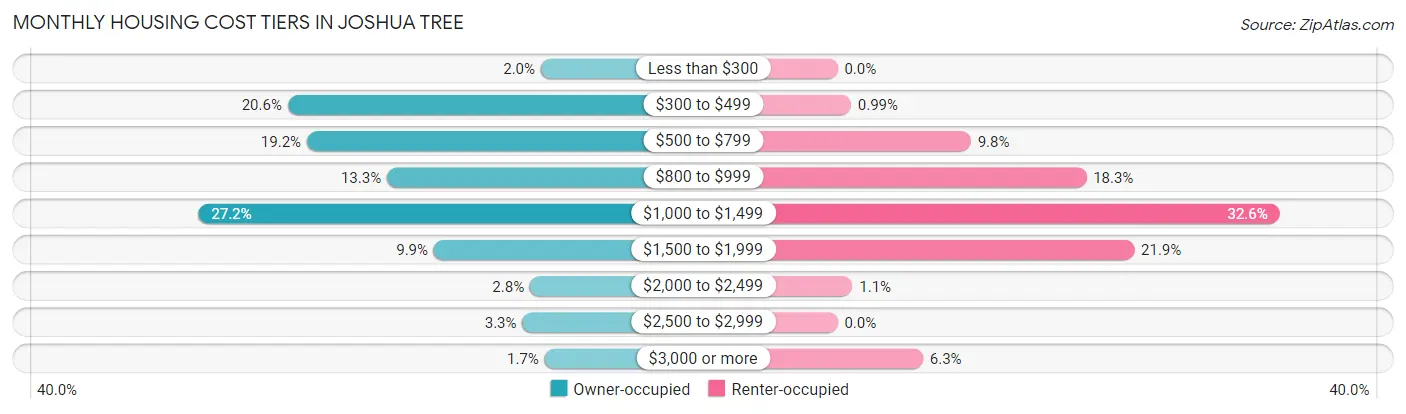
| Monthly Cost | Owner-occupied | Renter-occupied |
| Less than $300 | 35 (2.0%) | 0 (0.0%) |
| $300 to $499 | 364 (20.6%) | 9 (1.0%) |
| $500 to $799 | 339 (19.2%) | 89 (9.8%) |
| $800 to $999 | 235 (13.3%) | 166 (18.3%) |
| $1,000 to $1,499 | 480 (27.2%) | 295 (32.6%) |
| $1,500 to $1,999 | 174 (9.9%) | 198 (21.8%) |
| $2,000 to $2,499 | 49 (2.8%) | 10 (1.1%) |
| $2,500 to $2,999 | 59 (3.3%) | 0 (0.0%) |
| $3,000 or more | 30 (1.7%) | 57 (6.3%) |
| Total | 1,765 (100.0%) | 906 (100.0%) |
Physical Housing Characteristics in Joshua Tree
Housing Structures in Joshua Tree
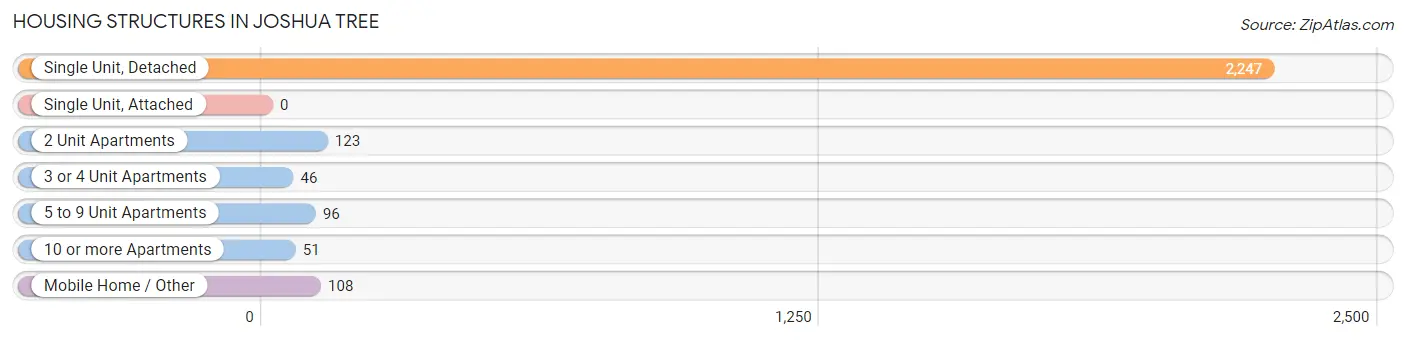
| Structure Type | # Housing Units | % Housing Units |
| Single Unit, Detached | 2,247 | 84.1% |
| Single Unit, Attached | 0 | 0.0% |
| 2 Unit Apartments | 123 | 4.6% |
| 3 or 4 Unit Apartments | 46 | 1.7% |
| 5 to 9 Unit Apartments | 96 | 3.6% |
| 10 or more Apartments | 51 | 1.9% |
| Mobile Home / Other | 108 | 4.0% |
| Total | 2,671 | 100.0% |
Housing Structures by Occupancy in Joshua Tree
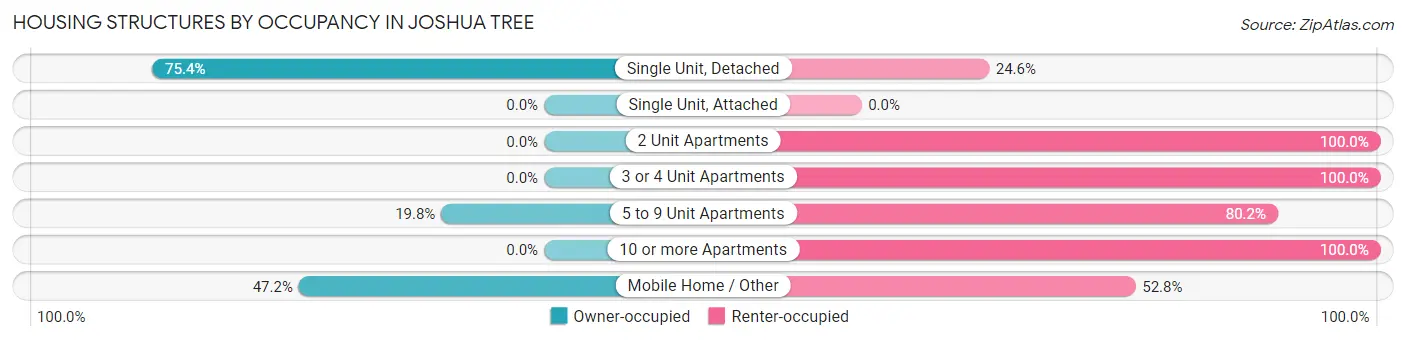
| Structure Type | Owner-occupied | Renter-occupied |
| Single Unit, Detached | 1,695 (75.4%) | 552 (24.6%) |
| Single Unit, Attached | 0 (0.0%) | 0 (0.0%) |
| 2 Unit Apartments | 0 (0.0%) | 123 (100.0%) |
| 3 or 4 Unit Apartments | 0 (0.0%) | 46 (100.0%) |
| 5 to 9 Unit Apartments | 19 (19.8%) | 77 (80.2%) |
| 10 or more Apartments | 0 (0.0%) | 51 (100.0%) |
| Mobile Home / Other | 51 (47.2%) | 57 (52.8%) |
| Total | 1,765 (66.1%) | 906 (33.9%) |
Housing Structures by Number of Rooms in Joshua Tree
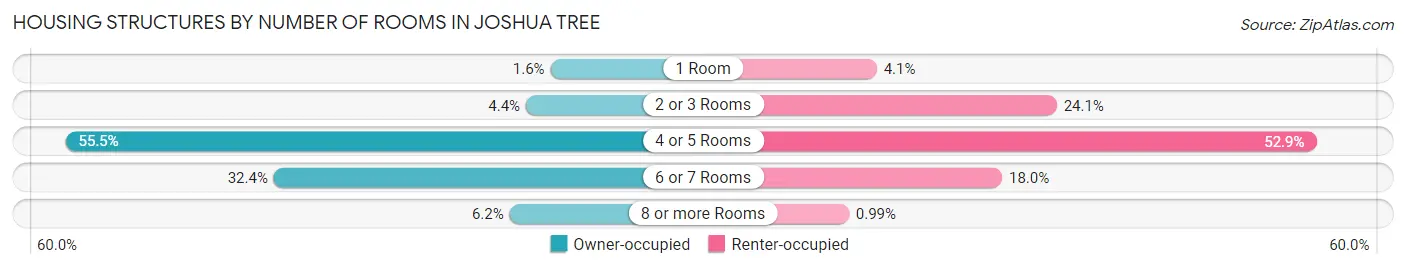
| Number of Rooms | Owner-occupied | Renter-occupied |
| 1 Room | 29 (1.6%) | 37 (4.1%) |
| 2 or 3 Rooms | 77 (4.4%) | 218 (24.1%) |
| 4 or 5 Rooms | 979 (55.5%) | 479 (52.9%) |
| 6 or 7 Rooms | 571 (32.4%) | 163 (18.0%) |
| 8 or more Rooms | 109 (6.2%) | 9 (1.0%) |
| Total | 1,765 (100.0%) | 906 (100.0%) |
Housing Structure by Heating Type in Joshua Tree
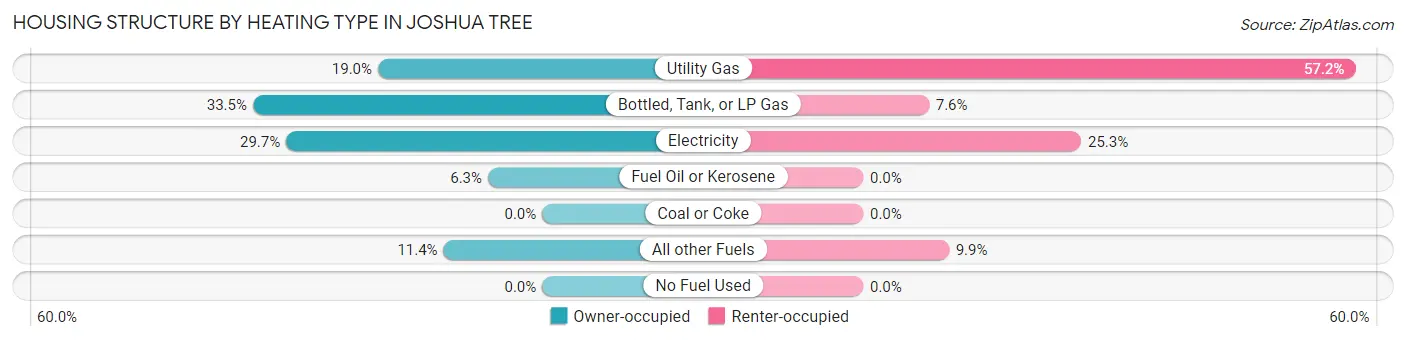
| Heating Type | Owner-occupied | Renter-occupied |
| Utility Gas | 336 (19.0%) | 518 (57.2%) |
| Bottled, Tank, or LP Gas | 592 (33.5%) | 69 (7.6%) |
| Electricity | 524 (29.7%) | 229 (25.3%) |
| Fuel Oil or Kerosene | 111 (6.3%) | 0 (0.0%) |
| Coal or Coke | 0 (0.0%) | 0 (0.0%) |
| All other Fuels | 202 (11.4%) | 90 (9.9%) |
| No Fuel Used | 0 (0.0%) | 0 (0.0%) |
| Total | 1,765 (100.0%) | 906 (100.0%) |
Household Vehicle Usage in Joshua Tree
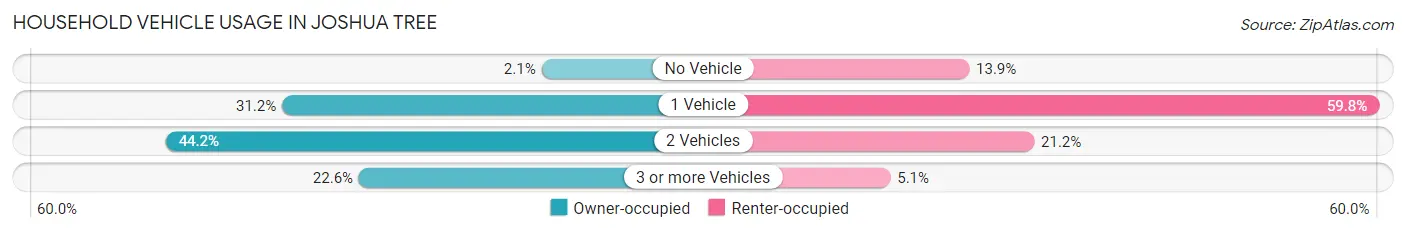
| Vehicles per Household | Owner-occupied | Renter-occupied |
| No Vehicle | 37 (2.1%) | 126 (13.9%) |
| 1 Vehicle | 550 (31.2%) | 542 (59.8%) |
| 2 Vehicles | 780 (44.2%) | 192 (21.2%) |
| 3 or more Vehicles | 398 (22.6%) | 46 (5.1%) |
| Total | 1,765 (100.0%) | 906 (100.0%) |
Real Estate & Mortgages in Joshua Tree
Real Estate and Mortgage Overview in Joshua Tree
| Characteristic | Without Mortgage | With Mortgage |
| Housing Units | 714 | 1,051 |
| Median Property Value | $277,600 | $239,300 |
| Median Household Income | $60,297 | $216 |
| Monthly Housing Costs | $468 | $30 |
| Real Estate Taxes | $1,883 | $0 |
Property Value by Mortgage Status in Joshua Tree
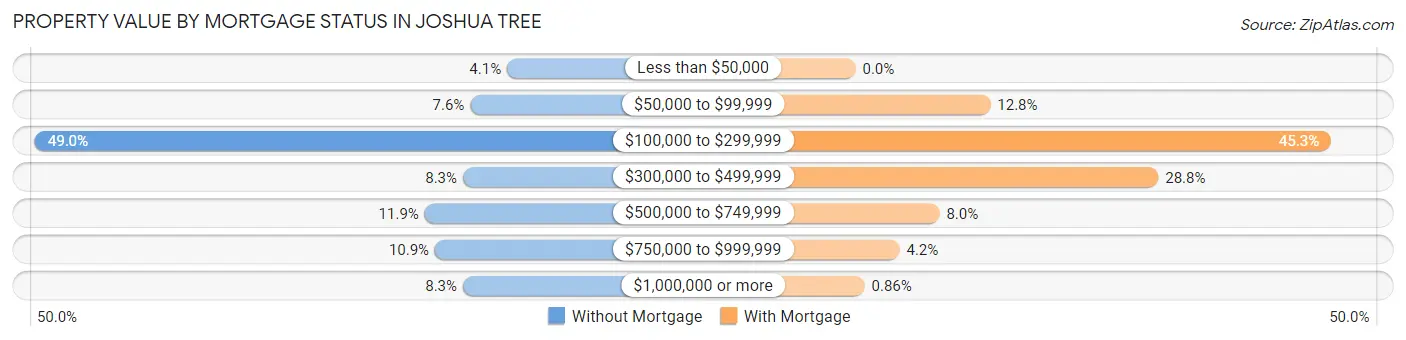
| Property Value | Without Mortgage | With Mortgage |
| Less than $50,000 | 29 (4.1%) | 0 (0.0%) |
| $50,000 to $99,999 | 54 (7.6%) | 135 (12.8%) |
| $100,000 to $299,999 | 350 (49.0%) | 476 (45.3%) |
| $300,000 to $499,999 | 59 (8.3%) | 303 (28.8%) |
| $500,000 to $749,999 | 85 (11.9%) | 84 (8.0%) |
| $750,000 to $999,999 | 78 (10.9%) | 44 (4.2%) |
| $1,000,000 or more | 59 (8.3%) | 9 (0.9%) |
| Total | 714 (100.0%) | 1,051 (100.0%) |
Household Income by Mortgage Status in Joshua Tree
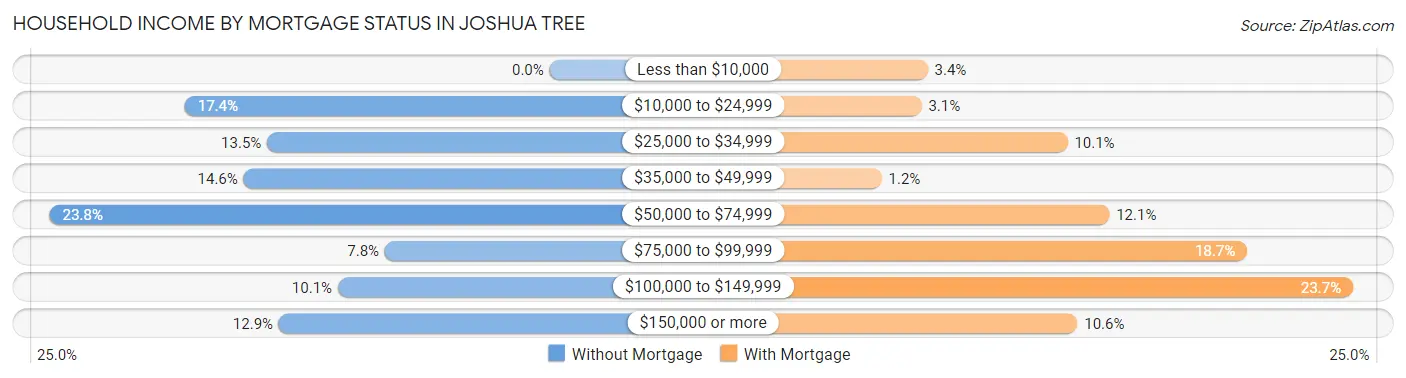
| Household Income | Without Mortgage | With Mortgage |
| Less than $10,000 | 0 (0.0%) | 36 (3.4%) |
| $10,000 to $24,999 | 124 (17.4%) | 33 (3.1%) |
| $25,000 to $34,999 | 96 (13.5%) | 106 (10.1%) |
| $35,000 to $49,999 | 104 (14.6%) | 13 (1.2%) |
| $50,000 to $74,999 | 170 (23.8%) | 127 (12.1%) |
| $75,000 to $99,999 | 56 (7.8%) | 196 (18.6%) |
| $100,000 to $149,999 | 72 (10.1%) | 249 (23.7%) |
| $150,000 or more | 92 (12.9%) | 111 (10.6%) |
| Total | 714 (100.0%) | 1,051 (100.0%) |
Property Value to Household Income Ratio in Joshua Tree
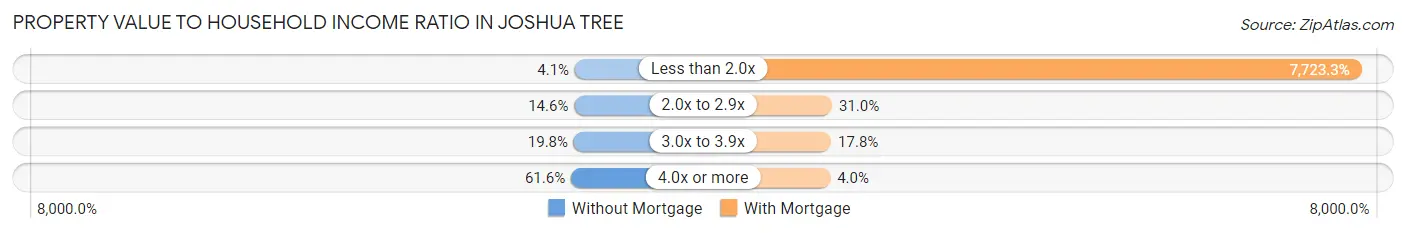
| Value-to-Income Ratio | Without Mortgage | With Mortgage |
| Less than 2.0x | 29 (4.1%) | 81,172 (7,723.3%) |
| 2.0x to 2.9x | 104 (14.6%) | 326 (31.0%) |
| 3.0x to 3.9x | 141 (19.8%) | 187 (17.8%) |
| 4.0x or more | 440 (61.6%) | 42 (4.0%) |
| Total | 714 (100.0%) | 1,051 (100.0%) |
Real Estate Taxes by Mortgage Status in Joshua Tree
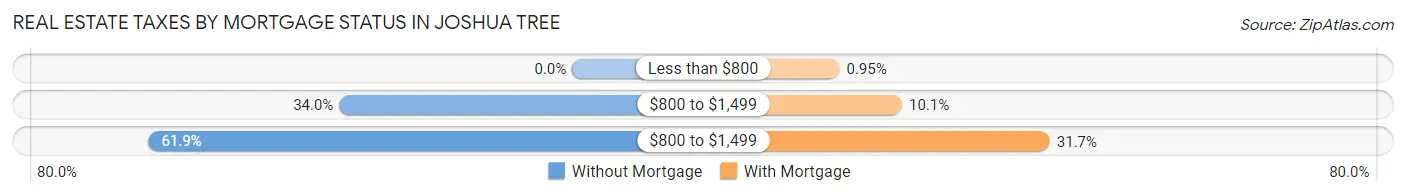
| Property Taxes | Without Mortgage | With Mortgage |
| Less than $800 | 0 (0.0%) | 10 (0.9%) |
| $800 to $1,499 | 243 (34.0%) | 106 (10.1%) |
| $800 to $1,499 | 442 (61.9%) | 333 (31.7%) |
| Total | 714 (100.0%) | 1,051 (100.0%) |
Health & Disability in Joshua Tree
Health Insurance Coverage by Age in Joshua Tree
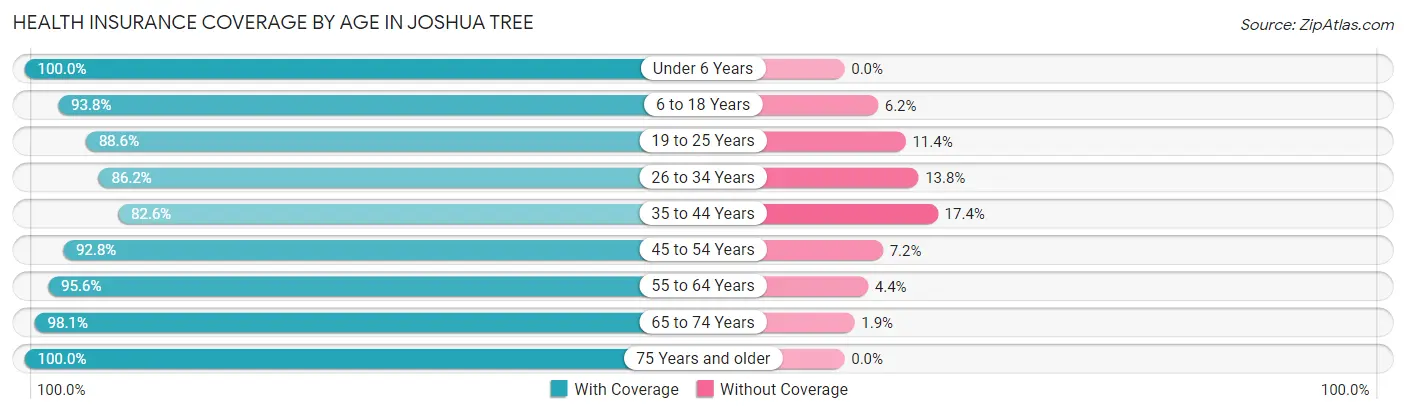
| Age Bracket | With Coverage | Without Coverage |
| Under 6 Years | 465 (100.0%) | 0 (0.0%) |
| 6 to 18 Years | 887 (93.8%) | 59 (6.2%) |
| 19 to 25 Years | 466 (88.6%) | 60 (11.4%) |
| 26 to 34 Years | 851 (86.2%) | 136 (13.8%) |
| 35 to 44 Years | 593 (82.6%) | 125 (17.4%) |
| 45 to 54 Years | 635 (92.8%) | 49 (7.2%) |
| 55 to 64 Years | 871 (95.6%) | 40 (4.4%) |
| 65 to 74 Years | 839 (98.1%) | 16 (1.9%) |
| 75 Years and older | 453 (100.0%) | 0 (0.0%) |
| Total | 6,060 (92.6%) | 485 (7.4%) |
Health Insurance Coverage by Citizenship Status in Joshua Tree
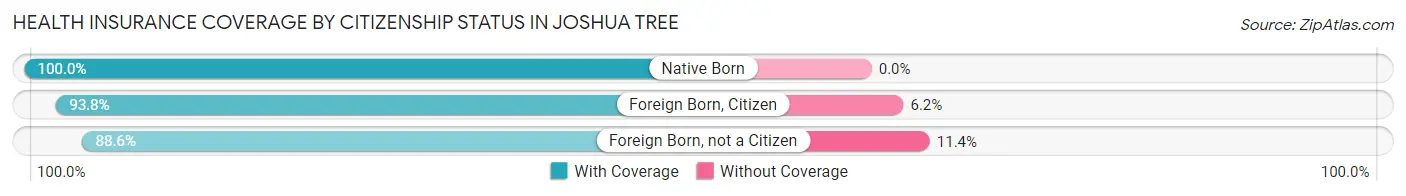
| Citizenship Status | With Coverage | Without Coverage |
| Native Born | 465 (100.0%) | 0 (0.0%) |
| Foreign Born, Citizen | 887 (93.8%) | 59 (6.2%) |
| Foreign Born, not a Citizen | 466 (88.6%) | 60 (11.4%) |
Health Insurance Coverage by Household Income in Joshua Tree
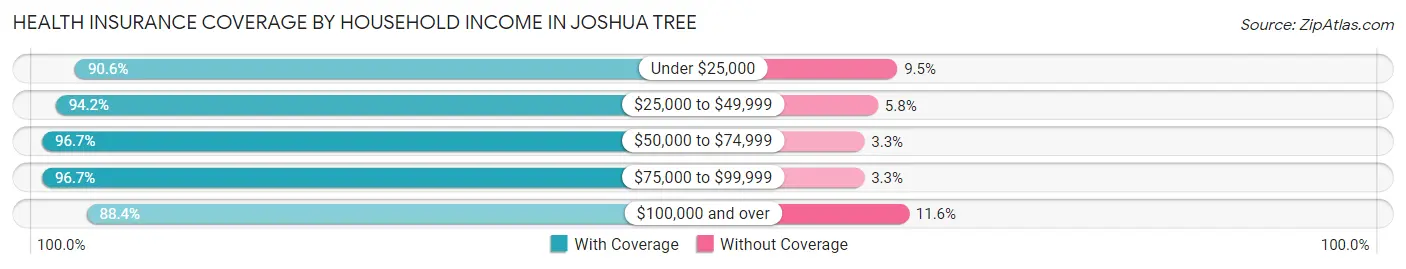
| Household Income | With Coverage | Without Coverage |
| Under $25,000 | 1,102 (90.5%) | 115 (9.5%) |
| $25,000 to $49,999 | 1,114 (94.2%) | 69 (5.8%) |
| $50,000 to $74,999 | 1,028 (96.7%) | 35 (3.3%) |
| $75,000 to $99,999 | 1,010 (96.7%) | 34 (3.3%) |
| $100,000 and over | 1,763 (88.4%) | 232 (11.6%) |
Public vs Private Health Insurance Coverage by Age in Joshua Tree
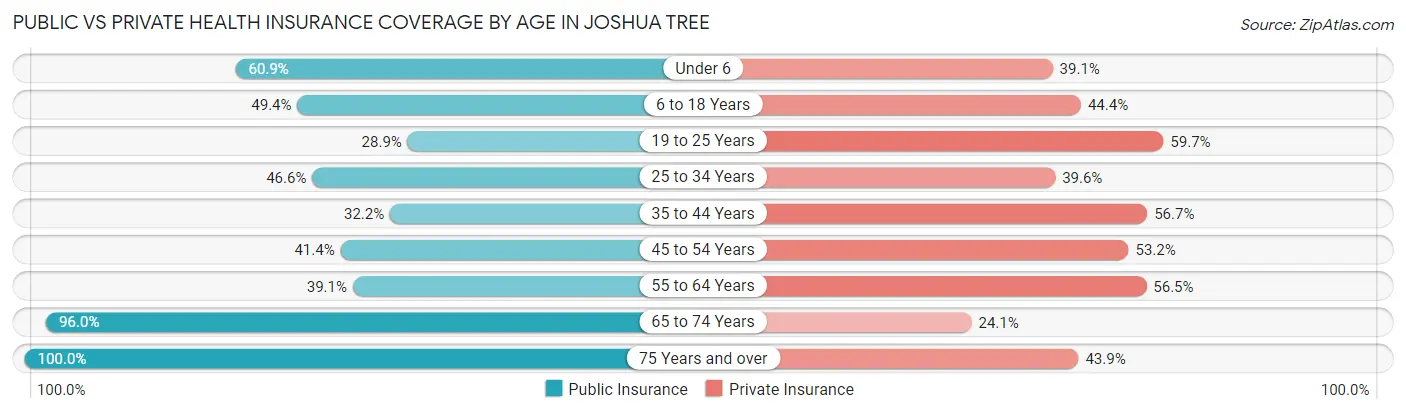
| Age Bracket | Public Insurance | Private Insurance |
| Under 6 | 283 (60.9%) | 182 (39.1%) |
| 6 to 18 Years | 467 (49.4%) | 420 (44.4%) |
| 19 to 25 Years | 152 (28.9%) | 314 (59.7%) |
| 25 to 34 Years | 460 (46.6%) | 391 (39.6%) |
| 35 to 44 Years | 231 (32.2%) | 407 (56.7%) |
| 45 to 54 Years | 283 (41.4%) | 364 (53.2%) |
| 55 to 64 Years | 356 (39.1%) | 515 (56.5%) |
| 65 to 74 Years | 821 (96.0%) | 206 (24.1%) |
| 75 Years and over | 453 (100.0%) | 199 (43.9%) |
| Total | 3,506 (53.6%) | 2,998 (45.8%) |
Disability Status by Sex by Age in Joshua Tree
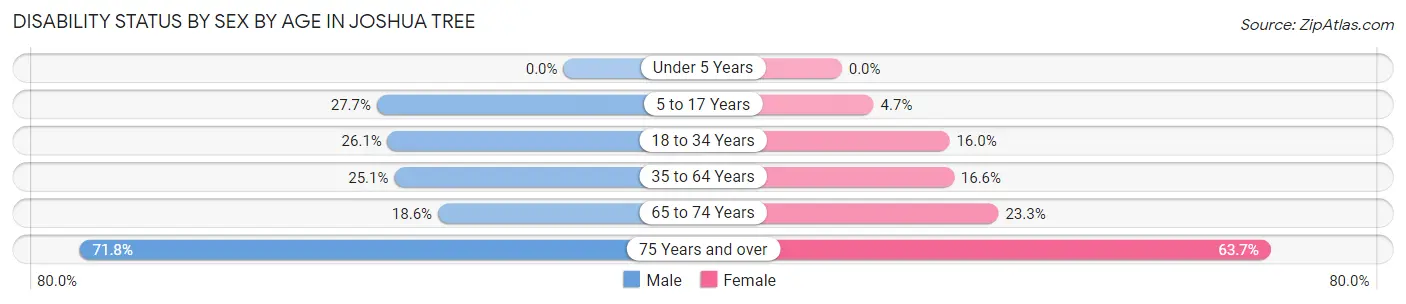
| Age Bracket | Male | Female |
| Under 5 Years | 0 (0.0%) | 0 (0.0%) |
| 5 to 17 Years | 82 (27.7%) | 30 (4.7%) |
| 18 to 34 Years | 216 (26.1%) | 123 (16.0%) |
| 35 to 64 Years | 279 (25.1%) | 200 (16.6%) |
| 65 to 74 Years | 76 (18.6%) | 104 (23.3%) |
| 75 Years and over | 102 (71.8%) | 198 (63.7%) |
Disability Class by Sex by Age in Joshua Tree
Disability Class: Hearing Difficulty
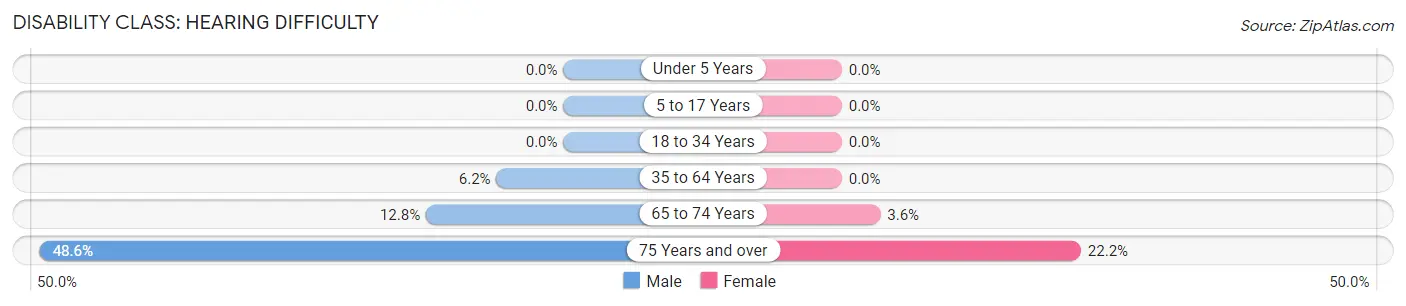
| Age Bracket | Male | Female |
| Under 5 Years | 0 (0.0%) | 0 (0.0%) |
| 5 to 17 Years | 0 (0.0%) | 0 (0.0%) |
| 18 to 34 Years | 0 (0.0%) | 0 (0.0%) |
| 35 to 64 Years | 69 (6.2%) | 0 (0.0%) |
| 65 to 74 Years | 52 (12.8%) | 16 (3.6%) |
| 75 Years and over | 69 (48.6%) | 69 (22.2%) |
Disability Class: Vision Difficulty
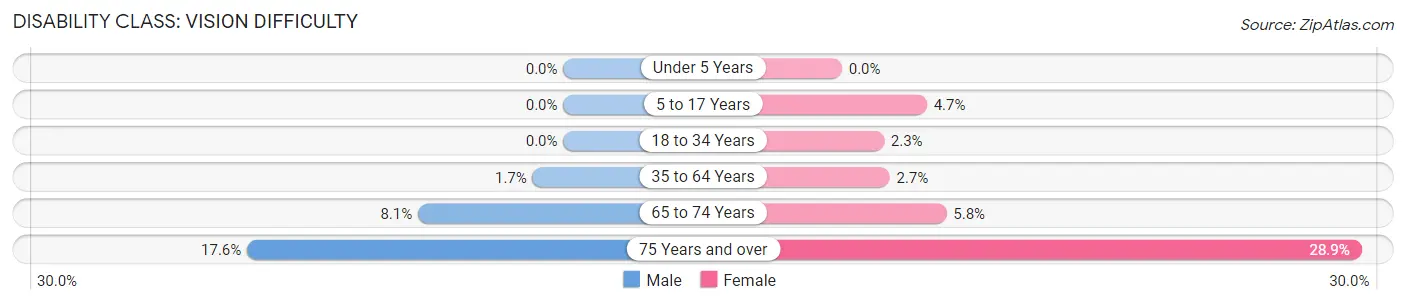
| Age Bracket | Male | Female |
| Under 5 Years | 0 (0.0%) | 0 (0.0%) |
| 5 to 17 Years | 0 (0.0%) | 30 (4.7%) |
| 18 to 34 Years | 0 (0.0%) | 18 (2.3%) |
| 35 to 64 Years | 19 (1.7%) | 32 (2.7%) |
| 65 to 74 Years | 33 (8.1%) | 26 (5.8%) |
| 75 Years and over | 25 (17.6%) | 90 (28.9%) |
Disability Class: Cognitive Difficulty
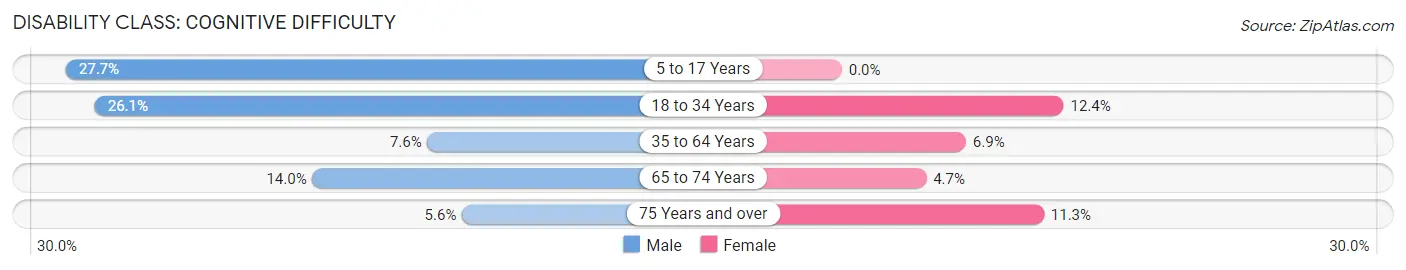
| Age Bracket | Male | Female |
| 5 to 17 Years | 82 (27.7%) | 0 (0.0%) |
| 18 to 34 Years | 216 (26.1%) | 95 (12.3%) |
| 35 to 64 Years | 84 (7.6%) | 83 (6.9%) |
| 65 to 74 Years | 57 (14.0%) | 21 (4.7%) |
| 75 Years and over | 8 (5.6%) | 35 (11.3%) |
Disability Class: Ambulatory Difficulty
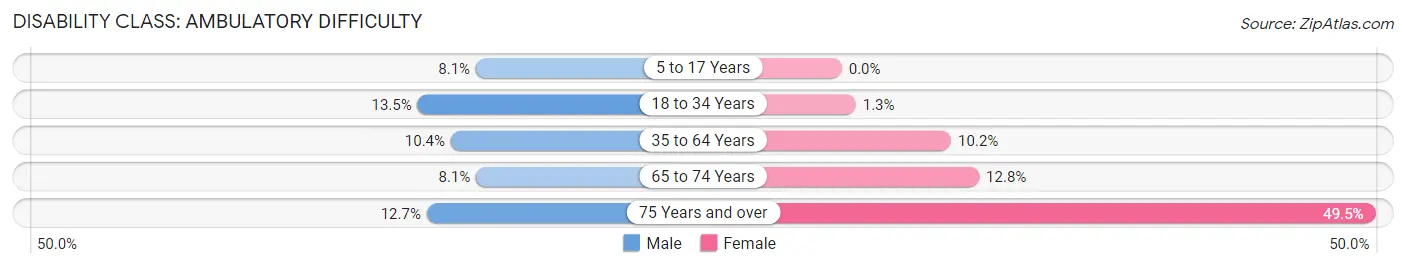
| Age Bracket | Male | Female |
| 5 to 17 Years | 24 (8.1%) | 0 (0.0%) |
| 18 to 34 Years | 112 (13.5%) | 10 (1.3%) |
| 35 to 64 Years | 116 (10.4%) | 122 (10.2%) |
| 65 to 74 Years | 33 (8.1%) | 57 (12.8%) |
| 75 Years and over | 18 (12.7%) | 154 (49.5%) |
Disability Class: Self-Care Difficulty
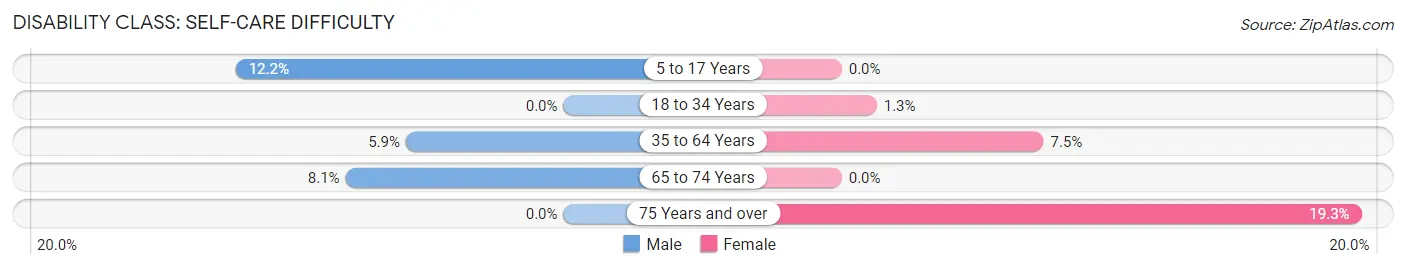
| Age Bracket | Male | Female |
| 5 to 17 Years | 36 (12.2%) | 0 (0.0%) |
| 18 to 34 Years | 0 (0.0%) | 10 (1.3%) |
| 35 to 64 Years | 65 (5.9%) | 90 (7.5%) |
| 65 to 74 Years | 33 (8.1%) | 0 (0.0%) |
| 75 Years and over | 0 (0.0%) | 60 (19.3%) |
Technology Access in Joshua Tree
Computing Device Access in Joshua Tree
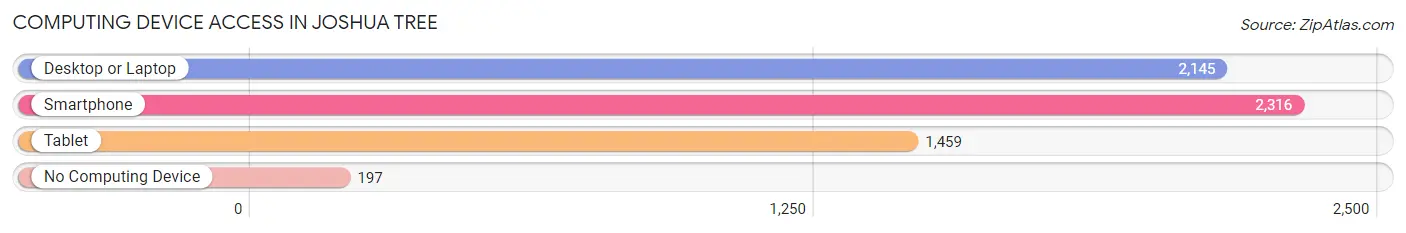
| Device Type | # Households | % Households |
| Desktop or Laptop | 2,145 | 80.3% |
| Smartphone | 2,316 | 86.7% |
| Tablet | 1,459 | 54.6% |
| No Computing Device | 197 | 7.4% |
| Total | 2,671 | 100.0% |
Internet Access in Joshua Tree
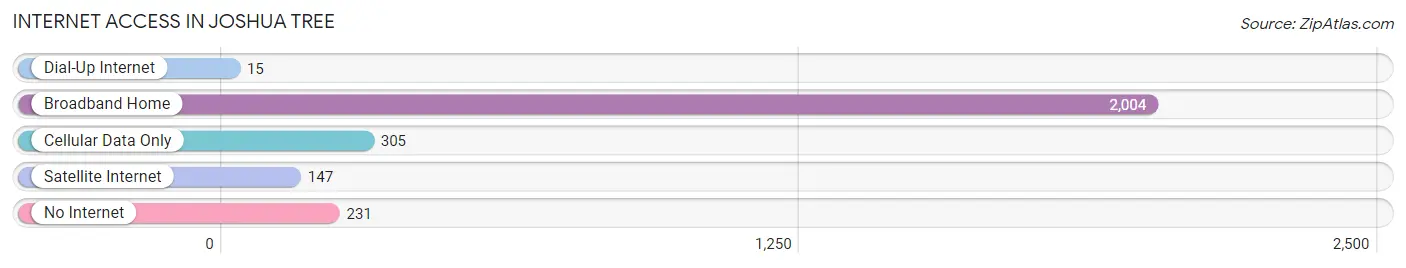
| Internet Type | # Households | % Households |
| Dial-Up Internet | 15 | 0.6% |
| Broadband Home | 2,004 | 75.0% |
| Cellular Data Only | 305 | 11.4% |
| Satellite Internet | 147 | 5.5% |
| No Internet | 231 | 8.6% |
| Total | 2,671 | 100.0% |
Joshua Tree Summary
Introduction
Joshua Tree is a small desert town located in the Mojave Desert of Southern California. It is located in San Bernardino County, about 60 miles east of Los Angeles. The town is known for its unique desert landscape, which is home to the Joshua Tree National Park. The town has a population of about 7,500 people and is a popular tourist destination.
History
The area around Joshua Tree has been inhabited for thousands of years by Native American tribes, including the Serrano, Cahuilla, and Chemehuevi. The first Europeans to explore the area were Spanish missionaries in the late 1700s. The area was later settled by Mormon pioneers in the late 1800s. The town of Joshua Tree was founded in the early 1900s and was named after the Joshua trees that are native to the area.
Geography
Joshua Tree is located in the Mojave Desert of Southern California. It is located in San Bernardino County, about 60 miles east of Los Angeles. The town is situated at an elevation of 2,800 feet and is surrounded by the Joshua Tree National Park. The town is located in a high desert climate, with hot summers and mild winters.
Economy
The economy of Joshua Tree is largely based on tourism. The town is a popular destination for outdoor enthusiasts, who come to explore the Joshua Tree National Park. The town also has a thriving arts and music scene, which attracts visitors from all over the world. Additionally, the town is home to several small businesses, including restaurants, shops, and galleries.
Demographics
As of the 2010 census, the population of Joshua Tree was 7,414. The racial makeup of the town was 79.3% White, 0.7% African American, 0.7% Native American, 0.7% Asian, 0.2% Pacific Islander, and 17.3% from other races. The median household income was $37,813, and the median family income was $45,938.
Conclusion
Joshua Tree is a small desert town located in the Mojave Desert of Southern California. It is known for its unique desert landscape, which is home to the Joshua Tree National Park. The town has a population of about 7,500 people and is a popular tourist destination. The economy of Joshua Tree is largely based on tourism, and the town is home to several small businesses. The racial makeup of the town is 79.3% White, 0.7% African American, 0.7% Native American, 0.7% Asian, 0.2% Pacific Islander, and 17.3% from other races.
Common Questions
What is Per Capita Income in Joshua Tree?
Per Capita income in Joshua Tree is $31,173.
What is the Median Family Income in Joshua Tree?
Median Family Income in Joshua Tree is $72,321.
What is the Median Household income in Joshua Tree?
Median Household Income in Joshua Tree is $54,678.
What is Income or Wage Gap in Joshua Tree?
Income or Wage Gap in Joshua Tree is 39.8%.
Women in Joshua Tree earn 60.2 cents for every dollar earned by a man.
What is Family Income Deficit in Joshua Tree?
Family Income Deficit in Joshua Tree is $12,312.
Families that are below poverty line in Joshua Tree earn $12,312 less on average than the poverty threshold level.
What is Inequality or Gini Index in Joshua Tree?
Inequality or Gini Index in Joshua Tree is 0.45.
What is the Total Population of Joshua Tree?
Total Population of Joshua Tree is 6,751.
What is the Total Male Population of Joshua Tree?
Total Male Population of Joshua Tree is 3,042.
What is the Total Female Population of Joshua Tree?
Total Female Population of Joshua Tree is 3,709.
What is the Ratio of Males per 100 Females in Joshua Tree?
There are 82.02 Males per 100 Females in Joshua Tree.
What is the Ratio of Females per 100 Males in Joshua Tree?
There are 121.93 Females per 100 Males in Joshua Tree.
What is the Median Population Age in Joshua Tree?
Median Population Age in Joshua Tree is 39.9 Years.
What is the Average Family Size in Joshua Tree
Average Family Size in Joshua Tree is 3.2 People.
What is the Average Household Size in Joshua Tree
Average Household Size in Joshua Tree is 2.5 People.
How Large is the Labor Force in Joshua Tree?
There are 2,929 People in the Labor Forcein in Joshua Tree.
What is the Percentage of People in the Labor Force in Joshua Tree?
53.3% of People are in the Labor Force in Joshua Tree.
What is the Unemployment Rate in Joshua Tree?
Unemployment Rate in Joshua Tree is 10.9%.