Cities with the Highest Percentage of Immigrants from Caribbean in Missouri
RELATED REPORTS & OPTIONS
Caribbean
Missouri
Compare Cities
Map of Cities with the Highest Percentage of Immigrants from Caribbean in Missouri
0.00%
20.00%
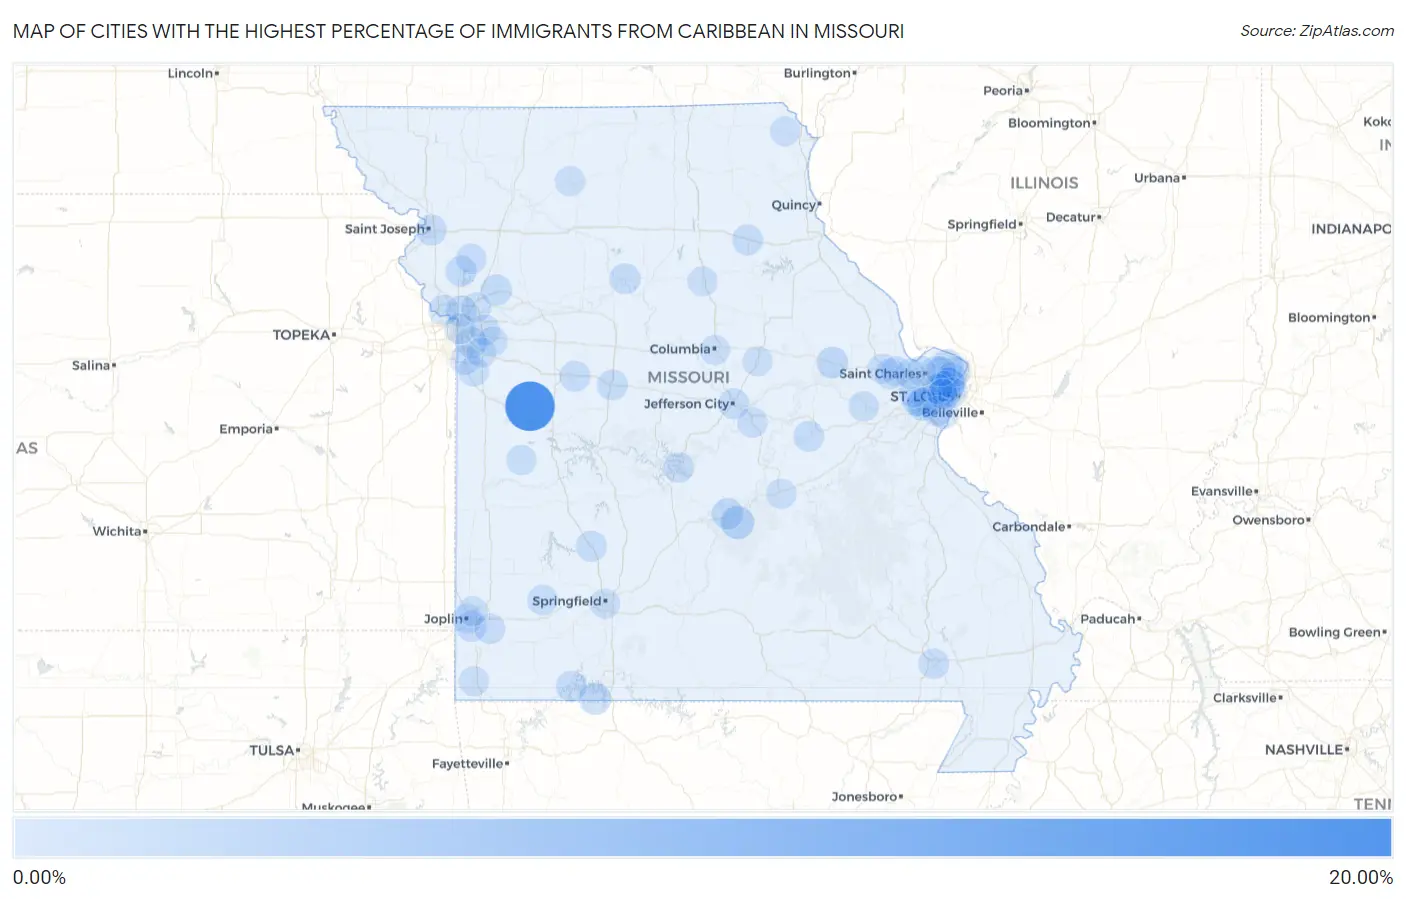
Cities with the Highest Percentage of Immigrants from Caribbean in Missouri
| City | Caribbean | vs State | vs National | |
| 1. | Blairstown | 16.95% | 0.14%(+16.8)#-1 | 1.37%(+15.6)#0 |
| 2. | Northwoods | 3.57% | 0.14%(+3.43)#0 | 1.37%(+2.20)#1 |
| 3. | Fort Leonard Wood | 2.57% | 0.14%(+2.44)#1 | 1.37%(+1.20)#2 |
| 4. | Blue Eye | 1.54% | 0.14%(+1.41)#2 | 1.37%(+0.170)#3 |
| 5. | Twin Oaks | 1.29% | 0.14%(+1.16)#3 | 1.37%(-0.080)#4 |
| 6. | Jonesburg | 1.29% | 0.14%(+1.15)#4 | 1.37%(-0.085)#5 |
| 7. | Old Jamestown | 1.24% | 0.14%(+1.10)#5 | 1.37%(-0.131)#6 |
| 8. | Waynesville | 1.06% | 0.14%(+0.925)#6 | 1.37%(-0.311)#7 |
| 9. | Excelsior Springs | 0.92% | 0.14%(+0.783)#7 | 1.37%(-0.453)#8 |
| 10. | Raytown | 0.85% | 0.14%(+0.710)#8 | 1.37%(-0.526)#9 |
| 11. | Trimble | 0.83% | 0.14%(+0.692)#9 | 1.37%(-0.545)#10 |
| 12. | Gladstone | 0.78% | 0.14%(+0.639)#10 | 1.37%(-0.597)#11 |
| 13. | University City | 0.73% | 0.14%(+0.595)#11 | 1.37%(-0.641)#885 |
| 14. | St Joseph | 0.67% | 0.14%(+0.537)#34 | 1.37%(-0.699)#2,350 |
| 15. | Saginaw | 0.66% | 0.14%(+0.519)#35 | 1.37%(-0.717)#2,351 |
| 16. | Shell Knob | 0.64% | 0.14%(+0.500)#36 | 1.37%(-0.736)#2,352 |
| 17. | Sedalia | 0.62% | 0.14%(+0.479)#37 | 1.37%(-0.757)#2,353 |
| 18. | Brunswick | 0.58% | 0.14%(+0.448)#38 | 1.37%(-0.788)#2,354 |
| 19. | Bolivar | 0.58% | 0.14%(+0.439)#39 | 1.37%(-0.797)#2,355 |
| 20. | Knob Noster | 0.57% | 0.14%(+0.437)#40 | 1.37%(-0.800)#2,356 |
| 21. | Shelbina | 0.55% | 0.14%(+0.418)#41 | 1.37%(-0.818)#2,357 |
| 22. | Kansas City | 0.55% | 0.14%(+0.410)#42 | 1.37%(-0.826)#2,358 |
| 23. | Owensville | 0.50% | 0.14%(+0.364)#43 | 1.37%(-0.872)#2,359 |
| 24. | Jefferson City | 0.47% | 0.14%(+0.335)#44 | 1.37%(-0.901)#2,360 |
| 25. | Parkville | 0.42% | 0.14%(+0.281)#45 | 1.37%(-0.955)#2,361 |
| 26. | Miller | 0.41% | 0.14%(+0.276)#46 | 1.37%(-0.960)#2,362 |
| 27. | Hazelwood | 0.39% | 0.14%(+0.258)#47 | 1.37%(-0.978)#2,363 |
| 28. | Lake St Louis | 0.37% | 0.14%(+0.238)#48 | 1.37%(-0.998)#2,364 |
| 29. | Richmond Heights | 0.33% | 0.14%(+0.190)#49 | 1.37%(-1.05)#2,365 |
| 30. | Poplar Bluff | 0.31% | 0.14%(+0.176)#50 | 1.37%(-1.06)#2,366 |
| 31. | Plattsburg | 0.31% | 0.14%(+0.170)#51 | 1.37%(-1.07)#2,367 |
| 32. | Diamond | 0.31% | 0.14%(+0.169)#52 | 1.37%(-1.07)#2,368 |
| 33. | Independence | 0.30% | 0.14%(+0.165)#53 | 1.37%(-1.07)#2,375 |
| 34. | Castle Point | 0.27% | 0.14%(+0.136)#54 | 1.37%(-1.10)#2,376 |
| 35. | Mehlville | 0.27% | 0.14%(+0.135)#55 | 1.37%(-1.10)#2,377 |
| 36. | Vinita Park | 0.27% | 0.14%(+0.133)#56 | 1.37%(-1.10)#2,378 |
| 37. | Jennings | 0.25% | 0.14%(+0.118)#57 | 1.37%(-1.12)#2,379 |
| 38. | Greendale | 0.24% | 0.14%(+0.104)#58 | 1.37%(-1.13)#2,380 |
| 39. | Westphalia | 0.22% | 0.14%(+0.080)#59 | 1.37%(-1.16)#2,381 |
| 40. | Spanish Lake | 0.19% | 0.14%(+0.052)#60 | 1.37%(-1.18)#2,382 |
| 41. | Osage Beach | 0.17% | 0.14%(+0.033)#61 | 1.37%(-1.20)#2,383 |
| 42. | St Louis | 0.17% | 0.14%(+0.029)#62 | 1.37%(-1.21)#2,384 |
| 43. | Des Peres | 0.16% | 0.14%(+0.028)#63 | 1.37%(-1.21)#2,385 |
| 44. | Appleton City | 0.15% | 0.14%(+0.014)#64 | 1.37%(-1.22)#2,386 |
| 45. | Washington | 0.14% | 0.14%(+0.006)#65 | 1.37%(-1.23)#2,387 |
| 46. | Raymore | 0.14% | 0.14%(+0.006)#66 | 1.37%(-1.23)#2,388 |
| 47. | Manchester | 0.14% | 0.14%(+0.001)#67 | 1.37%(-1.24)#2,389 |
| 48. | Joplin | 0.14% | 0.14%(+0.001)#68 | 1.37%(-1.24)#2,390 |
| 49. | Olivette | 0.13% | 0.14%(-0.006)#69 | 1.37%(-1.24)#2,391 |
| 50. | Ballwin | 0.13% | 0.14%(-0.007)#70 | 1.37%(-1.24)#2,392 |
| 51. | O Fallon | 0.12% | 0.14%(-0.017)#71 | 1.37%(-1.25)#2,393 |
| 52. | Anderson | 0.12% | 0.14%(-0.019)#72 | 1.37%(-1.26)#2,394 |
| 53. | Trenton | 0.11% | 0.14%(-0.028)#73 | 1.37%(-1.26)#2,395 |
| 54. | Springfield | 0.10% | 0.14%(-0.033)#74 | 1.37%(-1.27)#2,396 |
| 55. | Grandview | 0.10% | 0.14%(-0.036)#75 | 1.37%(-1.27)#2,397 |
| 56. | Webb City | 0.100% | 0.14%(-0.036)#76 | 1.37%(-1.27)#2,398 |
| 57. | Columbia | 0.088% | 0.14%(-0.048)#77 | 1.37%(-1.28)#2,399 |
| 58. | Wentzville | 0.085% | 0.14%(-0.051)#78 | 1.37%(-1.29)#2,400 |
| 59. | Chesterfield | 0.085% | 0.14%(-0.052)#79 | 1.37%(-1.29)#2,401 |
| 60. | Rolla | 0.065% | 0.14%(-0.071)#80 | 1.37%(-1.31)#2,402 |
| 61. | Blue Springs | 0.058% | 0.14%(-0.078)#81 | 1.37%(-1.31)#2,403 |
| 62. | Moberly | 0.051% | 0.14%(-0.085)#82 | 1.37%(-1.32)#2,404 |
| 63. | Lee S Summit | 0.050% | 0.14%(-0.086)#83 | 1.37%(-1.32)#2,405 |
| 64. | Liberty | 0.050% | 0.14%(-0.087)#84 | 1.37%(-1.32)#2,406 |
| 65. | Kahoka | 0.047% | 0.14%(-0.089)#85 | 1.37%(-1.33)#2,407 |
| 66. | Sappington | 0.043% | 0.14%(-0.094)#86 | 1.37%(-1.33)#2,408 |
| 67. | St Peters | 0.036% | 0.14%(-0.100)#87 | 1.37%(-1.34)#2,409 |
| 68. | Florissant | 0.019% | 0.14%(-0.117)#88 | 1.37%(-1.35)#2,410 |
| 69. | St Charles | 0.017% | 0.14%(-0.119)#89 | 1.37%(-1.36)#2,411 |
| 70. | Fulton | 0.0079% | 0.14%(-0.128)#90 | 1.37%(-1.36)#2,412 |
| 71. | Clayton | 0.0058% | 0.14%(-0.130)#91 | 1.37%(-1.37)#2,413 |
Common Questions
What are the Top 10 Cities with the Highest Percentage of Immigrants from Caribbean in Missouri?
Top 10 Cities with the Highest Percentage of Immigrants from Caribbean in Missouri are:
#1
16.95%
#2
3.57%
#3
2.57%
#4
1.54%
#5
1.29%
#6
1.29%
#7
1.24%
#8
1.06%
#9
0.92%
#10
0.85%
What city has the Highest Percentage of Immigrants from Caribbean in Missouri?
Blairstown has the Highest Percentage of Immigrants from Caribbean in Missouri with 16.95%.
What is the Percentage of Immigrants from Caribbean in the State of Missouri?
Percentage of Immigrants from Caribbean in Missouri is 0.14%.
What is the Percentage of Immigrants from Caribbean in the United States?
Percentage of Immigrants from Caribbean in the United States is 1.37%.