Cities with the Highest Poverty Level Among Children Under the Age of 16 in Colorado
RELATED REPORTS & OPTIONS
Highest Poverty | Child 0-16
Colorado
Compare Cities
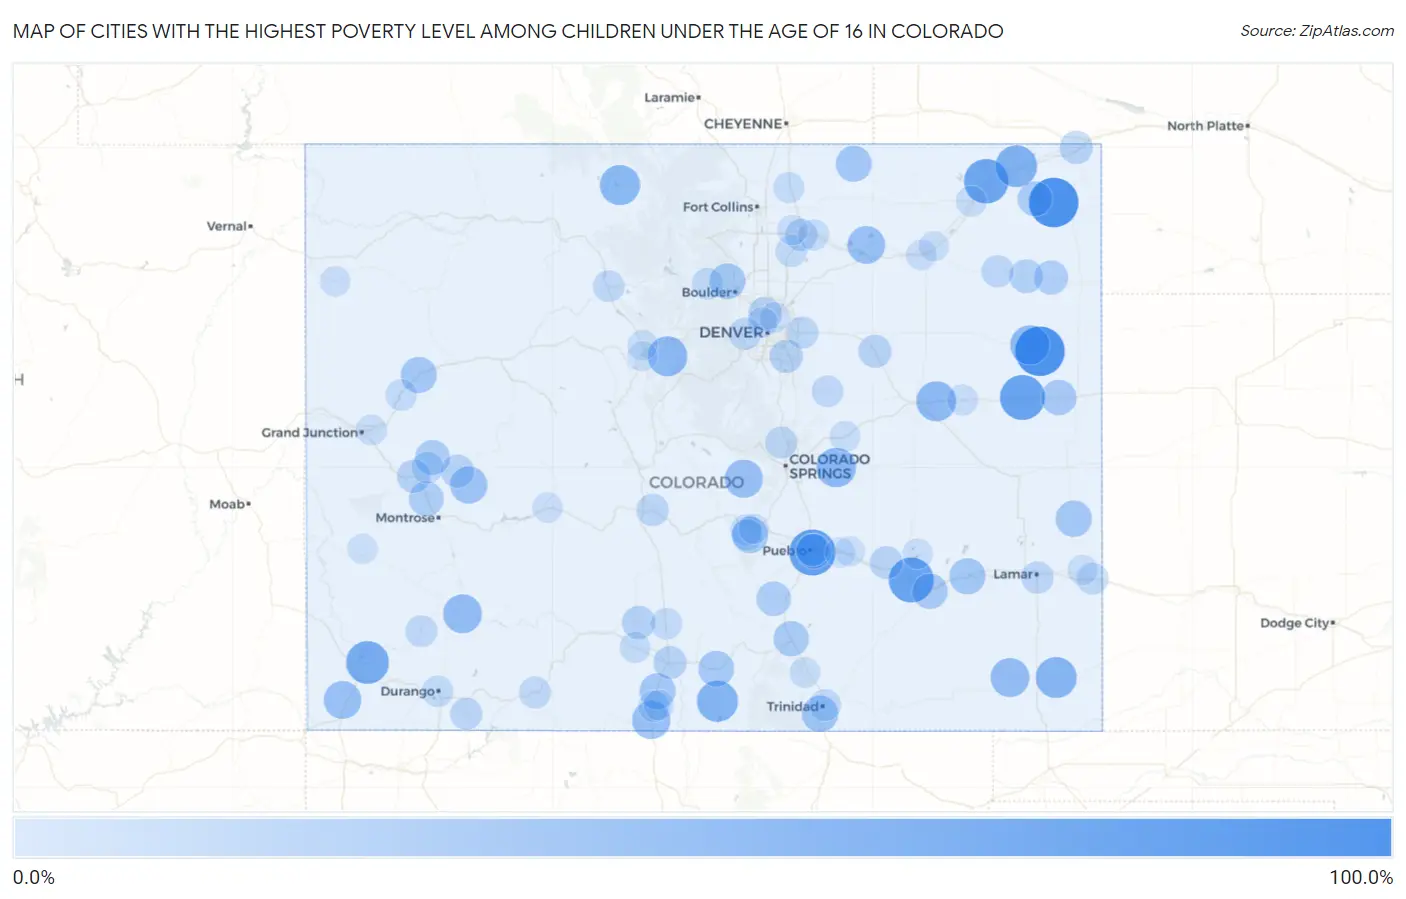
Map of Cities with the Highest Poverty Level Among Children Under the Age of 16 in Colorado
0.0%
100.0%
Cities with the Highest Poverty Level Among Children Under the Age of 16 in Colorado
| City | Child Poverty | vs State | vs National | |
| 1. | Lazear | 100.0% | 11.4%(+88.6)#1 | 16.9%(+83.1)#282 |
| 2. | Kirk | 100.0% | 11.4%(+88.6)#2 | 16.9%(+83.1)#384 |
| 3. | Paoli | 100.0% | 11.4%(+88.6)#3 | 16.9%(+83.1)#405 |
| 4. | Salt Creek | 85.3% | 11.4%(+74.0)#4 | 16.9%(+68.4)#700 |
| 5. | Rocky Ford | 80.8% | 11.4%(+69.4)#5 | 16.9%(+63.9)#815 |
| 6. | Vona | 80.8% | 11.4%(+69.4)#6 | 16.9%(+63.8)#817 |
| 7. | Iliff | 78.2% | 11.4%(+66.8)#7 | 16.9%(+61.2)#895 |
| 8. | Dolores | 71.2% | 11.4%(+59.9)#8 | 16.9%(+54.3)#1,188 |
| 9. | Crook | 66.7% | 11.4%(+55.3)#9 | 16.9%(+49.7)#1,403 |
| 10. | San Luis | 64.3% | 11.4%(+52.9)#10 | 16.9%(+47.3)#1,550 |
| 11. | Vilas | 63.0% | 11.4%(+51.6)#11 | 16.9%(+46.0)#1,637 |
| 12. | Walden | 60.0% | 11.4%(+48.6)#12 | 16.9%(+43.1)#1,843 |
| 13. | Genoa | 58.8% | 11.4%(+47.5)#13 | 16.9%(+41.9)#1,952 |
| 14. | Montezuma | 58.3% | 11.4%(+47.0)#14 | 16.9%(+41.4)#1,993 |
| 15. | Ellicott | 57.6% | 11.4%(+46.3)#15 | 16.9%(+40.7)#2,046 |
| 16. | Joes | 57.1% | 11.4%(+45.8)#16 | 16.9%(+40.2)#2,096 |
| 17. | Pritchett | 54.5% | 11.4%(+43.2)#17 | 16.9%(+37.6)#2,316 |
| 18. | Silverton | 54.3% | 11.4%(+42.9)#18 | 16.9%(+37.3)#2,346 |
| 19. | Antonito | 52.1% | 11.4%(+40.7)#19 | 16.9%(+35.1)#2,545 |
| 20. | Cripple Creek | 51.5% | 11.4%(+40.2)#20 | 16.9%(+34.6)#2,605 |
| 21. | Orchard | 50.0% | 11.4%(+38.6)#21 | 16.9%(+33.1)#2,814 |
| 22. | Towaoc | 49.7% | 11.4%(+38.3)#22 | 16.9%(+32.8)#2,848 |
| 23. | Crawford | 48.0% | 11.4%(+36.6)#23 | 16.9%(+31.1)#3,017 |
| 24. | Starkville | 44.4% | 11.4%(+33.1)#24 | 16.9%(+27.5)#3,561 |
| 25. | Sheridan Lake | 44.0% | 11.4%(+32.6)#25 | 16.9%(+27.1)#3,619 |
| 26. | Coal Creek | 43.8% | 11.4%(+32.5)#26 | 16.9%(+26.9)#3,634 |
| 27. | La Jara | 43.3% | 11.4%(+31.9)#27 | 16.9%(+26.3)#3,724 |
| 28. | Parachute | 43.2% | 11.4%(+31.9)#28 | 16.9%(+26.3)#3,735 |
| 29. | Las Animas | 43.0% | 11.4%(+31.6)#29 | 16.9%(+26.0)#3,776 |
| 30. | Grover | 42.9% | 11.4%(+31.5)#30 | 16.9%(+25.9)#3,808 |
| 31. | Lazy Acres | 42.6% | 11.4%(+31.3)#31 | 16.9%(+25.7)#3,852 |
| 32. | Fort Garland | 42.0% | 11.4%(+30.6)#32 | 16.9%(+25.0)#3,975 |
| 33. | Bethune | 40.2% | 11.4%(+28.9)#33 | 16.9%(+23.3)#4,264 |
| 34. | La Junta | 40.2% | 11.4%(+28.9)#34 | 16.9%(+23.3)#4,269 |
| 35. | Walsenburg | 39.4% | 11.4%(+28.0)#35 | 16.9%(+22.5)#4,434 |
| 36. | Cedaredge | 38.5% | 11.4%(+27.1)#36 | 16.9%(+21.5)#4,603 |
| 37. | Blende | 38.4% | 11.4%(+27.0)#37 | 16.9%(+21.4)#4,636 |
| 38. | Olathe | 38.0% | 11.4%(+26.6)#38 | 16.9%(+21.0)#4,714 |
| 39. | Haxtun | 37.6% | 11.4%(+26.3)#39 | 16.9%(+20.7)#4,770 |
| 40. | Rye | 37.1% | 11.4%(+25.8)#40 | 16.9%(+20.2)#4,882 |
| 41. | Eckley | 35.1% | 11.4%(+23.7)#41 | 16.9%(+18.1)#5,330 |
| 42. | Yuma | 34.3% | 11.4%(+22.9)#42 | 16.9%(+17.4)#5,505 |
| 43. | Federal Heights | 32.5% | 11.4%(+21.2)#43 | 16.9%(+15.6)#5,955 |
| 44. | Delta | 32.3% | 11.4%(+20.9)#44 | 16.9%(+15.3)#6,030 |
| 45. | Dove Valley | 32.2% | 11.4%(+20.8)#45 | 16.9%(+15.2)#6,064 |
| 46. | Center | 32.1% | 11.4%(+20.8)#46 | 16.9%(+15.2)#6,073 |
| 47. | Julesburg | 31.6% | 11.4%(+20.2)#47 | 16.9%(+14.7)#6,200 |
| 48. | Hotchkiss | 31.5% | 11.4%(+20.1)#48 | 16.9%(+14.6)#6,232 |
| 49. | Alamosa East | 31.4% | 11.4%(+20.0)#49 | 16.9%(+14.4)#6,272 |
| 50. | Deer Trail | 30.7% | 11.4%(+19.3)#50 | 16.9%(+13.7)#6,487 |
| 51. | Olney Springs | 30.5% | 11.4%(+19.1)#51 | 16.9%(+13.5)#6,539 |
| 52. | Salida | 28.2% | 11.4%(+16.8)#52 | 16.9%(+11.3)#7,205 |
| 53. | Pueblo | 28.0% | 11.4%(+16.6)#53 | 16.9%(+11.0)#7,281 |
| 54. | Otis | 27.8% | 11.4%(+16.4)#54 | 16.9%(+10.8)#7,342 |
| 55. | Lamar | 27.6% | 11.4%(+16.3)#55 | 16.9%(+10.7)#7,386 |
| 56. | West Pleasant View | 27.4% | 11.4%(+16.1)#56 | 16.9%(+10.5)#7,470 |
| 57. | Garden City | 27.3% | 11.4%(+15.9)#57 | 16.9%(+10.3)#7,533 |
| 58. | Ignacio | 26.8% | 11.4%(+15.5)#58 | 16.9%(+9.88)#7,690 |
| 59. | Air Force Academy | 26.8% | 11.4%(+15.4)#59 | 16.9%(+9.81)#7,707 |
| 60. | Aetna Estates | 26.7% | 11.4%(+15.4)#60 | 16.9%(+9.77)#7,724 |
| 61. | Pagosa Springs | 26.5% | 11.4%(+15.1)#61 | 16.9%(+9.56)#7,804 |
| 62. | Holly | 26.4% | 11.4%(+15.1)#62 | 16.9%(+9.51)#7,834 |
| 63. | Orchard City | 26.4% | 11.4%(+15.1)#63 | 16.9%(+9.48)#7,840 |
| 64. | Trinidad | 26.1% | 11.4%(+14.8)#64 | 16.9%(+9.18)#7,950 |
| 65. | Rico | 25.7% | 11.4%(+14.4)#65 | 16.9%(+8.78)#8,115 |
| 66. | Kiowa | 25.6% | 11.4%(+14.3)#66 | 16.9%(+8.67)#8,148 |
| 67. | Kremmling | 25.4% | 11.4%(+14.0)#67 | 16.9%(+8.44)#8,214 |
| 68. | Gilcrest | 25.3% | 11.4%(+13.9)#68 | 16.9%(+8.34)#8,259 |
| 69. | Williamsburg | 25.2% | 11.4%(+13.9)#69 | 16.9%(+8.29)#8,272 |
| 70. | Ward | 25.0% | 11.4%(+13.6)#70 | 16.9%(+8.06)#8,398 |
| 71. | Rockvale | 24.8% | 11.4%(+13.4)#71 | 16.9%(+7.85)#8,443 |
| 72. | De Beque | 24.7% | 11.4%(+13.4)#72 | 16.9%(+7.80)#8,460 |
| 73. | Durango | 24.6% | 11.4%(+13.2)#73 | 16.9%(+7.63)#8,514 |
| 74. | Hooper | 24.4% | 11.4%(+13.0)#74 | 16.9%(+7.45)#8,573 |
| 75. | Romeo | 24.3% | 11.4%(+13.0)#75 | 16.9%(+7.39)#8,599 |
| 76. | Canon City | 24.2% | 11.4%(+12.8)#76 | 16.9%(+7.26)#8,649 |
| 77. | Nunn | 22.8% | 11.4%(+11.4)#77 | 16.9%(+5.85)#9,181 |
| 78. | Monte Vista | 22.7% | 11.4%(+11.4)#78 | 16.9%(+5.81)#9,196 |
| 79. | Arriba | 22.6% | 11.4%(+11.2)#79 | 16.9%(+5.64)#9,267 |
| 80. | Kersey | 22.4% | 11.4%(+11.0)#80 | 16.9%(+5.46)#9,334 |
| 81. | Aguilar | 21.9% | 11.4%(+10.5)#81 | 16.9%(+4.94)#9,550 |
| 82. | Calhan | 21.8% | 11.4%(+10.5)#82 | 16.9%(+4.88)#9,576 |
| 83. | Clifton | 21.5% | 11.4%(+10.1)#83 | 16.9%(+4.56)#9,697 |
| 84. | Sterling | 21.4% | 11.4%(+10.00)#84 | 16.9%(+4.41)#9,767 |
| 85. | Brush | 21.2% | 11.4%(+9.87)#85 | 16.9%(+4.28)#9,828 |
| 86. | Derby | 21.2% | 11.4%(+9.84)#86 | 16.9%(+4.26)#9,837 |
| 87. | Greeley | 21.2% | 11.4%(+9.82)#87 | 16.9%(+4.24)#9,845 |
| 88. | Sugar City | 20.8% | 11.4%(+9.48)#88 | 16.9%(+3.89)#9,983 |
| 89. | Gunnison | 20.7% | 11.4%(+9.36)#89 | 16.9%(+3.78)#10,037 |
| 90. | Rangely | 20.6% | 11.4%(+9.23)#90 | 16.9%(+3.65)#10,100 |
| 91. | Silverthorne | 20.6% | 11.4%(+9.20)#91 | 16.9%(+3.62)#10,116 |
| 92. | Berkley | 20.3% | 11.4%(+8.92)#92 | 16.9%(+3.34)#10,253 |
| 93. | Manassa | 20.2% | 11.4%(+8.83)#93 | 16.9%(+3.24)#10,295 |
| 94. | Hillrose | 20.0% | 11.4%(+8.64)#94 | 16.9%(+3.06)#10,382 |
| 95. | Hartman | 20.0% | 11.4%(+8.64)#95 | 16.9%(+3.06)#10,412 |
| 96. | Frisco | 19.8% | 11.4%(+8.44)#96 | 16.9%(+2.86)#10,488 |
| 97. | Nucla | 19.6% | 11.4%(+8.28)#97 | 16.9%(+2.70)#10,542 |
| 98. | Florence | 19.5% | 11.4%(+8.15)#98 | 16.9%(+2.57)#10,605 |
| 99. | Avondale | 19.3% | 11.4%(+7.95)#99 | 16.9%(+2.37)#10,698 |
| 100. | Boone | 19.2% | 11.4%(+7.87)#100 | 16.9%(+2.29)#10,730 |
Common Questions
What are the Top 10 Cities with the Highest Poverty Level Among Children Under the Age of 16 in Colorado?
Top 10 Cities with the Highest Poverty Level Among Children Under the Age of 16 in Colorado are:
#1
100.0%
#2
100.0%
#3
85.3%
#4
80.8%
#5
80.8%
#6
78.2%
#7
71.2%
#8
66.7%
#9
64.3%
#10
63.0%
What city has the Highest Poverty Level Among Children Under the Age of 16 in Colorado?
Kirk has the Highest Poverty Level Among Children Under the Age of 16 in Colorado with 100.0%.
What is the Poverty Level Among Children Under the Age of 16 in the State of Colorado?
Poverty Level Among Children Under the Age of 16 in Colorado is 11.4%.
What is the Poverty Level Among Children Under the Age of 16 in the United States?
Poverty Level Among Children Under the Age of 16 in the United States is 16.9%.