Cities with the Highest Poverty Level Among Children Under the Age of 16 in Kansas
RELATED REPORTS & OPTIONS
Highest Poverty | Child 0-16
Kansas
Compare Cities
Map of Cities with the Highest Poverty Level Among Children Under the Age of 16 in Kansas
0.0%
100.0%
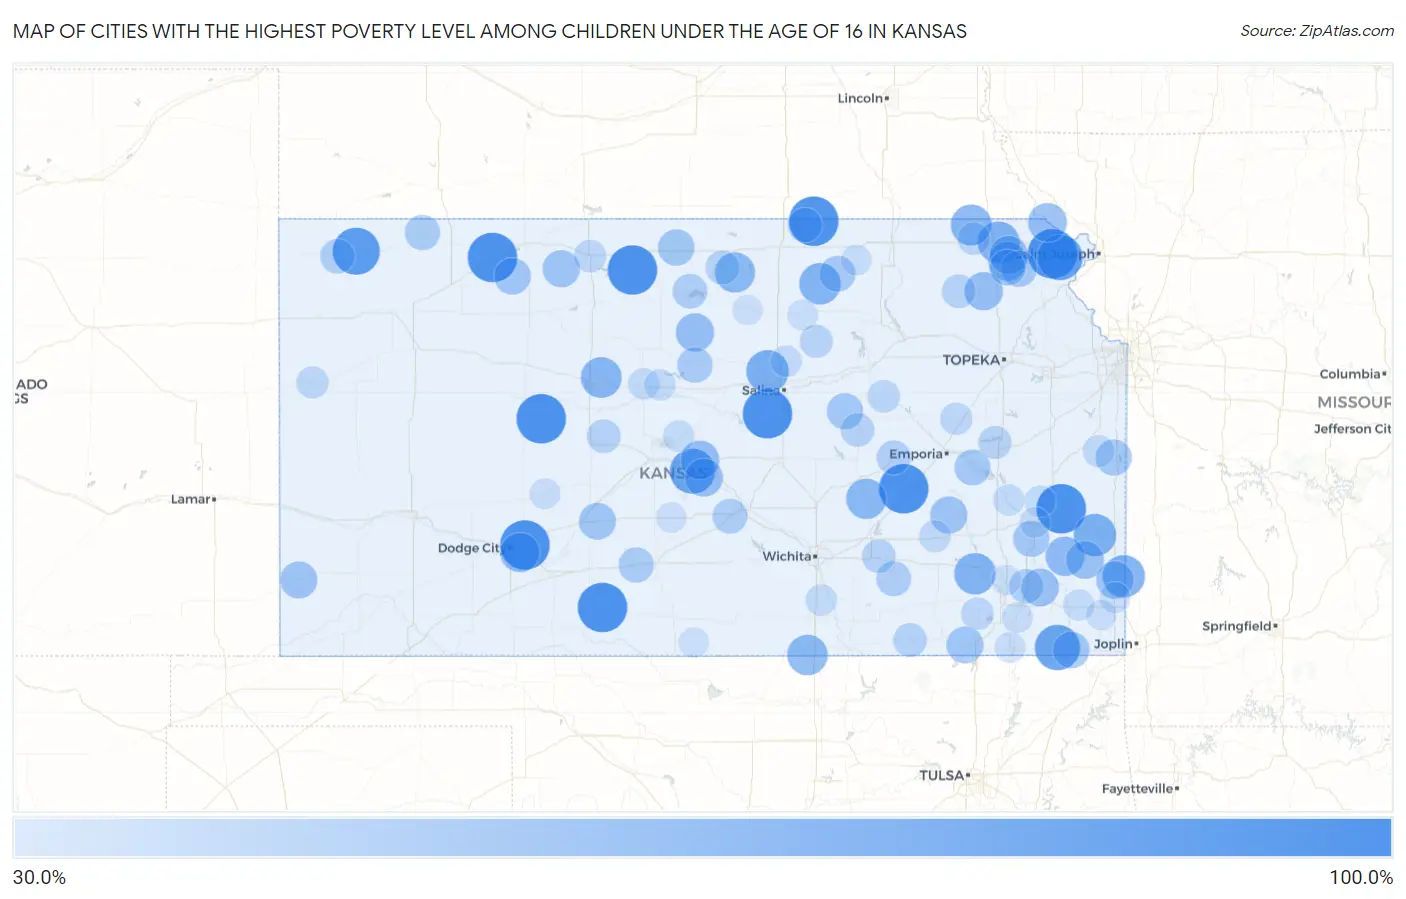
Cities with the Highest Poverty Level Among Children Under the Age of 16 in Kansas
| City | Child Poverty | vs State | vs National | |
| 1. | Falun | 100.0% | 14.1%(+85.9)#1 | 16.9%(+83.1)#281 |
| 2. | Wright | 100.0% | 14.1%(+85.9)#2 | 16.9%(+83.1)#349 |
| 3. | Clayton | 100.0% | 14.1%(+85.9)#3 | 16.9%(+83.1)#382 |
| 4. | Matfield Green | 100.0% | 14.1%(+85.9)#5 | 16.9%(+83.1)#423 |
| 5. | Shallow Water | 100.0% | 14.1%(+85.9)#6 | 16.9%(+83.1)#424 |
| 6. | Severance | 100.0% | 14.1%(+85.9)#7 | 16.9%(+83.1)#432 |
| 7. | Mahaska | 100.0% | 14.1%(+85.9)#8 | 16.9%(+83.1)#434 |
| 8. | Wilmore | 100.0% | 14.1%(+85.9)#9 | 16.9%(+83.1)#468 |
| 9. | Brownell | 100.0% | 14.1%(+85.9)#10 | 16.9%(+83.1)#489 |
| 10. | Cedar | 100.0% | 14.1%(+85.9)#11 | 16.9%(+83.1)#492 |
| 11. | Mildred | 100.0% | 14.1%(+85.9)#12 | 16.9%(+83.1)#493 |
| 12. | Mcdonald | 91.7% | 14.1%(+77.5)#13 | 16.9%(+74.7)#548 |
| 13. | Bendena | 85.2% | 14.1%(+71.0)#14 | 16.9%(+68.2)#703 |
| 14. | Bartlett | 85.0% | 14.1%(+70.9)#15 | 16.9%(+68.1)#710 |
| 15. | Raymond | 84.6% | 14.1%(+70.5)#16 | 16.9%(+67.7)#722 |
| 16. | Redfield | 75.0% | 14.1%(+60.9)#17 | 16.9%(+58.1)#1,024 |
| 17. | Culver | 75.0% | 14.1%(+60.9)#18 | 16.9%(+58.1)#1,027 |
| 18. | Mulberry | 74.6% | 14.1%(+60.5)#19 | 16.9%(+57.7)#1,036 |
| 19. | Fairview | 73.5% | 14.1%(+59.3)#20 | 16.9%(+56.5)#1,085 |
| 20. | Vining | 71.4% | 14.1%(+57.3)#21 | 16.9%(+54.5)#1,178 |
| 21. | New Albany | 71.4% | 14.1%(+57.3)#22 | 16.9%(+54.5)#1,180 |
| 22. | Bern | 69.2% | 14.1%(+55.1)#23 | 16.9%(+52.3)#1,286 |
| 23. | Catharine | 69.1% | 14.1%(+55.0)#24 | 16.9%(+52.2)#1,292 |
| 24. | Hunnewell | 68.0% | 14.1%(+53.9)#25 | 16.9%(+51.1)#1,343 |
| 25. | Burns | 67.2% | 14.1%(+53.0)#26 | 16.9%(+50.2)#1,379 |
| 26. | Randall | 67.1% | 14.1%(+53.0)#27 | 16.9%(+50.2)#1,384 |
| 27. | Wilroads Gardens | 64.4% | 14.1%(+50.2)#28 | 16.9%(+47.4)#1,543 |
| 28. | Stark | 63.6% | 14.1%(+49.5)#29 | 16.9%(+46.7)#1,591 |
| 29. | White Cloud | 62.5% | 14.1%(+48.4)#30 | 16.9%(+45.6)#1,667 |
| 30. | Kickapoo Site 1 | 62.5% | 14.1%(+48.4)#31 | 16.9%(+45.6)#1,669 |
| 31. | Chase | 61.7% | 14.1%(+47.6)#32 | 16.9%(+44.8)#1,720 |
| 32. | Circleville | 60.7% | 14.1%(+46.6)#33 | 16.9%(+43.8)#1,790 |
| 33. | Powhattan | 60.7% | 14.1%(+46.6)#34 | 16.9%(+43.8)#1,791 |
| 34. | Hunter | 60.6% | 14.1%(+46.5)#35 | 16.9%(+43.7)#1,799 |
| 35. | Alden | 60.0% | 14.1%(+45.9)#36 | 16.9%(+43.1)#1,858 |
| 36. | Hepler | 59.1% | 14.1%(+45.0)#37 | 16.9%(+42.2)#1,934 |
| 37. | Galesburg | 58.3% | 14.1%(+44.2)#38 | 16.9%(+41.4)#1,997 |
| 38. | Franklin | 57.9% | 14.1%(+43.7)#39 | 16.9%(+40.9)#2,029 |
| 39. | Hamilton | 56.7% | 14.1%(+42.5)#40 | 16.9%(+39.7)#2,131 |
| 40. | Logan | 56.6% | 14.1%(+42.5)#41 | 16.9%(+39.7)#2,137 |
| 41. | Manter | 55.9% | 14.1%(+41.7)#42 | 16.9%(+38.9)#2,188 |
| 42. | Lewis | 55.8% | 14.1%(+41.6)#43 | 16.9%(+38.8)#2,199 |
| 43. | Niotaze | 55.6% | 14.1%(+41.4)#44 | 16.9%(+38.6)#2,220 |
| 44. | Lenora | 55.0% | 14.1%(+40.9)#45 | 16.9%(+38.1)#2,268 |
| 45. | Chetopa | 54.4% | 14.1%(+40.3)#46 | 16.9%(+37.5)#2,331 |
| 46. | Lebanon | 53.8% | 14.1%(+39.7)#47 | 16.9%(+36.9)#2,388 |
| 47. | Hope | 53.4% | 14.1%(+39.3)#48 | 16.9%(+36.5)#2,405 |
| 48. | Humboldt | 53.3% | 14.1%(+39.2)#49 | 16.9%(+36.4)#2,421 |
| 49. | Horton | 53.1% | 14.1%(+39.0)#50 | 16.9%(+36.2)#2,439 |
| 50. | Linn Valley | 53.1% | 14.1%(+38.9)#51 | 16.9%(+36.1)#2,444 |
| 51. | Palmer | 52.2% | 14.1%(+38.0)#52 | 16.9%(+35.2)#2,535 |
| 52. | Kickapoo Tribal Center | 52.2% | 14.1%(+38.0)#53 | 16.9%(+35.2)#2,536 |
| 53. | Hartford | 51.8% | 14.1%(+37.7)#54 | 16.9%(+34.9)#2,578 |
| 54. | Sylvan Grove | 50.7% | 14.1%(+36.6)#55 | 16.9%(+33.8)#2,694 |
| 55. | Navarre | 50.0% | 14.1%(+35.9)#56 | 16.9%(+33.1)#2,801 |
| 56. | Herndon | 50.0% | 14.1%(+35.9)#57 | 16.9%(+33.1)#2,807 |
| 57. | Cullison | 50.0% | 14.1%(+35.9)#58 | 16.9%(+33.1)#2,813 |
| 58. | Partridge | 48.7% | 14.1%(+34.6)#59 | 16.9%(+31.8)#2,936 |
| 59. | Latham | 48.5% | 14.1%(+34.3)#60 | 16.9%(+31.5)#2,966 |
| 60. | Cawker City | 48.0% | 14.1%(+33.9)#61 | 16.9%(+31.1)#3,018 |
| 61. | Bird City | 47.9% | 14.1%(+33.7)#62 | 16.9%(+30.9)#3,037 |
| 62. | Thayer | 47.5% | 14.1%(+33.3)#63 | 16.9%(+30.5)#3,092 |
| 63. | Narka | 47.4% | 14.1%(+33.2)#64 | 16.9%(+30.4)#3,108 |
| 64. | Elmdale | 46.2% | 14.1%(+32.0)#65 | 16.9%(+29.2)#3,300 |
| 65. | Jewell | 45.4% | 14.1%(+31.2)#66 | 16.9%(+28.4)#3,423 |
| 66. | Bison | 45.0% | 14.1%(+30.9)#67 | 16.9%(+28.1)#3,473 |
| 67. | Cedar Vale | 44.9% | 14.1%(+30.7)#68 | 16.9%(+27.9)#3,496 |
| 68. | Leon | 44.6% | 14.1%(+30.4)#69 | 16.9%(+27.6)#3,540 |
| 69. | Havensville | 44.4% | 14.1%(+30.3)#70 | 16.9%(+27.5)#3,560 |
| 70. | Lost Springs | 44.4% | 14.1%(+30.3)#71 | 16.9%(+27.5)#3,571 |
| 71. | Olivet | 42.9% | 14.1%(+28.7)#72 | 16.9%(+25.9)#3,816 |
| 72. | Longford | 42.9% | 14.1%(+28.7)#73 | 16.9%(+25.9)#3,819 |
| 73. | Phillipsburg | 41.1% | 14.1%(+27.0)#74 | 16.9%(+24.2)#4,116 |
| 74. | White City | 41.0% | 14.1%(+26.8)#75 | 16.9%(+24.0)#4,145 |
| 75. | Oneida | 40.9% | 14.1%(+26.8)#76 | 16.9%(+24.0)#4,155 |
| 76. | Elk City | 40.5% | 14.1%(+26.3)#77 | 16.9%(+23.5)#4,225 |
| 77. | Admire | 40.0% | 14.1%(+25.9)#78 | 16.9%(+23.1)#4,316 |
| 78. | Sharon Springs | 39.7% | 14.1%(+25.6)#79 | 16.9%(+22.8)#4,380 |
| 79. | Fontana | 38.9% | 14.1%(+24.8)#80 | 16.9%(+21.9)#4,539 |
| 80. | Eureka | 38.7% | 14.1%(+24.6)#81 | 16.9%(+21.8)#4,566 |
| 81. | Claflin | 37.5% | 14.1%(+23.4)#82 | 16.9%(+20.6)#4,796 |
| 82. | Colony | 37.5% | 14.1%(+23.4)#83 | 16.9%(+20.6)#4,799 |
| 83. | Bennington | 37.3% | 14.1%(+23.1)#84 | 16.9%(+20.3)#4,851 |
| 84. | Belle Plaine | 37.2% | 14.1%(+23.1)#85 | 16.9%(+20.3)#4,865 |
| 85. | Russell | 37.0% | 14.1%(+22.8)#86 | 16.9%(+20.0)#4,925 |
| 86. | Bunker Hill | 36.8% | 14.1%(+22.7)#87 | 16.9%(+19.9)#4,943 |
| 87. | Leroy | 36.7% | 14.1%(+22.5)#88 | 16.9%(+19.7)#4,986 |
| 88. | Mccune | 36.5% | 14.1%(+22.4)#89 | 16.9%(+19.6)#5,015 |
| 89. | Pittsburg | 35.5% | 14.1%(+21.3)#90 | 16.9%(+18.5)#5,231 |
| 90. | Iola | 35.2% | 14.1%(+21.1)#91 | 16.9%(+18.3)#5,302 |
| 91. | Hanston | 34.9% | 14.1%(+20.8)#92 | 16.9%(+18.0)#5,360 |
| 92. | Greenleaf | 34.9% | 14.1%(+20.8)#93 | 16.9%(+18.0)#5,365 |
| 93. | Coffeyville | 34.8% | 14.1%(+20.6)#94 | 16.9%(+17.8)#5,409 |
| 94. | Cherryvale | 34.7% | 14.1%(+20.6)#95 | 16.9%(+17.8)#5,411 |
| 95. | Miltonvale | 34.2% | 14.1%(+20.1)#96 | 16.9%(+17.3)#5,527 |
| 96. | Scammon | 33.8% | 14.1%(+19.7)#97 | 16.9%(+16.9)#5,629 |
| 97. | Stafford | 33.7% | 14.1%(+19.6)#98 | 16.9%(+16.8)#5,649 |
| 98. | Hazelton | 33.3% | 14.1%(+19.2)#99 | 16.9%(+16.4)#5,778 |
| 99. | Simpson | 33.3% | 14.1%(+19.2)#100 | 16.9%(+16.4)#5,785 |
| 100. | Altoona | 32.9% | 14.1%(+18.7)#101 | 16.9%(+15.9)#5,884 |
Common Questions
What are the Top 10 Cities with the Highest Poverty Level Among Children Under the Age of 16 in Kansas?
Top 10 Cities with the Highest Poverty Level Among Children Under the Age of 16 in Kansas are:
What city has the Highest Poverty Level Among Children Under the Age of 16 in Kansas?
Falun has the Highest Poverty Level Among Children Under the Age of 16 in Kansas with 100.0%.
What is the Poverty Level Among Children Under the Age of 16 in the State of Kansas?
Poverty Level Among Children Under the Age of 16 in Kansas is 14.1%.
What is the Poverty Level Among Children Under the Age of 16 in the United States?
Poverty Level Among Children Under the Age of 16 in the United States is 16.9%.