Cities with the Highest Poverty Level Among Children Under the Age of 16 in Virginia
RELATED REPORTS & OPTIONS
Highest Poverty | Child 0-16
Virginia
Compare Cities
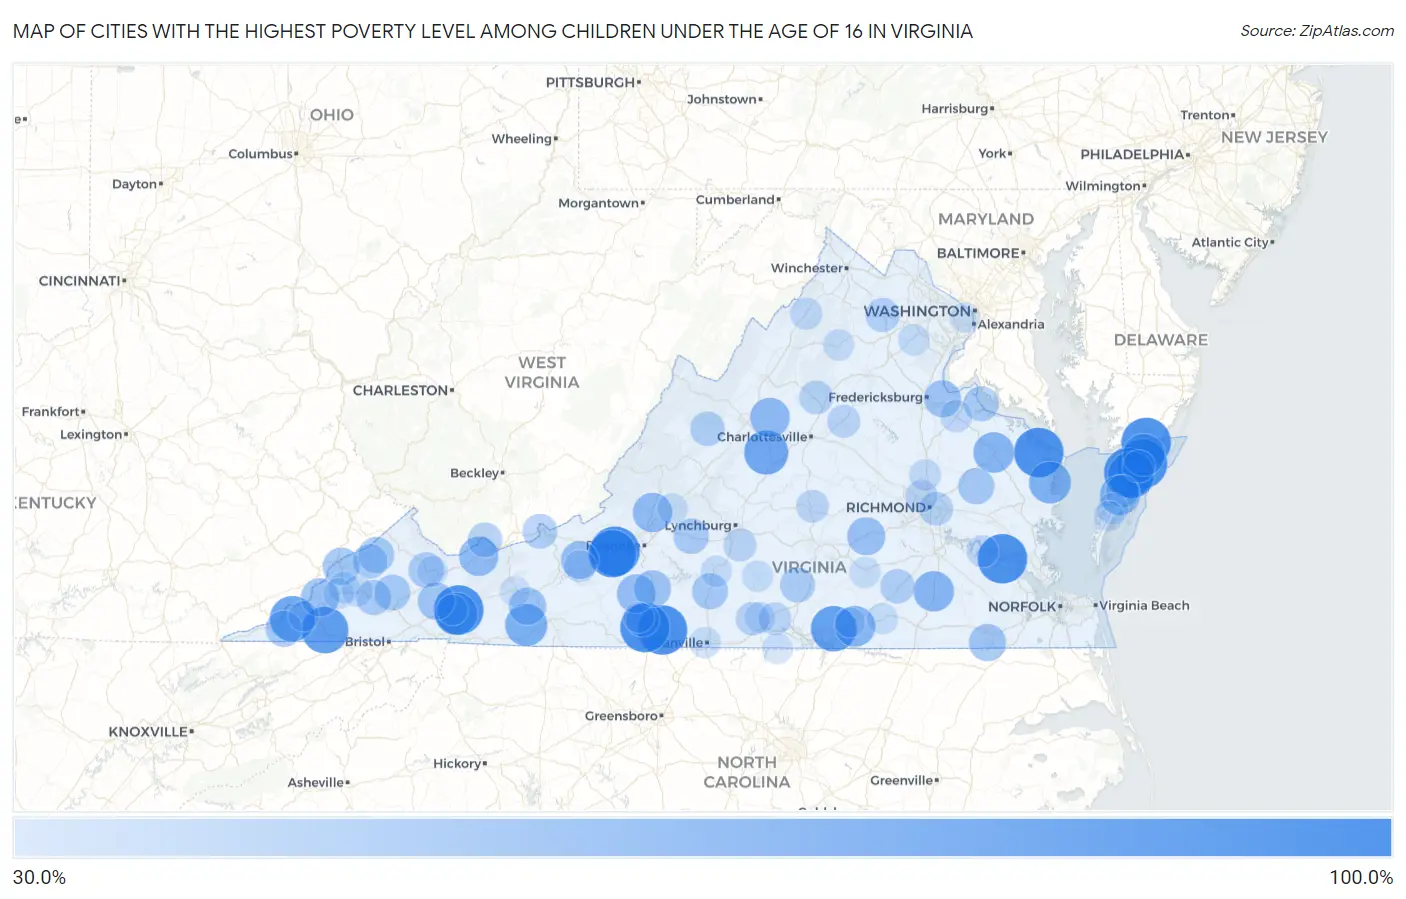
Map of Cities with the Highest Poverty Level Among Children Under the Age of 16 in Virginia
0.0%
100.0%
Cities with the Highest Poverty Level Among Children Under the Age of 16 in Virginia
| City | Child Poverty | vs State | vs National | |
| 1. | Chatmoss | 100.0% | 12.9%(+87.1)#1 | 16.9%(+83.1)#21 |
| 2. | Fieldale | 100.0% | 12.9%(+87.1)#2 | 16.9%(+83.1)#48 |
| 3. | Barboursville | 100.0% | 12.9%(+87.1)#3 | 16.9%(+83.1)#58 |
| 4. | Lafayette | 100.0% | 12.9%(+87.1)#4 | 16.9%(+83.1)#72 |
| 5. | New Church | 100.0% | 12.9%(+87.1)#5 | 16.9%(+83.1)#90 |
| 6. | Mappsville | 100.0% | 12.9%(+87.1)#6 | 16.9%(+83.1)#96 |
| 7. | Mcmullin | 100.0% | 12.9%(+87.1)#7 | 16.9%(+83.1)#184 |
| 8. | Cliftondale Park | 100.0% | 12.9%(+87.1)#8 | 16.9%(+83.1)#222 |
| 9. | Big Rock | 100.0% | 12.9%(+87.1)#9 | 16.9%(+83.1)#254 |
| 10. | Heathsville | 100.0% | 12.9%(+87.1)#10 | 16.9%(+83.1)#299 |
| 11. | Scotland | 100.0% | 12.9%(+87.1)#11 | 16.9%(+83.1)#303 |
| 12. | Lee Mont | 100.0% | 12.9%(+87.1)#12 | 16.9%(+83.1)#327 |
| 13. | Osaka | 100.0% | 12.9%(+87.1)#13 | 16.9%(+83.1)#337 |
| 14. | Elliston | 93.4% | 12.9%(+80.5)#14 | 16.9%(+76.5)#528 |
| 15. | Clinchport | 90.5% | 12.9%(+77.5)#15 | 16.9%(+73.5)#572 |
| 16. | Chase Crossing | 90.2% | 12.9%(+77.3)#16 | 16.9%(+73.3)#575 |
| 17. | Moneta | 89.0% | 12.9%(+76.1)#17 | 16.9%(+72.0)#597 |
| 18. | Baskerville | 87.0% | 12.9%(+74.1)#18 | 16.9%(+70.1)#648 |
| 19. | Pennington Gap | 86.1% | 12.9%(+73.2)#19 | 16.9%(+69.2)#679 |
| 20. | Nellysford | 81.4% | 12.9%(+68.4)#20 | 16.9%(+64.4)#803 |
| 21. | Adwolf | 76.5% | 12.9%(+63.5)#21 | 16.9%(+59.5)#963 |
| 22. | Temperanceville | 75.0% | 12.9%(+62.1)#22 | 16.9%(+58.1)#1,016 |
| 23. | Fries | 74.7% | 12.9%(+61.8)#23 | 16.9%(+57.8)#1,032 |
| 24. | Kilmarnock | 74.1% | 12.9%(+61.2)#24 | 16.9%(+57.2)#1,054 |
| 25. | La Crosse | 69.9% | 12.9%(+57.0)#25 | 16.9%(+53.0)#1,249 |
| 26. | Tappahannock | 69.8% | 12.9%(+56.8)#26 | 16.9%(+52.8)#1,255 |
| 27. | Stony Creek | 69.5% | 12.9%(+56.6)#27 | 16.9%(+52.6)#1,267 |
| 28. | Keller | 68.3% | 12.9%(+55.4)#28 | 16.9%(+51.4)#1,332 |
| 29. | Stevens Creek | 68.0% | 12.9%(+55.1)#29 | 16.9%(+51.1)#1,342 |
| 30. | Crimora | 66.2% | 12.9%(+53.3)#30 | 16.9%(+49.3)#1,432 |
| 31. | Fincastle | 65.7% | 12.9%(+52.8)#31 | 16.9%(+48.8)#1,462 |
| 32. | Springville | 64.9% | 12.9%(+52.0)#32 | 16.9%(+48.0)#1,506 |
| 33. | Ferrum | 62.8% | 12.9%(+49.9)#33 | 16.9%(+45.9)#1,650 |
| 34. | Appalachia | 61.6% | 12.9%(+48.6)#34 | 16.9%(+44.6)#1,734 |
| 35. | Amelia Court House | 61.0% | 12.9%(+48.1)#35 | 16.9%(+44.1)#1,773 |
| 36. | Belview | 60.6% | 12.9%(+47.7)#36 | 16.9%(+43.7)#1,796 |
| 37. | Ivanhoe | 58.9% | 12.9%(+45.9)#37 | 16.9%(+41.9)#1,945 |
| 38. | Southampton Meadows | 58.4% | 12.9%(+45.5)#38 | 16.9%(+41.5)#1,981 |
| 39. | Henry Fork | 58.3% | 12.9%(+45.4)#39 | 16.9%(+41.4)#1,988 |
| 40. | Pound | 58.1% | 12.9%(+45.2)#40 | 16.9%(+41.2)#2,014 |
| 41. | Saltville | 58.0% | 12.9%(+45.1)#41 | 16.9%(+41.1)#2,019 |
| 42. | Passapatanzy | 57.9% | 12.9%(+45.0)#42 | 16.9%(+41.0)#2,022 |
| 43. | King William | 55.1% | 12.9%(+42.1)#43 | 16.9%(+38.1)#2,261 |
| 44. | Jonesville | 54.9% | 12.9%(+42.0)#44 | 16.9%(+38.0)#2,278 |
| 45. | Glen Wilton | 54.7% | 12.9%(+41.7)#45 | 16.9%(+37.7)#2,300 |
| 46. | Haysi | 54.5% | 12.9%(+41.6)#46 | 16.9%(+37.6)#2,310 |
| 47. | Gretna | 54.3% | 12.9%(+41.4)#47 | 16.9%(+37.4)#2,343 |
| 48. | Cleveland | 53.2% | 12.9%(+40.3)#48 | 16.9%(+36.3)#2,425 |
| 49. | Raven | 53.0% | 12.9%(+40.1)#49 | 16.9%(+36.0)#2,455 |
| 50. | Bedford | 52.7% | 12.9%(+39.8)#50 | 16.9%(+35.8)#2,482 |
| 51. | St Paul | 52.1% | 12.9%(+39.1)#51 | 16.9%(+35.1)#2,549 |
| 52. | Colonial Beach | 51.7% | 12.9%(+38.7)#52 | 16.9%(+34.7)#2,590 |
| 53. | Drakes Branch | 50.9% | 12.9%(+38.0)#53 | 16.9%(+34.0)#2,676 |
| 54. | Clinchco | 50.0% | 12.9%(+37.1)#54 | 16.9%(+33.1)#2,771 |
| 55. | Stickleyville | 50.0% | 12.9%(+37.1)#55 | 16.9%(+33.1)#2,791 |
| 56. | Pocahontas | 50.0% | 12.9%(+37.1)#56 | 16.9%(+33.1)#2,796 |
| 57. | Glen Lyn | 50.0% | 12.9%(+37.1)#57 | 16.9%(+33.1)#2,816 |
| 58. | Craigsville | 49.7% | 12.9%(+36.8)#58 | 16.9%(+32.8)#2,846 |
| 59. | Mckenney | 49.6% | 12.9%(+36.7)#59 | 16.9%(+32.7)#2,852 |
| 60. | Marshall | 48.4% | 12.9%(+35.5)#60 | 16.9%(+31.5)#2,971 |
| 61. | Stanardsville | 47.1% | 12.9%(+34.2)#61 | 16.9%(+30.2)#3,139 |
| 62. | Montrose | 46.7% | 12.9%(+33.8)#62 | 16.9%(+29.8)#3,196 |
| 63. | Mountain Road | 45.9% | 12.9%(+33.0)#63 | 16.9%(+29.0)#3,338 |
| 64. | Stanleytown | 45.1% | 12.9%(+32.2)#64 | 16.9%(+28.1)#3,454 |
| 65. | Rustburg | 44.8% | 12.9%(+31.9)#65 | 16.9%(+27.8)#3,507 |
| 66. | Gordonsville | 44.7% | 12.9%(+31.8)#66 | 16.9%(+27.8)#3,512 |
| 67. | Melfa | 44.7% | 12.9%(+31.8)#67 | 16.9%(+27.8)#3,515 |
| 68. | Dillwyn | 44.1% | 12.9%(+31.1)#68 | 16.9%(+27.1)#3,611 |
| 69. | Scottsburg | 43.9% | 12.9%(+31.0)#69 | 16.9%(+27.0)#3,630 |
| 70. | Dumbarton | 42.8% | 12.9%(+29.9)#70 | 16.9%(+25.8)#3,827 |
| 71. | Nelsonia | 42.4% | 12.9%(+29.5)#71 | 16.9%(+25.5)#3,882 |
| 72. | Port Royal | 42.4% | 12.9%(+29.5)#72 | 16.9%(+25.5)#3,884 |
| 73. | Woodstock | 41.9% | 12.9%(+29.0)#73 | 16.9%(+25.0)#3,983 |
| 74. | Claremont | 41.7% | 12.9%(+28.7)#74 | 16.9%(+24.7)#4,017 |
| 75. | Plum Creek | 41.4% | 12.9%(+28.5)#75 | 16.9%(+24.5)#4,064 |
| 76. | Rio | 40.8% | 12.9%(+27.9)#76 | 16.9%(+23.9)#4,167 |
| 77. | Ashland | 40.7% | 12.9%(+27.8)#77 | 16.9%(+23.8)#4,189 |
| 78. | Hurt | 39.4% | 12.9%(+26.5)#78 | 16.9%(+22.5)#4,436 |
| 79. | Brookneal | 39.2% | 12.9%(+26.2)#79 | 16.9%(+22.2)#4,484 |
| 80. | Danville | 39.1% | 12.9%(+26.2)#80 | 16.9%(+22.2)#4,491 |
| 81. | Wise | 39.1% | 12.9%(+26.2)#81 | 16.9%(+22.2)#4,500 |
| 82. | Nokesville | 39.1% | 12.9%(+26.2)#82 | 16.9%(+22.2)#4,502 |
| 83. | Sperryville | 39.1% | 12.9%(+26.1)#83 | 16.9%(+22.1)#4,506 |
| 84. | Exmore | 39.0% | 12.9%(+26.0)#84 | 16.9%(+22.0)#4,526 |
| 85. | Blackstone | 38.9% | 12.9%(+26.0)#85 | 16.9%(+22.0)#4,528 |
| 86. | Halifax | 38.7% | 12.9%(+25.8)#86 | 16.9%(+21.8)#4,564 |
| 87. | Lawrenceville | 38.7% | 12.9%(+25.7)#87 | 16.9%(+21.7)#4,575 |
| 88. | Norton | 38.3% | 12.9%(+25.4)#88 | 16.9%(+21.4)#4,653 |
| 89. | Coeburn | 37.6% | 12.9%(+24.6)#89 | 16.9%(+20.6)#4,779 |
| 90. | Richlands | 37.5% | 12.9%(+24.6)#90 | 16.9%(+20.6)#4,790 |
| 91. | Buchanan | 37.3% | 12.9%(+24.4)#91 | 16.9%(+20.4)#4,840 |
| 92. | Virgilina | 37.0% | 12.9%(+24.1)#92 | 16.9%(+20.1)#4,905 |
| 93. | Bassett | 36.7% | 12.9%(+23.7)#93 | 16.9%(+19.7)#4,983 |
| 94. | Seven Mile Ford | 36.7% | 12.9%(+23.7)#94 | 16.9%(+19.7)#4,984 |
| 95. | Bailey S Crossroads | 36.5% | 12.9%(+23.6)#95 | 16.9%(+19.6)#5,024 |
| 96. | Wytheville | 36.5% | 12.9%(+23.6)#96 | 16.9%(+19.6)#5,025 |
| 97. | Dryden | 36.3% | 12.9%(+23.4)#97 | 16.9%(+19.4)#5,070 |
| 98. | Innovation | 36.0% | 12.9%(+23.1)#98 | 16.9%(+19.1)#5,107 |
| 99. | Nassawadox | 36.0% | 12.9%(+23.1)#99 | 16.9%(+19.1)#5,111 |
| 100. | South Hill | 35.2% | 12.9%(+22.2)#100 | 16.9%(+18.2)#5,310 |
Common Questions
What are the Top 10 Cities with the Highest Poverty Level Among Children Under the Age of 16 in Virginia?
Top 10 Cities with the Highest Poverty Level Among Children Under the Age of 16 in Virginia are:
#1
100.0%
#2
100.0%
#3
100.0%
#4
100.0%
#5
100.0%
#6
100.0%
#7
100.0%
#8
100.0%
#9
100.0%
#10
93.4%
What city has the Highest Poverty Level Among Children Under the Age of 16 in Virginia?
Chatmoss has the Highest Poverty Level Among Children Under the Age of 16 in Virginia with 100.0%.
What is the Poverty Level Among Children Under the Age of 16 in the State of Virginia?
Poverty Level Among Children Under the Age of 16 in Virginia is 12.9%.
What is the Poverty Level Among Children Under the Age of 16 in the United States?
Poverty Level Among Children Under the Age of 16 in the United States is 16.9%.