Cities with the Highest Poverty Level Among Children Under the Age of 16 in Maryland
RELATED REPORTS & OPTIONS
Highest Poverty | Child 0-16
Maryland
Compare Cities
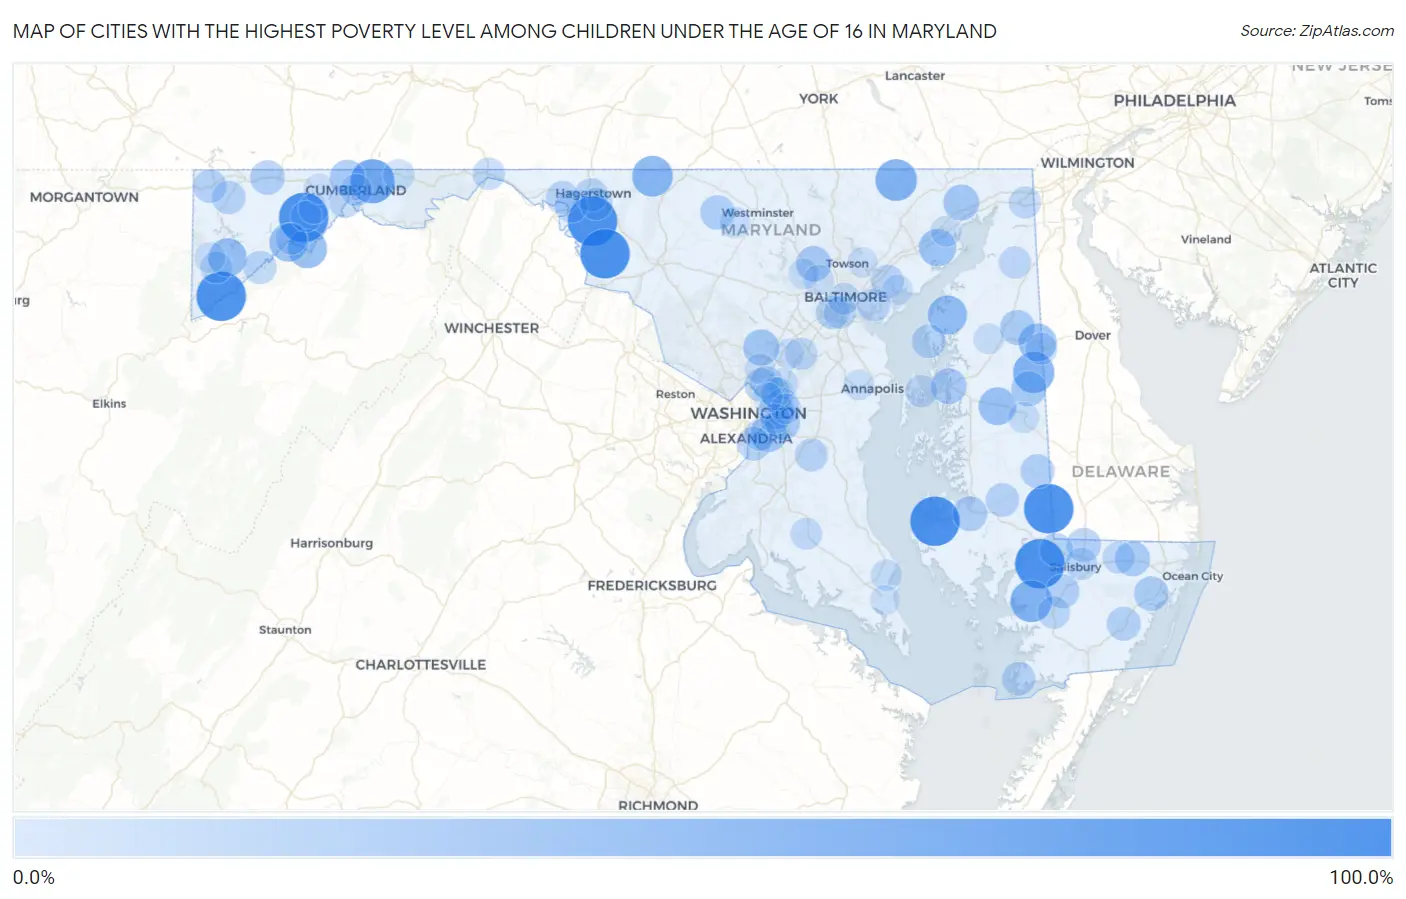
Map of Cities with the Highest Poverty Level Among Children Under the Age of 16 in Maryland
0.0%
100.0%
Cities with the Highest Poverty Level Among Children Under the Age of 16 in Maryland
| City | Child Poverty | vs State | vs National | |
| 1. | Gorman | 100.0% | 12.0%(+88.0)#1 | 16.9%(+83.1)#166 |
| 2. | Madison | 100.0% | 12.0%(+88.0)#2 | 16.9%(+83.1)#206 |
| 3. | Breathedsville | 100.0% | 12.0%(+88.0)#3 | 16.9%(+83.1)#208 |
| 4. | Rohrersville | 100.0% | 12.0%(+88.0)#4 | 16.9%(+83.1)#215 |
| 5. | Quantico | 100.0% | 12.0%(+88.0)#5 | 16.9%(+83.1)#241 |
| 6. | Detmold | 100.0% | 12.0%(+88.0)#6 | 16.9%(+83.1)#340 |
| 7. | Galestown | 100.0% | 12.0%(+88.0)#7 | 16.9%(+83.1)#386 |
| 8. | Pleasant Grove | 76.9% | 12.0%(+65.0)#8 | 16.9%(+60.0)#947 |
| 9. | Ten Mile Creek | 73.2% | 12.0%(+61.2)#9 | 16.9%(+56.3)#1,094 |
| 10. | Mount Vernon | 66.0% | 12.0%(+54.1)#10 | 16.9%(+49.1)#1,447 |
| 11. | Pylesville | 66.0% | 12.0%(+54.1)#11 | 16.9%(+49.1)#1,448 |
| 12. | Goldsboro | 64.9% | 12.0%(+53.0)#12 | 16.9%(+48.0)#1,505 |
| 13. | Sabillasville | 62.5% | 12.0%(+50.5)#13 | 16.9%(+45.6)#1,663 |
| 14. | Fairlee | 55.4% | 12.0%(+43.5)#14 | 16.9%(+38.5)#2,233 |
| 15. | Mccoole | 55.2% | 12.0%(+43.2)#15 | 16.9%(+38.2)#2,249 |
| 16. | Luke | 52.9% | 12.0%(+41.0)#16 | 16.9%(+36.0)#2,461 |
| 17. | Deer Park | 52.5% | 12.0%(+40.5)#17 | 16.9%(+35.6)#2,499 |
| 18. | Templeville | 50.6% | 12.0%(+38.7)#18 | 16.9%(+33.7)#2,697 |
| 19. | Hillsboro | 50.0% | 12.0%(+38.0)#19 | 16.9%(+33.1)#2,798 |
| 20. | Perryman | 47.7% | 12.0%(+35.8)#20 | 16.9%(+30.8)#3,049 |
| 21. | Marlow Heights | 44.7% | 12.0%(+32.7)#21 | 16.9%(+27.8)#3,516 |
| 22. | Spencerville | 43.1% | 12.0%(+31.2)#22 | 16.9%(+26.2)#3,750 |
| 23. | Port Deposit | 42.4% | 12.0%(+30.5)#23 | 16.9%(+25.5)#3,879 |
| 24. | Fairmount Heights | 42.2% | 12.0%(+30.2)#24 | 16.9%(+25.3)#3,933 |
| 25. | Queenstown | 40.9% | 12.0%(+28.9)#25 | 16.9%(+24.0)#4,153 |
| 26. | Garrison | 40.3% | 12.0%(+28.4)#26 | 16.9%(+23.4)#4,248 |
| 27. | Corriganville | 40.3% | 12.0%(+28.4)#27 | 16.9%(+23.4)#4,250 |
| 28. | District Heights | 39.2% | 12.0%(+27.2)#28 | 16.9%(+22.2)#4,478 |
| 29. | Greensboro | 38.4% | 12.0%(+26.4)#29 | 16.9%(+21.5)#4,626 |
| 30. | Willards | 38.3% | 12.0%(+26.4)#30 | 16.9%(+21.4)#4,649 |
| 31. | Sudlersville | 38.3% | 12.0%(+26.3)#31 | 16.9%(+21.3)#4,660 |
| 32. | Cambridge | 37.3% | 12.0%(+25.4)#32 | 16.9%(+20.4)#4,845 |
| 33. | Newark | 37.2% | 12.0%(+25.2)#33 | 16.9%(+20.3)#4,872 |
| 34. | Grantsville | 36.4% | 12.0%(+24.4)#34 | 16.9%(+19.5)#5,037 |
| 35. | Union Bridge | 36.2% | 12.0%(+24.2)#35 | 16.9%(+19.2)#5,087 |
| 36. | Delmar | 35.3% | 12.0%(+23.3)#36 | 16.9%(+18.3)#5,279 |
| 37. | Federalsburg | 34.3% | 12.0%(+22.4)#37 | 16.9%(+17.4)#5,494 |
| 38. | Eden | 34.2% | 12.0%(+22.2)#38 | 16.9%(+17.2)#5,541 |
| 39. | Snow Hill | 33.9% | 12.0%(+22.0)#39 | 16.9%(+17.0)#5,601 |
| 40. | Rock Hall | 33.5% | 12.0%(+21.6)#40 | 16.9%(+16.6)#5,683 |
| 41. | National Harbor | 33.3% | 12.0%(+21.4)#41 | 16.9%(+16.4)#5,708 |
| 42. | Hebron | 33.0% | 12.0%(+21.0)#42 | 16.9%(+16.0)#5,856 |
| 43. | East New Market | 32.7% | 12.0%(+20.8)#43 | 16.9%(+15.8)#5,910 |
| 44. | Crisfield | 32.3% | 12.0%(+20.3)#44 | 16.9%(+15.3)#6,018 |
| 45. | Langley Park | 32.1% | 12.0%(+20.1)#45 | 16.9%(+15.2)#6,076 |
| 46. | Accident | 32.1% | 12.0%(+20.1)#46 | 16.9%(+15.2)#6,080 |
| 47. | Friendsville | 32.0% | 12.0%(+20.0)#47 | 16.9%(+15.1)#6,101 |
| 48. | Lansdowne | 31.7% | 12.0%(+19.7)#48 | 16.9%(+14.8)#6,173 |
| 49. | Hagerstown | 31.5% | 12.0%(+19.5)#49 | 16.9%(+14.5)#6,238 |
| 50. | Kitzmiller | 31.2% | 12.0%(+19.3)#50 | 16.9%(+14.3)#6,318 |
| 51. | Middle River | 30.8% | 12.0%(+18.9)#51 | 16.9%(+13.9)#6,430 |
| 52. | Potomac Park | 30.8% | 12.0%(+18.8)#52 | 16.9%(+13.8)#6,447 |
| 53. | Dundalk | 30.6% | 12.0%(+18.6)#53 | 16.9%(+13.7)#6,506 |
| 54. | Croom | 30.4% | 12.0%(+18.5)#54 | 16.9%(+13.5)#6,551 |
| 55. | Pinesburg | 30.1% | 12.0%(+18.1)#55 | 16.9%(+13.1)#6,664 |
| 56. | Williamsport | 29.4% | 12.0%(+17.4)#56 | 16.9%(+12.4)#6,871 |
| 57. | Princess Anne | 28.6% | 12.0%(+16.6)#57 | 16.9%(+11.6)#7,070 |
| 58. | Funkstown | 28.6% | 12.0%(+16.6)#58 | 16.9%(+11.6)#7,075 |
| 59. | Adelphi | 28.5% | 12.0%(+16.5)#59 | 16.9%(+11.6)#7,118 |
| 60. | Hancock | 27.6% | 12.0%(+15.7)#60 | 16.9%(+10.7)#7,394 |
| 61. | East Riverdale | 27.6% | 12.0%(+15.6)#61 | 16.9%(+10.6)#7,419 |
| 62. | Baltimore Highlands | 27.5% | 12.0%(+15.5)#62 | 16.9%(+10.5)#7,457 |
| 63. | Pittsville | 27.1% | 12.0%(+15.1)#63 | 16.9%(+10.1)#7,591 |
| 64. | Cecilton | 27.0% | 12.0%(+15.0)#64 | 16.9%(+10.0)#7,638 |
| 65. | Salisbury | 27.0% | 12.0%(+15.0)#65 | 16.9%(+10.0)#7,644 |
| 66. | Chester | 26.9% | 12.0%(+14.9)#66 | 16.9%(+9.97)#7,659 |
| 67. | Maryland City | 26.9% | 12.0%(+14.9)#67 | 16.9%(+9.95)#7,662 |
| 68. | Elkton | 26.8% | 12.0%(+14.9)#68 | 16.9%(+9.90)#7,679 |
| 69. | Marydel | 26.3% | 12.0%(+14.3)#69 | 16.9%(+9.38)#7,887 |
| 70. | Loch Lynn Heights | 26.2% | 12.0%(+14.3)#70 | 16.9%(+9.29)#7,912 |
| 71. | Cumberland | 26.1% | 12.0%(+14.1)#71 | 16.9%(+9.15)#7,969 |
| 72. | Baltimore | 26.0% | 12.0%(+14.0)#72 | 16.9%(+9.08)#7,984 |
| 73. | Glassmanor | 25.9% | 12.0%(+13.9)#73 | 16.9%(+8.94)#8,039 |
| 74. | Westernport | 25.9% | 12.0%(+13.9)#74 | 16.9%(+8.92)#8,047 |
| 75. | Charlotte Hall | 25.0% | 12.0%(+13.0)#75 | 16.9%(+8.06)#8,331 |
| 76. | Flintstone | 24.2% | 12.0%(+12.2)#76 | 16.9%(+7.25)#8,654 |
| 77. | Greenbelt | 24.1% | 12.0%(+12.1)#77 | 16.9%(+7.15)#8,694 |
| 78. | Landover | 23.9% | 12.0%(+11.9)#78 | 16.9%(+6.93)#8,760 |
| 79. | Drum Point | 23.5% | 12.0%(+11.5)#79 | 16.9%(+6.57)#8,885 |
| 80. | New Windsor | 23.0% | 12.0%(+11.1)#80 | 16.9%(+6.09)#9,086 |
| 81. | Denton | 22.8% | 12.0%(+10.8)#81 | 16.9%(+5.81)#9,193 |
| 82. | Lonaconing | 22.0% | 12.0%(+10.0)#82 | 16.9%(+5.04)#9,506 |
| 83. | Oakland | 21.9% | 12.0%(+9.92)#83 | 16.9%(+4.95)#9,542 |
| 84. | Aberdeen | 21.5% | 12.0%(+9.52)#84 | 16.9%(+4.55)#9,703 |
| 85. | Woodlawn Cdp Baltimore County | 21.5% | 12.0%(+9.49)#85 | 16.9%(+4.52)#9,715 |
| 86. | Riverdale Park | 20.9% | 12.0%(+8.94)#86 | 16.9%(+3.97)#9,956 |
| 87. | Randallstown | 20.7% | 12.0%(+8.72)#87 | 16.9%(+3.75)#10,060 |
| 88. | Parole | 20.6% | 12.0%(+8.66)#88 | 16.9%(+3.69)#10,083 |
| 89. | Church Hill | 20.6% | 12.0%(+8.66)#89 | 16.9%(+3.68)#10,085 |
| 90. | Summerfield | 20.6% | 12.0%(+8.62)#90 | 16.9%(+3.65)#10,098 |
| 91. | Laurel | 20.2% | 12.0%(+8.26)#91 | 16.9%(+3.28)#10,279 |
| 92. | White Oak | 19.9% | 12.0%(+7.95)#92 | 16.9%(+2.98)#10,425 |
| 93. | Bowleys Quarters | 19.9% | 12.0%(+7.93)#93 | 16.9%(+2.96)#10,431 |
| 94. | Carney | 19.9% | 12.0%(+7.90)#94 | 16.9%(+2.93)#10,449 |
| 95. | Lochearn | 19.9% | 12.0%(+7.89)#95 | 16.9%(+2.92)#10,452 |
| 96. | Frostburg | 19.8% | 12.0%(+7.86)#96 | 16.9%(+2.89)#10,475 |
| 97. | Midland | 19.2% | 12.0%(+7.20)#97 | 16.9%(+2.23)#10,758 |
| 98. | Coral Hills | 18.8% | 12.0%(+6.87)#98 | 16.9%(+1.90)#10,911 |
| 99. | Lexington Park | 18.7% | 12.0%(+6.72)#99 | 16.9%(+1.75)#10,990 |
| 100. | Brentwood | 18.5% | 12.0%(+6.56)#100 | 16.9%(+1.59)#11,073 |
Common Questions
What are the Top 10 Cities with the Highest Poverty Level Among Children Under the Age of 16 in Maryland?
Top 10 Cities with the Highest Poverty Level Among Children Under the Age of 16 in Maryland are:
#1
100.0%
#2
100.0%
#3
100.0%
#4
100.0%
#5
100.0%
#6
100.0%
#7
100.0%
#8
76.9%
#9
66.0%
#10
66.0%
What city has the Highest Poverty Level Among Children Under the Age of 16 in Maryland?
Gorman has the Highest Poverty Level Among Children Under the Age of 16 in Maryland with 100.0%.
What is the Poverty Level Among Children Under the Age of 16 in the State of Maryland?
Poverty Level Among Children Under the Age of 16 in Maryland is 12.0%.
What is the Poverty Level Among Children Under the Age of 16 in the United States?
Poverty Level Among Children Under the Age of 16 in the United States is 16.9%.