Cities with the Highest Poverty Level Among Children Under the Age of 16 in South Dakota
RELATED REPORTS & OPTIONS
Highest Poverty | Child 0-16
South Dakota
Compare Cities
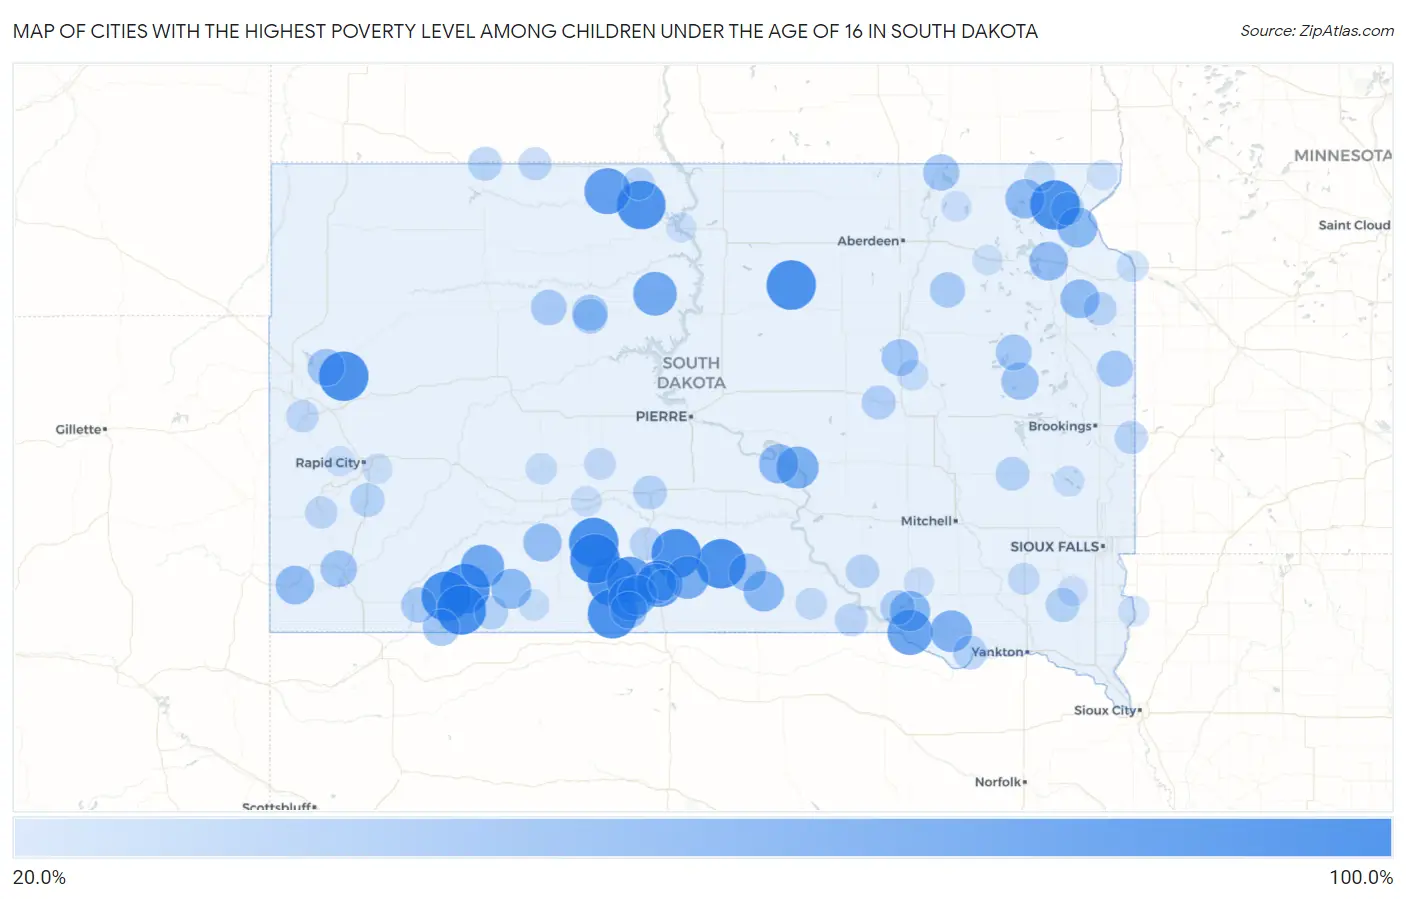
Map of Cities with the Highest Poverty Level Among Children Under the Age of 16 in South Dakota
0.0%
100.0%
Cities with the Highest Poverty Level Among Children Under the Age of 16 in South Dakota
| City | Child Poverty | vs State | vs National | |
| 1. | Porcupine | 100.0% | 15.6%(+84.4)#1 | 16.9%(+83.1)#27 |
| 2. | Manderson White Horse Creek | 100.0% | 15.6%(+84.4)#2 | 16.9%(+83.1)#62 |
| 3. | Parmelee | 100.0% | 15.6%(+84.4)#3 | 16.9%(+83.1)#99 |
| 4. | Wounded Knee | 100.0% | 15.6%(+84.4)#4 | 16.9%(+83.1)#116 |
| 5. | Long Hollow | 100.0% | 15.6%(+84.4)#5 | 16.9%(+83.1)#120 |
| 6. | Corn Creek | 100.0% | 15.6%(+84.4)#6 | 16.9%(+83.1)#237 |
| 7. | Swift Bird | 100.0% | 15.6%(+84.4)#7 | 16.9%(+83.1)#239 |
| 8. | Spring Creek | 100.0% | 15.6%(+84.4)#8 | 16.9%(+83.1)#259 |
| 9. | Norris | 100.0% | 15.6%(+84.4)#9 | 16.9%(+83.1)#263 |
| 10. | Vale | 100.0% | 15.6%(+84.4)#10 | 16.9%(+83.1)#355 |
| 11. | New Witten | 100.0% | 15.6%(+84.4)#11 | 16.9%(+83.1)#389 |
| 12. | Wood | 100.0% | 15.6%(+84.4)#12 | 16.9%(+83.1)#421 |
| 13. | Onaka | 100.0% | 15.6%(+84.4)#13 | 16.9%(+83.1)#483 |
| 14. | Little Eagle | 97.0% | 15.6%(+81.4)#14 | 16.9%(+80.1)#502 |
| 15. | Wakpala | 96.6% | 15.6%(+81.0)#15 | 16.9%(+79.7)#503 |
| 16. | Cherry Creek | 89.5% | 15.6%(+73.9)#16 | 16.9%(+72.5)#586 |
| 17. | Horse Creek | 89.0% | 15.6%(+73.4)#17 | 16.9%(+72.1)#596 |
| 18. | Soldier Creek | 88.9% | 15.6%(+73.3)#18 | 16.9%(+71.9)#599 |
| 19. | Antelope | 88.7% | 15.6%(+73.1)#19 | 16.9%(+71.7)#610 |
| 20. | Bridger | 88.6% | 15.6%(+73.0)#20 | 16.9%(+71.7)#612 |
| 21. | Bullhead | 86.5% | 15.6%(+70.9)#21 | 16.9%(+69.6)#667 |
| 22. | Marty | 82.4% | 15.6%(+66.7)#22 | 16.9%(+65.4)#772 |
| 23. | Enemy Swim | 81.8% | 15.6%(+66.2)#23 | 16.9%(+64.9)#782 |
| 24. | Clark Colony | 77.3% | 15.6%(+61.7)#24 | 16.9%(+60.3)#930 |
| 25. | La Plant | 77.2% | 15.6%(+61.5)#25 | 16.9%(+60.2)#936 |
| 26. | Kyle | 76.1% | 15.6%(+60.5)#26 | 16.9%(+59.2)#976 |
| 27. | Two Strike | 75.9% | 15.6%(+60.2)#27 | 16.9%(+58.9)#987 |
| 28. | Okreek | 73.3% | 15.6%(+57.7)#28 | 16.9%(+56.4)#1,091 |
| 29. | Fort Thompson | 70.7% | 15.6%(+55.1)#29 | 16.9%(+53.8)#1,209 |
| 30. | Avon | 69.4% | 15.6%(+53.8)#30 | 16.9%(+52.4)#1,275 |
| 31. | Colome | 64.1% | 15.6%(+48.5)#31 | 16.9%(+47.2)#1,562 |
| 32. | Mission | 64.0% | 15.6%(+48.3)#32 | 16.9%(+47.0)#1,566 |
| 33. | Ravinia | 63.6% | 15.6%(+48.0)#33 | 16.9%(+46.7)#1,592 |
| 34. | Peever | 62.5% | 15.6%(+46.9)#34 | 16.9%(+45.6)#1,666 |
| 35. | Allen | 62.4% | 15.6%(+46.8)#35 | 16.9%(+45.4)#1,682 |
| 36. | Rosebud | 62.4% | 15.6%(+46.7)#36 | 16.9%(+45.4)#1,683 |
| 37. | Lower Brule | 60.8% | 15.6%(+45.1)#37 | 16.9%(+43.8)#1,787 |
| 38. | Lake City | 60.0% | 15.6%(+44.4)#38 | 16.9%(+43.1)#1,864 |
| 39. | South Shore | 59.0% | 15.6%(+43.4)#39 | 16.9%(+42.0)#1,941 |
| 40. | Sicangu | 58.6% | 15.6%(+43.0)#40 | 16.9%(+41.7)#1,968 |
| 41. | Edgemont | 57.3% | 15.6%(+41.7)#41 | 16.9%(+40.4)#2,075 |
| 42. | Ortley | 57.1% | 15.6%(+41.5)#42 | 16.9%(+40.2)#2,101 |
| 43. | Wanblee | 56.5% | 15.6%(+40.9)#43 | 16.9%(+39.6)#2,142 |
| 44. | West Brule | 54.8% | 15.6%(+39.1)#44 | 16.9%(+37.8)#2,293 |
| 45. | Winner | 54.7% | 15.6%(+39.1)#45 | 16.9%(+37.8)#2,297 |
| 46. | Bryant | 52.0% | 15.6%(+36.4)#46 | 16.9%(+35.1)#2,555 |
| 47. | Nisland | 51.1% | 15.6%(+35.5)#47 | 16.9%(+34.2)#2,658 |
| 48. | St Francis | 50.9% | 15.6%(+35.2)#48 | 16.9%(+33.9)#2,679 |
| 49. | Pine Ridge | 50.1% | 15.6%(+34.5)#49 | 16.9%(+33.2)#2,738 |
| 50. | Hot Springs | 50.0% | 15.6%(+34.4)#50 | 16.9%(+33.1)#2,743 |
| 51. | Tulare | 50.0% | 15.6%(+34.4)#51 | 16.9%(+33.1)#2,793 |
| 52. | Peever Flats | 50.0% | 15.6%(+34.4)#52 | 16.9%(+33.1)#2,810 |
| 53. | Hecla | 48.5% | 15.6%(+32.9)#53 | 16.9%(+31.5)#2,964 |
| 54. | Brandt | 47.6% | 15.6%(+32.0)#54 | 16.9%(+30.7)#3,065 |
| 55. | Naples | 47.4% | 15.6%(+31.7)#55 | 16.9%(+30.4)#3,109 |
| 56. | North Eagle Butte | 46.8% | 15.6%(+31.1)#56 | 16.9%(+29.8)#3,190 |
| 57. | Dupree | 45.5% | 15.6%(+29.9)#57 | 16.9%(+28.6)#3,391 |
| 58. | Oglala | 44.7% | 15.6%(+29.1)#58 | 16.9%(+27.8)#3,511 |
| 59. | Conde | 44.4% | 15.6%(+28.8)#59 | 16.9%(+27.5)#3,566 |
| 60. | Lake Andes | 42.5% | 15.6%(+26.9)#60 | 16.9%(+25.6)#3,863 |
| 61. | Eagle Butte | 42.4% | 15.6%(+26.7)#61 | 16.9%(+25.4)#3,901 |
| 62. | Springfield | 39.7% | 15.6%(+24.1)#62 | 16.9%(+22.8)#4,378 |
| 63. | Wessington | 39.6% | 15.6%(+24.0)#63 | 16.9%(+22.7)#4,391 |
| 64. | Viborg | 39.5% | 15.6%(+23.9)#64 | 16.9%(+22.6)#4,419 |
| 65. | Hermosa | 39.4% | 15.6%(+23.8)#65 | 16.9%(+22.5)#4,429 |
| 66. | Murdo | 39.2% | 15.6%(+23.6)#66 | 16.9%(+22.3)#4,477 |
| 67. | Lemmon | 39.1% | 15.6%(+23.5)#67 | 16.9%(+22.2)#4,493 |
| 68. | Batesland | 38.9% | 15.6%(+23.3)#68 | 16.9%(+21.9)#4,543 |
| 69. | Howard | 38.7% | 15.6%(+23.1)#69 | 16.9%(+21.7)#4,573 |
| 70. | Sisseton | 37.3% | 15.6%(+21.6)#70 | 16.9%(+20.3)#4,856 |
| 71. | Platte | 37.2% | 15.6%(+21.6)#71 | 16.9%(+20.3)#4,862 |
| 72. | Strandburg | 36.8% | 15.6%(+21.2)#72 | 16.9%(+19.9)#4,944 |
| 73. | Elkton | 36.2% | 15.6%(+20.6)#73 | 16.9%(+19.3)#5,078 |
| 74. | Morristown | 35.7% | 15.6%(+20.1)#74 | 16.9%(+18.8)#5,182 |
| 75. | White River | 35.6% | 15.6%(+20.0)#75 | 16.9%(+18.6)#5,209 |
| 76. | Bonesteel | 35.0% | 15.6%(+19.4)#76 | 16.9%(+18.1)#5,345 |
| 77. | Custer | 33.8% | 15.6%(+18.1)#77 | 16.9%(+16.8)#5,647 |
| 78. | Central City | 33.3% | 15.6%(+17.7)#78 | 16.9%(+16.4)#5,773 |
| 79. | Ideal | 33.3% | 15.6%(+17.7)#79 | 16.9%(+16.4)#5,792 |
| 80. | Mclaughlin | 32.9% | 15.6%(+17.3)#80 | 16.9%(+16.0)#5,865 |
| 81. | Freeman | 31.6% | 15.6%(+16.0)#81 | 16.9%(+14.7)#6,202 |
| 82. | Midland | 31.6% | 15.6%(+16.0)#82 | 16.9%(+14.6)#6,212 |
| 83. | Burke | 31.5% | 15.6%(+15.9)#83 | 16.9%(+14.5)#6,237 |
| 84. | Philip | 30.6% | 15.6%(+15.0)#84 | 16.9%(+13.7)#6,503 |
| 85. | Big Stone City | 30.0% | 15.6%(+14.4)#85 | 16.9%(+13.1)#6,678 |
| 86. | Martin | 29.5% | 15.6%(+13.9)#86 | 16.9%(+12.5)#6,830 |
| 87. | White Horse | 29.3% | 15.6%(+13.7)#87 | 16.9%(+12.4)#6,877 |
| 88. | Hitchcock | 28.6% | 15.6%(+12.9)#88 | 16.9%(+11.6)#7,107 |
| 89. | Lake Madison | 28.4% | 15.6%(+12.7)#89 | 16.9%(+11.4)#7,148 |
| 90. | Hudson | 28.0% | 15.6%(+12.4)#90 | 16.9%(+11.1)#7,271 |
| 91. | Veblen | 27.6% | 15.6%(+12.0)#91 | 16.9%(+10.7)#7,402 |
| 92. | Belvidere | 27.3% | 15.6%(+11.7)#92 | 16.9%(+10.3)#7,541 |
| 93. | Claremont | 26.7% | 15.6%(+11.0)#93 | 16.9%(+9.73)#7,754 |
| 94. | Armour | 26.6% | 15.6%(+11.0)#94 | 16.9%(+9.68)#7,763 |
| 95. | Davis | 26.5% | 15.6%(+10.8)#95 | 16.9%(+9.53)#7,826 |
| 96. | Johnson Siding | 26.3% | 15.6%(+10.6)#96 | 16.9%(+9.31)#7,906 |
| 97. | Bristol | 26.1% | 15.6%(+10.5)#97 | 16.9%(+9.15)#7,965 |
| 98. | Green Valley | 26.1% | 15.6%(+10.4)#98 | 16.9%(+9.12)#7,974 |
| 99. | Rosholt | 25.3% | 15.6%(+9.69)#99 | 16.9%(+8.38)#8,244 |
| 100. | Mobridge | 25.2% | 15.6%(+9.58)#100 | 16.9%(+8.27)#8,279 |
Common Questions
What are the Top 10 Cities with the Highest Poverty Level Among Children Under the Age of 16 in South Dakota?
Top 10 Cities with the Highest Poverty Level Among Children Under the Age of 16 in South Dakota are:
#1
100.0%
#2
100.0%
#3
100.0%
#4
100.0%
#5
100.0%
#6
100.0%
#7
100.0%
#8
100.0%
#9
100.0%
#10
100.0%
What city has the Highest Poverty Level Among Children Under the Age of 16 in South Dakota?
Porcupine has the Highest Poverty Level Among Children Under the Age of 16 in South Dakota with 100.0%.
What is the Poverty Level Among Children Under the Age of 16 in the State of South Dakota?
Poverty Level Among Children Under the Age of 16 in South Dakota is 15.6%.
What is the Poverty Level Among Children Under the Age of 16 in the United States?
Poverty Level Among Children Under the Age of 16 in the United States is 16.9%.